Embed Size (px)
Citation preview
Transition-State Theory, Dynamics, and Narrow TimeScale Separation in the Rate-Promoting Vibrations Model
of Enzyme Catalysis
Baron Peters
Departments of Chemical Engineering and Chemistry and Biochemistry, UniVersity ofCalifornia, Santa Barbara, California 93106
Received January 26, 2010
Abstract: The power of transition-state theory (TST) for understanding enzymes is evidencedby its recent use in the design and synthesis of highly active de novo enzymes. However,dynamics can influence reaction kinetics, and some studies of rate-promoting vibrations evenclaim that dynamical theories instead of TST are needed to understand enzymatic reactionmechanisms. For the rate-promoting vibration (RPV) model of enzyme catalysis [Antoniou etal., J. Chem. Phys. 2004, 121, 6442], a reactive flux correlation function analysis shows thatdynamical effects do slow the kinetics. However, the RPV model also shows extremely long-lived correlations because the RPV and the bath are not directly coupled. Additionally, earlierstudies of the RPV model show a narrow time scale separation due to a small 5kT barrier. Thusearlier findings based on the RPV model may have little bearing on the properties of realenzymes. The intrinsic reaction coordinate (IRC) reveals that the RPV is an important componentof the reaction coordinate at early and late stages of the pathway, but the RPV is not an importantcomponent of the reaction coordinate direction at the transition state. The unstable eigenmodefrom harmonic TST (which coincides with the IRC at the saddle point) gives a larger transmissioncoefficient than the coordinate used in the correlation functions of Antoniou et al. Thus whileTST cannot predict the transmission coefficient, the RPV model suggests that TST can providemechanistic insights on elementary steps in enzyme catalysis. Finally, we propose a methodfor using the transition-state ensemble as predicted from harmonic TST to distinguish promotingvibrations from other more mundane bath variables.
Introduction
Enzymes are remarkably active and selective catalysts.1–3
Their catalytic activity at room temperature and mild pHprovide exciting alternatives to processes using comparativelyharsh conditions.4 Because enzymes catalyze elementaryreactions that break and make bonds much stronger than kT,many investigators use harmonic transition-state theory(TST),5–8 variational TST,9,10 and related theories11–14 toanalyze enzymatic catalysis mechanisms. These theoriesquantify how the enzyme enhances the rate by lowering anactivation barrier through electrostatic,15,16 covalent,17 orother factors18–21 that influence the thermodynamics. Mixedquantum mechanics/molecular mechanics (QM/MM)14,15,22,23
calculations and empirical valence bond (EVB) models24 are
frequently combined with TST to understand these importantaspects of enzymatic reaction mechanisms. Tunneling is alsoimportant for enzymatic reactions that involve proton orhydrogen transfer.7,21,25–30 These methods and theories showextraordinary predictive abilities.31,32 For a striking example,these approaches have recently been used to create highlyactive de noVo enzymes.33,34
For some activated processes, dynamical effects are alsoimportant.35–41 For many bond-making and -breaking reac-tions, these effects can be treated as secondary correctionsto the TST rate.32,42–44 However, some recent computationalstudies note problems with TST45 and suggest that dynamicaltheories are essential for understanding enzymatic reactionmechanisms.46–49 Of particular interest in this work is the
J. Chem. Theory Comput. 2010, 6, 1447–1454 1447
10.1021/ct100051a 2010 American Chemical SocietyPublished on Web 04/09/2010
rate-promoting vibrations (RPV) model of enzyme cataly-sis.46 This paper highlights some surprising new findings ondynamics of barrier crossing in the RPV model. We findthat parameters used in previous implementations46 give onlya narrow time scale separation and long-lived correlationsin the dynamics of the rate-promoting mode. We provideevidence that a lack of direct coupling between the bath andthe rate-promoting mode can lead to energy diffusionlimitations5 that may not resemble dynamics in real enzymes.We also compare the unstable eigenmode coordinate fromharmonic TST to the reaction coordinates investigated byAntoniou and Schwartz. Our results confirm that TST canbe used to understand enzymatic reaction mechanisms thatinvolve promoting vibrations, but perhaps not to the extentwhich dynamical effects will reduce the rate constant. Weconclude by suggesting a simple procedure to identifypromoting variables using only the information that isavailable from a TST analysis.
Dynamics in the Rate-Promoting VibrationsModel
The rate-promoting vibrations (RPV) model of enzymecatalysis21,46 includes two key variables, s and Q. Qrepresents donor-acceptor distance, and s corresponds tothe position of a proton along the path between donor andacceptor. Figure 1 depicts a mechanical model of the donorand acceptor atoms in the RPV model. The model potentialas a function of s and Q includes a quartic bistable barrierof height V0, a harmonic “promoting vibration” coordinateQ with frequency ωQ, a term that couples s and Q, and abilinear coupling between s and bath modes q:
The harmonic bath has a Debye frequency distribution.46
The minima of V are at (s, Q) ) ((1, 0) regardless of ωQ,but the saddle point (s*, Q*) ) (0, c/mQωQ
2) shifts to higherQ values as ωQ decreases.
Antoniou et al.46 used transition-path sampling (TPS)50–52
to study the RPV model. Their path ensemble includes onlythose 4 ps trajectories that spend the first 1 ps and last 2 psentirely within the reactant and product basins, respectively.46
Antoniou et al. report a dynamical rate-promoting effect thatdepends nonmonotonically on ωQ.46 The parameters usedby Antoniou et al. were V0 ) 6 kcal/mol, c ) (V0mQωQ
2)1/2,
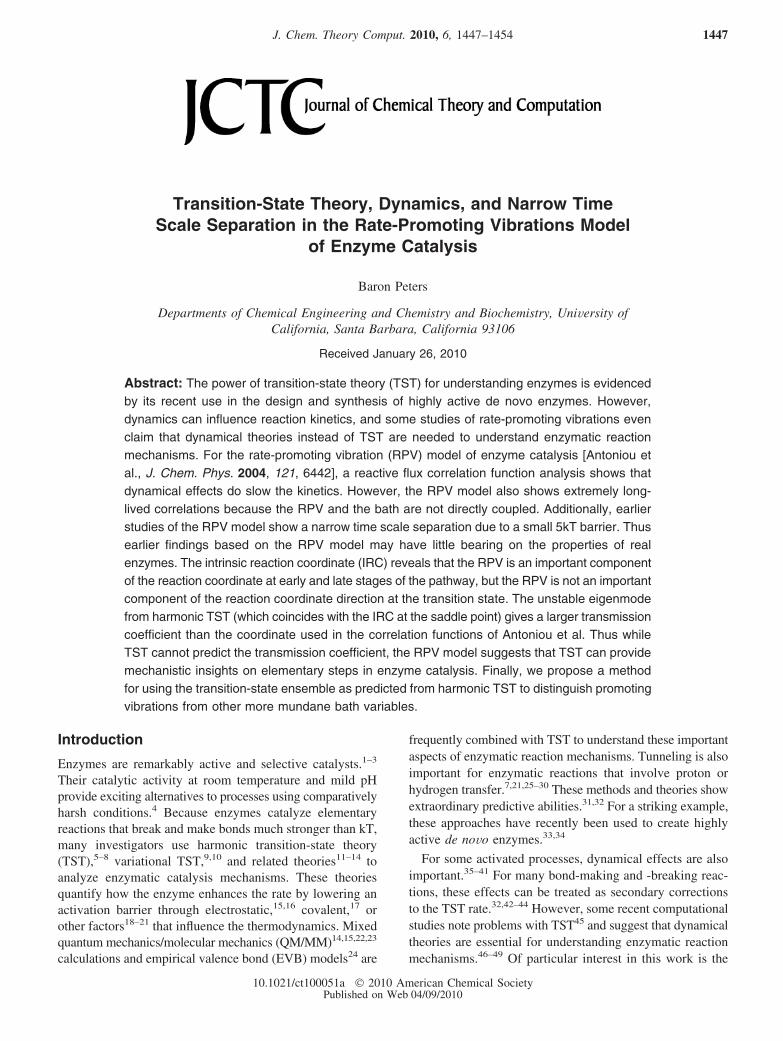
T ) 300 K, mQ ) 12 amu, and mS ) 1 amu.46 Theyinvestigated promoting vibrational frequencies of ωQ ) 100,300, and 900 cm-1. Their parameters give a saddle point atV0/2 above the two minima regardless of ωQ. Their saddleis thus only 5kT above the minima, pushing the limits ofthe minimal time scale separation that is required for defininga rate constant.5 Here, we also report new results for themodel using a higher 8kT barrier by setting V0 ) 9.6 kcal/mol. The masses associated with bath modes were notspecified in the original study, but following the conventionin later work by Antoniou and Schwartz,53 we set all bathmasses equal to the mass of the promoting vibration. Ouranalysis of the dynamics is based on the correlationfunction:37
where hA(t) ) 1 if s(t) > 0 and hA(t) ) 0, otherwise, hB(t) )1 if s(t) < 0 and hB(t) ) 0 otherwise, and xA ) <hA(t)>. Foreach condition (six total from two barrier heights and threefrequencies), we computed the correlation functions from asingle 200 ns trajectory. Figure 2 shows the correlationfunction C(t).
The derivative dC/dt should decay from the TST rateconstant to a plateau at the dynamically correct rate constantafter a short a molecular relaxation time.37 The lack of aplateau indicates a narrow or perhaps nonexistent time scaleseparation.5 When time scale separation breaks down, therate constant no longer exists because the waiting time forthe next reactive event becomes dependent on the detailedinitial condition in phase space. A theoretically motivatedmodel37,54 for the reactive flux correlation function is
where τTST-1 ) kTST/xB, τrxn
-1 ) k/xB, xB ) 1 - xA, kTST is theTST rate constant from states A to B, and τmol is the (short)time required to commit to a basin from a typical initialcondition on the dividing surface between states A and B.Despite the lack of a proper plateau in dC/dt, in some casesτrxn
-1 may still be identified from a best fit of dC/dt to themodel in eq 3.
Figure 3 shows dC/dt for the 5kT and the 8kT barriers ateach of the promoting vibration frequencies. The 8kT barrier
Figure 1. Mechanical model of the rate-promoting vibrationsin enzymatic proton transfer reactions. The barrier for protontransfer depends on the donor (D) and acceptor (A) distance.
V ) V0(1 + s4 - 2s2) + c(s2 - 1)Q + 12
mQωQ2 Q2 +
12 ∑
k)1
mkωk2(qk -
cks
mkωk2)2
(1)
Figure 2. The correlation function C(t) for three values ofthe rate-promoting vibration frequency at two barrier heights,5 and 8kT.
C(t) ) xA-1 < hA(0)hB(t) > (2)
dC/dt ) xB[(τTST-1 - τrxn
-1)exp(-t/τmol-1 ) + τrxn
-1exp(-t/τrxn)](3)
1448 J. Chem. Theory Comput., Vol. 6, No. 5, 2010 Peters

gives a clear plateau in dC/dt, but the 5kT barrier does not.However, dC/dt for the 5kT barrier still suggests two timescales: a molecular relaxation time scale shorter than 1 psand a longer “reaction time scale” that depends strongly onthe barrier height. Figure 3 also shows a least-squares fit ofthe model in eq 3 to the reactive flux correlation functionfor the 5kT barrier. The reaction time scale is on the orderof 100 ps for the 8kT barrier but only about 10 ps for the5kT barrier. For the 5kT barrier, the molecular relaxationand the reaction time scales are narrowly separated by justover a single order of magnitude. The parameters from aleast-squares fit of the correlation function data to eq 3 aregiven in Table 1.
The fit parameter τrxn-1 will only yield a meaningful rate
constant if the flux resulting from the fast molecularrelaxation is much less than the flux from the more slowlydecaying exponential. Equivalently, for C(t), we require thatnearly all of the relaxation from zero to xB occurs after τmol.For poor dividing surfaces or small barriers where states nearthe dividing surface are significantly populated at equilib-rium, much of the decay in C(t) may occur during the initialtime τmol. Separately integrating the two flux contributionsfrom the model in eq 3 gives the requirement that
A subtle feature in the correlation functions is the distinctlynonexponential bump around t ) 10 ps in C(t) for a 100cm-1 promoting vibration and the 5kT barrier. Figure 4shows the autocorrelation function for the promoting variableQ(t) to help understand the origin of the nonexponentialfeature. The autocorrelation function reveals long-livedexcitations and surprising “beats” in the dynamics of Q.
For both barrier heights at ωQ ) 100 cm-1, the time forthe autocorrelation of Q(t) to decay is similar to the timescale for C(t) to relax. This is consistent with the couplingin the RPV model: Q is coupled only to s, and the couplingis strongest when the (s, Q) subsystem has enough potentialenergy to cross the barrier. To verify this feature of thedynamics, note that the equation for Q:
can be solved for any initial conditions in Q and for anytrajectory s(t):
The solution in eq 6 can give beats when s(t) containsfrequencies commensurate with ωQ. In a real system, Qwould be unlikely to show weak coupling artifacts, and thusthe RPV model might be improved by directly coupling Qto the bath. In an earlier analysis, Caratzoulas et al.55 showedhow a simple Markovian friction could be added to thedynamics of Q.
Later work by Antoniou and Schwartz53 used 10 timesfewer bath modes with the same individual coupling strengthsas in their 2004 study. Again, in the later study, the rate-promoting vibration Q was not directly coupled to a bath.The smaller bath also resulted in significantly weakercoupling to the coordinate s. The section below will showthat the coupling in the later study is sufficiently weak thatenergy diffusion limitations begin to appear.
Figure 3. The reactive flux correlation function dC/dt for abarrier of 5kT and of 8kT at each of the three promotingvibrational frequencies. For the 5kT barrier, the time scalesare not sufficiently separated to show a clear plateau, so least-squares fits of eq 2 are also shown as smooth curves behindthe data. The fit provides an estimate of the reaction andmolecular relaxation time scales.
Table 1. Least-Squares Fit Parameters for the DoubleExponential Model of the Reactive Flux CorrelationFunctiona
ωQ τTST/ps τRXN/ps τMOL/ps test
100 cm-1 6.10 13.38 0.314 0.014300 cm-1 5.32 8.96 0.272 0.010900 cm-1 5.15 7.10 0.117 0.003
a The last column ‘test’ shows the left-hand side of theinequality (3), which should be much smaller than unity to interpretτrxn as an inverse rate constant.
( τmol
τTST-
τmol
τrxn)xB<<1 (4)
Figure 4. Autocorrelation functions for the rate-promotingvibration Q(t). The inset shows the autocorrelation functionwhen the barrier is 8kT, and the main plot is for a 5kT barrier.
mQQ ) -mQωQ2 Q - c(s2 - 1) (5)
Q(t) ) Q0cos[ωQt] +Q0
ωQsin[ωQt] - c
mQωQ2
(s2(t) - 1) +
c
mQωQ2 ∫0
tcos[ωQ(t - τ)]2s(τ)s(τ)dτ (6)
Enzyme Catalysis J. Chem. Theory Comput., Vol. 6, No. 5, 2010 1449

Reaction Coordinate
Antoniou and Schwartz53 performed extensive analyses ofpossible reaction coordinates for the RPV model. Much ofthe focus in earlier investigations was to develop strategiesto identify special “rate-promoting vibrations” that mightparticipate in the reaction coordinate among more mundanebath variables.53,55 Two strategies were proposed: one basedon the dynamical signature of a rate-promoting vibration inthe flux correlation functions55 and another strategy basedon identifying coordinates, whose distributions have a narrowvariance in the transition-state ensemble.53
The procedure of Caratzoulas et al. is a viable approachfor detecting the presence of a rate-promoting vibration, butit does not identify the specific rate-promoting mode.55 Thisdiscussion primarily addresses the later approach of Antoniouand Schwartz. They compute committor probability estimatesat points along the harvested transition paths to collect asample of transition states.53 They then project that sampleonto trial coordinates, e.g., onto s, Q, and various bathmodes.53 Finally, they identify coordinates that give thenarrowest projected distribution as coordinates that areimportant in the reaction coordinate.53 There are somereasons to suspect this procedure will not work for realsystems.
First, it is questionable whether distributions from pairsof coordinates with different units in a real system can bemeaningfully compared. Second, Antoniou and Schwartzextensively discuss the width of the Q-distribution in thesample of transition states,53 but it is the lack of oVerlapbetween the transition-state and equilibrium distributions ofQ that most clearly implicates Q in the pre- and re-organization stages. [Antoniou and Schwartz have switchedthe labels for Figure 1b and c in their paper.]53 Figure 5provides a schematic example of how overlaps can be usedto identify promoting variables that are important at earlyand late stages of the reaction, but whose involvement maynot be clear from the a narrow distribution in the transition-state ensemble.
Third, the strategy of Antoniou and Schwartz finds onlythe separatrix, i.e., the locus of transition states.53 Similarly,the approach of Best and Hummer only optimizes theseparatrix.56 However, other strategies discussed in their
paper57–59 optimize the reaction coordinate at all stages ofthe reaction, including the separatrix.57–60 An accuratereaction coordinate at all stages61 is useful for constructingcoarse-grained models of the barrier crossing dynamics62 andfor avoiding hysteresis effects12 that may occur if the reactioncoordinate poorly describes early and late stages of thereaction. Figure 6 provides an example of the hysteresisproblem from a recent study of methane diffusion in naturalgas hydrates.63
Antoniou and Schwartz53 do not compare the computa-tional cost of their procedure to other approaches. Here, weprovide estimates and comparisons to the aimless shootingand likelihood maximization approach using information intheir paper.
(1) The footnote in ref 13 of their paper53 reveals thattheir implementation of transition-path sampling has anefficiency of less than 1%. The low efficiency results becausetheir implementation of transition-path sampling was notoptimized for studying dynamics at sharp saddle-point-typetransition states. Aimless shooting can be tuned (by settingδt ) 1-2 fs)59 to more efficiently sample such sharp barriers.
(2) After computing transition paths, the authors identify121 transition states by estimating the committor probabilityat configurations along the paths.53 Each pB estimate requireson the order of 100 trajectories.52,61 Assuming that a smallfraction of the points where pB estimates were computed werefound to be transition states, a reasonable estimate for thenumber of additional trajectories to identify the transition-state ensemble is more than 10 000. Likelihood maximizationhas been shown to identify a coordinate that is accurate atall stages in model systems58,62 and in atomistic simula-tions64–67 with approximately 1000 trajectories.
(3) Also note that the version of committor analysis usedin refs 48 and 43 constrains multiple variables separately.For example, Antoniou and Schwartz53 applied the twosimultaneous constraints s ) 0 and Q ) c/mQωQ
2. Theirversion of committor analysis with multiple constraints is lessstringent than the usual committor analysis procedure.52,68,69
Because of the extra constraints, the pB histogram test doesnot reflect the accuracy of a true dividing surface throughwhich an observable rate could be computed. We recommendthe improved version of committor analysis with the
Figure 5. (a) Bath-mode distributions in the transition-stateensemble “interpolate” between the distributions in the reac-tant and product states. (b) In qualitative contrast, thetransition-state ensemble distribution of a promoting variableQ like that of the RPV model does not interpolate betweenthe corresponding reactant and the product distributions.Furthermore, the transition- and stable-state distributions ofQ have a small overlap. These characteristics indicate thatQ is involved in early and late stages of the reactioncoordinate, even when it appears to be uninvolved in thereaction coordinate at the transition state.
Figure 6. Schematic of methane (gray circles) diffusion byhopping through a water vacancy in a clathrate hydrate (blackhexagonal lattice). Left: A calculation of the free energy barrierbetween donor (D) and acceptor (A) using hyperplanecoordinates gave hysteresis because one of the two ways toproceed from the separatrix leads away from the vacantacceptor cage. Right: A bipolar coordinate system with thesame separatrix gave no hysteresis because it better de-scribes the early and late stages.
1450 J. Chem. Theory Comput., Vol. 6, No. 5, 2010 Peters

binomial-error deconvolution to isolate reaction coordinateerror from committor estimate error.61
Aimless shooting and likelihood maximization have somequantitative and qualitative advantages over the approach ofAntoniou and Schwartz, but for many enzymatic reactions,an accurate and efficient approach is to identify a saddle pointon the energy landscape70 and then to apply TST.6 Forreactions with sharp barriers that correspond to the breakingand making of chemical bonds, harmonic TST can oftenprovide many mechanistic insights with a minimal compu-tational expense.
Mechanistic Insights from Transition-StateTheory
The unstable eigenmode from harmonic TST5 and moregenerally the intrinsic reaction coordinate (IRC)71–75 oftenprovide excellent reaction coordinates for reactions that breakand make strong chemical bonds.32 Furthermore, the reactionpath Hamiltonian,76 constructed from the intrinsic arclengthreaction coordinate s and minimum energy path in mass-weighted coordinates (MWC), can be used to understand thedynamics.41 The potential energy surface in the reaction pathHamiltonian is a harmonic valley76–80 around the minimumenergy path. On a parabolic surface, mass weighted coor-dinates (xk ) mk
1/2qk in the current study) transform themultidimensional equation “F ) ma” into the simplermassless equation: -∂V/∂x ) d2x/dt2. The multidimensionaldynamics in mass-weighted coordinates can be simulatedusing Hamilton’s equations from the reaction path Hamilto-nian.41,42
The arclength coordinate in the (s, Q) subspace is sufficientto understand the role of Q in the reaction coordinate. Figure7 shows the steepest-descent path, potential energy contoursin the (s, Q) subspace, and the arclength coordinate as acolored background. Figure 7 also shows how the rate-promoting vibration frequency changes the role of Q in thearclength reaction coordinate. At very low frequencies, thereaction coordinate increases in the Q-direction, then in-
creases in the s-direction, and finally increases again as Qdecreases back to Q ) 0. At higher frequencies of the RPV,s retains its primary importance in the reaction coordinateat early and late stages and at the transition state.
For ωQ ) 100 cm-1, the mass weighted arclengthcoordinate reveals three distinct stages of the reaction: (1)donor-acceptor approach [preorganization], (2) proton trans-fer at constant Q [instanton], and (3) donor-acceptor recede[reorganization]. In agreement with Antoniou et al.,46 a lowfrequency ωQ may allow several recrossings of the s ) 0surface, while the donor-acceptor pair are close. Portionsof the reaction coordinate that involve Q also explainadditional recrossing at multiples of (2π/ωQ) after the initialcrossing because of slow energy transfer from Q. Note thatthe three stages are no longer distinguishable at ωQ ) 900cm-1.
TST cannot predict the extent or importance of dynamicaleffects, but harmonic TST actually reveals many of themechanistic details in the RPV model. The Q values on thedividing surface from harmonic TST are markedly differentfrom the values that characterize both the reactant andproduct states (Q ≈ 0). For small ωQ, the saddle-point (Q )Q*) and the minima locations (Q ) 0) and the realfrequencies for displacement along Q (ωQ in all threelocations) reveal a situation at small ωQ that is much likethat in Figure 5b. Thus harmonic TST can identify a rolefor Q in pre- and re-organization.
For an actual enzyme, saddle-point search algorithms70
would be needed to find the saddle point. The Hessian matrixat the saddle point could then be computed explicitly ornumerically projected onto a few relevant bond lengths,12
depending on the model chemistry. In the RPV model, thesaddle point is trivially identified. The mass-weightedHessian matrix at the saddle point is
where
The unstable eigenmode at the saddle point has nocontribution from the rate-promoting vibration. That is tobe expected because of the symmetry of the potential energysurface. However, the unstable eigenmode is not perpen-dicular to the s ) 0 plane. Bath modes influence theorientation of the unit normal vector on the dividing surfacebecause of the off-diagonal coupling terms in the mass-weighted Hessian. To verify that the bath-mode contributionsfrom harmonic TST do provide a more accurate reactioncoordinate, we numerically diagonalized the mass-weightedHessian for the exact parameters used by Antoniou andSchwartz.53
Figure 7. Steepest-descent path (heavy black curve) inmass-weighted coordinates with mQ ) 12 and ms ) 1 amu(proton). Also shown are contours of V(s, Q) and the scalararclength coordinate as a color-field background. Results arefor ωQ ) 100 cm-1 (above) and ωQ ) 900 cm-1 (below) withparameters that give a 5kT barrier. Note how ωQ changes V(s,Q) and the arclength coordinate.
∂2Vmwc ) [ms
-1(∂2V/∂s2)|*
0 -ms-1/2c†M-1/2
0 ωQ2 0
-ms-1/2M-1/2c 0 Ω2 ] (7)
M ) diag[m1, m2,...,mN]Ω ) diag[ω1, ω2,...,ωN]
c† ) (c1, c2,...,cN)
∂2V
∂s2 |*
) 2cQ* -4V0
s02
+ ∑k
ck2
mkωk2
(8)
Enzyme Catalysis J. Chem. Theory Comput., Vol. 6, No. 5, 2010 1451

In their later work, Antoniou and Schwartz changed thebarrier in V0(s) to 6.3 kcal/mol, ωQ to 110 cm-1, mQ to 48amu, all bath masses to mk ) 48 amu, and the transferdistance from 2 to 1 Å, i.e., s0 ) 0.5 instead of s0 ) 1 Å.53
Antoniou and Schwartz also provided the bath frequenciesused in their later study.53 Again, the rate-promoting vibrationQ was not directly coupled to a bath. Importantly, Antoniouand Schwartz used 10 times fewer bath modes (100 in thelater study53 vs 1000 in the earlier study)46 with the sameindividual coupling strengths (ck ) 0.00025 au.) in bothcases. The smaller bath results in significantly weakercoupling to the coordinate s. We used these parameters ofAntoniou and Schwartz in a 200 ns trajectory. A time stepof 0.04 fs was sufficiently small that the energy drift wasless than 0.001kT over the entire 200 ns trajectory.
Transmission coefficients were computed using the hy-perplane dividing surface perpendicular to the unstableeigenmode. Denoting the unstable eigenmode as u anddenoting the mass-weighted position relative to the saddlepoint as q, the dividing surface is u.q ) 0, with positivevalues of u.q indicating products. The transmission coef-ficient from the unstable eigenmode coordinate was com-pared to the transmission coefficient using s ) 0 as thedividing surface. Figure 8 shows that at the coupling strengthused by Antoniou and Schwartz, the t ) 0+ limit of dC/dt(and therefore the transmission coefficients) for s ) 0 andu.q ) 0 dividing surfaces are indistinguishable. However,as coupling increases the two surfaces become more different,with the unstable eigenmode giving the superior dividingsurface. Thus harmonic TST can quantitatively validate thesuggestion of Antoniou and Schwartz, who used subtlechanges in distribution widths to argue that small componentsof the ‘bath modes’ may actually be part of an optimalreaction coordinate.31,53,81,82
Note that the plateau at ∼0.2 ps is not a true plateau. Atlonger times, dC/dt continues to decrease, and it becomesdifficult to identify a plateau. This behavior is shown forfour coupling strengths in Figure 9. At the coupling strengthused by Antoniou and Schwartz, dC/dt is becoming too smallto accurately compute from the data in our simulations.83
Interestingly, the value of dC/dt at times beyond 2 ps isapproximately a linearly increasing function of couplingstrength up to ck/ck (ref 48) ) 10.36 Then at ck/ck (ref 48)) 20, the value of dC/dt begins to decrease again, reminis-cent of Kramers’ turnover.36 However, the apparent turnover
occurs at coupling strengths that are an order of magnitudestronger than the coupling used by Antoniou and Schwartz.53
Also note the appearance of discrete steps in dC/dt. The timesbetween steps correspond approximately to 2π/ωQ, a singleorbit of the weakly coupled rate-promoting vibration. Theseobservations all suggest that action angle variables for energydiffusion-limited kinetics in the promoting variable Q mayprovide good reaction coordinates in this system. However,we emphasize that energy diffusion limitations may entirelyvanish for a real system with direct coupling between Q andthe bath.
Conclusions
In the rate-promoting vibrations (RPV) model of enzymecatalysis, a ‘promoting vibration’ Q brings the donor andacceptor into proximity and lowers the barrier for motionalong a ‘proton-transfer coordinate’ s. We studied dynamicsin the RPV model using the parameters of Antoniou et al.46
and also those of the later work by Antoniou and Schwartz.53
The reactive flux correlation function for the RPV modelshows that dynamical effects do slow the kinetics. However,the system shows an extremely narrow time scale separationbecause the parameters of Antoniou et al. give a barrier thatis only 5kT high.46 Additionally, we find strong correlationsand surprising beats that persist in the dynamics of Q overtimes comparable to the reaction time scale. These unusualdynamical features result from a lack of direct couplingbetween Q and the bath in the RPV model. Near the reactantand product minima, Q also becomes effectively uncoupledfrom the proton-transfer coordinate s. Our findings suggestthat direct coupling between Q and the bath may be neededto damp the beats and long-time correlations in the dynamicsof Q.
Using the intrinsic reaction coordinate (IRC),71–76 we showthat Q is an important component of the reaction coordinatedirection at early and late stages but not at the separatrix.Interestingly, the unstable eigenmode from harmonic TST(which coincides with the IRC at the saddle point) gives alarger transmission coefficient than the coordinate used inthe correlation functions of Antoniou et al.46,53 Additionally,harmonic TST is an important starting point for methods that
Figure 8. Reactive flux correlation function at differentcoupling strengths for the two dividing surfaces. The dividingsurface u.q ) 0 is always better than or equivalent to s ) 0in the variational sense. Parameters are those of Antoniouand Schwartz in ref 48.
Figure 9. Using the dividing surface u.q ) 0 in each case,dC/dt at longer times for four different coupling strengths. InFigure 8, dC/dt continues to decrease beyond the apparentplateau time. It is not clear whether a plateau in dC/dt can beidentified. For the parameters of Antoniou and Schwartz, i.e.,for ck/ck (ref 48) ) 1, dC/dt rapidly decreases to a size wherenumerical errors exceed the physical value.
1452 J. Chem. Theory Comput., Vol. 6, No. 5, 2010 Peters

compute the energy landscape along the IRC to quantifyeffects of dynamics41 and tunneling.84 Our results thussupport the view that promoting modes are a form ofpreorganization8,21 and contrast the view that TST cannotprovide insight on enzymatic reaction mechanisms.45
Finally, the relative merits and efficiencies of the procedureof Antoniou and Schwartz53 for identifying reaction coor-dinates were compared to other approaches. We discuss howspecial ‘promoting variables’ can be identified by comparingthe distribution of coordinate values in the reactant andproduct states and in the transition-state ensemble. Bathvariables show a distribution of values in the transition-stateensemble that approximately interpolates between the reac-tant and product distributions. The distribution of promotingvariable values in the transition-state ensemble will neitheroverlap nor interpolate between the distributions of promot-ing variable values in the reactant and product states. Inagreement with Antoniou and Schwartz,53 projecting thetransition-state ensemble onto a good reaction coordinateshould give a narrow distribution. However, their test onlyidentifies the separatrix and thus is necessary but notsufficient to ensure an accurate reaction coordinate.61
Acknowledgment. I thank Gregg Beckham, MichaelHagan, and David Chandler for helpful discussions aboutthis work. I acknowledge support from the PetroleumResearch Fund of the American Chemical Society, PRF#49165-DNI9.
References
(1) Pauling, L. Nature 1948, 161, 707.
(2) Radzicka, A.; Wolfenden, R. Science 1995, 267, 5194.
(3) Zhang, X. Y.; Houk, K. N. Acc. Chem. Res. 2005, 38, 379.
(4) Li, C. H.; Henry, C. S.; Jankowski, M. D.; Ionita, J. A.;Hatzimanikatis, V.; Broadbelt, L. J. Chem. Eng. Sci. 2004,59, 5051.
(5) Hanggi, P.; Talkner, P.; Borkovec, M. ReV. Mod. Phys. 1990,62, 251.
(6) Truhlar, D. G.; Garrett, B. C.; Klippenstein, S. J. J. Phys.Chem. 1996, 100, 12771.
(7) Garcia-Viloca, M.; Gao, J.; Karplus, M.; Truhlar, D. G.Science 2004, 303, 186.
(8) Warshel, A.; Sharma, P. K.; Kato, M.; Xiang, Y.; Liu, H.;Olsson, M. H. M. Chem. ReV. 2006, 106, 3188.
(9) Keck, J. AdV. Chem. Phys. 1967, 13, 85.
(10) Garrett, B. C.; Truhlar, D. G. Annu. ReV. Phys. Chem. 1984,35, 159.
(11) Schenter, G. K.; Garrett, B. C.; Truhlar, D. G. J. Chem. Phys.2003, 119, 5828.
(12) Rosta, E.; Woodcock, H. L.; Hummer, G.; Brooks, B. R.J. Comput. Chem. 2009, 30, 1634.
(13) Aqvist, J.; Warshel, A. J. Am. Chem. Soc. 1990, 112, 2860.
(14) Hu, H.; Yang, W. Annu. ReV. Phys. Chem. 2008, 59, 573.
(15) Warshel, A.; Levitt, M. J. Mol. Biol. 1976, 103, 227.
(16) Warshel, A. J. Biol. Chem. 1998, 273, 27035.
(17) Bruice, T. C.; Bruice, P. Y. J. Am. Chem. Soc. 2005, 127,12478.
(18) Strajbl, M.; Sham, Y. Y.; Villa, J.; Chu, Z. T.; Warshel, A. J.Phys. Chem. B 2000, 104, 4578.
(19) Hammes-Schiffer, S.; Benkovic, S. Annu. ReV. Biochem.2006, 75, 519.
(20) Hammes-Schiffer, S.; Tully, J. C. J. Chem. Phys. 1994, 101,4657.
(21) Cui, Q.; Karplus, M. J. Phys. Chem. B 2002, 106, 7927.
(22) Senn, H. M.; Thiel, W. Angew. Chem., Int. Ed. 2008, 48,1198.
(23) Gao, J. ReV. Comput. Chem. 1996, 7, 1996.
(24) Warshel, A.; Florian, J. Empirical Valence Bond and RelatedApproaches; Wiley and Sons: New York, NY, 2004.
(25) Agarwal, P. K.; Billeter, S. R.; Hammes-Schiffer, S. J. Phys.Chem. B 2002, 106, 3283.
(26) Benderskii, V. A.; Goldanskii, V. I.; Makarov, D. E. Chem.Phys. Lett. 1991, 186, 517.
(27) Billeter, S. R.; Webb, S. P.; Agarwal, P. K.; Iordanov, T.;Hammes-Schiffer, S. J. Am. Chem. Soc. 2001, 123, 11262.
(28) Pu, J.; Gao, J.; Truhlar, D. G. Chem. ReV. 2006, 106, 3140.
(29) Fernandez-Ramos, A.; Ellingson, B. A.; Garrett, B. C.; Truhlar,D. G. In ReViews in Computational Chemistry; Lipkowitz,K. B., Cundari, T. , Eds.; Wiley-VCH: Hoboken, NJ, 2007;Vol. 23.
(30) Dybala-Defratyka, A.; Paneth, P.; Banerjee, R.; Truhlar, D. G.Proc. Nat. Acad. Sci. U.S.A. 2007, 104, 10774.
(31) Truhlar, D. G.; Gao, J.; Garcia-Viloca, M.; Alhambra, C.;Corchado, J.; Sanchez, M. L.; Poulsen, T. D. Int. J. QuantumChem. 2004, 100, 1136.
(32) Garcia-Viloca, M.; Truhlar, D. G.; Gao, J. Biochemistry 2003,42, 13558.
(33) Rothlisberger, D.; Khersonsky, D.; Wollacot, A. M.; Jiang,L.; DeChancie, J.; Betker, J. L.; Gallaher, J. L.; Althoff, E. A.;Zanghellini, A.; Dym, O.; Albeck, S.; Houk, K. N.; Tawfik,D. S.; Baker, D. Nature 2008, 453, 190.
(34) Jiang, L.; Althoff, E. A.; Clemente, F. R.; Doyle, L.;Rothlisberger, D.; Zanghellini, A.; Gallaher, J. L.; Betker,J. L.; Tanaka, F.; Barbas, C. F.; Hilvert, D.; Houk, K. N.;Stoddard, B. L.; Baker, D. Science 2008, 319, 1387.
(35) Kuharski, R. A.; Chandler, D.; Montgomery, J. A.; Rabii, F.;Singer, S. J. J. Phys. Chem. 1988, 92, 3261.
(36) Kramers, H. A. Physica 1940, 7, 284.
(37) Chandler, D. J. Chem. Phys. 1978, 68, 2959.
(38) Straub, J. E.; Berne, B. J. Chem. Phys. 1985, 83, 1138.
(39) Vanden-Eijnden, E.; Tal, F. A. J. Chem. Phys. 2005, 123,184103.
(40) Berne, B.; Borkovec, M.; Straub, J. E. J. Phys. Chem. 1988,92, 3711.
(41) Peters, B.; Bell, A. T.; Chakraborty, A. K. J. Chem. Phys.2004, 121, 4453.
(42) Hu, H.; Kobrak, M. N.; Xu, C.; Hammes-Schiffer, S. J. Phys.Chem. A 2000, 104, 8058.
(43) Hammes-Schiffer, S. Biochemistry 2002, 41, 13335.
(44) Kim, H. J.; Hynes, J. T. J. Am. Chem. Soc. 1992, 114, 10528.
(45) Pineda, J. R. E. T.; Schwartz, S. D. Philos. Trans. R. Soc.,B 2006, 361, 1433.
Enzyme Catalysis J. Chem. Theory Comput., Vol. 6, No. 5, 2010 1453

(46) Antoniou, D.; Abolfath, M. R.; Schwartz, S. D. J. Chem.Phys. 2004, 121, 6442.
(47) Antoniou, D.; Basner, J.; Nunez, S.; Schwartz, S. D. Chem.ReV. 2006, 106, 3170.
(48) Quaytman, S.; Schwartz, S. D. Proc. Nat. Acad. Sci. U.S.A.2007, 104, 12253.
(49) Schwartz, S. D.; Schramm, V. L. Nat. Chem. Biol. 2009, 5,552.
(50) Bolhuis, P. G.; Dellago, C.; Chandler, D. Faraday Discuss.1998, 110, 421.
(51) Dellago, C.; Bolhuis, P. G.; Chandler, D. J. Chem. Phys.1998, 108, 9236.
(52) Bolhuis, P. G.; Chandler, D.; Dellago, C.; Geissler, P. G.Annu. ReV. Phys. Chem. 2002, 53, 291.
(53) Antoniou, D.; Schwartz, S. D. J. Chem. Phys. 2009, 130,151103.
(54) Liu, F.; Nakaema, M.; Gruebele, M. J. Chem. Phys. 2009,131, 195101.
(55) Caratzoulas, S.; Schwartz, S. D. J. Chem. Phys. 2001, 114,2910.
(56) Best, R.; Hummer, G. Proc. Nat. Acad. Sci. U.S.A. 2005,102, 6732.
(57) Ma, A.; Dinner, A. R. J. Phys. Chem. B 2005, 109, 6769.
(58) Peters, B.; Trout, B. L. J. Chem. Phys. 2006, 125, 054108.
(59) Peters, B.; Beckham, G. T.; Trout, B. L. J. Chem. Phys. 2007,127, 1.
(60) Borrero, E. E.; Escobedo, F. A. J. Chem. Phys. 2007, 127,164101.
(61) Peters, B. J. Chem. Phys. 2006, 125, 241101.
(62) Knott, B.; Duff, N. C.; Doherty, M. F.; Peters, B. J. Chem.Phys. 2009, 131, 224112.
(63) Peters, B.; Zimmerman, N. E. R.; Beckham, G. T.; Tester,J. W.; Trout, B. L. J. Am. Chem. Soc. 2008, 130, 17342.
(64) Juraszek, J.; Bolhuis, P. G. Biophys. J. 2008, 95, 4246.
(65) Beckham, G. T.; Peters, B.; Starbuck, C.; Variankaval, N.;Trout, B. L. J. Am. Chem. Soc. 2007, 129, 4714.
(66) Beckham, G. T.; Peters, B.; Trout, B. L. J. Phys. Chem. B2008, 112, 7460.
(67) Vreede, J.; Juraszek, J.; Bolhuis, P. G. Proc. Nat. Acad. Sci.U.S.A. 2010, 107, 2397.
(68) Du, R.; Pande, V. S.; Grosberg, A. Y.; Tanaka, T.; Shakh-novich, E. S. J. Chem. Phys. 1998, 108, 334.
(69) Geissler, P. G.; Dellago, C.; Chandler, D. J. Phys. Chem. B1999, 103, 3706.
(70) Schlegel, H. B. J. Comput. Chem. 2003, 24, 1514.
(71) Marcus, R. A. J. Chem. Phys. 1966, 45, 4500.
(72) Marcus, R. A. J. Chem. Phys. 1968, 49, 2610.
(73) Truhlar, D. G.; Kuppermann, A. J. Am. Chem. Soc. 1971,93, 1840.
(74) Shavitt, I. J. Chem. Phys. 1968, 49, 4048.
(75) Fukui, K. Acc. Chem. Res. 1981, 14, 363.
(76) Miller, W. H.; Handy, N. C.; Adams, J. E. J. Chem. Phys.1980, 72, 99.
(77) Garrett, B. C.; Truhlar, D. G. J. Phys. Chem. 1979, 83, 1052.
(78) Garrett, B. C.; Truhlar, D. G. J. Phys. Chem. 1979, 83, 1079.
(79) Garrett, B. C.; Truhlar, D. G. Proc. Nat. Acad. Sci. U.S.A.1979, 76, 4755.
(80) Truhlar, D. G.; Garrett, B. C. Acc. Chem. Res. 1980, 13, 440.
(81) Truhlar, D. G.; Garrett, B. C. J. Phys. Chem. B 2000, 104,1069.
(82) Pollak, E. J. Chem. Phys. 1986, 85, 865.
(83) Frenkel, D.; Smit, B. Understanding molecular simulation:from algorithms to applications; Academic Press: San Diego,CA, 2002.
(84) Peters, B.; Bell, A. T.; Chakraborty, A. K. J. Chem. Phys.2004, 121, 4461.
CT100051A
1454 J. Chem. Theory Comput., Vol. 6, No. 5, 2010 Peters