Embed Size (px)
Citation preview

Transit Oriented Development (TOD) Policy East Delhi Hub - Kadkadooma TOD project
P.S. Uttarwar, Addl. Commissioner (Retd.)/ Consultant, DDA
Paromita Roy, Dy. Director, UTTIPEC, DDA
25th November 2015

Maximum people Live, Work & Play
within walking distance of RAPID TRANSIT Stations
Transit Node
Express
BRTS/MRTS
Route
Transit Oriented Development (TOD) is essentially any
development, macro or micro, that is focused around a
transit node, and facilitates complete ease of access to the
transit facility, thereby inducing people to prefer to walk and
use public transportation over personal modes of transport.
2

Bazaar Concept - Jaipur
3

TOD policy shall be a paradigm shift in the way neighborhoods and city, in general,
are planned and heralds a new way of linking urban systems to day-to-day living
such that the average person can spend more quality time for social and recreational
purposes rather than getting stuck in traffic jams and decreasing ones productivity
and health.
Taking the Master Plan directive forward, the TOD policy designates a maximum up to
500 m. wide belt (i.e. approximately 5-minute walking distance) on both sides of
centre line of the MRTS Corridor as ‘TOD Zone’, with the exception of areas falling
under Low Density residential Areas (LDRA). TOD zone is a new land use category
which allows flexibility in mix of various possible uses, with the exception of
polluting and potentially hazardous uses. .
About TOD
4

The goal of the TOD Zone is to promote low-carbon high density sustainable
development in the city. The policy has the following major aspects:
Allow flexibility of uses within the overall ambit of the Zonal development plan
land uses.
Mixed use provision to reduce travel demand and reduce pressure on road based
travel.
Optimum FAR and density norms to facilitate people to live work and seek
entrainment within walking distance of stations. These will also seek to
balance/redistribute densities over the city along MRTS corridors.
Creation of finer road networks within neighbourhoods/ development areas for
safer and easy movement of NMT and pedestrians.
Mix of incomes within communities with sharing of public spaces/ greens/
recreational facilities/ amenities between communities.
Salient Features of TOD
5

The goal of the TOD Zone is to promote low-carbon high density sustainable
development in the city. The policy has the following major aspects:
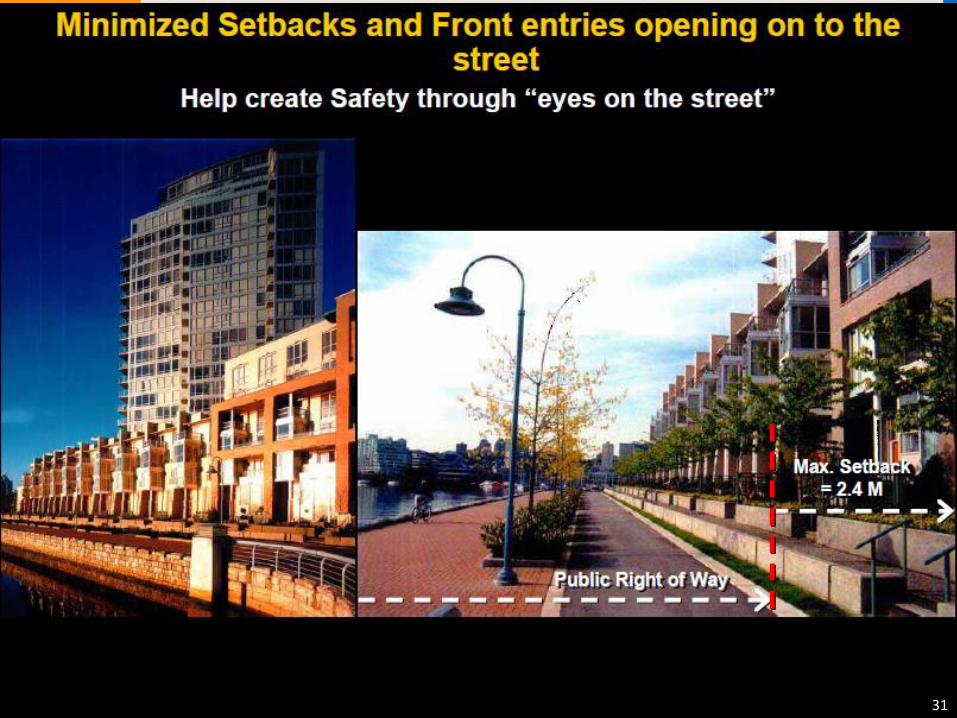
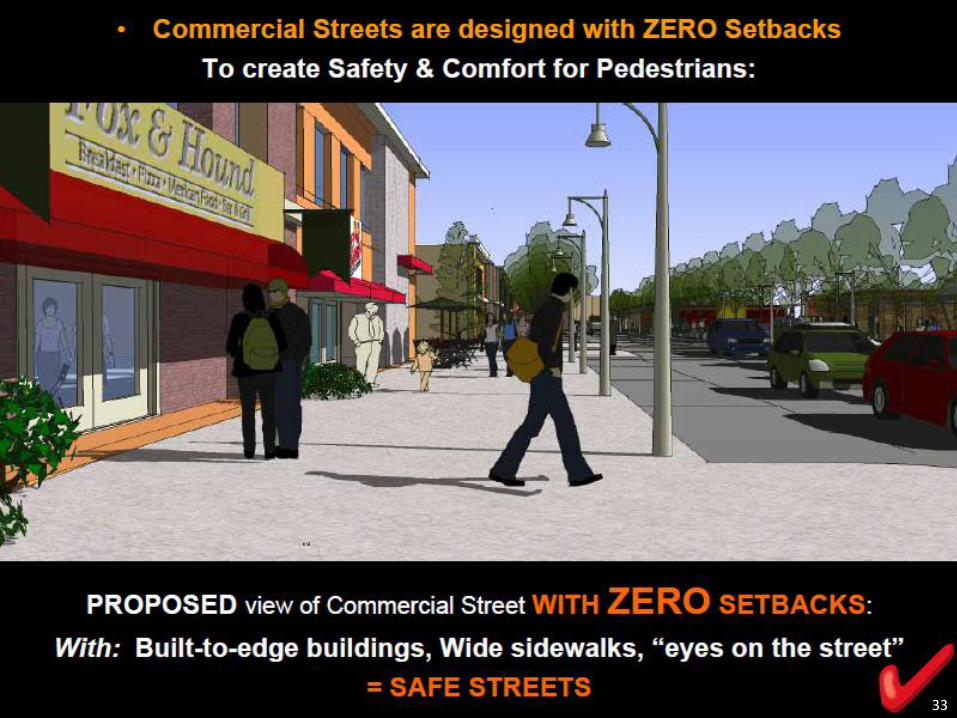
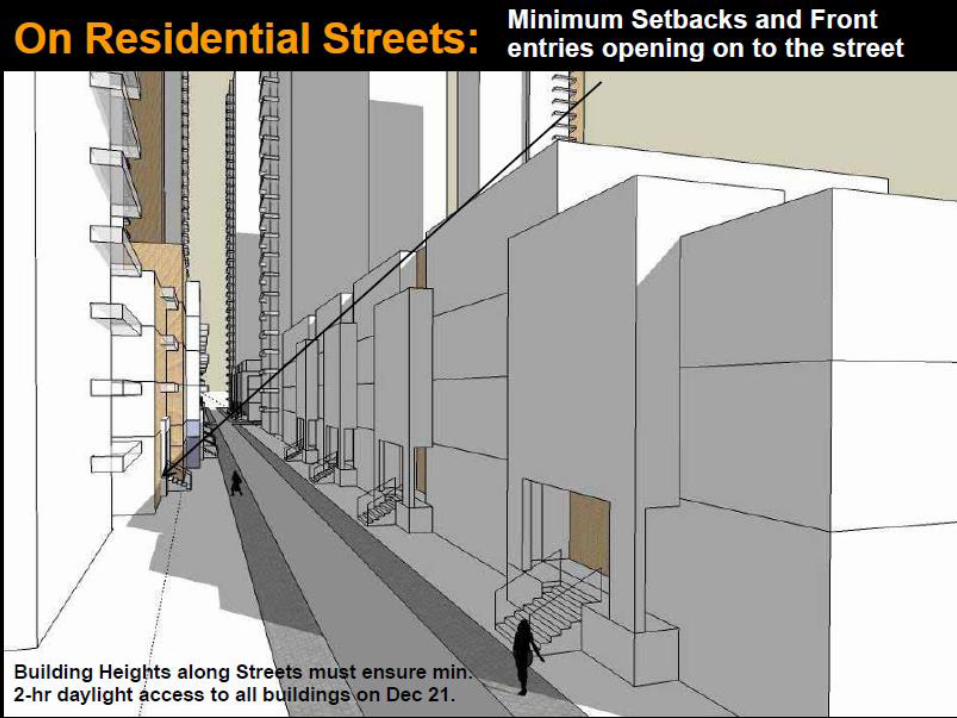
Increase in public safety esp. for women and children using public transport or
walking at night, through changes in key Development Code aspects such as
revised setback norms, dispensing with boundary walls, having built-to-edge
buildings with active frontages which provide ‘eyes-on-the-street’.
Strict planning and regulation of on-street parking shall be undertaken to reduce
private vehicle use.
Approval of projects shall be given through a single-window software based
system to reduce processing time and enable faster-paced (re)development to
take place in the city.
Salient Features of TOD
6

The goal of the TOD Zone is to promote low-carbon high density sustainable
development in the city. The policy has the following major aspects:
Delineation of TOD Zone on respective Zonal Development Plans (ZDP)-
TOD Regulations/ Guidelines-
Developing Software for Single Window Clearance for approval of Building Plan
Relaying of Services
Way Forward
7

The Influence Zone of MRTS Corridors shall be designated as Transit Oriented
Development (TOD) Zone where the following development control norms shall
apply:
FAR and Density:
TOD norms of FAR and density may be availed through the preparation and approval of
comprehensive integrated scheme of minimum size 1 Ha,
a. Maximum ground coverage of 40%. In case of MRTS/ Government Agencies, the
minimum plot size for development shall be 3000 sq.m.
b. For Integrated Scheme, a max. FAR of 400
c. A maximum density of 2000 persons per hectare (PPH).
d. The entire amalgamated plot will be considered for calculating the FAR and density.
e. Mandatory EWS FAR of 15% over and above the maximum permissible FAR shall be
applicable. Additional FAR may be availed through TDR only, for schemes larger
than 1 Ha.
f. All residents residing in that scheme area shall have to be accommodated within
the same scheme
8
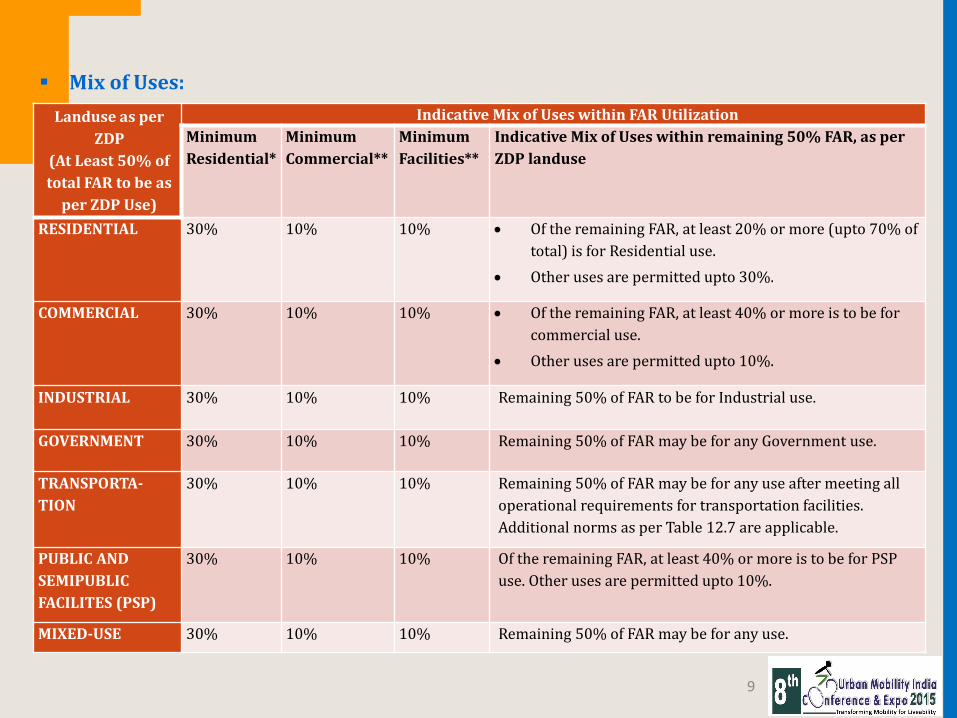
Mix of Uses:
Landuse as per
ZDP
(At Least 50% of
total FAR to be as
per ZDP Use)
Indicative Mix of Uses within FAR Utilization
Minimum
Residential*
Minimum
Commercial**
Minimum
Facilities**
Indicative Mix of Uses within remaining 50% FAR, as per
ZDP landuse
RESIDENTIAL 30% 10% 10% Of the remaining FAR, at least 20% or more (upto 70% of
total) is for Residential use.
Other uses are permitted upto 30%.
COMMERCIAL 30% 10% 10% Of the remaining FAR, at least 40% or more is to be for
commercial use.
Other uses are permitted upto 10%.
INDUSTRIAL 30% 10% 10% Remaining 50% of FAR to be for Industrial use.
GOVERNMENT 30% 10% 10% Remaining 50% of FAR may be for any Government use.
TRANSPORTA-
TION
30% 10% 10% Remaining 50% of FAR may be for any use after meeting all
operational requirements for transportation facilities.
Additional norms as per Table 12.7 are applicable.
PUBLIC AND
SEMIPUBLIC
FACILITES (PSP)
30% 10% 10% Of the remaining FAR, at least 40% or more is to be for PSP
use. Other uses are permitted upto 10%.
MIXED-USE 30% 10% 10% Remaining 50% of FAR may be for any use.
9

Roads:
Of the area taken up for development as integrated scheme, at least 20% of land shall
be handed over as constructed roads/ circulation areas to the local body/ road owning
agency for public use. However FAR can be availed on the entire amalgamated land
parcel.
Green Public Open Space Provision:
20% of the area of the amalgamated plot shall be designated as green Public Open
Space which shall be designed, developed and maintained by the DE/agency and will
remain un-gated and open for general public at all times, failing which it will be taken
over by Public agency.
Social Infrastructure:
Social Infrastructure may be allocated the required built-up area within planned
re/development schemes in the form of Accommodation Reservation, instead of
individual plots.
10

Green Buildings:
The entire development has to be with minimum 3 star or gold rating as per approved
rating agencies and appropriate rebate in the property tax may be applicable.
Impact Assessment:
Once the Influence Zone plans for TOD areas are prepared by DDA indicating the street
networks, indicative amalgamations areas, location of public spaces, active edges, etc. a
complete assessment of traffic generation and its dispersal, requirement of services,
mitigation measures for environment impact will be done and got approved from
bodies concerned so that the redevelopment process through TOD can be effective and
beneficial for general public.
11

EAST DELHI HUB - Kadkadooma TOD project
UNIFIED TRAFFIC & TRANSPORTATION INFRASTRUCTURE (PLG. & ENGG.) CENTRE
DELHI DEVELOPMENT AUTHORITY

Kadkadooma Station
ISBT
800 M Catchment
2000 M Catchment
300 M Catchment IPT site
New Station for Metro Phase-III was introduced in 2012.
13
Metro
Proposed BRT
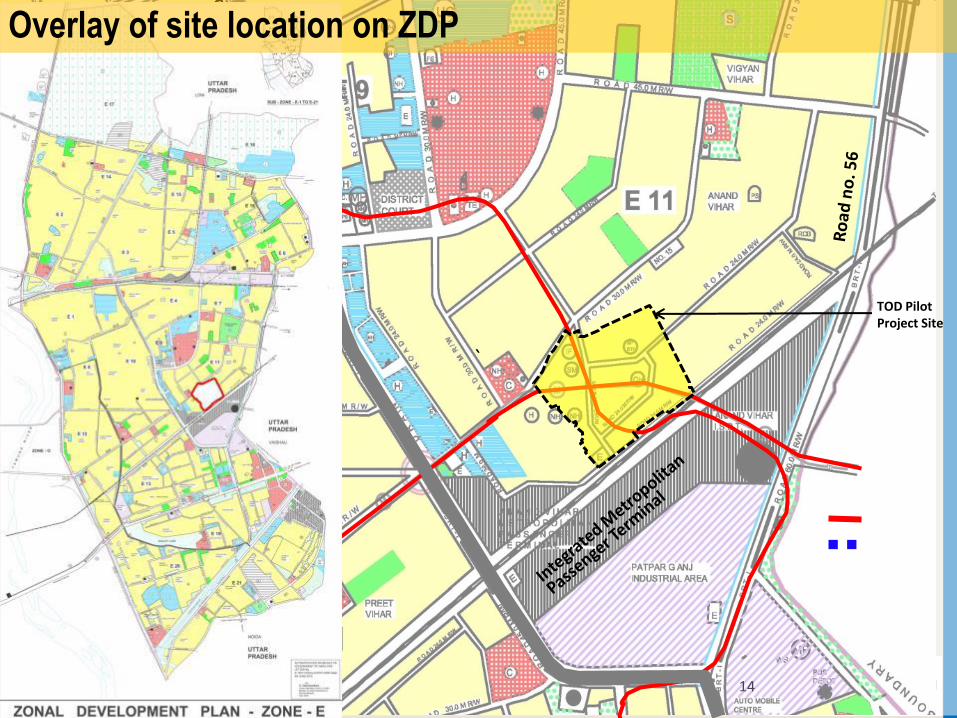
TOD Pilot Project Site
14
`
Overlay of site location on ZDP


Chander Vihar

2000m catchment zone from MRTS-Landuse
17

Scenarios Explored - Three (3 Nos.)
Business As Usual Design Option-1 Design Option-2
Business As Usual-MPD
Residential population = 14060
Residential = 81.7 % of total FAR
Neighborhood & Community level
facilities = 18 % of total FAR
Usable Open Space
= 15% of land area
Ground Coverage = 15 %
Roads = 15% of land area
Density = 500 pph
Densification by MPD-2021
Residential population = 30,375
Residential = 80 % of total FAR
Neighborhood & Community level
facilities = 20 % of total FAR
Usable Open Space
= 30% of land area
Ground Coverage = 20 %
Roads = 20 % of land area
Density = 1242 pph
Densification by TOD principles
Residential population = 21,000
Residential = 50 % of total FAR
Neighborhood, Community & District
level facilities = 25 % of total FAR
Additional Commercial
= 25 % of total FAR
Usable Open Space
= 20% of land area
Ground Coverage = 35%
Roads = 20 % of land area
Density = 830 pph
18

An insights into the residents, students, businesses and professionals

Stakeholder Consultations
Stakeholder consultations were conducted – for prioritizing of civic amenities
• RWAs and discussions with residents (formal and informal neighborhoods)
• Trader Associations
• NGOs and civil society institutions
• Schools – Workshop with private school children/ discussion with government teachers
• Pradhans and local ward counselors

Planned Colonies
1. Mixed-use at main street level (banks, property dealers)
2. Re-densifying into G+4 developer flats (with stilts)
3. Gated Colonies with no thoroughfare
4. Rental: Ownership Rate = 30:70
5. Typologies: 100 sq.m. - 300 sq.m.
6. Costs of home: Rs 2.2 crore +
7. Rental costs: Rs 25,000+
8. Staff: drivers, maids, gardener, guard, vegetable seller- live in informal settlements in both ownership and rent
9. RWA concerns: congestion
10. MCD Site engineer concerns: Maintenance and infrastructure repair issues

• Urban Villages: Karkardooma Village
• Un-authorized Colonies:
• Slums: Anand Vihar JJ Slum
1. Mixed-use areas
2. Rental : Ownership rate = 70: 30
3. Rental costs: Rs 500-700 per person
4. Typologies: 16 sq.m. - 40 sq.m.
5. Issues: water quality, under-employment, no open spaces for activity; under utilized areas
Informal Colonies

Safety a key concern for young girls
Students (age 4-9) walk to school- cross the KKD site
No space for activity outside school hours/summer holidays
Adequate hospitals, schools and dispensaries
Adequate public and private schools in the location
Discussion with Class 12 students + Interview with Primary
Government School Teacher

TOD CONCEPTS
adopted in the Pilot Project

25

26

27

28

29

30
31

32
33

34

35


CHANGES FROM
PREVIOUS LAYOUT PLAN

Existing Layout Plan
44
SITE AREA: 30.72 Ha
AREA UNDER SCHEME: 28.12 Ha
USE WISE DISTRIBUTION OF PLOTS
COMMERCIAL USE : 1.48 Ha
RESIDENTIAL USE: 13.16 Ha
PUBLIC- SEMI PUBLIC: 4.27 Ha
AREA UNDER CIRCULATION: 5.00Ha
AREA UNDER OPEN SPACE: 4.25 Ha
GROSS FAR: 1.09
TOTAL BUILT UP AREA: 3,06,700
TOTAL BUILT UP AREA USES:
COMMERCIAL: 249000 sq.m.
RESIDENTIAL: 14800 sq.m.
PUBLIC- SEMI PUBLIC: 42700 sq.m.
Commercial
Open Space
Residential
Public- semi public
LEGEND

Proposed Layout Plan
45

At least 30% residential and 30% commercial/ institutional use of FAR is mandatory in every project within Intense and Standard TOD
Zone
TOD Mixed Use Zone
Housing (30%)
Commercial/Instituional (30%)Other (40%)20%
(C+I)
30%
(R)
50%
3. Minimum Use- Mix Criteria
20%
50%
46

30%
5% 10%
15%
47
3. Minimum Use- Mix Criteria

Minimum 15% of FAR for all TOD projects to be allocated to rental or for-sale housing with unit sizes no larger than 25sq.m. Of this, minimum 5% should be of one of the following types:
i. Units with only kitchen and no attached toilets. Toilets to be provided as a shared facility on every floor, segregated for male and female.
ii. Units with shared kitchen and dining space as well as shared toilet facilities. Maximum 8 units to a shared kitchen and toilet/ bathing facility.
iii. Dormitories with shared toilets and kitchens. iv. Hostels v. Daily rental homes, which may be rented in shifts.
REMAINING MIXED USE 70%
UNIT SIZE 40Sq.m. 15%
OTHER
UNITS=25SQ.M 10%
HOUSING TYPE AS SPECIFIED ABOVE
5% UNIT SIZE
25Sq.m. 15%
48
3. Minimum Use- Mix Criteria

PROPOSAL:
REVISED LAYOUT PLAN

Proposed Layout Plan
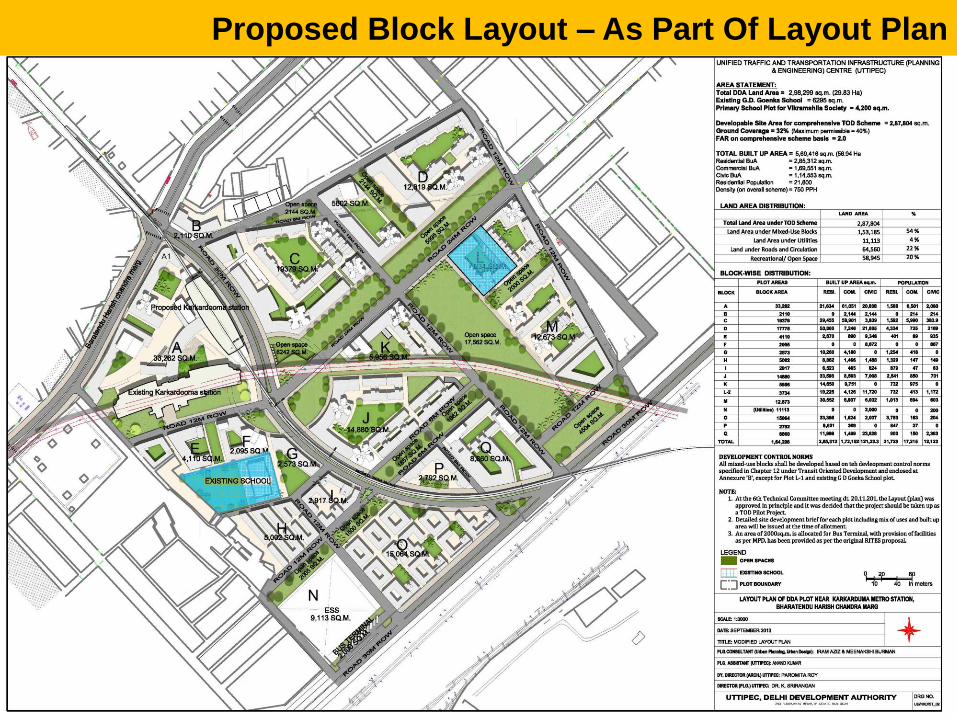
Proposed Block Layout – As Part Of Layout Plan

Zoning Of Uses In Relation To Context- Commercial
HIGH END RETAIL
SHOWROOMS
COMMERCIAL TOWERS & SERVICE APARTMENT
SERVICE MARKET
CONVIENIENT SHOPPING
LIVE WORK
Frontage criteria for locating commercial retail &
towers
Live work As interface between commercial
and residential units
Convenience shopping Scattered in small proportions
throughout the development
Service market along Secondary road

Zoning of uses in relation to context- Civic
School & Art District Civic amenities as an interface between new and existing community
Hospital Accessibility criteria located on plot next to Zonal Plan roads
College Proximity to existing institutional areas.

Zoning of uses in relation to context- Residential
Transit village zone Proximity to existing EWS
housing
Towers
Along side open spaces
Town homes
Along road side

© UTTIPEC, Delhi Development Authority
View of Plot-A from Vikas Marg
55

D
F G
J
K
L
H
I
N
O
Q
M
C
B
P
E
A
Plot-C Detail
A
D
F G
J
K
L
H
I
N
O
Q
M
C
B
P
E

Ground floor Plan – Plot-C
Locations that may be gated at night

Ground floor Plan – Plot-C
Private Green area with tot-lots etc.

First floor Plan
Residential
Office
Retail
Service apartment
Civic

Residential
Office
Retail
Service apartment
Civic
Second floor Plan

Residential
Office
Retail
Service apartment
Civic
Third floor Plan

Residential
Office
Retail
Service apartment
Civic
4th to 8th Typical floor Plan

Residential
Office
Retail
Service apartment
Civic
Roof Plan

Commercial Typology

Traffic Impact Assessment

TOD Walking Zone – 500 m
TOD NMT Zone – 1500 m
66

67
• Presents Existing Traffic Data at Junctions and Roads
• Signal control
• Flyovers
• Rail Constraints
• Potentials – Metro Stations / Anand Vihar Terminal
Existing Transport Conditions and Data Collection
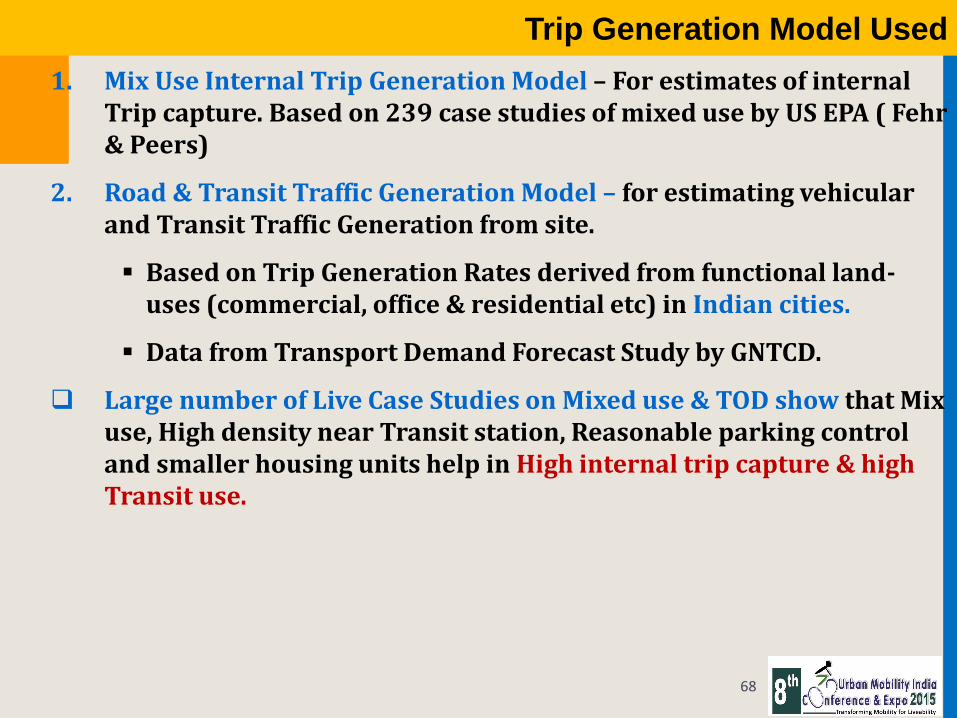
1. Mix Use Internal Trip Generation Model – For estimates of internal Trip capture. Based on 239 case studies of mixed use by US EPA ( Fehr & Peers)
2. Road & Transit Traffic Generation Model – for estimating vehicular and Transit Traffic Generation from site.
Based on Trip Generation Rates derived from functional land-uses (commercial, office & residential etc) in Indian cities.
Data from Transport Demand Forecast Study by GNTCD.
Large number of Live Case Studies on Mixed use & TOD show that Mix use, High density near Transit station, Reasonable parking control and smaller housing units help in High internal trip capture & high Transit use.
68
Trip Generation Model Used

Trip Generation Model Results
69
Mix Use Trip Generation Model Results
1. Mix land-use scenario provides 27 percent internal trips capture. Single use provides 8 percent trip capture.
2. About 19 percent more internal trips in Mixed use
Road & Transit Traffic Generation Model Results
1. Vehicular Trips estimated as 3659 PCUs requiring additional 2x2 lane road.
2. Transit Trips estimated as additional 5533 PHPDT requiring adequate metro frequency, coaches and BRT development .

70
Generated Road Traffic Impacts on Network
1. Site is surrounded by Railway line and there is single Road for site access.
2. The assignment of generated traffic on network indicates that existing Road & junction capacities are not adequate to handle additional traffic.
3. New 2x2 lane Road shall be built with extra connection in surrounding network for distributing generated traffic to larger area
Road & Transit Traffic Generation Model Results
1. Enhanced Metro Frequency, extra coaches
2. Dedicated Bus lanes in new Road and connectivity with surrounding BRT Network.
3. Control of Car use by limited & market-priced provision of Parking.
Impacts

ZDP proposed road to be constructed

Feasibility Aspect – Undergrounding HT Lines
220 KV
400 KV
SUB STATION
72

Feasibility – Alignment & Connectivity
Connectivity with Road No. 56
Connectivity with Karkari Mor Road
73

Decentralized Infrastructure
Water Supply & Sewage Treatment

ORIGINAL
Water provided by Delhi Jal Board: 2.7 mld
27000 population: Water required (potable) – 2.4 mld BUA residential (12.5 m2 per person – NBC) – 337000 m2
No of Dwelling units (5 person per unit): 27000/5 = 5400 dwelling units Dwelling unit per ha: Total Dwelling unit/Total Ha: 5400/30 = 180 DU/HA
As per Delhi norms: 27000/4.5 = 6000
Dwelling unit as per Delhi norms: 200 DU/HA
34600 commercial population: Water required (potable) – 0.9 mld
Total Water demand: 2.4 + 0.9 = 3.3 mld Deficit: 3.3 – 2.7 = 0.6 mld
Total Demand: 5.7 mld (both potable and non potable) We want: 3.3 mld (Potable)
Projected Water Demand

Projected Water Demand
27000 commercial population: Water required (potable) – 0.9 mld
Potable water available for residential – 1.8 mld Total population that can use 1.8 mld of potable water for residential
purpose: 21000 people Total BUA would be (12.5m2 per person – NBC): 262500 m2
Dwelling unit (NBC): 21000/5 = 4200
Dwelling unit per unit HA: 4000/30 = 140
Dwelling unit (Delhi norms) 21000/4.5 = 4600 Dwelling unit per unit HA: 4600/30 = 153 DU/HA
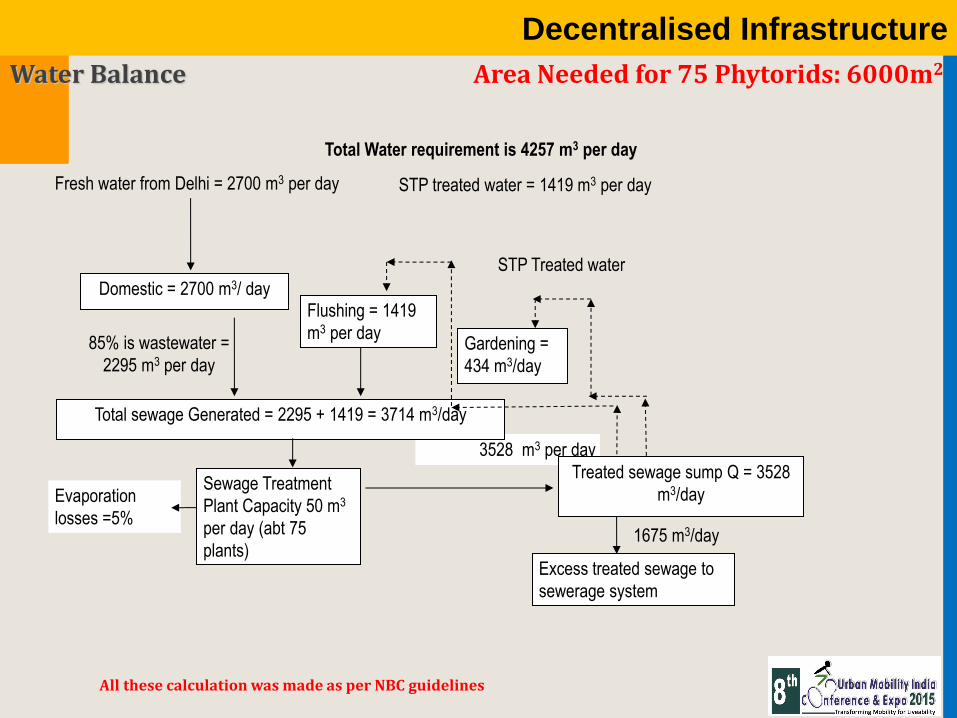
Decentralised Infrastructure
Water Balance
All these calculation was made as per NBC guidelines
Total Water requirement is 4257 m3 per day
Domestic = 2700 m3/ day Flushing = 1419
m3 per day Gardening =
434 m3/day
Total sewage Generated = 2295 + 1419 = 3714 m3/day
Evaporation
losses =5%
Fresh water from Delhi = 2700 m3 per day
Sewage Treatment
Plant Capacity 50 m3
per day (abt 75
plants)
STP treated water = 1419 m3 per day
STP Treated water
3528 m3 per day
85% is wastewater =
2295 m3 per day
Treated sewage sump Q = 3528
m3/day
Excess treated sewage to
sewerage system
1675 m3/day
Area Needed for 75 Phytorids: 6000m2

Power
Energy Conservation Strategies
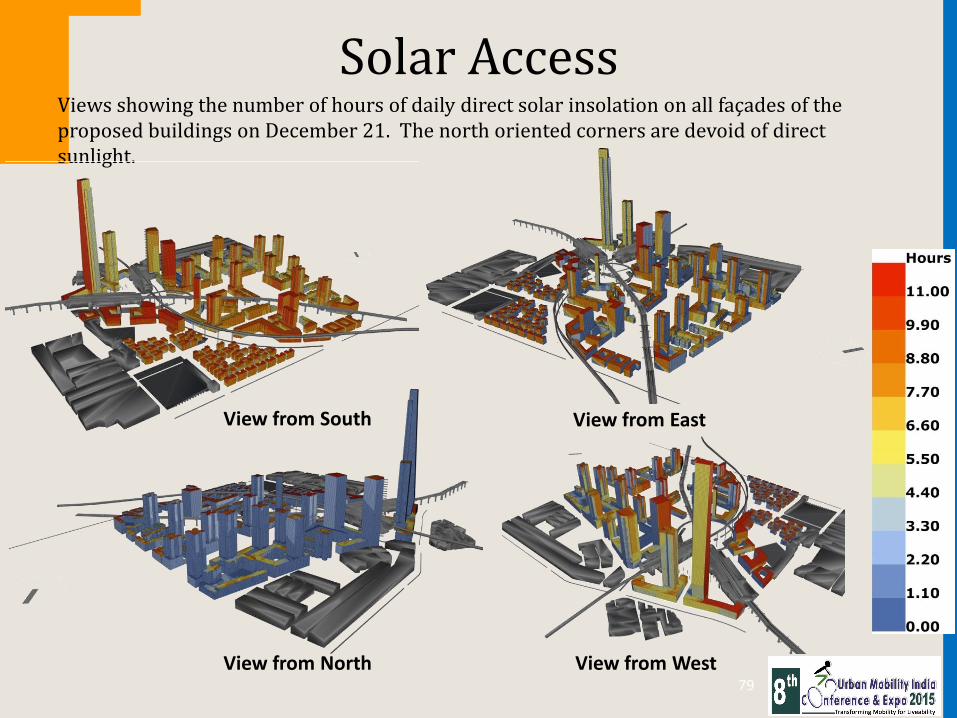
Views showing the number of hours of daily direct solar insolation on all façades of the proposed buildings on December 21. The north oriented corners are devoid of direct sunlight.
Solar Access
View from South View from East
View from North View from West 79

Resi. Towers Rotated to facilitate all homes receiving min. 2-hour sunlight

Solid Waste Management Strategy

Solid Waste Management Strategy
Waste generated Commercial Population: 27000 Residential Population: 21000
Total waste (kg/day) 37128.0
Total waste (Tons/day) 37.1
Total organic waste (40%) (Tons/day) 14.9
Paper (27%) (Tons/day) 10.0
Textile (4%) (Tons/day) 1.5
Plastic and rubber (4%) (Tons/day) 1.5
metal (3%) (Tons/day) 1.1
Glass and ceramics (5%) (Tons/day) 1.9
Innert (15%) (Tons/day) 5.6

Treatment- Briquetting
Solid waste
Segregated organic waste
Biogas plant digester
Biogas storage (power or electricity)
Non biodegradable waste
Briquettes
Innert
Secured Landfill
Sold at Rs. 2000 per ton
After they are compressed, total volume of dry waste reduced to 10% of its original volume. Calorific value of briquette is about 3000 – 3700 kcal.
Scenario 1 (Dry waste: 10.8 tons/day): Reduced volume to 1.1 tons of briquettes Sold at Rs. 2000 per ton: 2000 x 1.1 = Rs. 2200 per day Scenario 2 (Dry waste: 16 tons/day): Reduced volume to 1.6 tons of briquettes Sold at Rs. 2000 per ton: 2000 x 1.6 = Rs. 3200 per day

Treatment- Bio-Gas
Capacity: 5.5 tons/day Number needed: 3 Total Area needed: 1050 m2
Total methane: 1200 m3
LPG equivalent: 13200 kg/month Electricity Equivalent: 47100 unit/month Installation cost (per unit) Rs. 5.5 cr (for LPG) Rs. 6.8 cr (for Electricity) Profit Taking Rs. 450 per 14 kg of LPG; earning from 13200 kg would be 4.2 lakhs per month Taking cost of electricity Rs. 5 per unit; saving from 47100 unit would be 2.4 lakhs per month
Financial Feasibility Study

METHODOLOGY
Overview of Subject Region
and its Influence
Zone
Macro Market
Assessment of Core
Real Estate Sectors
in the Region
Real Estate Market Assessment
- Residential
- Commercial
- Retail
- Hospitality
Review of Present Development Control
Regulations & Proposed TOD Norms
Demand Perception Assessment
Validation of Proposed Product Mix
Pricing Strategy for Various Proposed Asset Classes
- Financial Feasibility of Proposed Base Product Scenario
- Scenario Iteration to assess Opportunity for Cross Subsidization : Infrastructure, Amenities & Affordable Housing
Suggestions & Recommendations
Project Description: Methodology
86

87
88

Circular Skywalk connecting destinations to Metro
THANKS