Embed Size (px)
Citation preview

Transit Agency Survey Preliminary Results
ACT Workgroup Meeting August 29, 2016
1
California Environmental Protection Agency
Air Resources Board

About the survey • Purpose:
– To gather information about operations of transit systems and fleet characteristics at different divisions or depots
– To help ARB better estimate individual fleet costs and understand potential barriers to deploying zero emission buses
• Content: – Part A: information about the transit agency – Part B: information about each division
• Distribution: – March 2016 to over 150 transit agencies
• Link: – http://www.arb.ca.gov/msprog/bus/transitsurvey032016.docx
2

Overview • Transit Agency Questions
– Bus purchase (cycle, method, recent and expected purchases) – Fuel procurement (yearly contracts, spot market, utility, off-site) – LCFS participation – Enhanced mobility programs
• Division Specific Questions – Division characteristics (location, parcel size, bus capacity) – Operation & routes (peak/base ratio, park/dispatch, bus number
and type, daily mileage distribution) – Electricity use (utility provider, on-site production, back-up
system) – Fueling infrastructure, costs, and recent improvements
August 29, 2016 3

Acknowledgement of Survey Respondents
4
AC Transit Long Beach TransitAnaheim Transportation Network Los Angeles County Metropolitan Transit AuthorityAntelope Valley Transit Authority North County Transit DistrictCity of Clovis Transit Orange County Transportation AuthorityCity of Culver Palo Verde Valley Transit AuthorityCity of Gardena’s GTrans Placer County Transit ServicesCity of Glendora Riverside Transit AgencyCity of Modesto San Benito County Local Transportation AuthorityColusa County Transit Agency San Diego Metropolitan Transit System County of Trinity/Trinity Transit San Mateo County Transit District Eastern Contra Costa Transit Authority Santa Monica Big Blue BusEl Dorado County Transit Authority Santa Rosa CityBusFoothill Transit Santa Ynez Valley TransitFresno County Rural Transit Agency Siskiyou County TransitGlendale Beeline Solano County Transit (SolTrans)Golden Empire Transit District Victor Valley Transit AuthorityGolden Gate Transit Western Contra Costa Transit AuthorityHumboldt Transit Authority Yuba-Sutter Transit AuthorityLivermore Amador Valley Transit Authority

Respondent Profile: Location
5
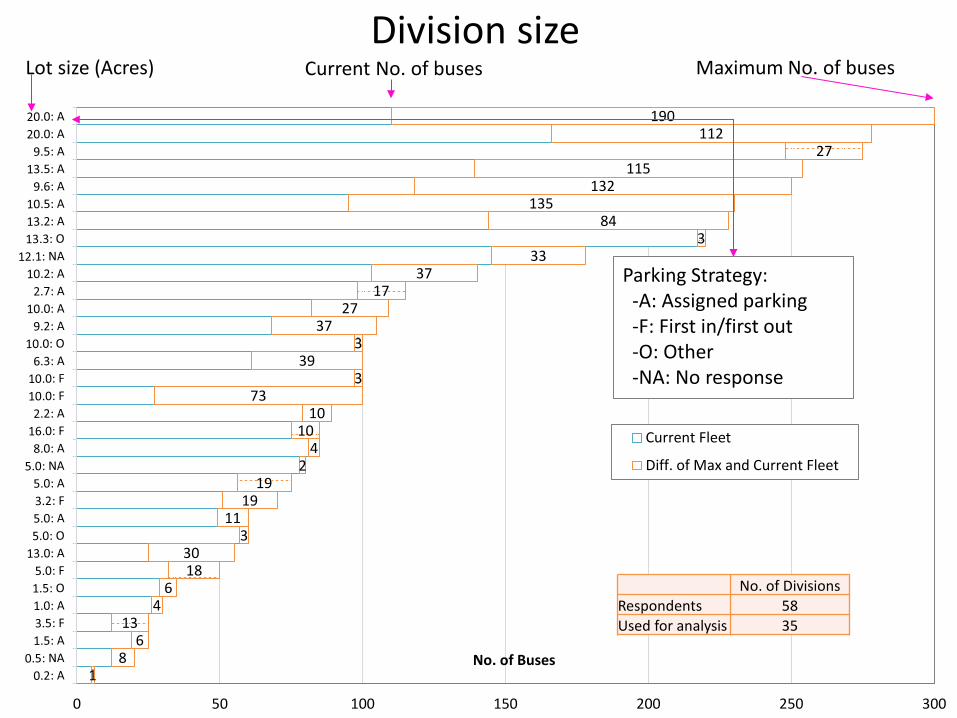
Division size
6 1 8
6 13
4 6
18 30
3 11
19 19
2 4
10 10
73 3
39 3
37 27
17 37
33 3
84 135
132 115
27 112
190
0 50 100 150 200 250 300
No. of Buses
Current Fleet
Diff. of Max and Current Fleet
No. of Divisions Respondents 58 Used for analysis 35
Parking Strategy: -A: Assigned parking -F: First in/first out -O: Other -NA: No response
Current No. of buses Maximum No. of buses Lot size (Acres)

Daily Mileage Distribution Standard Buses and Cutaways
7
9% 7%
49%
22%
14% 13%
25%
30% 30%
1% 0.0%
10.0%
20.0%
30.0%
40.0%
50.0%
60.0%
Spares <100 miles 100-149 miles 150-199 miles >200 miles
Standard Bus
Cutaway
Data from: 37 Transits 4591 Standard Buses 761 Cutaways

Daily Mileage for Standard Bus by Fleet Size
8
9% 7%
49%
22%
14%
8% 6%
49%
23%
14%
11%
17%
51%
11% 9%
17%
33%
39%
0%
11%
0.0%
10.0%
20.0%
30.0%
40.0%
50.0%
60.0%
Standard Spares Standard <100 Miles Standard 100-149 Miles Standard 150-199 Miles Standard >200 Miles
All Fleets- 37 Transits, 4951 buses
Transits >100 vehicles- 12 Transits, 4463 buses
Transits 50-99 vehicles- 12 Transits, 404 buses
Transits <50 vehicles-13 Transits, 84 buses
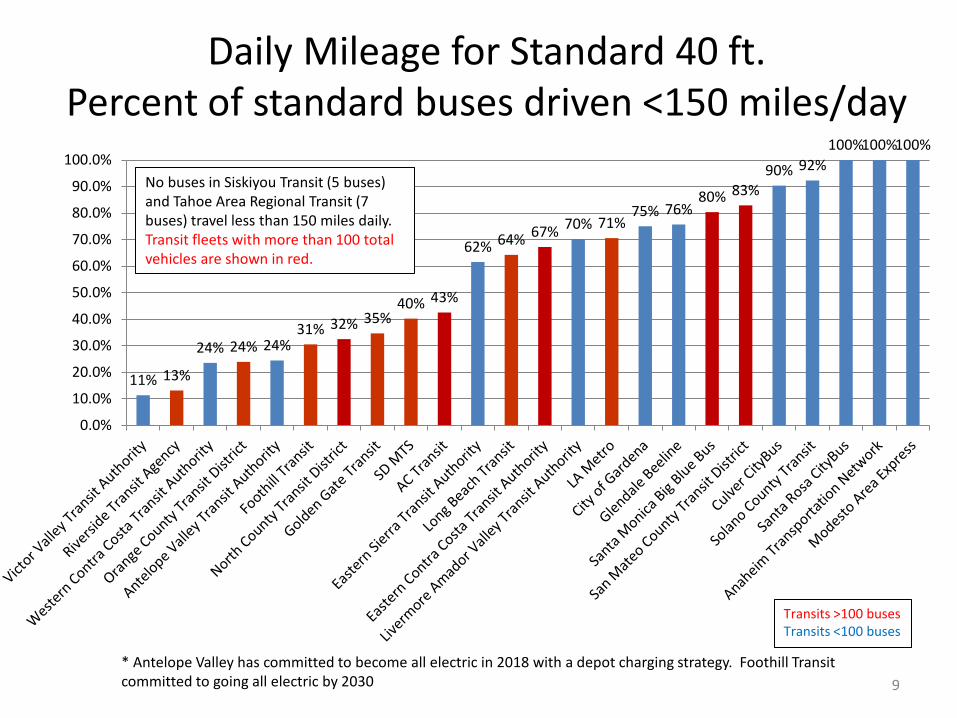
Daily Mileage for Standard 40 ft. Percent of standard buses driven <150 miles/day
9 * Antelope Valley has committed to become all electric in 2018 with a depot charging strategy. Foothill Transit committed to going all electric by 2030
11% 13%
24% 24% 24% 31% 32% 35%
40% 43%
62% 64% 67% 70% 71% 75% 76%
80% 83% 90% 92%
100% 100% 100%
0.0%
10.0%
20.0%
30.0%
40.0%
50.0%
60.0%
70.0%
80.0%
90.0%
100.0%
Transits >100 buses Transits <100 buses
No buses in Siskiyou Transit (5 buses) and Tahoe Area Regional Transit (7 buses) travel less than 150 miles daily. Transit fleets with more than 100 total vehicles are shown in red.

LCFS Program Participation
10
No. of Agencies Respondents 36 Used for analysis 36
CNG/LNG, 5
CNG/LNG, 16
Diesel /Gasoline, 11
Hydrogen, 1 Electricity, 2
CNG + Electricity, 1
0
5
10
15
20
25
30
Yes No
No.
of A
genc
ies

23
6
1
3
0
2 1
0
5
10
15
20
25
1 2 3 4 5 6 7
No.
of A
genc
ies
Years between next and last purchase
Bus Purchase Frequency
11
No. of Agencies Respondents 36 Used for analysis 36

Past and Planned Bus Purchases
12
49
70 299
0
50
100
150
200
250
300
350
2016 2017 2018 2019 2020 2021 2022
No.
of B
uses
Orange County Transportation AuthorityGolden Gate TransitAC TransitOthers
Last purchase Next purchase
No. of Agencies No. of Buses (Last Purchase) No. of Buses (Next Purchase) Respondents 36 NA NA Used for analysis 29 701 690
96
73
207
0
50
100
150
200
250
300
350
2010 2011 2012 2013 2014 2015 2016
No.
of B
uses
Orange County Transportation AuthorityRiverside Transit AgencyAC TransitOthers

Year of Installation for NG Infrastructure
13
No. of Divisions Respondents 25 Used for analysis 24
0
1
2
3
4
5
6
7
No.
of D
ivis
ions
LNG CNG

Survey Results Summary
• Responses represent about 50 percent of the buses in the State
• Helps identify fleets with higher likelihood to have operational barriers
• Plan to meet with individual transits to learn more • Information about fuel costs, and existing
infrastructure to be assessed in case studies • Plan to follow-up with respondents about incomplete
information or apparent discrepancies • We are still accepting surveys
14


![Section 1. Transit Agency Information · Web viewExample:[Transit System]’s Public Transportation Agency Safety Plan also referred to as Agency Safety Plan, will be jointly reviewed](https://img.dokumen.tips/doc/110x75/6095f1b801d5a9076b73d955/section-1-transit-agency-information-web-view-exampletransit-systemas-public.jpg)