Embed Size (px)
Citation preview

Transient Vibration Analysis Insights Into Machinery Behavior
By: Stanley R. Bognatz, P.E.75 Laurel Street, Carbondale, PA 18407
Tel. (570) 282-4947 email: [email protected]
M&B Engineered Solutions, Inc. - 2007www.mbesi.com
1
Transient Speed Vibration AnalysisTransient Speed Vibration AnalysisInsights into Machinery BehaviorInsights into Machinery Behavior
0707--DecDec--20072007
75 Laurel StreetCarbondale, PA 18407
Tel. (570) 282-4947Cell (570) 575-9252
By: By: Stan Bognatz, P.E.Stan Bognatz, P.E.
President & Principal President & Principal EngrEngr..srbsrb@@mbesi.commbesi.com
Rotating Machinery Diagnostics & Instrumentation Solutions for Maintenance That Matterswww.mbesi.com
© 2007 M&B Engineered Solutions, Inc.www.mbesi.com
Transient Vibration Analysis / Vibration Institute MeetingHalifax, NC 07-Dec-2007
2
Ok, analystsOk, analysts . .
What is wrong with this turbine?What is wrong with this turbine?

Transient Vibration Analysis Insights Into Machinery Behavior
By: Stanley R. Bognatz, P.E.75 Laurel Street, Carbondale, PA 18407
Tel. (570) 282-4947 email: [email protected]
M&B Engineered Solutions, Inc. - 2007www.mbesi.com
2
© 2007 M&B Engineered Solutions, Inc.www.mbesi.com
Transient Vibration Analysis / Vibration Institute MeetingHalifax, NC 07-Dec-2007
3
Possibilities Possibilities
What causes a predominant 1X Vibration?What causes a predominant 1X Vibration?UnbalanceUnbalanceMisalignmentMisalignmentRotor ResonanceRotor ResonanceStructural Resonance Structural Resonance RubRubCoupling Lock UpCoupling Lock UpOversize bearingOversize bearingBowed ShaftBowed ShaftHigh 1X Slow Roll / RunoutHigh 1X Slow Roll / RunoutCracked ShaftCracked Shaft
© 2007 M&B Engineered Solutions, Inc.www.mbesi.com
Transient Vibration Analysis / Vibration Institute MeetingHalifax, NC 07-Dec-2007
4
Transient Vibration Analysis Transient Vibration Analysis
Transient Transient SpeedSpeed Vibration AnalysisVibration AnalysisAcquisition & analysis of data taken during startup and shut dowAcquisition & analysis of data taken during startup and shut downnProvides significant insight into the rotor and structural dynamProvides significant insight into the rotor and structural dynamics that ics that cannot be had with only steady state analysiscannot be had with only steady state analysisThis information includes:This information includes:
Unbalance Unbalance Heavy SpotHeavy Spot LocationsLocationsRotor Mode ShapesRotor Mode ShapesShaft Centerline Movement / AlignmentShaft Centerline Movement / AlignmentBearing WearBearing WearShaft RunoutShaft RunoutCritical Speeds / ResonancesCritical Speeds / ResonancesRotor StabilityRotor StabilityBearing WearBearing WearFoundation Deterioration, and othersFoundation Deterioration, and others

Transient Vibration Analysis Insights Into Machinery Behavior
By: Stanley R. Bognatz, P.E.75 Laurel Street, Carbondale, PA 18407
Tel. (570) 282-4947 email: [email protected]
M&B Engineered Solutions, Inc. - 2007www.mbesi.com
3
© 2007 M&B Engineered Solutions, Inc.www.mbesi.com
Transient Vibration Analysis / Vibration Institute MeetingHalifax, NC 07-Dec-2007
5
Transient Data SamplingTransient Data Sampling
This is not This is not PdMPdM data acquisitiondata acquisitionMultiple channels (8 Multiple channels (8 30+)30+)All channels sampled simultaneously & synchronouslyAll channels sampled simultaneously & synchronouslyAll data referenced to a onceAll data referenced to a once--perper--revolution speed / tach signalrevolution speed / tach signal
© 2007 M&B Engineered Solutions, Inc.www.mbesi.com
Transient Vibration Analysis / Vibration Institute MeetingHalifax, NC 07-Dec-2007
6
InstrumentationInstrumentation
What are some instrumentation requirements for transient data? What are some instrumentation requirements for transient data? HereHere s a s a shortshort list of desired abilities for transient data acquisition:list of desired abilities for transient data acquisition:
Minimum channel count of 8, with 16 or more channels preferredMinimum channel count of 8, with 16 or more channels preferredSynchronous sampling of all channelsSynchronous sampling of all channels2 or more tach channels 2 or more tach channels Accurately sample data at low rotor speeds (< 100 rpm)Accurately sample data at low rotor speeds (< 100 rpm)Measures DC Gap Voltages up to Measures DC Gap Voltages up to --24 Vdc24 VdcProduce DCProduce DC--coupled data plots (for shaft centerline & thrust data)coupled data plots (for shaft centerline & thrust data)Provide IEPE / accelerometer power Provide IEPE / accelerometer power Electronically remove low speed shaft runout from atElectronically remove low speed shaft runout from at--speed dataspeed dataDisplay bearing clearances; plot shaft movement with available cDisplay bearing clearances; plot shaft movement with available clearancelearanceSpecify RPM ranges for sampling, and RPM sampling intervalSpecify RPM ranges for sampling, and RPM sampling intervalProduce bode, polar, shaft centerline, and cascade plots for datProduce bode, polar, shaft centerline, and cascade plots for data analysisa analysisTracking filter provides 1X and other programmable vector variabTracking filter provides 1X and other programmable vector variablesles

Transient Vibration Analysis Insights Into Machinery Behavior
By: Stanley R. Bognatz, P.E.75 Laurel Street, Carbondale, PA 18407
Tel. (570) 282-4947 email: [email protected]
M&B Engineered Solutions, Inc. - 2007www.mbesi.com
4
© 2007 M&B Engineered Solutions, Inc.www.mbesi.com
Transient Vibration Analysis / Vibration Institute MeetingHalifax, NC 07-Dec-2007
7
The Need for (Rotor) Speed The Need for (Rotor) Speed
A key (the key) component to successful transient analysis is a A key (the key) component to successful transient analysis is a reliable oncereliable once--perper--revolution tachometer signalrevolution tachometer signalThis signal provides a triggering pulse for the instrument trackThis signal provides a triggering pulse for the instrument tracking filtering filterIt lets us establish a rotor phase angle reference systemIt lets us establish a rotor phase angle reference systemFor machines without a permanent vibration monitoring system, a For machines without a permanent vibration monitoring system, a portable laser tachometer can be used to provide a TTL pulseportable laser tachometer can be used to provide a TTL pulse
We have had excellent results with We have had excellent results with Monarch InstrumentMonarch Instrument s PLTs PLT--200200Observes optically reflective Observes optically reflective tape attached to the shafttape attached to the shaftSenses optical tape Senses optical tape 2525 away feet away feet at angles of at angles of 7070°°!!Clean TTL pulse outputClean TTL pulse outputVery reliable triggerVery reliable triggerUse with ZonicBook/618EUse with ZonicBook/618Ededicated Tach inputs dedicated Tach inputs
© 2007 M&B Engineered Solutions, Inc.www.mbesi.com
Transient Vibration Analysis / Vibration Institute MeetingHalifax, NC 07-Dec-2007
8
The Need for (Rotor) Speed The Need for (Rotor) Speed
Machines with permanent vibration monitoring systems often use aMachines with permanent vibration monitoring systems often use aproximity probe to observe a notch or keyway in the shaftproximity probe to observe a notch or keyway in the shaft
This provides a DC voltage pulse outputThis provides a DC voltage pulse outputSignal must used as an analog tach input on the ZonicBook/618Signal must used as an analog tach input on the ZonicBook/618
Some signals create triggering problems due to signal quality: Some signals create triggering problems due to signal quality: Overshoot / ripple Overshoot / ripple causescausesmultiple triggers per revolutionmultiple triggers per revolutionOverall signal contains anOverall signal contains anAC vibration signal AC vibration signal causes multiple triggerscauses multiple triggersThe bottom of eachThe bottom of eachpulse is not at the pulse is not at the same voltage level same voltage level causes misses samplescauses misses samples

Transient Vibration Analysis Insights Into Machinery Behavior
By: Stanley R. Bognatz, P.E.75 Laurel Street, Carbondale, PA 18407
Tel. (570) 282-4947 email: [email protected]
M&B Engineered Solutions, Inc. - 2007www.mbesi.com
5
© 2007 M&B Engineered Solutions, Inc.www.mbesi.com
Transient Vibration Analysis / Vibration Institute MeetingHalifax, NC 07-Dec-2007
9
The Need for (Rotor) Speed The Need for (Rotor) Speed
If your instrumentation does not properly trigger using Auto tacIf your instrumentation does not properly trigger using Auto tach:h:Try manually adjusting the trigger voltage level to a voltage thTry manually adjusting the trigger voltage level to a voltage that only at only allows the instrument to that voltage level and corresponding slallows the instrument to that voltage level and corresponding slope (+ or ope (+ or --) ) once per revolutiononce per revolutionA trigger setpoint of A trigger setpoint of --2.0 to 2.0 to --3.0 Vdc would work nicely here3.0 Vdc would work nicely here
© 2007 M&B Engineered Solutions, Inc.www.mbesi.com
Transient Vibration Analysis / Vibration Institute MeetingHalifax, NC 07-Dec-2007
10
The Need for (Rotor) Speed The Need for (Rotor) Speed
If reliable triggering cannot be established, a signal conditionIf reliable triggering cannot be established, a signal conditioner such er such as Bently Nevadaas Bently Nevada s TKs TK--15 Keyphasor Conditioner can be used to 15 Keyphasor Conditioner can be used to modify the signalmodify the signalIt can simultaneously It can simultaneously clipclip the top and bottom portions by applying the top and bottom portions by applying bias voltages, thus removing any ripple / overshoot from the pulbias voltages, thus removing any ripple / overshoot from the pulse, se, and producing a more TTLand producing a more TTL--like pulselike pulseThe signal can also be amplifiedThe signal can also be amplified
Transient Vibration Analysis Insights Into Machinery Behavior
By: Stanley R. Bognatz, P.E.75 Laurel Street, Carbondale, PA 18407
Tel. (570) 282-4947 email: [email protected]
M&B Engineered Solutions, Inc. - 2007www.mbesi.com
6
© 2007 M&B Engineered Solutions, Inc.www.mbesi.com
Transient Vibration Analysis / Vibration Institute MeetingHalifax, NC 07-Dec-2007
11
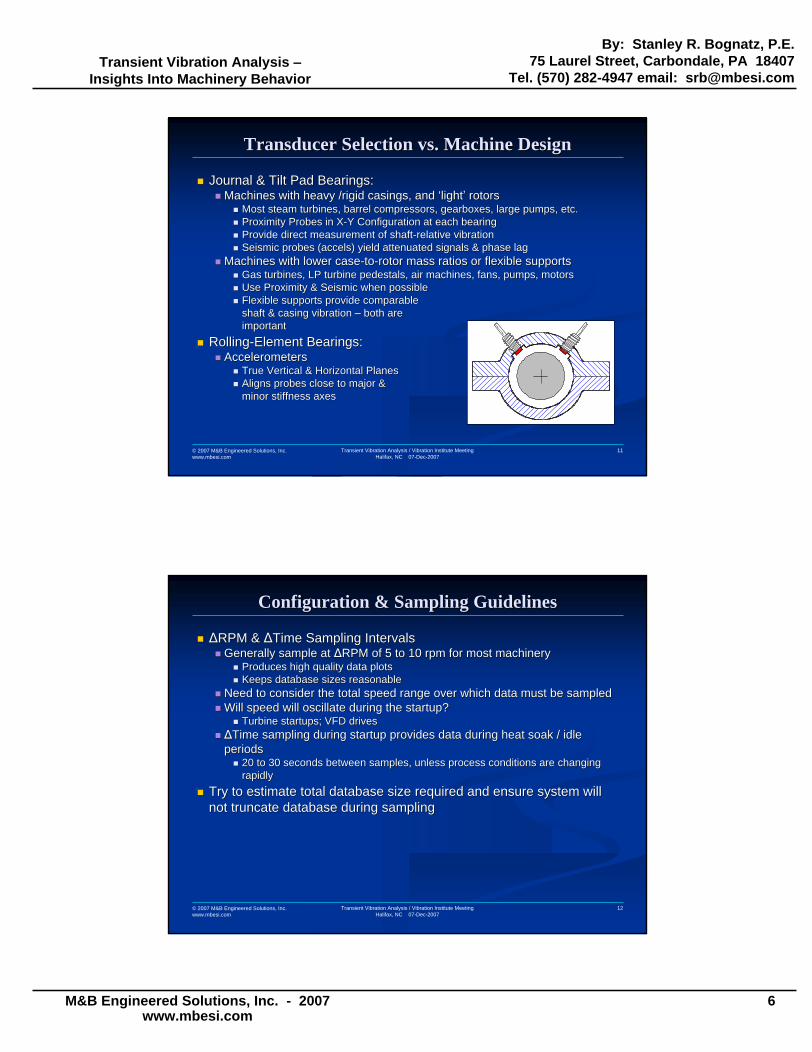
Transducer Selection vs. Machine Design Transducer Selection vs. Machine Design
Journal & Tilt Pad Bearings:Journal & Tilt Pad Bearings:Machines with heavy /rigid casings, and Machines with heavy /rigid casings, and lightlight rotorsrotors
Most steam turbines, barrel compressors, gearboxes, large pumps,Most steam turbines, barrel compressors, gearboxes, large pumps, etc.etc.Proximity Probes in XProximity Probes in X--Y Configuration at each bearingY Configuration at each bearingProvide direct measurement of shaftProvide direct measurement of shaft--relative vibrationrelative vibrationSeismic probes (accels) yield attenuated signals & phase lagSeismic probes (accels) yield attenuated signals & phase lag
Machines with lower caseMachines with lower case--toto--rotor mass ratios or flexible supportsrotor mass ratios or flexible supportsGas turbines, LP turbine pedestals, air machines, fans, pumps, mGas turbines, LP turbine pedestals, air machines, fans, pumps, motorsotorsUse Proximity & Seismic when possibleUse Proximity & Seismic when possibleFlexible supports provide comparableFlexible supports provide comparableshaft & casing vibration shaft & casing vibration both areboth areimportantimportant
RollingRolling--Element Bearings:Element Bearings:AccelerometersAccelerometers
True Vertical & Horizontal PlanesTrue Vertical & Horizontal PlanesAligns probes close to major &Aligns probes close to major &minor stiffness axesminor stiffness axes
© 2007 M&B Engineered Solutions, Inc.www.mbesi.com
Transient Vibration Analysis / Vibration Institute MeetingHalifax, NC 07-Dec-2007
12
Configuration & Sampling Guidelines Configuration & Sampling Guidelines
RPM & RPM & TimeTime Sampling IntervalsSampling IntervalsGenerally sample at Generally sample at RPM of 5 to 10 rpm for most machineryRPM of 5 to 10 rpm for most machinery
Produces high quality data plotsProduces high quality data plotsKeeps database sizes reasonableKeeps database sizes reasonable
Need to consider the total speed range over which data must be sNeed to consider the total speed range over which data must be sampledampledWill speed will oscillate during the startup?Will speed will oscillate during the startup?
Turbine startups; VFD drivesTurbine startups; VFD drivesTimeTime sampling during startup provides data during heat soak / idle sampling during startup provides data during heat soak / idle
periodsperiods20 to 30 seconds between samples, unless process conditions are 20 to 30 seconds between samples, unless process conditions are changing changing rapidlyrapidly
Try to estimate total database size required and ensure system wTry to estimate total database size required and ensure system will ill not truncate database during samplingnot truncate database during sampling

Transient Vibration Analysis Insights Into Machinery Behavior
By: Stanley R. Bognatz, P.E.75 Laurel Street, Carbondale, PA 18407
Tel. (570) 282-4947 email: [email protected]
M&B Engineered Solutions, Inc. - 2007www.mbesi.com
7
© 2007 M&B Engineered Solutions, Inc.www.mbesi.com
Transient Vibration Analysis / Vibration Institute MeetingHalifax, NC 07-Dec-2007
13
Configuration & Sampling Guidelines Configuration & Sampling Guidelines
Fast Ramp Rates Fast Ramp Rates AC Motors AC Motors Induction motor startup will be very fast, accelerating quickly Induction motor startup will be very fast, accelerating quickly and smoothly and smoothly from zero to full speedfrom zero to full speedStartup lasts only 10 Startup lasts only 10 40 seconds after the breaker is closed40 seconds after the breaker is closedCan data acquisition keep pace with the ramp rate?Can data acquisition keep pace with the ramp rate?
3,600 rpm motor; 40 second startup time3,600 rpm motor; 40 second startup time3600 / 40 = 90 rpm 3600 / 40 = 90 rpm per secondper secondAt At RPM = 5, we would be trying to capture = 16 samples per secondRPM = 5, we would be trying to capture = 16 samples per second
What can we expect from our data? What can we expect from our data? Examine data acquisition settings: Examine data acquisition settings:
FmaxFmaxLines of resolutionLines of resolution
ZonicBook/618E: 2,000 Hz Fmax; 1600 LORZonicBook/618E: 2,000 Hz Fmax; 1600 LOR1 sample = 0.8 seconds = 72 rpm change between start and end of 1 sample = 0.8 seconds = 72 rpm change between start and end of samplesampleData smearingData smearing
Fmax = 1,000 Hz; 200 LORFmax = 1,000 Hz; 200 LOR1 sample = 0.2 seconds = 18 rpm1 sample = 0.2 seconds = 18 rpmSet Set RPM at 20 RPM at 20 -- 3030
© 2007 M&B Engineered Solutions, Inc.www.mbesi.com
Transient Vibration Analysis / Vibration Institute MeetingHalifax, NC 07-Dec-2007
14
Transient Data Plot TypesTransient Data Plot Types
BodeBodePolar Polar Shaft Centerline Shaft Centerline Waterfall / CascadeWaterfall / Cascade
Before discussing these data plots, we need to review the importBefore discussing these data plots, we need to review the importance ance of slow roll compensating our 1Xof slow roll compensating our 1X--filtered shaft vibration data to filtered shaft vibration data to remove the effects of runoutremove the effects of runout

Transient Vibration Analysis Insights Into Machinery Behavior
By: Stanley R. Bognatz, P.E.75 Laurel Street, Carbondale, PA 18407
Tel. (570) 282-4947 email: [email protected]
M&B Engineered Solutions, Inc. - 2007www.mbesi.com
8
© 2007 M&B Engineered Solutions, Inc.www.mbesi.com
Transient Vibration Analysis / Vibration Institute MeetingHalifax, NC 07-Dec-2007
15
Slow Roll CompensationSlow Roll Compensation
SlowSlow--roll: mechanical and electrical shaft runout in the target arearoll: mechanical and electrical shaft runout in the target area of of a proximity probea proximity probe
Defects that create a nonDefects that create a non--dynamic dynamic falsefalse vibration signal vibration signal Adds vectorally to the true dynamic vibration at any speedAdds vectorally to the true dynamic vibration at any speedProx probe cannot distinguish between runout and true vibration Prox probe cannot distinguish between runout and true vibration
We need to electronically remove slow roll for accurate resultsWe need to electronically remove slow roll for accurate resultsFor most turboFor most turbo--machinery:machinery:
Sample vibration at low speeds, typically below 300 rpmSample vibration at low speeds, typically below 300 rpmReasonably sure there will be little dynamic shaft motionReasonably sure there will be little dynamic shaft motionThe measured signal will contain the runout of the probe target The measured signal will contain the runout of the probe target areaarea
Most data acquisition systems allow runout signal to be store anMost data acquisition systems allow runout signal to be store and d then digitally subtract it from any atthen digitally subtract it from any at--speed vibrationspeed vibrationThe differences can be dramaticThe differences can be dramatic ..
© 2007 M&B Engineered Solutions, Inc.www.mbesi.com
Transient Vibration Analysis / Vibration Institute MeetingHalifax, NC 07-Dec-2007
16
Slow Roll CompensationSlow Roll Compensation
TimeTime--waveform plotwaveform plotUncompensatedUncompensated
Dominant 1X signal, some 2XDominant 1X signal, some 2XCompensatedCompensated
Significant 2XSignificant 2X
Different conclusions?Different conclusions?

Transient Vibration Analysis Insights Into Machinery Behavior
By: Stanley R. Bognatz, P.E.75 Laurel Street, Carbondale, PA 18407
Tel. (570) 282-4947 email: [email protected]
M&B Engineered Solutions, Inc. - 2007www.mbesi.com
9
© 2007 M&B Engineered Solutions, Inc.www.mbesi.com
Transient Vibration Analysis / Vibration Institute MeetingHalifax, NC 07-Dec-2007
17
Slow Roll CompensationSlow Roll Compensation
Selecting the Correct Slow Roll Speed Range on a Bode PlotSelecting the Correct Slow Roll Speed Range on a Bode PlotLook for low speed region with constant amplitude and phaseLook for low speed region with constant amplitude and phaseThis ensures we are not including any This ensures we are not including any truetrue dynamic activitydynamic activity
Effect on Bode plotEffect on Bode plotCannot predict how the bode plot will look like after compensatiCannot predict how the bode plot will look like after compensationonAmplitude should be near zero at the speed the slow roll was samAmplitude should be near zero at the speed the slow roll was sampledpled
© 2007 M&B Engineered Solutions, Inc.www.mbesi.com
Transient Vibration Analysis / Vibration Institute MeetingHalifax, NC 07-Dec-2007
18
Slow Roll CompensationSlow Roll Compensation
Polar Plot CompensationPolar Plot CompensationSlow roll vector merely moves the entire plotSlow roll vector merely moves the entire plotShapeShape of the data (polar loops) not changedof the data (polar loops) not changed
Can be done visuallyCan be done visuallyProperly compensated plot will begin at zero amplitudeProperly compensated plot will begin at zero amplitude

Transient Vibration Analysis Insights Into Machinery Behavior
By: Stanley R. Bognatz, P.E.75 Laurel Street, Carbondale, PA 18407
Tel. (570) 282-4947 email: [email protected]
M&B Engineered Solutions, Inc. - 2007www.mbesi.com
10
© 2007 M&B Engineered Solutions, Inc.www.mbesi.com
Transient Vibration Analysis / Vibration Institute MeetingHalifax, NC 07-Dec-2007
19
Transient Data Transient Data Bode PlotsBode Plots
Bode plots typically show the 1X vector response in XBode plots typically show the 1X vector response in X--Y formatY formatFiltered AmplitudeFiltered AmplitudePhase Lag AnglePhase Lag AngleRotor Speed Rotor Speed
© 2007 M&B Engineered Solutions, Inc.www.mbesi.com
Transient Vibration Analysis / Vibration Institute MeetingHalifax, NC 07-Dec-2007
20
Bode PlotsBode Plots
They help provide the following information:They help provide the following information:Slow roll speed range & slow roll vector valuesSlow roll speed range & slow roll vector valuesThe location of the The location of the High SpotHigh Spot , i.e., the rotor, i.e., the rotor s vibration responses vibration responseThe location of the The location of the Heavy SpotHeavy Spot , i.e., the physical location of a residual , i.e., the physical location of a residual unbalance on the rotorunbalance on the rotorAmplitude, phase & frequency of rotor and structural resonancesAmplitude, phase & frequency of rotor and structural resonancesThe presence of The presence of splitsplit resonancesresonancesAmplification Factor, Damping Ratio & Separation Margin for a reAmplification Factor, Damping Ratio & Separation Margin for a resonancesonance

Transient Vibration Analysis Insights Into Machinery Behavior
By: Stanley R. Bognatz, P.E.75 Laurel Street, Carbondale, PA 18407
Tel. (570) 282-4947 email: [email protected]
M&B Engineered Solutions, Inc. - 2007www.mbesi.com
11
© 2007 M&B Engineered Solutions, Inc.www.mbesi.com
Transient Vibration Analysis / Vibration Institute MeetingHalifax, NC 07-Dec-2007
21
Heavy Spot~90°
Resonance 3.39 mils at 1,810 rpm
181° Phase at Resonance
Bode PlotsBode Plots
Resonance informationResonance informationAmplitude Amplitude peaks at resonance peaks at resonance Phase Phase must show a 90 degree shift from low speedmust show a 90 degree shift from low speed
Starting point can be difficult to determine if other modes are Starting point can be difficult to determine if other modes are presentpresentFrequency (rpm)Frequency (rpm)
© 2007 M&B Engineered Solutions, Inc.www.mbesi.com
Transient Vibration Analysis / Vibration Institute MeetingHalifax, NC 07-Dec-2007
22
Phase Response
Bode PlotsBode Plots
The The High SpotHigh Spot = the measured 1X vibration response = the measured 1X vibration response Changes as a function of speedChanges as a function of speed
The The Heavy SpotHeavy Spot = physical location residual rotor unbalance= physical location residual rotor unbalanceHopefully doesnHopefully doesn t change t change Relationship to High Spot depends on whether the rotor operates Relationship to High Spot depends on whether the rotor operates below, below, near, or above its resonance near, or above its resonance
High Spot
Heavy Spot~90°

Transient Vibration Analysis Insights Into Machinery Behavior
By: Stanley R. Bognatz, P.E.75 Laurel Street, Carbondale, PA 18407
Tel. (570) 282-4947 email: [email protected]
M&B Engineered Solutions, Inc. - 2007www.mbesi.com
12
© 2007 M&B Engineered Solutions, Inc.www.mbesi.com
Transient Vibration Analysis / Vibration Institute MeetingHalifax, NC 07-Dec-2007
23
High Spot
Heavy Spot~90°
Resonance 3.39 mils at 1,810 rpm
181° Phase at Resonance
N1 ~1,750 rpm N2 ~1,870 rpm3.39 x .707 = 2.4 mils 2.4 mils
AF = 1810 / (1870-1750)AF1 = 15.1 !!
Bode PlotsBode Plots
Amplification Factor (AF) a measure of damping for any modeAmplification Factor (AF) a measure of damping for any modeAPI HalfAPI Half--Power Bandwidth Method:Power Bandwidth Method:
Multiply (peak amplitude x 0.707)Multiply (peak amplitude x 0.707)Determine corresponding speeds N1 & N2 == halfDetermine corresponding speeds N1 & N2 == half--power bandwidthpower bandwidthAF = resonance frequency divided by halfAF = resonance frequency divided by half--power bandwidthpower bandwidth
© 2007 M&B Engineered Solutions, Inc.www.mbesi.com
Transient Vibration Analysis / Vibration Institute MeetingHalifax, NC 07-Dec-2007
24
High Spot
Heavy Spot~90°
Resonance 3.39 mils at 1,810 rpm
181° Phase at Resonance
3.39 x .707 = 2.4 milsN1 ~1,750 rpm N2 ~1,870 rpm
2.4 mils
AF = 1810 / (1870-1750)AF1 = 15.1 !!
Bode PlotsBode Plots
Amplification factor API guidelines:Amplification factor API guidelines:< 2.5 = Critically damped; essentially no resonance seen< 2.5 = Critically damped; essentially no resonance seen< 5.0 = very good< 5.0 = very good< 8.0 = still acceptable< 8.0 = still acceptable8 8 10 = marginal10 = marginal> 10 = poorly damped> 10 = poorly damped

Transient Vibration Analysis Insights Into Machinery Behavior
By: Stanley R. Bognatz, P.E.75 Laurel Street, Carbondale, PA 18407
Tel. (570) 282-4947 email: [email protected]
M&B Engineered Solutions, Inc. - 2007www.mbesi.com
13
© 2007 M&B Engineered Solutions, Inc.www.mbesi.com
Transient Vibration Analysis / Vibration Institute MeetingHalifax, NC 07-Dec-2007
25
Bode PlotsBode Plots
High Spot
Heavy Spot~90°
Resonance 3.39 mils at 1,810 rpm
181° Phase at Resonance
3.39 x .707 = 2.4 milsN1 ~1,750 rpm N2 ~1,870 rpm
2.4 mils
AF = 1810 / (1870-1750)AF1 = 15.1 !!
SM = (3600 1810) / 3600SM = 49.7%
Running Speed =3,600 rpm
Separation Margin Separation Margin -- API guidelines:API guidelines:AF < 2.5: critically damped; no SM required.AF < 2.5: critically damped; no SM required.AF = 2.5 AF = 2.5 -- 3.55: SM of 15% above MCS & 5% below MOS3.55: SM of 15% above MCS & 5% below MOSAF > 3.55 & resonance peak < MOS:AF > 3.55 & resonance peak < MOS:
SM (%MOS) = 100 SM (%MOS) = 100 -- {84 + [6/(AF{84 + [6/(AF--3)]}3)]}AF > 3.55 & resonance peak > trip speed: AF > 3.55 & resonance peak > trip speed:
SM (%MCS) = {126 SM (%MCS) = {126 -- [6/(AF [6/(AF -- 3)]} 3)]} -- 100 100
© 2007 M&B Engineered Solutions, Inc.www.mbesi.com
Transient Vibration Analysis / Vibration Institute MeetingHalifax, NC 07-Dec-2007
26
Polar Plots Polar Plots
Polar plots (Nyquist diagrams) present the same information as bPolar plots (Nyquist diagrams) present the same information as bode ode plots, graphing amplitude, phase, and frequencyplots, graphing amplitude, phase, and frequencyData is plotted in polar (circular) coordinatesData is plotted in polar (circular) coordinatesDirection of rotationDirection of rotation
Probe angle
Rotation
Phase Angle
Amplitude

Transient Vibration Analysis Insights Into Machinery Behavior
By: Stanley R. Bognatz, P.E.75 Laurel Street, Carbondale, PA 18407
Tel. (570) 282-4947 email: [email protected]
M&B Engineered Solutions, Inc. - 2007www.mbesi.com
14
© 2007 M&B Engineered Solutions, Inc.www.mbesi.com
Transient Vibration Analysis / Vibration Institute MeetingHalifax, NC 07-Dec-2007
27
Polar Plots Polar Plots
Key advantages over bode plots:Key advantages over bode plots:Easier data interpretation Easier data interpretation -- resonances appears as loops resonances appears as loops Plot is oriented to the vibration probe & referenced to machine Plot is oriented to the vibration probe & referenced to machine casingcasingSlow roll compensation is easily performed, even visuallySlow roll compensation is easily performed, even visuallyIncorrect compensation is easily identifiedIncorrect compensation is easily identifiedThe High Spot and Heavy Spot have immediate physical meaning, beThe High Spot and Heavy Spot have immediate physical meaning, being ing directly transferable from the plot to the machine.directly transferable from the plot to the machine.We can easily identify the 1st and 2nd rotor modes and determineWe can easily identify the 1st and 2nd rotor modes and determine the the ideal locations / planes for balance weightsideal locations / planes for balance weightsStructural resonances are easy to identifyStructural resonances are easy to identifySpeed normally increases opposite the direction of rotation, proSpeed normally increases opposite the direction of rotation, providing viding precessional informationprecessional information
© 2007 M&B Engineered Solutions, Inc.www.mbesi.com
Transient Vibration Analysis / Vibration Institute MeetingHalifax, NC 07-Dec-2007
28
Polar PlotsPolar Plots
Resonances (rotor & structural) appear as loops Resonances (rotor & structural) appear as loops Same amplitude peak and 90 degree phase change as bode plotSame amplitude peak and 90 degree phase change as bode plotLoop is easier to identify than bode plot activityLoop is easier to identify than bode plot activityStructural resonances appear as small inner loopsStructural resonances appear as small inner loops
90°

Transient Vibration Analysis Insights Into Machinery Behavior
By: Stanley R. Bognatz, P.E.75 Laurel Street, Carbondale, PA 18407
Tel. (570) 282-4947 email: [email protected]
M&B Engineered Solutions, Inc. - 2007www.mbesi.com
15
© 2007 M&B Engineered Solutions, Inc.www.mbesi.com
Transient Vibration Analysis / Vibration Institute MeetingHalifax, NC 07-Dec-2007
29
Polar PlotsPolar Plots
Heavy Spot, High Spot, and the Heavy Spot, High Spot, and the BalancingBalancing--TTHeavy Spot for any resonance located in the direction the polar Heavy Spot for any resonance located in the direction the polar loop startsloop startsHeavy Spot should be 90 degrees Heavy Spot should be 90 degrees with rotationwith rotation from the resonance peakfrom the resonance peakPhase angle well above resonance should approach 180 from Heavy Phase angle well above resonance should approach 180 from Heavy Spot, and be 90 degrees Spot, and be 90 degrees against rotationagainst rotation from the resonance peakfrom the resonance peak
Heavy Spot
Resonance
Balance Weight
© 2007 M&B Engineered Solutions, Inc.www.mbesi.com
Transient Vibration Analysis / Vibration Institute MeetingHalifax, NC 07-Dec-2007
30
Polar PlotsPolar Plots
Heavy Spot, High Spot, and the Heavy Spot, High Spot, and the BalancingBalancing--TTThe Low Speed, Resonance, and High Speed data should all lead toThe Low Speed, Resonance, and High Speed data should all lead toessentially the same balance weight location.essentially the same balance weight location.
Heavy Spot
Resonance
Balance Weight

Transient Vibration Analysis Insights Into Machinery Behavior
By: Stanley R. Bognatz, P.E.75 Laurel Street, Carbondale, PA 18407
Tel. (570) 282-4947 email: [email protected]
M&B Engineered Solutions, Inc. - 2007www.mbesi.com
16
© 2007 M&B Engineered Solutions, Inc.www.mbesi.com
Transient Vibration Analysis / Vibration Institute MeetingHalifax, NC 07-Dec-2007
31
Why Do Resonances Occur?Why Do Resonances Occur?
Unbalance creates a CG that is not coincident with the geometricUnbalance creates a CG that is not coincident with the geometric centercenterAt low speeds, shaft rotation occurs around the geometric centerAt low speeds, shaft rotation occurs around the geometric centerAs speed increases, the rotor seeks to As speed increases, the rotor seeks to self balanceself balance , with the center of , with the center of rotation migrating from the geometric center toward the mass cenrotation migrating from the geometric center toward the mass center ter The The selfself--balancingbalancing process is what occurs as we pass through resonanceprocess is what occurs as we pass through resonanceAt the resonance peak, rotation is centered halfAt the resonance peak, rotation is centered half--way between the geometric way between the geometric and mass centers, resulting in maximum vibration and mass centers, resulting in maximum vibration
Geometric Center(Original Mass Center)
45°
eRot
'n
Mass Unbalance(Heavy Spot)
ResultingCenter of Gravity
(New Mass Center)
© 2007 M&B Engineered Solutions, Inc.www.mbesi.com
Transient Vibration Analysis / Vibration Institute MeetingHalifax, NC 07-Dec-2007
32
Resonances & Mode Shapes Resonances & Mode Shapes
Rotor may have more than one Rotor may have more than one resonance depending on operating resonance depending on operating speed and mass distribution speed and mass distribution Each resonance has an associated Each resonance has an associated mode shape. For symmetric rotors:mode shape. For symmetric rotors:
11stst Mode is inMode is in--phase from end to endphase from end to endMaximum deflection at rotor center Maximum deflection at rotor center 22ndnd mode outmode out--ofof--phase endphase end--toto--endendMaximum deflection at 1/3 pointsMaximum deflection at 1/3 points
Single disksSingle disks such as 1such as 1--stage fans stage fans and pumps will have only 1 rotor and pumps will have only 1 rotor mode (if they operate fast enough)mode (if they operate fast enough)MultiMulti--disk (compressors, turbines, disk (compressors, turbines, some pump) or distributed mass some pump) or distributed mass rotors (motors, generators) may rotors (motors, generators) may have more than 2 modeshave more than 2 modesDo not confuse rotor mode shapes Do not confuse rotor mode shapes with structural mode shapeswith structural mode shapes
1st Mode - Translational
2nd Mode - Pivotal
3rd Mode
P1 P2
L/2L/3 L/3

Transient Vibration Analysis Insights Into Machinery Behavior
By: Stanley R. Bognatz, P.E.75 Laurel Street, Carbondale, PA 18407
Tel. (570) 282-4947 email: [email protected]
M&B Engineered Solutions, Inc. - 2007www.mbesi.com
17
© 2007 M&B Engineered Solutions, Inc.www.mbesi.com
Transient Vibration Analysis / Vibration Institute MeetingHalifax, NC 07-Dec-2007
33
**
**
*
******
* * *****
* ***** *
*
**
*
***
*****
* ****
***
*
****
*****
0°
90°
180°
270°
0°
90°
180°
270°468
14701960
2275
248525202555
2625
2660
2695
2730
27652800
2835
28702905
32203465
37104550
73157420 7875
4681855
22052415
2485
25202555
25902625
2660
2695
2765
2800
2835
2870
290529403010
32903500
4165
6897 7035
71057140
7210
728073857910
8365
2940
2730
P1 P2
Polar PlotsPolar Plots
Typical 1Typical 1stst and 2and 2ndnd mode responsesmode responses11stst mode at 2,730 rpm mode at 2,730 rpm inin--phasephase across the rotoracross the rotor22ndnd mode at 7,420 rpm mode at 7,420 rpm outout--ofof--phasephase across the rotoracross the rotor
22ndnd mode must be compensated to remove residual 1mode must be compensated to remove residual 1stst mode effects if presentmode effects if present
© 2007 M&B Engineered Solutions, Inc.www.mbesi.com
Transient Vibration Analysis / Vibration Institute MeetingHalifax, NC 07-Dec-2007
34
Polar PlotsPolar Plots
11stst Mode balance solution Mode balance solution the classic the classic StaticStatic BalanceBalanceBalance weights on both ends of rotor in Balance weights on both ends of rotor in samesame angular locationsangular locationsWe can balance the 1We can balance the 1stst mode without affecting the 2mode without affecting the 2ndnd modemodeThe static balance weight pair will cancel each other out duringThe static balance weight pair will cancel each other out during the 2the 2ndnd
mode, having no effect on 2mode, having no effect on 2ndnd mode vibration mode vibration
**
**
*
******
* * *****
* ***** *
*
**
*
***
*****
* ****
***
*
****
*****
0°
90°
180°
270°
0°
90°
180°
270°468
14701960
2275
248525202555
2625
2660
2695
2730
27652800
2835
28702905
32203465
37104550
73157420 7875
4681855
22052415
2485
25202555
25902625
2660
2695
2765
2800
2835
2870
290529403010
32903500
4165
6897 7035
71057140
7210
728073857910
8365
2940
2730
1st Mode Heavy Spot
1st Mode Resonance
1st Mode Bal. Wt.
1st Mode Heavy Spot
1st Mode Resonance
1st Mode Bal. Wt.
P1 P2

Transient Vibration Analysis Insights Into Machinery Behavior
By: Stanley R. Bognatz, P.E.75 Laurel Street, Carbondale, PA 18407
Tel. (570) 282-4947 email: [email protected]
M&B Engineered Solutions, Inc. - 2007www.mbesi.com
18
© 2007 M&B Engineered Solutions, Inc.www.mbesi.com
Transient Vibration Analysis / Vibration Institute MeetingHalifax, NC 07-Dec-2007
35
Polar PlotsPolar Plots
2nd Mode balance solution 2nd Mode balance solution the the CoupleCouple BalanceBalanceBalance weights on both ends of rotor in Balance weights on both ends of rotor in oppositeopposite angular locationsangular locationsWe can balance the 2We can balance the 2ndnd mode without affecting the 1mode without affecting the 1stst modemodeThe couple balance weight pair at out of phase during the 1The couple balance weight pair at out of phase during the 1stst mode, mode, canceling each other outcanceling each other out22ndnd modes must be separately compensated for proper analysis modes must be separately compensated for proper analysis
**
**
*
******
* * *****
* ***** *
*
**
*
***
*****
* ****
***
*
****
*****
0°
90°
180°
270°
0°
90°
180°
270°468
14701960
2275
248525202555
2625
2660
2695
2730
27652800
2835
28702905
32203465
37104550
73157420 7875
4681855
22052415
2485
25202555
25902625
2660
2695
2765
2800
2835
2870
290529403010
32903500
4165
6897 7035
71057140
7210
728073857910
8365
2940
2730
2nd Mode Heavy Spot
2nd Mode Resonance
2nd Mode Bal. Wt.
P1 P2
2nd Mode Heavy Spot
2nd Mode Bal. Wt.
2nd Mode Resonance
© 2007 M&B Engineered Solutions, Inc.www.mbesi.com
Transient Vibration Analysis / Vibration Institute MeetingHalifax, NC 07-Dec-2007
36
Shaft Centerline PositionShaft Centerline Position
Shaft centerline plot shows the Shaft centerline plot shows the average movement of a shaft average movement of a shaft within the bearingwithin the bearing
Plots DC gap voltage changes Plots DC gap voltage changes from Xfrom X--Y proximity probesY proximity probesOnly applies to proximity Only applies to proximity probesprobes
Plots should be made in Plots should be made in relation to the available relation to the available diametral bearing clearancediametral bearing clearanceWe must also assume a We must also assume a reference position (typically reference position (typically the bottom of the bearing for the bottom of the bearing for horizontal machinery)horizontal machinery)

Transient Vibration Analysis Insights Into Machinery Behavior
By: Stanley R. Bognatz, P.E.75 Laurel Street, Carbondale, PA 18407
Tel. (570) 282-4947 email: [email protected]
M&B Engineered Solutions, Inc. - 2007www.mbesi.com
19
© 2007 M&B Engineered Solutions, Inc.www.mbesi.com
Transient Vibration Analysis / Vibration Institute MeetingHalifax, NC 07-Dec-2007
37
Shaft Centerline AnalysisShaft Centerline Analysis
Used QualitativelyUsed QualitativelyLook at motion paths & Look at motion paths & final positionsfinal positionsShows misalignment Shows misalignment and preloads across the and preloads across the machinemachine
Used QuantitativelyUsed QuantitativelyNeed accurate bearing Need accurate bearing clearance data!clearance data!Measure Bearing WearMeasure Bearing WearEccentricity RatioEccentricity RatioShaft Attitude Angle Shaft Attitude Angle
© 2007 M&B Engineered Solutions, Inc.www.mbesi.com
Transient Vibration Analysis / Vibration Institute MeetingHalifax, NC 07-Dec-2007
38
Eccentricity RatioEccentricity Ratio
Any forcing function placing a lateral (radial) preload on the rAny forcing function placing a lateral (radial) preload on the rotor can otor can result in a change is shaft centerline position. result in a change is shaft centerline position. Preloads can result from:Preloads can result from:
Misalignment Thermal growthMisalignment Thermal growthCasing Deflection Casing Deflection Pipe StrainPipe StrainRotor rubbingRotor rubbingPumping Pumping Gravity Gravity
Misalignment from Thermal Growth / Deflection is the main cause Misalignment from Thermal Growth / Deflection is the main cause of of excessive lateral preloading !excessive lateral preloading !We use Eccentricity Ratio as the key measure of the shaftWe use Eccentricity Ratio as the key measure of the shaft s response s response to lateral preloads to lateral preloads

Transient Vibration Analysis Insights Into Machinery Behavior
By: Stanley R. Bognatz, P.E.75 Laurel Street, Carbondale, PA 18407
Tel. (570) 282-4947 email: [email protected]
M&B Engineered Solutions, Inc. - 2007www.mbesi.com
20
© 2007 M&B Engineered Solutions, Inc.www.mbesi.com
Transient Vibration Analysis / Vibration Institute MeetingHalifax, NC 07-Dec-2007
39
Eccentricity RatioEccentricity Ratio
Eccentricity is the ratio between the distance from the shaft ceEccentricity is the ratio between the distance from the shaft center to nter to the bearing center, divided by the the bearing center, divided by the radialradial bearing clearancebearing clearanceUsually abbreviated as Usually abbreviated as ee or or ERERExample 1:Example 1:
Given: 15 mils Given: 15 mils radialradial bearing clearancebearing clearanceShaft centerline data shows the shaft operating 3 mils from bearShaft centerline data shows the shaft operating 3 mils from bearing centering centerER = 3 / 15 = 0.2 ER = 3 / 15 = 0.2 running running highhigh in the bearingin the bearing
Example 2:Example 2:Shaft is operating 9 mils from the bearing centerShaft is operating 9 mils from the bearing centerER = 9 / 15 = 0.6 ER = 9 / 15 = 0.6 typicaltypical
If the shaft is centered in the bearing, what is If the shaft is centered in the bearing, what is ee ??ER = 0 / 15 = 0ER = 0 / 15 = 0
If it is against the bearing wall?If it is against the bearing wall?ER = 15 / 15 = 1ER = 15 / 15 = 1
© 2007 M&B Engineered Solutions, Inc.www.mbesi.com
Transient Vibration Analysis / Vibration Institute MeetingHalifax, NC 07-Dec-2007
40
Average vs. Dynamic Eccentricity RatioAverage vs. Dynamic Eccentricity Ratio
The previous slides showed The previous slides showed AverageAverage ER. This is the shaft position ER. This is the shaft position obtained when we only consider the DC Gap Voltage dataobtained when we only consider the DC Gap Voltage dataIf we also consider the shaft vibration at any given average posIf we also consider the shaft vibration at any given average position, ition, we have the Dynamic Eccentricity Ratiowe have the Dynamic Eccentricity RatioFor example, given 15 mils radial bearing clearance:For example, given 15 mils radial bearing clearance:
If shaft centerline data shows the shaft 9 mils from bearing cenIf shaft centerline data shows the shaft 9 mils from bearing center,ter,Average ER = 9 / 15 = 0.6Average ER = 9 / 15 = 0.6Given 6 mils pkGiven 6 mils pk--pk of 1X shaft vibration using 200 mV/mil probes, the pk of 1X shaft vibration using 200 mV/mil probes, the dynamic shaft motion varies +/dynamic shaft motion varies +/-- 3 mils from the average position3 mils from the average positionDynamic ER = Avg ER +/Dynamic ER = Avg ER +/-- [(peak[(peak--toto--peak vibration / 2) / radial clearance]peak vibration / 2) / radial clearance]
For our data:For our data:Dynamic ER = 0.6 +/Dynamic ER = 0.6 +/-- [ (6 / 2) / 15 ] = 0.6 +/[ (6 / 2) / 15 ] = 0.6 +/-- 0.20.2
So the Dynamic ER varies from 0.4 to 0.8 with each shaft rotatioSo the Dynamic ER varies from 0.4 to 0.8 with each shaft rotationnAt 0.8 we see the shaft is in close proximity to the bearing walAt 0.8 we see the shaft is in close proximity to the bearing wall. We l. We might want to reduce the vibration and/or modify the alignment tmight want to reduce the vibration and/or modify the alignment to o reduce babbitt stressreduce babbitt stress

Transient Vibration Analysis Insights Into Machinery Behavior
By: Stanley R. Bognatz, P.E.75 Laurel Street, Carbondale, PA 18407
Tel. (570) 282-4947 email: [email protected]
M&B Engineered Solutions, Inc. - 2007www.mbesi.com
21
© 2007 M&B Engineered Solutions, Inc.www.mbesi.com
Transient Vibration Analysis / Vibration Institute MeetingHalifax, NC 07-Dec-2007
41
Stiffness & Damping vs. EccentricityStiffness & Damping vs. Eccentricity
The radial stiffness and damping The radial stiffness and damping of the lubricating fluid within a of the lubricating fluid within a bearing are functions of bearing are functions of eccentricity ratioeccentricity ratioIncreased eccentricity results in Increased eccentricity results in nonnon--linear increases of stiffness linear increases of stiffness and dampingand dampingWhat effect does this have on What effect does this have on our resonance? AF?our resonance? AF?
Observed frequency will increaseObserved frequency will increaseObserved AF will decrease Observed AF will decrease
Practically speaking: eccentricity Practically speaking: eccentricity ratio and shaft position should ratio and shaft position should be an integral part of the be an integral part of the transient vibration analysis transient vibration analysis processprocess
Fluid Film Radial Stiffness &Radial Damping vs. Eccentricity Ratio
0
10,000
20,000
30,000
40,000
50,000
60,000
70,000
80,000
90,000
0.0 0.1 0.2 0.3 0.4 0.5 0.6 0.7 0.8 0.9 1.0
Eccentricity (e)
0
20
40
60
80
100
120
140
160
180
200
Stiffness Damping
© 2007 M&B Engineered Solutions, Inc.www.mbesi.com
Transient Vibration Analysis / Vibration Institute MeetingHalifax, NC 07-Dec-2007
42
Waterfall & Cascade PlotsWaterfall & Cascade Plots
Waterfall and cascade plots are threeWaterfall and cascade plots are three--dimensional graphs of spectra dimensional graphs of spectra at various machine speeds and times. They allow us to see the enat various machine speeds and times. They allow us to see the entire tire frequency content from a location as a function of speed. frequency content from a location as a function of speed.

Transient Vibration Analysis Insights Into Machinery Behavior
By: Stanley R. Bognatz, P.E.75 Laurel Street, Carbondale, PA 18407
Tel. (570) 282-4947 email: [email protected]
M&B Engineered Solutions, Inc. - 2007www.mbesi.com
22
© 2007 M&B Engineered Solutions, Inc.www.mbesi.com
Transient Vibration Analysis / Vibration Institute MeetingHalifax, NC 07-Dec-2007
43
1X 2X 3X
Waterfall & Cascade PlotsWaterfall & Cascade Plots
Orders of running speed (1X, 2X, 3X, etc.) form nearOrders of running speed (1X, 2X, 3X, etc.) form near--diagonal lines in diagonal lines in the plot the plot
Diagonal relationships
© 2007 M&B Engineered Solutions, Inc.www.mbesi.com
Transient Vibration Analysis / Vibration Institute MeetingHalifax, NC 07-Dec-2007
44
1X 2X 3X
Vertical relationships Horizontal relationships
Waterfall & Cascade PlotsWaterfall & Cascade PlotsHorizontal relationships can be analyzed for resonance, loosenesHorizontal relationships can be analyzed for resonance, looseness, s, rubs, instability, etc.rubs, instability, etc.Vertical relationships onset and progress of resonant related acVertical relationships onset and progress of resonant related activity, tivity, and any constantand any constant--frequency vibration that may be present. frequency vibration that may be present.

Transient Vibration Analysis Insights Into Machinery Behavior
By: Stanley R. Bognatz, P.E.75 Laurel Street, Carbondale, PA 18407
Tel. (570) 282-4947 email: [email protected]
M&B Engineered Solutions, Inc. - 2007www.mbesi.com
23
© 2007 M&B Engineered Solutions, Inc.www.mbesi.com
Transient Vibration Analysis / Vibration Institute MeetingHalifax, NC 07-Dec-2007
45
Waterfall & Cascade PlotsWaterfall & Cascade Plots
Vertical relationships may be due to:Vertical relationships may be due to:Adjacent machinery Adjacent machinery check their speeds against your datacheck their speeds against your dataGround faults or electrical noise in your instrumentation Ground faults or electrical noise in your instrumentation the peaks will the peaks will line up vertically at 60 Hz (3600 cpm)line up vertically at 60 Hz (3600 cpm)Structural resonances will get easily excited by orders of runniStructural resonances will get easily excited by orders of running speed as ng speed as machine speed increases or decreasesmachine speed increases or decreasesOil Whirl: look for subsynchronous vibration at 0.4X Oil Whirl: look for subsynchronous vibration at 0.4X 0.48X that tracks 0.48X that tracks running speedrunning speedOil Whip: look for subsynchronous vibration in the at a frequenOil Whip: look for subsynchronous vibration in the at a frequency equal to cy equal to the rotorthe rotor s 1st lateral balance resonances 1st lateral balance resonanceAnisotropic shaft stiffness due to cracking or by design Anisotropic shaft stiffness due to cracking or by design look for look for excitation of the 2X order line at excitation of the 2X order line at ½½ the balance resonancethe balance resonance
© 2007 M&B Engineered Solutions, Inc.www.mbesi.com
Transient Vibration Analysis / Vibration Institute MeetingHalifax, NC 07-Dec-2007
46
ConclusionConclusion
This presentation was compiled from the authorThis presentation was compiled from the author s paper,s paper,Transient Vibration Analysis, Insights into Machinery Behavior,Transient Vibration Analysis, Insights into Machinery Behavior,
presented 07presented 07--DecDec--2007 at the Vibration Institute2007 at the Vibration Institute s Piedmont Chapter s Piedmont Chapter meeting in Halifax, NC.meeting in Halifax, NC.
For a copy of that paper, please contact the author:For a copy of that paper, please contact the author:
Stanley R. Bognatz, P.E.Stanley R. Bognatz, P.E.President & Principal EngineerPresident & Principal EngineerM&B Engineered Solutions, Inc.M&B Engineered Solutions, Inc.
75 Laurel Street75 Laurel StreetCarbondale, PA 18407Carbondale, PA 18407
Tel. (570) 282Tel. (570) 282--49474947Cell (570) 575Cell (570) 575--92529252
Email: Email: [email protected]@mbesi.com

Transient Vibration Analysis Insights Into Machinery Behavior
By: Stanley R. Bognatz, P.E.75 Laurel Street, Carbondale, PA 18407
Tel. (570) 282-4947 email: [email protected]
M&B Engineered Solutions, Inc. - 2007www.mbesi.com
24
© 2007 M&B Engineered Solutions, Inc.www.mbesi.com
Transient Vibration Analysis / Vibration Institute MeetingHalifax, NC 07-Dec-2007
47
Thank You Any Questions?