Embed Size (px)
Citation preview

Transient Pressure Monitoring SystemThe Transient Pressure Monitoring System is really two instruments that provide pressure informationregarding pipelines:
the Transient Pressure Monitor, and the Differential Pressure Monitor
The Transient Pressure Monitor Processor also produces an output signal during transients. The user canspecify how this output is generated.
The Transient Pressure Monitoring System is comprised of the following components:
The Transient Pressure Monitor is a uniqueinstrument for detecting potentially damagingpressure transients in pipelines. The systemcontinually monitors the pressure in the pipe, andlooks for rapid changes in pressure. These arerecorded in the system Processor. You use awireless device to collect the data from theProcessor and to make adjustments. The data canbe analyzed later on your PC. The TransientPressure Monitor can only monitor one pressuresensor at a time.
The Differential Pressure Monitor measures andrecords two pressures simultaneously. It recordseach pressure at a fixed rate specified by the user.It does not attempt to detect pressure transients.You use a wireless device to collect the data fromthe Processor and to make adjustments. The datacan be analyzed later on your PC.
Page 1 of 3Overview
12/23/2016file:///C:/Users/efierro/AppData/Local/Temp/~hhDA59.htm

The Transient Pressure Monitoring System is easy to set up and use. The first three sections of thismanual will tell you everything you need to know to use the system. The other sections will help youconfigure the system to your needs.
Getting Started
Personal DigitalAssistant (PDA)
A PocketPC PDA is the primary device for the user interaction.A laptop with a WiFi card can also be used. (Any desktop orlaptop on a wired LAN can also be used, if the Processor isconnected to the LAN.)
Processor The Processor processes all of the input signals, and performs allof the logic in the system. It also stores all of the historical datauntil it is retrieved using the PDA.
Communications WiFi is the primary communications mechanism. (A wired LANcan also be used.)
Sensors Depending on the operating mode, 1 or 2 pressure sensors areused to measure the pressure in the pipe.
Data AnalysisPrograms
PC programs that retrieve the stored data files from the PDA, andand convert and display the data. The data is also stored in adatabase for analysis by other programs.
Note: This manual will refer to all of the remote devices that are used for userinteraction (PDA, laptop, desktop, etc.) as the PDA, unless there are differencesin their operation.
The PDA displays all ofthe system’s informationto the user, and processesall of the user inputs. Italso retrieves thehistorical informationfrom the Processor.
The Processor processesinput from the Sensors,and creates all of thesystem information. Itcontinuously monitors thepipe and stores the datainternally.
The Sensors measure thepressure in the pipe at twolocations.
Page 2 of 3Overview
12/23/2016file:///C:/Users/efierro/AppData/Local/Temp/~hhDA59.htm

Running the Transient Pressure Monitoring System
Using the Data Analysis Programs
Processor (Level 1 Module)
Troubleshooting
FCC Compliance
Copyright 2010 Qameleon Technology All rights reserved.
For more information, please contact
PipeTech International35555 N. Mule Train Rd., Box 6054Carefree, AZ 85377USA480-748-3578
www.pipepressure.com
Page 3 of 3Overview
12/23/2016file:///C:/Users/efierro/AppData/Local/Temp/~hhDA59.htm

The Transient Pressure Monitoring System is easy to setup and use. There are a few tasks that you need toperform to get started.
You will need the following components for the system:
Please perform the following steps:
Getting Started
PocketPC PDAwith integralWiFi (includingsync cord)
If you purchased the PDA as part of the Transient PressureMonitoring System, it is ready to use. If you are providingyour own Pocket PC PDA, you will need to configure it asdescribed below. (Alternatively, you can use a laptopcomputer, which you must configure).
Processor Including power cable and antenna
Antenna
Power Cable Used when Processor is run from batteries or a DC supply
Sensors
AntennaExtension Cable(optional)
Including mounting bracket
Outdoor Antenna(optional)
Including antenna mount
GPS Receiver(optional)
External LANCable(optional)
AC Adapter(optional)
RS485 adapter(optional)
Used to connect to other equipment using ModBus
QViewPlus,QAnalyze, andConvertDataSoftware*
Page 1 of 38Getting Started
12/23/2016file:///C:/Users/efierro/AppData/Local/Temp/~hh7560.htm

1) Install the hardware.
2) Install the QViewPlus software on your PDA.
3) Check the hardware installation.
When you are ready to begin analyzing the data, please perform step 4.
4) Install the QAnalyze and ConvertData software on your PC.
* QViewPlus, QAnalyze, and ConvertData are licensed programs from Qameleon Technology, Inc.
Connecting the hardware for the Transient Pressure Monitoring System is easy. The steps to be followed dependon the options that are included.
Please do the following:
Important: If you purchased the PDA option with your Transient PressureMonitoring System, skip step 2 and go on to step 3.
If you are providing your own Pocket PC PDA or laptop, pleaseperform step 2.
Installing the Hardware
1) Install the Processor in a convenient location. It can be permanently mounted usingthe mounting holes, or just placed on a shelf or the ground. The Processor isweatherproof, and can be installed outside.
If you are using the small black standard antenna alone, the Processor needs to belocated where there is no radio shielding between it and the remote WiFi device(PDA or laptop). If you must locate the Processor inside of a cabinet, underground,or in some other inaccessible location, you will need to use the Antenna ExtensionCable or the Outdoor Antenna.
The mounting holes are under the box cover. Remove the 4 screws holding thecover in place. The mounting holes are outside of the sealing edge.
External brackets are available for mounting the Processor without opening thecase.
Important: You must follow the important instructions when replacing thecover. Improper tightening of the screws may cause the case to leak.This will void the warranty.
Page 2 of 38Getting Started
12/23/2016file:///C:/Users/efierro/AppData/Local/Temp/~hh7560.htm

There is no power switch. Just connect the power cable to the Processor. The Processor will startcommunicating in approximately 45 seconds.
The Processor needs to have an antenna connected to operate.
2) Install the Sensors
3) If necessary, Install the Antenna
4) If necessary, Install the External LAN
5) If necessary, Install the AC Adapter or battery.
Installing The Antenna
Page 3 of 38Getting Started
12/23/2016file:///C:/Users/efierro/AppData/Local/Temp/~hh7560.htm

In most cases, the standard antenna will besufficient. Attach the antenna to the antennaconnector on the Processor, and turn it so that itis vertical. It does not matter if the antenna ispointed up or down.
The antenna radiates as a cylinder parallel tothe antenna shaft. Mount the antenna so thatthe shaft is perpendicular to the PDA. Youshould test the reception before permanentlyattaching the antenna.
Page 4 of 38Getting Started
12/23/2016file:///C:/Users/efierro/AppData/Local/Temp/~hh7560.htm

First, locate the antenna in a clear location for the signal. Attach the antenna to a structure where there will notbe any metal blocking the path to the PDA or laptop. It is not essential to have the antenna located at a highelevation.
The Outdoor Antenna Option is used when the antenna will be exposed to the weather.
After the antenna has been installed, route the cable to the Processor and connect it to the Antenna Connector.
The Transient Pressure Monitoring System has 2 sensors that measure the pressure in the pipe. The sensors canbe used as either Sensor 1 or Sensor 2. Remember where each sensor is located, since they are referred to bynumber in the monitors.
The Antenna Extension Cable Option is usedwhen the Processor is located underground,inside a metal enclosure, or in some locationwhere the radio signal will be shielded. Attachthe standard antenna to the cable, and thenconnect the cable to the Processor.
The antenna is mountedvertically, with the cable
pointing downward.
The antenna mounting kitconsists of a metal bracket that
attaches to the antenna. Clamps,suction cups, and mountingscrews are also included..
Installing The Sensors
Note: The sensors that came with your system may have different pressure ranges. They are alreadycalibrated for their respective locations.
If you swap Sensor 1 and Sensor 2 as they plug into the Processor, you will have to recalibrate thesoftware. This can be done using the Calibration screen of the Differential Pressure program.
Page 5 of 38Getting Started
12/23/2016file:///C:/Users/efierro/AppData/Local/Temp/~hh7560.htm

The appearance of the sensors may differ from the pictures, but they are connected in the same way.
Plug the cables from the sensors into their corresponding sockets on the Processor.
The sensors are already calibrated for their respective positions. If you are replacing the sensors, or switchingtheir positions as they plug into the box, follow the instructions in the Calibration Screen in the DifferentialPressure program.
The External LAN Connector Option is used when the Processor is connected to another computer using a wiredLAN.
The sensors have 1/4" NPT male fittings. Thesensors can be attached to the pipe in any desiredlocation using the appropriate fittings.
You may wish to install the sensor with a valve anda pressure gauge. While this is not necessary it willmake it easier to recalibrate the sensor, ifnecessary.
If you plan to use the system to monitor a pressurereduction valve or a pump, install one sensor oneach side of the device. Sensor 1 is often used asthe input, and Sensor 2 the output.
It is best to locate the sensor horizontal or pointingdownward so that no air is trapped in the line. Thiswill improve the accuracy of the readings.
Using The External LAN Connection
Page 6 of 38Getting Started
12/23/2016file:///C:/Users/efierro/AppData/Local/Temp/~hh7560.htm

Make sure the PC and the Level 1 are on the same network and that the QViewPlus program is installed on any
The External LAN Cablesupplied with this option is20' (6 M) long. On one end is aweatherproof connector to matewith the socket on the Level 1module. On the other end isstandard RJ45 modularconnector. This is a CAT 5cable.
For direct connection to a PC,plug the External LAN Cableinto the Level 1 module andtighten. Plug the other end intothe Ethernet adapter on the PC.
When using a hub, plug theExternal LAN Cable into theLevel 1 module and tighten.Plug the RJ45 connector intothe hub.
Page 7 of 38Getting Started
12/23/2016file:///C:/Users/efierro/AppData/Local/Temp/~hh7560.htm

PC you wish to use.
The AC Adapter is designed for 100-240VAC 50-60Hz. Plug the adapter into the Power Connector on theProcessor and into an AC outlet.
If you are going to use the system temporarily, you can use 12 Volt batteries to power the Processor. Justconnect the power cord to the battery (Red +, Black -) and to the Power Connector on the Processor.
Installing The AC Adapter and Connecting Power
AC Adapter Power Cable (optional)
Processor
Important: The AC Adapter is not waterproof. Make sure it is protected.
Page 8 of 38Getting Started
12/23/2016file:///C:/Users/efierro/AppData/Local/Temp/~hh7560.htm

Occasionally, the sensors may pick up noise from electrical equipment nearby. This may be from high intensitylamps, large motors, or transformers. It is not always possible to predict this noise, and may not be present at all.
Grounding the TP-1 to an earth ground will usually eliminate the noise. Check the data from the TP-1 to see ifthere is noise affecting the readings
The Processor has an internal clock that it uses to timestamp all of the sensor readings. While this is a fairlyaccurate clock, very precise time information can be provided using the optional GPS receiver.
Important: Be sure to connect the RED clip to the POSITIVE terminal and the BLACKclip to the NEGATIVE terminal of the battery. If the polarity is reversed, thefuse will blow. See the "Replacing the Fuse" section for instructions.
Grounding the Processor
If you are using the AC Adapter, just plug itinto a 3-prong grounded outlet. This willautomatically ground the Processor.
If you are using a battery to power the unit,you should not need a ground connection. Insevere noise situations, you should connect awire from the NEGATIVE terminal of thebattery to something that is grounded to theearth. This can be the pipe itself, anotherpipe, the body of a pump, or a metalenclosure that is electrically grounded. Youshould test the system for noise to be surethat the noise is gone.
Installing The GPS (optional)
Page 9 of 38Getting Started
12/23/2016file:///C:/Users/efierro/AppData/Local/Temp/~hh7560.htm

After the GPS receiver has been installed, route the cable to the Processor and connect it to the GPS/SerialConnector.
The GPS receiver is a self-contained device ina waterproof housing. The receiver must belocated where it has a clear view of the sky,preferably outside or near a window. It is notessential to have the receiver located at a highelevation.
The unit is oriented with the domed partfacing upward. In many cases, it can simplybe placed on a flat surface. If desired, it canbe attached to a plate or the top of a cabinetusing the threaded holes in the bottom.
Use the GPS Setup Program to ensure thatthe receiver is in a good location.
Page 10 of 38Getting Started
12/23/2016file:///C:/Users/efierro/AppData/Local/Temp/~hh7560.htm

The Processor can communicate with certain devices over 2-wire RS485 using an external adapter. The adapteris plugged into the RS485 socket on the Processor. The use of the RS485 interface is specific to your product.
Installing The RS485 Adapter (optional)
Page 11 of 38Getting Started
12/23/2016file:///C:/Users/efierro/AppData/Local/Temp/~hh7560.htm

The connections to the RS485 adapter are as follows:
Please check the manual for your remote device for its RS485 connections.
The Transient Pressure Program continually monitors the sensor for rapid changes. When a transient is detected,the Processor turns on a relay. The relay can be set to remain on during the transient, or provide a pulse ofknown duration. This is configured using the Output Setup Program.
Terminal Description
TD(A) Data -
TD(B) Data +
GND Ground
GND Ground
+12V DO NOT USE
Using the Output Signal
Page 12 of 38Getting Started
12/23/2016file:///C:/Users/efierro/AppData/Local/Temp/~hh7560.htm

The hardware connection and details of this signal are listed in the Connectors section of this manual.
The side panel of the Processor contains two status lights. The red POWER light will show brightly when theunit is running with sufficient power. If this light is dim, and you are using a battery, the battery is probablyweak. You should charge or replace the battery to reduce the possibility of losing data or not being able toconnect using the PDA.
The Transient Pressure RUN Screen isshown at right.
The occurrence of a transient is shown inreal time, and the details are recorded in afile in the Processor.
Whenever a transient is detected, an outputsignal is generated by the Processor. Thissignal can be used to turn on an alarm bell,a warning light, send a signal to a PLC orSCADA RTU, or anything that uses anON/OFF signal..
LINK Light
Page 13 of 38Getting Started
12/23/2016file:///C:/Users/efierro/AppData/Local/Temp/~hh7560.htm

The LINK light indicates the status of the WiFi communications. When the Processor is first turned on, the lightwill turn on GREEN for a few seconds and then turn off.
After the WiFi has started, the LINK light has the following meaning:
If you are having trouble communicating with the Processor using the PDA, the LINK light will help youdetermine what is happening.
After installing the hardware, check the system using the Pocket PC PDA.
Note: The Level 1 Module will start communicating in approximately 90 secondsafter power is applied. Please wait a sufficient amount of time.
OFF WiFi is not ready
BLINK GREEN WiFi is running, but has not connected to theQameleon network. No PDA found yet.
SLOW BLINKGREEN
WiFi connected to the Qameleon network, but notexchanging messages with PDA. PDA may havebeen turned off.
FLASHRANDOMLYGREEN YELLOWRED OFF
WiFi is communicating with PDA and exchangingmessages.
Check System
Important: If you did NOT purchase the PDA as part of the Transient Pressure
Page 14 of 38Getting Started
12/23/2016file:///C:/Users/efierro/AppData/Local/Temp/~hh7560.htm

Monitoring System, you must install the QViewPlus software and WiFi cardon your Pocket PC PDA or laptop computer before performing the stepsbelow.
Turn on the Pocket PC PDA. Press the button on theupper right side of the PDA.
If your PDA has built-in WiFi, be sure that it is turnedon. See the Configuring WiFi page for information onhow to turn it on.
Watch the LINK light on the Processor to see if it hasconnected with the PDA.
The PDA should show that the WiFi is connected to"Qameleon".
Tap on 'Start' to display the Start menu. Tap on'Programs'.
Page 15 of 38Getting Started
12/23/2016file:///C:/Users/efierro/AppData/Local/Temp/~hh7560.htm

Tap on the 'QViewPlus' icon to start the application.
In the 'Select a Device' screen, tap on the itemDifferential Pressure. Then tap the 'Run' button.
Page 16 of 38Getting Started
12/23/2016file:///C:/Users/efierro/AppData/Local/Temp/~hh7560.htm

The RUN screen shows the current pressures fromSensor 1 and Sensor 2. It should look similar to thescreen at right.
If your hardware setup is correct, you will see pressurevalues under Sensor 1 and Sensor 2 that correspond tothe actual pressures in PSI where the two pressuretransducers are installed.
Now tap 'Commands' in the lower left of the screen, andtap 'Select a Device'.
Page 17 of 38Getting Started
12/23/2016file:///C:/Users/efierro/AppData/Local/Temp/~hh7560.htm

Tap 'Transient Pressure (SENSOR 1)' or 'TransientPressure (SENSOR 2)', then tap 'Run'.
If your hardware is set up correctly, the RUN screendisplays the current conditions of the monitor. It maytake one to two minutes before this screen displays theBackground Level and Sample Time, since the monitorneeds to calculate an average pressure value before itdisplays the Background Level.
Note: Occasionally, nearby electrical equipment willintroduce noise into the sensor. Remove anypressure from the sensor, click on STOP andthen GO. Note the Maximum and Minimumvalues. If there is more than 3 PSI difference,you many need to ground the Processor.
Page 18 of 38Getting Started
12/23/2016file:///C:/Users/efierro/AppData/Local/Temp/~hh7560.htm

Now you are ready to use the Transient Pressure Monitoring System to analyze your pipelines.
To stop the QViewPlus program, tap 'Commands' and'Quit'.
Installing the Software
Important: If you purchased the PDA as part of your system, you only need to install theActiveSync program on your PC.
If you are using your own Pocket PC PDA or laptop computer, you need tofollow the instructions in this section to install ALL of the software.
Page 19 of 38Getting Started
12/23/2016file:///C:/Users/efierro/AppData/Local/Temp/~hh7560.htm

The PDA communicates with the Processor using a program called QViewPlus*.
The PDA transfers its data files to your desktop computer using Microsoft ActiveSync. You will need to installActiveSync on your PC first.
If you are providing your own PDA or a laptop, you will need to install the QViewPlus software program andthe driver for your WiFi card. Please perform the following steps.
If you haven't already done so, you must install ActiveSync on your PC. Then:
1) Install QViewPlus on your PDA (or Install QViewPlus on your laptop or desktop PC)
2) Install the WiFi and software on your PDA
3) Configure the WiFi
4) Configure your PDA button to launch QViewPlus
* QViewPlus is a licensed program from Qameleon Technology, Inc.
Before installing any software on the PDA, you need to install Microsoft ActiveSync on your PC, and thenconnect the PDA to your PC.
NOTE: the following instructions show the installation for an HP iPAQ PDA. If you have a different brand ofPDA, the installation steps should be similar.
Installing the PDA Cradle and ActiveSync
SystemRequirements
PDA with Pocket PC 2000, Pocket PC 2002, Pocket PC 2003, Windows Mobile5.0, or Windows Mobile 6.0.
Important: You must install the ActiveSync software on your PC before connecting thePDA to the PC. See the notices in the box your PDA came in.
Insert the CD for the HP iPAQPDA into your computer and
Page 20 of 38Getting Started
12/23/2016file:///C:/Users/efierro/AppData/Local/Temp/~hh7560.htm

follow the instructions forinstalling the ActiveSyncsoftware. The instruction screensthat you see may look differentthan the ones shown here.
Click on "Install ActiveSync"and follow the directions. Do notconnect the PDA to yourcomputer until told to do so.
After installing ActiveSync, plug the cable from thePDA into a USB port on your PC. You may have just acable that plugs into the PDA and PC, rather than acradle as shown here.
Page 21 of 38Getting Started
12/23/2016file:///C:/Users/efierro/AppData/Local/Temp/~hh7560.htm

The ActiveSyncprogram will askyou to set up apartnership whenthe PDA is insertedinto the cradle forthe first time. Clickthe button to set upa "Standardpartnership".
Click the button"synchronize withthis desktopcomputer".
It is a good idea togive this PDA a
Page 22 of 38Getting Started
12/23/2016file:///C:/Users/efierro/AppData/Local/Temp/~hh7560.htm

The PDA is a very useful tool for other activities. Use it to take notes, record voice messages and sounds, keepyour calendar, or any number of other applications. Look at the iPAQ manual for details on what you can dowith it.
unique name,particularly whenyou will haveseveral PDAs thatare used to collectdata. You can pickany name that youwish as long asyou follow thenaming rules listedon the screen.Spaces are notallowed in thename.
For now,UNCHECK all ofthe items. You canset up the PDAlater tosynchronize yourspecific files if youwish.
Page 23 of 38Getting Started
12/23/2016file:///C:/Users/efierro/AppData/Local/Temp/~hh7560.htm

QViewPlus is a software application that runs on your PDA. It handles the wireless communication with theProcessor, and it provides the graphical user interface. It also uploads data files from the Processor to yourPDA.
If you purchased your PDA as part of the system, QViewPlus is already installed, and you can skip this page. Ifyou purchased your PDA separately, you will need to follow the instructions on this page to install QViewPlus.If you prefer to use a laptop or desktop PC to retrieve data from the Processor, you will need to installQViewPlus on your PC.
Installing QViewPlus on your PDA
SystemRequirements
PDA with ARM, XScale, MIPS, or SH3 processor. Pocket PC 2000,Pocket PC 2002, Pocket PC 2003, Windows Mobile 5.0, or WindowsMobile 6.0.
Connect your PDA to a laptop or desktop PC usingMicrosoft ActiveSync. Be sure that ActiveSyncsays it is Connected. (If you have not installedMicrosoft ActiveSync on your PC, please do sobefore continuing).
Place the Installation CD in the PC. When the CD displays the Installation page, select the hyperlink for theprocessor that you have in your PDA.
To install the correct version of QViewPlus on your PDA, you must know what type of processor the PDAhas. The processors that are supported are:
ARM - Intel StrongARM and XScale. All iPAQ PDAs use these processors, as well as newer modelsof other PDA brands.
MIPS - NEC MIPS processor. Older Casio Cassiopeia PDAs use this processor. SH3 - Hitachi SH3. Older HP Jornadas use this processor.
Page 24 of 38Getting Started
12/23/2016file:///C:/Users/efierro/AppData/Local/Temp/~hh7560.htm

If you have not done so already, install WiFi on your PDA and configure it.
If you purchased your PDA as part of your System, the WiFi is already installed, and you can go on to configurethe WiFi.
If you purchased your PDA separately, it may already have built-in WiFi installed. If not, you may be able topurchase a separate WiFi card that you can install.
If you purchased your PDA as part of the system, the WiFi card is already configured, and you can skip thispage. If for some reason the WiFi is no longer working correctly, go through this page, and check all of thesettings.
The installation program will not allow you to install the program if your PDA does not have the correctprocessor. If you are uncertain about the processor in your PDA, simply try each of the installation linksshown above, until you find one that works.
To install the program, follow the instructions on the CD installation page.
NOTE: if your PC only gives you the option to modify, update, or uninstall QViewPlus, select uninstall.After it is uninstalled, run the installation again.
Installing WiFi on your PDA
Configuring WiFi on your PDA
Page 25 of 38Getting Started
12/23/2016file:///C:/Users/efierro/AppData/Local/Temp/~hh7560.htm

If you purchased your PDA separately, you will need to configure it, using the settings below. This pagedescribes how to set up the WiFi for the HP iPAQ 110 or 111 series of PDA, running Windows Mobile 6.0. Ifyou have a different model of PDA, it should have similar screens and settings, but how you access thosescreens may differ.
Note: The printed card that came with your system will tell you the IP address of the Processor. Just followthe instructions below to set up your PDA to operate on the same network, but with a different IPaddress. For more information about addresses, see the section called Networks.
Configuring the HP iPAQ 110/111 series
Turn on your PDA. The 'Today' screen willappear. If the 'WLAN' icon is gray, with a redbox containing an 'X', the WiFi is turned off.
Turn it on by tapping the 'WLAN' icon. Wait forthe icon to turn yellow/gold, signifying that theWiFi is on.
If it then turns green, the WiFi is connected tosomething.
When the 'WLAN' icon is yellow/gold or green,you will see the Wireless Manager icon withsome text to the right of it. Tap the WirelessManager icon.
Page 26 of 38Getting Started
12/23/2016file:///C:/Users/efierro/AppData/Local/Temp/~hh7560.htm

On the Wireless Manager screen, tap the word'Menu' at bottom right, and a menu will appear.Tap 'Wi-Fi Settings' in the menu.
The 'Configure Wireless Networks' screenappears. In pull-down box near the bottom of thescreen, select 'Only computer-to-computer'.
If the large box near the top of the screencontains the line
'Qameleon xxxxxxx'
where the x's represent a status such as'Available' or 'Unavailable', tap the word'Qameleon'.
If the large box does not contain the Qameleonentry, tap the words 'Add New...'.
If you tapped the word 'Qameleon' on theprevious screen, this screen appears. Your screenshould look exactly like this. Change the'Connects to:' box to say 'Work', if necessary. Ifeither the Network name or check boxes areincorrect, they cannot be changed on this screen.You will need to tap 'Cancel' on the bottom left togo back to the previous screen. Once there, holdthe stylus down on the word 'Qameleon' until amenu appears, and select 'Remove Settings'. Thentap 'Add New...', and continue with the textbelow.
Page 27 of 38Getting Started
12/23/2016file:///C:/Users/efierro/AppData/Local/Temp/~hh7560.htm

If you tapped 'Add New...' to get to this screen,fill out the screen exactly as shown here. Thentap 'Next' at the bottom right.
In the "Authentication" and "Data Encryption"fields, enter the values to match theauthentication setting on the Processor:
If no authentication and encryption, select"Open" and "Disabled".
If "wpa-psk", select "WPA-PSK" and"TKIP".
If "wpa2-psk", select "WPA2-PSK" and"AES".
If either "wpa-psk" or "wpa2-psk" is used, enterthe same key that is used for the Processor in the"Network key" field.
Do not enter anything on this screen. Tap 'Finish'at the bottom right.
Page 28 of 38Getting Started
12/23/2016file:///C:/Users/efierro/AppData/Local/Temp/~hh7560.htm

Tap the 'Network Adapters' tab.
Select 'Work' and tap the 'Marvell SDIO8686Wireless Card'.
Page 29 of 38Getting Started
12/23/2016file:///C:/Users/efierro/AppData/Local/Temp/~hh7560.htm

Tap the 'Use specific IP address', and enter the IPaddress and Subnet mask as shown here. Thenselect the 'OK' button in the upper right. Click'OK' again.
Tap 'Menu' in the lower right of this screen, andselect 'Wi-Fi Settings'.
Page 30 of 38Getting Started
12/23/2016file:///C:/Users/efierro/AppData/Local/Temp/~hh7560.htm

Be sure that the Processor is turned on.
If the status next to 'Qameleon' is anything otherthan 'Connected', hold the stylus down on theword 'Qameleon' until a menu appears, and select'Connect'. In 5-10 seconds, the status shouldchange to 'Connected'.
Select the 'OK' button in the upper right corner.
If the status above does not change to 'Connected',it may help to reboot the PDA by using the stylusto depress the reboot switch on the side of the unit.(On some PDA models, the reboot switch is on thebottom of the unit.)
After the PDA reboots, recheck these settings to besure they are correct.
Page 31 of 38Getting Started
12/23/2016file:///C:/Users/efierro/AppData/Local/Temp/~hh7560.htm

Now you are ready to communicate with the system. If you have not done so already, install QViewPlus onyour PDA.
Applications on PocketPC PDAs are always running. When the power switch is turned on, the last activeapplication becomes active by default. If this was QViewPlus, it will become active. After the WiFi connects tothe QarVision Processor, it will show the list of devices.
If you purchased the PDA as part of your system, Button 4 is already set up to start QViewPlus. This pagedescribes how to set it up, in the event that you lose the setting for the button.
The screens shown here are for the HP iPAQ 110/111 series, Mobile 6.0.
Please do the following:
Configuring the PDA Buttons
Tap on "Start" in the title bar, and then tap on"Settings"
Page 32 of 38Getting Started
12/23/2016file:///C:/Users/efierro/AppData/Local/Temp/~hh7560.htm

Tap on the "Buttons" icon.
Select a button you wish to use to startQViewPlus. In this example, we use Button 4.Tap on "Button 4".
Page 33 of 38Getting Started
12/23/2016file:///C:/Users/efierro/AppData/Local/Temp/~hh7560.htm

Tap on the triangle in the "Assign a program" listbox and select "QViewPlus".
Tap on the "OK" symbol.
Page 34 of 38Getting Started
12/23/2016file:///C:/Users/efierro/AppData/Local/Temp/~hh7560.htm

Whenever you press Button 4 on the PDA, QViewPlus will start.
The system can be set up to use a Laptop or Desktop PC for the user interface, instead of a PDA. In this case,the PC must have QViewPlus installed. QViewPlus works the same, whether you are using a PDA or PC.
The PC gives you the option of connecting to the Processor either through the WiFi wireless network or a wiredLAN. QViewPlus works the same, whether you are using WiFi or the wired LAN.
Installing QViewPlus on a Laptop or Desktop PC
System Requirements PC running Windows 2000, XP, NT, Vista, or Windows 7.
Place the Installation CD in the PC. When the page appears containing the CD Contents, follow theinstructions for 'Install the QViewPlus program on your PC'.
Page 35 of 38Getting Started
12/23/2016file:///C:/Users/efierro/AppData/Local/Temp/~hh7560.htm

You are now ready to run the system. See the section called Using QViewPlus on your Laptop or Desktop PC
Note: If you are using a WiFi card with your PC, you will need to install the card andconfigure it according to the manufacturer's instructions.
Use the following parameters when configuring the WiFi card (start with thesevalues, you can change them later to suit your network):
Address "Use specific IP Address"
IP Address 192.94.148.1
Subnet Mask 255.255.255.0
Network Type '802.11 Ad-Hoc' if it is available, otherwise select 'Ad-Hoc'.Do NOT select 'Infrastructure'.
Channel 6
SSID orESSID Qameleon
Security Set the security features to match those on the Processor.
Setting up the Internet Hardware
Page 36 of 38Getting Started
12/23/2016file:///C:/Users/efierro/AppData/Local/Temp/~hh7560.htm

To use your system over the Internet, you will first need to establish an account with a service provider. If youare using the QWICcell cellular option, you will use CrossBridge Solutions as the service provider. See "SettingUp an Internet Connection" for more details.
The QWICcell cellular system establishes a Virtual Private Network to communicate with the Processors in thefield. This secure system makes your Processors appear to be on your own local network, even though they maybe anywhere in the world. The Processors must have their own unique addresses which are assigned to you bythe network service provider (CrossBridge). These addresses will be set up for you when you purchase theQWICcell unit. However, you can reconfigure them if necessary.
Note: There are many different ways to connect the Processor to the Internet. Theseinclude campus-wide WiFi, DSL, corporate networks, etc. However, they areall similar in setup to the cellular system. Please contact Qameleon Technologyand we will help you with other network configurations.
Page 37 of 38Getting Started
12/23/2016file:///C:/Users/efierro/AppData/Local/Temp/~hh7560.htm

When you install the Processor, simply connect the cellular antenna to the connector on the lid of the Processor.
The Processor Ready light has the following meaning:
The Link Status light has the following meaning:
The Link Activity light has the following meaning:
OFF Processor is not yet connected to the QWICcell.
BLINK GREEN Processor is connected to the QWICcell and ready tocommunicate over the cellular network.
OFF QWICcell is not connected to the cellular network.
ON QWICcell is connected to the cellular network.
OFF No data is being transmitted over the cellularnetwork.
FAST BLINKGREEN
Data is being transmitted over the cellular network.
Page 38 of 38Getting Started
12/23/2016file:///C:/Users/efierro/AppData/Local/Temp/~hh7560.htm

The Transient Pressure Monitoring System is a wireless system that continuously monitors the pressurein a pipe and stores this data for later retrieval. It consists of three components, a PDA, a Processor, anda set of Sensors.
You interact with the system using a program called QViewPlus that runs on the PDA, laptop ordesktop. Everything you need to do with the Transient Pressure Monitoring System is done from thisprogram, including checking the current data, setting limits, calibrating the sensors, and retrieving thestored data.
The Processor continuously monitors the pressure in the pipe and stores the data for later retrieval.When you come within communication range of the Processor with a PDA, you are shown a list ofpossible applications that can be run. The you can select one of these, and interact with it as if the PDAwere the control panel. When you move out of range of the Processor, the applications disappear fromthe PDA's list, but the last selected application continues to run in the Processor.
The Transient Pressure Monitoring System is really two instruments that can be selected, configured,and run remotely using the PDA:
the Transient Pressure Monitor, and the Differential Pressure Monitor
Both of these instruments share the same sensors and sensor calibration information. The sensors arecalibrated for both instruments from the CALIBRATE Screen of the Differential Pressure Monitor. Allother settings and parameters are unique for each instrument. This means that these settings must beindividually set for each instrument.
Running the Transient Pressure Monitoring System
Note: This manual will refer to all of the devices that run QViewPlus (PDA, laptop,desktop, etc.) as the PDA, unless there are differences in their operation.
PDA Processor Sensors
Page 1 of 61Running the Transient Pressure Monitoring System
12/23/2016file:///C:/Users/efierro/AppData/Local/Temp/~hhFF57.htm

There are two Transient Pressure Monitors that can be selected individually. An auxiliary applicationstops the current running monitor to allow you to retrieve the stored data. There are two setup programsfor configuring the optional GPS receiver and output signal.
QViewPlus runs on the PDA, and provides the graphical user interface to the Processor.
Use QViewPlus as follows:
Differential Pressure Continuously monitors the two sensors, and displays their current readingon the PDA. The maximum and minimum pressures can be seen, as well asthe dates and times of their occurrences. The readings are also stored in theProcessor for later retrieval. The Differential Pressure application is alsoused to calibrate the sensors.
Transient Pressure Continuously monitors one of the sensors to detect rapidly-occurringtransients. The actual pressure readings from the selected sensor are storedin the Processor for later retrieval. The PDA shows you the currentinformation about the transients, such as the number of events, the date andtime of the last event, and the maximum and minimum pressures that wererecorded during the last transient.
Stop Monitors This is a simple application that stops all the monitors so that the datastored in the Processor can be retrieved.
GPS Setup Enables the optional GPS receiver to precisely set the internal clock of theProcessor. Displays the current GPS coordinates and time while installingthe GPS receiver.
Output Setup Allows the user to configure the output signal that is generated when atransient is detected.
Using QViewPlus
Note: QViewPlus must be installed on your PDA before you can use it. The WiFi must also beconfigured.
Note: There is an alternate version of QViewPlus that is used for accessing the Processor overthe Internet or on a corporate intranet. This version only runs on PCs that have access tothe Internet or the intranet.
Page 2 of 61Running the Transient Pressure Monitoring System
12/23/2016file:///C:/Users/efierro/AppData/Local/Temp/~hhFF57.htm

Be sure that the WiFi is turned on. See the ConfiguringWiFi page for information on how to turn it on.
Tap on 'Start' to display the Start menu. Tap on'Programs'.
Tap on the 'QViewPlus' icon to start the application.
Alternatively, you can set one of the PDA's buttons tostart QViewPlus automatically.
Note: The program that is running in theProcessor, is designed to allow only oneQViewPlus program (PDA or laptop) toconnect to it at any given time. It would beunsafe to allow more than one user to beissuing commands or changing settings on theProcessor simultaneously.
If this is the first time that you are running QViewPlus,you must set the Access Code. Tap the 'Access Code'button.
If you have entered the Access Code in the past, or if
Page 3 of 61Running the Transient Pressure Monitoring System
12/23/2016file:///C:/Users/efierro/AppData/Local/Temp/~hhFF57.htm

your Processor does not have an access code, you donot need to do it again. You can skip this step.
Use the on-screen keypad to enter the Access Code.The keypad will appear when you tap the icon on thelower right of the screen. It will disappear when youtap the icon again.
Enter the Access Code from the data card that camewith your Processor.
In the example, we will enter the Access Code of123.123.123.123
Tap the 'OK' button after you have entered the AccessCode.
The Processor will not allow any QViewPlus programto run that does not have a matching Access Code.
If you are using QView on
Page 4 of 61Running the Transient Pressure Monitoring System
12/23/2016file:///C:/Users/efierro/AppData/Local/Temp/~hhFF57.htm

a PC, the button is called'Options' rather than'Access Code'.
If you are using QView on a PC, the 'Options'button allows you to set the Access Code asdescribed above.
It also lets you select the folder location whereDaily Data Files will be stored when they areuploaded from the Level 1 Module. Select theBrowse button for a dialog box that will let youspecify the folder.
Finally, the Options page includes a Zoomselection. If Zoom is checked, the screens for thedevices will be enlarged when displayed on a PC.If Zoom is not checked, the screens for thedevices will be displayed at the resolution atwhich they were created.
In the 'Select a Device' screen, tap on the item that you
Page 5 of 61Running the Transient Pressure Monitoring System
12/23/2016file:///C:/Users/efierro/AppData/Local/Temp/~hhFF57.htm

would like to run, then tap the 'Run' button.
The application that is currently running in theProcessor is marked with a '>' symbol. If this is the itemyou wish to select, it will continue runninguninterrupted. If your selected application is notcurrently running, this application will be terminated,and your selected application will start.
QViewPlus will upload a configuration file for the itemyou selected, and run the graphical user interface.
The 'Commands' menu contains useful commands:
Hint - not used Demo - not used Demo Next Step - not used Restart - reset the user interface. Does not effect the Processor Select a Device - return to the 'Select a Device' screen above. Set Access Code - takes you to the screen for setting the Access Code Quit - Quits QViewPlus. The program continues torun on the Processor.
In the 'Select a Device' screen, you can change the titlefor a group of devices associated with a particularProcessor. This is especially useful when there is morethan one Processor within range of the PDA. Only thetitles can be changed; the names of the devices cannotbe changed.
The title that you enter is this screen will also be
Page 6 of 61Running the Transient Pressure Monitoring System
12/23/2016file:///C:/Users/efierro/AppData/Local/Temp/~hhFF57.htm

included in email messages that the system sends toyou.
Select the title that you want to change, then tap the'Edit' button.
In the editing screen, tap the keyboard icon in the lowerright or lower center of the screen.
Tap the existing title to place the cursor in the edit box,then use the virtual keyboard at the bottom of the screento enter your new title.
Page 7 of 61Running the Transient Pressure Monitoring System
12/23/2016file:///C:/Users/efierro/AppData/Local/Temp/~hhFF57.htm

To use QViewPlus with a Level 1 Module (Processor) that is on the Internet, you must use the versionof QViewPlus that runs on a PC.
When you are finished, tap the 'OK' button.
The new title that you entered now appears on the'Select a Device' screen.
Using QViewPlus on the Internet
Note: QViewPlus must be installed on your PC before you can use it, and the Level 1 Module
Page 8 of 61Running the Transient Pressure Monitoring System
12/23/2016file:///C:/Users/efierro/AppData/Local/Temp/~hhFF57.htm

The version of QViewPlus for the Internet works exactly like the version that runs on the PDA, but withthe addition of two new buttons on the 'Select a Device' screen. These are the 'Local' button, and the'Internet' button, described below. (NOTE: if your version of QViewPlus does not have these twobuttons, please contact the manufacturer for a new version of QViewPlus for your PC).
must be set up on the Internet.
Select the 'Internet' buttonwhen you want to connectto a Level 1 Module that ison the Internet.
The first time you selectthe 'Internet' button, adialog box appears, tellingyou that no Internet unitinformation been entered.Click 'OK'.
Page 9 of 61Running the Transient Pressure Monitoring System
12/23/2016file:///C:/Users/efierro/AppData/Local/Temp/~hhFF57.htm

Select the 'Add New'button to define anInternet Unit.
Give the Unit a name thatis meaningful to you.
Enter the Unit's IP addresson the Internet. This is thefixed IP address of theLevel 1 Module on theInternet, or of the modemthat the Module isconnected to.
In most cases, you shouldleave the Port Number asthe default 49999.
After you have entered the
Page 10 of 61Running the Transient Pressure Monitoring System
12/23/2016file:///C:/Users/efierro/AppData/Local/Temp/~hhFF57.htm

information, select 'OK'.
Your newly definedInternet unit appears in thelist, along with any otherunits you have defined. Toconnect to it, select it inthe list, and then select the'Connect' button.
Note that your PC musthave a connection to theInternet, and the Unit mustbe turned on andconnected to the Internet.
When your PC connects tothe Level 1 Module overthe Internet, the populated'Select a Device' screenappears.
Select the item you want,then select the 'Run'button.
If you want to connect to a
Page 11 of 61Running the Transient Pressure Monitoring System
12/23/2016file:///C:/Users/efierro/AppData/Local/Temp/~hhFF57.htm

different Level 1 Moduleover the Internet, select the'Internet' button.
At the 'Select an InternetUnit' screen, you can addadditional Level 1Modules that are on theInternet, by selecting the'Add New' button.
You can delete a Unitfrom the list by selectingit, then clicking the'Delete' button.
You can change the name,IP address, or port numberof a Unit by selecting itand clicking the 'Edit'button.
If you want to changeQViewPlus to connectonly with local units, clickthe 'Cancel' button, andthen, quickly, on the nextscreen...
Page 12 of 61Running the Transient Pressure Monitoring System
12/23/2016file:///C:/Users/efierro/AppData/Local/Temp/~hhFF57.htm

The Differential Pressure monitor allows you to watch two pressure sensors at the same time. They canbe on the same pipe, or on different pipes.
Possible applications of the Differential Pressure monitor include:
click the Local button. Ifyou don't click the Localbutton quickly enough, theInternet Units screen willreappear.
Using the Differential Pressure Monitor
- monitoring the input and output of a pressure reduction valve- monitoring the input and output pressures of a pump- comparing two different pipes
Page 13 of 61Running the Transient Pressure Monitoring System
12/23/2016file:///C:/Users/efierro/AppData/Local/Temp/~hhFF57.htm

Using the Differential Pressure monitor is easy.
If you are using a wireless card in your PDA,such as the D-Link Air card, be sure that it isinserted in the compact flash slot on the PDA,and that its light is flashing, or is oncontinuously.
If your PDA has built-in WiFi, be sure that it isturned on. See the Configuring WiFi page forinformation on how to turn it on.
Start QViewPlus.
In the 'Select a Device' screen, tap 'DifferentialPressure', then tap 'Run'.
Page 14 of 61Running the Transient Pressure Monitoring System
12/23/2016file:///C:/Users/efierro/AppData/Local/Temp/~hhFF57.htm

The Differential Pressure monitor has 3 screens.
The first screen to appear is the RUN screen. Itdisplays the current conditions of the pressuresensors. It also shows the condition of any Alertsignals.
The second screen is the SETUP screen. You canset the limits for the pressures, as well as theidentifier of the monitor.
The third screen is the CALIBRATE screen forthe entire system. This is used to set thecalibration values for the two sensors, as well
Page 15 of 61Running the Transient Pressure Monitoring System
12/23/2016file:///C:/Users/efierro/AppData/Local/Temp/~hhFF57.htm

The Differential Pressure Monitor RUN screen gives you access to all of the current information fromthe sensors, as well as historical data.
synchronizing the time in the Processor with thetime in the PDA.
Differential Pressure RUN Screen
The RUN screen shows the current pressures fromSensor 1 and Sensor 2. The colored bars indicate howthe current pressures compare to the user-set limits.
Between the pressures is a green light that flashes everytime a sensor reading is sent to the PDA (approx. onceper second). If this light is not flashing, you are
Pressure is below the Low Limit for thesensor.
Pressure is above the Low Limit for thesensor and below the High Limit.
Pressure is above the High Limit for thesensor.
Page 16 of 61Running the Transient Pressure Monitoring System
12/23/2016file:///C:/Users/efierro/AppData/Local/Temp/~hhFF57.htm

probably out of range of the Processor.
Tapping on the red Sensor 1 box will display the historyof the sensor. This shows the maximum and minimumpressures for that sensor, and the times when theyoccurred. This history covers the period from the timethe data was Reset (described below) and the presenttime.
Tapping on the green Sensor 2 box will display thehistory of that sensor. You can alternate between thetwo histories by clicking on the appropriate box. When
Page 17 of 61Running the Transient Pressure Monitoring System
12/23/2016file:///C:/Users/efierro/AppData/Local/Temp/~hhFF57.htm

you are finished, tap in the white box, and the historybox will be turned off.
The red light on the RUN screen indicates the status ofthe ALERT switch. This can be used for anything, suchas a float switch indicating a flood. When the switch isclosed, the red light will flash and the PDA will sound abeep.
The PDA maintains a file of the current readings andthe history of the sensors. Tapping on the SAVE andRESET button will append the readings from thismonitor to the file for later analysis. This is useful fortracking the readings of the monitors over time. The IDof the monitor is recorded with the readings. Having aunique ID for each monitor allows you to collectreadings from any number of monitors in the same file.
Page 18 of 61Running the Transient Pressure Monitoring System
12/23/2016file:///C:/Users/efierro/AppData/Local/Temp/~hhFF57.htm

The Differential Pressure Monitor SETUP screen lets you set the parameters of the monitor any timeyou wish. These values set the limits for the sensors, identify this particular monitor, and determine howoften the current readings are recorded in the DPhistory.dat file.
A PC program called ConvertData will later retrieve thefile from the PDA and create a comma-separated-variable (.csv) file which is compatible with mostspreadsheet programs.
Differential Pressure SETUP Screen
The colored bars associated with each sensor indicateshow the current readings compare to the preset limits.
You can set the acceptable pressure limits for thesensors whenever you wish by tapping the SETUPbutton.
Page 19 of 61Running the Transient Pressure Monitoring System
12/23/2016file:///C:/Users/efierro/AppData/Local/Temp/~hhFF57.htm

The SETUP screen shows the current settings of theDifferential Pressure monitor. You can change theseanytime you wish.Monitor ID: a unique number to identify this
monitor. (Up to 8 digits.)
Sensor HighLimit
The high pressure limit for thesensor. Above this, the sensor barturns red. (0 - 9999)
Sensor LowLimit
The low pressure limit for thesensor. Below this, the sensor barturns black. (0 - 9999)
History Interval The interval at which the currentreadings are written to theDPhistory.dat file. ( 1 - 1440 mins.)
To set one of the values, tap in the box surrounding thevalue.
Page 20 of 61Running the Transient Pressure Monitoring System
12/23/2016file:///C:/Users/efierro/AppData/Local/Temp/~hhFF57.htm

A keypad will appear that allows you to set the chosenvalue (highlighted in orange). Tap each number, andthen SET to save the value, or CANCEL to keep the oldvalue.
When you are finished setting the values, tap on theRUN button to return to the RUN screen. The valuesyou entered will be saved in the Processor and usedwhenever the monitor is started.
Page 21 of 61Running the Transient Pressure Monitoring System
12/23/2016file:///C:/Users/efierro/AppData/Local/Temp/~hhFF57.htm

The Differential Pressure Monitor CALIBRATE screen is used to calibrate the sensors for the entireTransient Pressure Monitoring System. You must use this screen to calibrate the sensors even if you areonly going to use the Transient Pressure Monitors. The Processor has its own internal clock which isused for the recordings. You can synchronize the clock in the Processor with the PDA clock using thisscreen.
If you wish to calibrate the sensors, or set the time inthe Processor, tap on the CALIBRATE button.
Differential Pressure CALIBRATE Screen
Note: The sensors that came with your system may have different pressure ranges. They arealready calibrated for their respective locations (connectors) on the Processor.
If you swap Sensor 1 and Sensor 2 between connectors, you will have to recalibrate thesoftware. Use this procedure to calibrate them.
The CALIBRATE screen is used to set theparameters that are used by the whole TransientPressure Monitoring System.
Before using the system, you should synchronizethe clock in the Processor with the PDA. First, setthe time zone and time on the PDA. See themanual that came with your PDA to see how toset its time. Be sure that the time zone is setcorrectly on the PDA, as well as the time. If itis not, the time in the Processor will not be set
Page 22 of 61Running the Transient Pressure Monitoring System
12/23/2016file:///C:/Users/efierro/AppData/Local/Temp/~hhFF57.htm

correctly.
Once the time zone and time are set on the PDA,simply tap on the Sync. button to synchronize thetime in the Processor with the time on the PDA.
Over time, the clocks may drift apart. It is a goodidea to periodically synchronize them.
If you need to calibrate the sensors, you willneed a gauge that will serve as the standard.(The accuracy of the calibration is dependent onthe user's needs. Having precise calibration maynot be absolutely necessary, since the transientpressure detection is based on relative pressurechanges.)
The gauge should be in the same circuit as thesensor and there should be a way to turn off theflow to the sensor.
For each sensor to be calibrated, turn off the flowto the sensor so that there is no pressure. Thentap on the appropriate ZERO button. This will setthe zero point of the sensor.
Page 23 of 61Running the Transient Pressure Monitoring System
12/23/2016file:///C:/Users/efierro/AppData/Local/Temp/~hhFF57.htm

You can set the zero point of both sensors, if youwish.
Open the valve to each sensor, and read thepressure on each gauge.
Tap in the box surrounding the NOW value of theparticular sensor.
A keypad will appear that allows you to set thechosen value (highlighted in orange). Tap eachnumber, and then SET to save the value, orCANCEL to keep the old value.
Page 24 of 61Running the Transient Pressure Monitoring System
12/23/2016file:///C:/Users/efierro/AppData/Local/Temp/~hhFF57.htm

The value you see in the corresponding Now boxshould match the pressure shown on the gauge.
When you are finished setting the values, tap onthe SETUP button to return to the SETUP screen.The values you entered will be saved in theProcessor and used whenever the monitor isstarted.
Note: For precise calibration, you should apply a steady pressure that is near the upper limit ofthe sensor. This will minimize errors in calculating the pressure.
For example, a 500 PSI sensor should be calibrated with at least a 400 PSI referencepressure.
Page 25 of 61Running the Transient Pressure Monitoring System
12/23/2016file:///C:/Users/efierro/AppData/Local/Temp/~hhFF57.htm

The Transient Pressure monitor is a unique instrument that watches for, and records, the occurrences ofrapid changes in pressure. Transient pressures do not last very long, typically from a few milliseconds toseveral minutes. In most pipelines, the pressure is relatively steady most of the time. The TransientPressure Monitor will detect and record only the transients at a high frequency. Steady-state backgroundpressures will be recorded at a much lower rate. This will preserve records of the transient, while savingyou the time of manually examining extensive, redundant, high-frequency data.
Possible applications of the Transient Pressure monitor include:
The Transient Pressure monitor is very flexible and has a lot of features. Please see the section on "Howthe Transient Pressure Monitor Works".
Using the Transient Pressure Monitor
- initial pipeline filling- initial operational testing- pump startup- long-term monitoring of large diameter pipes- performance of valves and pumps- simulated power loss testing- filter back-wash sequences- diversion of fluids
If you are using a wireless card in your PDA,
Page 26 of 61Running the Transient Pressure Monitoring System
12/23/2016file:///C:/Users/efierro/AppData/Local/Temp/~hhFF57.htm

such as the D-Link Air card, be sure that it isinserted in the compact flash slot on the PDA,and that its light is flashing, or is oncontinuously.
If your PDA has built-in WiFi, be sure that it isturned on. See the Configuring WiFi page forinformation on how to turn it on.
Start QViewPlus.
In the 'Select a Device' screen, tap 'TransientPressure (SENSOR 1)' or 'Transient Pressure(SENSOR 2)', then tap 'Run'.
Both Transient Pressure monitors work in exactlythe same way, but they are actually 2 separatemonitors.
The Transient Pressure monitor has 2 screens.
The first screen to appear is the RUN screen. ItDisplays the current conditions of the monitor. Italso allows you to control the operation of themonitor. Note that this monitor is for SENSOR 1.
The second screen is the SETUP screen. All ofthe settings for the monitor are made from thisscreen. The parameters are described in the
Page 27 of 61Running the Transient Pressure Monitoring System
12/23/2016file:///C:/Users/efierro/AppData/Local/Temp/~hhFF57.htm

The Transient Pressure Monitor can also generate output signals when pressure transients are detected.This signal can be used to turn on an alarm bell, a warning light, send a signal to a PLC or SCADARTU, or anything that uses an ON/OFF signal..
The Transient Pressure Monitor RUN screen displays the current information about transients that havebeen detected using the specific sensor. Both monitors (SENSOR 1 and SENSOR 2) work in exactly thesame way. The RUN screen also contains the controls for the monitor.
section called "How the Transient PressureMonitor Works".
Transient Pressure RUN Screen
Page 28 of 61Running the Transient Pressure Monitoring System
12/23/2016file:///C:/Users/efierro/AppData/Local/Temp/~hhFF57.htm

As the Transient Pressure Monitor runs, it writes its data to its corresponding TPdata.dat file.
The RUN screen shows the currently selected sensorand Monitor ID. The ID is used by the QAnalyzeprogram to group together the readings for plotting.You should pick different Monitor IDs for each sensorand for each installation of the Transient PressureMonitoring System.
The Background Level is the current Average pressurefrom the sensor. The Average is determined by theSamples Averaged setting in the SETUP screen.
The Sample Time is the time of the last backgroundaverage reading taken.
On the right side is a green light that flashes every timea background average is sent to the PDA (determinedby the Background Sample Rate). If this light is notflashing, there are three possible reasons:
- The monitor was just started with a new SamplesAveraged setting.
- A transient is in progress and is being recorded.
Page 29 of 61Running the Transient Pressure Monitoring System
12/23/2016file:///C:/Users/efierro/AppData/Local/Temp/~hhFF57.htm

The Transient Pressure Monitor SETUP screen is used to set the parameters for the way the monitor willrun. Both monitors (SENSOR 1 and SENSOR 2) work in exactly the same way. However, each monitorhas its own settings.
As the Transient Pressure Monitor runs, it writes its data to its corresponding TPdata.dat file.
- You are out of range of the Processor.
The maximum and minimum Averagepressure values are shown, as well as thenumber of transient pressure Events that havebeen recorded.
When the monitor is started, the pressurevalues will be -9999 until the average iscomputed.
The date and time of the last transient pressure Event isshown, as well as the maximum and minimum pressurevalues that were recorded during the last Event.
If no Events were detected since the monitor wasstarted, the pressure values will be -9999.
The date and time that the monitor was started is shownalong with the duration of this run.
The buttons on the bottom of the screen control theoperation of the monitor. Tap GO to start the operationand STOP to end it. When the monitor is running, thered light will flash approximately every 2 seconds.
Starting the monitor will reset all of the pressure values,dates, and counts.
Tap on the SETUP button to change the monitor'ssettings. The monitor will be stopped.
Transient Pressure SETUP Screen
Page 30 of 61Running the Transient Pressure Monitoring System
12/23/2016file:///C:/Users/efierro/AppData/Local/Temp/~hhFF57.htm

To set one of the values, tap in the boxsurrounding the value.
A keypad will appear that allows youto set the chosen value. Tap eachnumber, and then SET to save thevalue, or CANCEL to keep the oldvalue.
The Monitor ID is used by the QAnalyze program togroup together the readings for plotting. You shouldpick different Monitor IDs for each sensor and for eachinstallation of the Transient Pressure MonitoringSystem.Minimum Maximum
0 99999999
The GREEN group of settings control the detection andrecording of transient events. The monitor stores thetransient data in its TPdata.dat file.
START RECORD
Manual Start recording at the High Frequency as soonas the monitor starts.
Auto Start recording at the High Frequency whenthe current pressure deviates from theBackground Level by more than the
Page 31 of 61Running the Transient Pressure Monitoring System
12/23/2016file:///C:/Users/efierro/AppData/Local/Temp/~hhFF57.htm

Threshold and Absolute Difference.
Minimum Maximum Units
High Frequency 1* 1000 mSec
Threshold(St.Dev.x10) 0 1000
*Note: The fastest recording rate is a function ofmany factors of the system's operation. 10mSec is a reliable minimum, but you mayfind that a faster speed works in yourapplication. You should collect some datausing your chosen rate and examine theactual recording rate.
The YELLOW group of settings are used by both theSTART RECORD and STOP RECORD.
The current pressure must deviate from the BackgroundLevel by more than this amount (+/-) to start transientrecording.
The current pressure must deviate from the BackgroundLevel by less than this amount (+/-) to stop transientrecording.
Minimum Maximum Units
Absolute Difference 1 1000 PSI
The RED group of settings control the detection of theend of a transient event.
STOP RECORD
Manual Stop recording at the High Frequency afterthe Manual Record Time has elapsed.
Stop recording at the High Frequency whenthe current pressure deviates from the
Page 32 of 61Running the Transient Pressure Monitoring System
12/23/2016file:///C:/Users/efierro/AppData/Local/Temp/~hhFF57.htm

The Transient Pressure monitor can be used in many different situations. Most of the time, you will wantto adjust the settings to give you the best results. See the the section on "Recommended Settings" to geta starting point.
Auto Background Level by less than the Thresholdand Absolute Difference.
Minimum Maximum Units
Manual Record Time 1 1000 Sec
Threshold(St.Dev.x10) 0 1000
The BLUE group of settings control the sampling,averaging, and recording of the Background Level
The Background Level is calculated by taking theaverage of the specified number of samples which weregathered at the Background Sample Rate.
The monitor stores the Background Level in itsTPdata.dat file at the Background Record Rate. This isstored in Seconds. You can enter this in hours, minutes,or seconds by clicking on the yellow button
Minimum Maximum Units
Background SampleRate 10 10000 mSec
Background RecordRate 1
86400144024
SecMinHr
Number of SamplesAveraged 2 100
Entered as seconds
Entered as minutes
Entered as hours
When you are finished setting the values, tap on theRUN button to return to the RUN screen. The valuesyou entered will be saved in the Processor and usedwhenever the monitor is started.
Page 33 of 61Running the Transient Pressure Monitoring System
12/23/2016file:///C:/Users/efierro/AppData/Local/Temp/~hhFF57.htm

The Transient Pressure Monitor is a unique instrument that watches for, and records, the occurrences ofrapid changes in pressure. Transient pressures do not last very long, from a few milliseconds to severalseconds. Most of the time, the pressure is relatively steady.
Transient pressures can occur in a pipe at any time. They can be caused by a number of events, such aspumps turning on and off, valves opening and closing, and power failures. It is a tedious task tocontinually watch the pressure in a pipe for transients, since they occur very fast, and not very often.
Recording these transient pressures with a computer is a matter of taking samples of the pressure atknown points in time. The number and rate of sampling affects how long you can monitor the pipe.
Once the samples are recorded they must be examined to find the transients. It can take a long time for aperson to perform this task. The Transient Pressure Monitoring System can identify the transientsautomatically.
The Monitor can be tailored to different situations by using the SETUP screen and setting the operatingparameters. The following pages explain what the settings do:
How the Transient Pressure Monitor Works
- Sampling and Recording
- Background vs. Transients
- Background Averaging
- Automatic Transient Recording
- Manual Transient Recording
Page 34 of 61Running the Transient Pressure Monitoring System
12/23/2016file:///C:/Users/efierro/AppData/Local/Temp/~hhFF57.htm

Recording transient pressures with a computer is a matter of taking samples of the pressure at knownpoints in time, and then storing them in a file. The number of samples and the rate at which they aremeasured affects how long you can monitor the pipe. Any pressure recorder is limited by how muchmemory is has. The total number of samples that can be stored determines the usefulness of the monitor.
Sampling and Recording
Sampling is the process oftaking a single reading fromthe sensor. The sample ratedetermines both the accuracyof the recording and theamount of data you mustrecord.
The RED dots represent a fastsample rate. The GREEN dotsrepresent a slow sample rate,10 times longer.
High Frequency sampling(fast) captures most of thedetails of the pressure signal.However, it generates a lot ofdata. Sometimes a slower rateis good enough to capture the"look" of the transient.
A slower sampling rategenerates a lot less data, butcan miss the details of thetransients entirely.
The Transient PressureMonitor always samplesvery fast to detect transients.When a transient is detected,it records the pressure at theHigh Frequency rate. Afterthe transient is finished, itrecords at a slowerBackground Rate. This allowsyou to run for a long timewithout filling up the
Page 35 of 61Running the Transient Pressure Monitoring System
12/23/2016file:///C:/Users/efierro/AppData/Local/Temp/~hhFF57.htm

The pressures in pipes are never constant. They rise and fall over time due to many factors, such as thedemand or the number of pumps operating. This is normal. So when a transient occurs, we need todistinguish it from the normal pressure variations in the pipe. This is not always an easy task.
The Transient Pressure Monitor detects the rapid change in pressure from the normal background level.So it is important to establish what the "Background Level" is. This is described in the next section,Background Averaging.
monitor's memory, and makesfinding transients in the datavery easy.
The Transient Pressure SETUP screen allow you tochange the High Frequency rate for recording thetransients, and the Background Record Rate forrecording the background readings.
Background vs. Transients
Some transients are easy todistinguish, such as the onesshown in RED. Sometimesthe background is easy to tellalso.
There are many times when itis not easy to tell. Are weseeing a slow transient, or justa normal change in thebackground pressure?
Page 36 of 61Running the Transient Pressure Monitoring System
12/23/2016file:///C:/Users/efierro/AppData/Local/Temp/~hhFF57.htm

The Transient Pressure Monitor detects the rapid change in pressure from the normal background level.So it is important to establish what the "Background Level" is. The Transient Pressure SETUP Screenhas settings for determining the Background Level of the pipe.
The Background Level is the average pressure in the pipe measured at a fixed rate. Calculating a good,representative average is a matter of selecting the rate at which the samples will be included in thecalculation, and the number of samples considered.
Background Averaging
The Transient PressureMonitor always samples veryfast to detect transients.However you do not want touse all of these readings todetermine the BackgroundLevel, since it will take a longtime and result in a level thatmay not reflect the current"normal" pressure in the pipe.
The two factors thatdetermine the average are theBackground Sample Rateand the number of SamplesAveraged.
The Background SampleRate determines how oftenthe background average iscalculated. If it is too fast, it issusceptible to minor changes.If it is too slow, it will notkeep up with the current stateof the pipe.
Setting this rate is often a trialand error process.
The default setting to theProcessor as delivered to youis 50 mSec, or 20 times persecond.
The number of SamplesAveraged determines howsensitive the BackgroundLevel is to changes in the
Page 37 of 61Running the Transient Pressure Monitoring System
12/23/2016file:///C:/Users/efierro/AppData/Local/Temp/~hhFF57.htm

The Transient Pressure Monitor detects the rapid change in pressure from the normal background level.So it is important to establish what "rapid" means and what is considered a significant change.
The Transient Pressure SETUP Screen has settings for determining the start and end of a transient.
Automatic transient detection is based on the Threshold for the change from the Background Level and
pressure. In other words, whatis considered the "normal"pressure in the pipe at anygiven time.
Averaging a lot of samplescauses the average to changemore slowly, and makestransients stand out, but canidentify transients that are notreally there. Averaging toofew samples may miss thetransients.
The default setting to theProcessor as delivered to youis 100 samples. You canadjust this as needed..
The Transient Pressure SETUP screen allows you tochange the Background Sample Rate forspecifying when to include a pressure reading in theaverage Background Level. You can also change thenumber of Samples Averaged when determiningthe background.
Other settings are used to automatically recordtransients and to manually control the recording oftransients.
Automatic Transient Recording
Page 38 of 61Running the Transient Pressure Monitoring System
12/23/2016file:///C:/Users/efierro/AppData/Local/Temp/~hhFF57.htm

the Absolute Difference of the sample from the background level.
The START Threshold andthe STOP Thresholdrepresent the amount that asample can deviate from theBackground Level and not beidentified as a transient. (Thisis actually the StandardDeviation from theBackground Level x10. Butyou can think of it as arelative number.)
When a sample deviates fromthe Background Level bymore than the Start Threshold,the monitor starts recording itas a transient, shown inPURPLE.
When the sample deviates lessthen the STOP Threshold, themonitor terminates thetransient and records onlybackground readings, shownin BLUE.
The STOP Threshold is oftenset lower than the STARTThreshold, to ensure that theentire transient is recorded.
Because these thresholds arebased on standard deviation,their absolute value variesaccording to the amount ofvariation in the actual pressuredata. When the pressurevalues are stable, the standarddeviation is small. When thepressure is changing, thestandard deviation is large.
Determining the Thresholdlevels is often a trial and errorprocess.
Note:
The START and STOP Thresholds are shown asrectangles. This is because they are calculated onlywhen the Background Level is determined. Thishappens less often than the actual pressure sampling,and stays in effect until the background average iscalculated again.
Sometimes the pressure isquite stable, and has little
Page 39 of 61Running the Transient Pressure Monitoring System
12/23/2016file:///C:/Users/efierro/AppData/Local/Temp/~hhFF57.htm

variation. In this case theThresholds represent verysmall deviations from theBackground Level.
This makes the TransientPressure monitor verysensitive, and it may detect atransient when it is actuallyjust an insignificant change.
The Absolute Difference isused in conjunction with theThresholds to ensure that thesample actually varies enoughfrom the Background level tobe called a transient. TheAbsolute Difference is thedifference between a pressurevalue and the BackgroundLevel.
To qualify as a transient, thesample must deviate from theBackground Level by morethan the Start Threshold and itmust deviate by at least theAbsolute Difference.
When the sample deviates lessthan the STOP Threshold andless then the AbsoluteDifference, the monitorterminates the transient.
In this example, the points atA do not meet bothconditions,. The points at B domeet them, and a transient,shown in PURPLE, isrecorded.
Note:
If the START Threshold is set to 0, only theAbsolute Difference will be used to trigger thetransient recording.
If the STOP Threshold is set to 0, the sample willhave to equal the Background Level EXACTLYbefore the transient recording will stop. It is not agood idea to set the STOP Threshold to 0.
The Transient Pressure SETUP screen allow you to
Page 40 of 61Running the Transient Pressure Monitoring System
12/23/2016file:///C:/Users/efierro/AppData/Local/Temp/~hhFF57.htm

The Transient Pressure Monitor detects the rapid change in pressure from the normal background level.The monitor can detect the start and end of a transient automatically, or you can manually control thisprocess.
Transients are shown in PURPLE in the following illustrations.
specify that transient recording will START andSTOP Automatically.
The Threshold and the Absolute Difference specifywhen a change is rapid and significant.
You can also manually specify when a transient isrecorded.
Manual Transient Recording
The Transient Pressure SETUP screen allows you tospecify how the recording will START and STOP.
You can specify Manual or Automatic separatelyfor starting and stopping the recording.
The Manual Record Time specifies how long therecording process will last when Manual STOP ischecked.
Page 41 of 61Running the Transient Pressure Monitoring System
12/23/2016file:///C:/Users/efierro/AppData/Local/Temp/~hhFF57.htm

START RECORD =Automatic
STOP RECORD =Automatic
The monitor automaticallydetects and starts recordingtransients. It stops recordingautomatically, when thestopping conditions are met.
START RECORD =Automatic
STOP RECORD = Manual
In this case, whenever themonitor automatically detectsand starts recording atransient, it will stop recordingafter the Manual RecordTime has elapsed.
START RECORD =Manual
STOP RECORD = Manual
This allows manual recordingof data from the sensor at theHigh Frequency rate.
The recording starts as soon asthe RUN button is tapped onthe Transient Pressure RUNScreen. The recording stopsafter the Manual RecordTime has elapsed.
Page 42 of 61Running the Transient Pressure Monitoring System
12/23/2016file:///C:/Users/efierro/AppData/Local/Temp/~hhFF57.htm

The Transient Pressure Monitor can be used in many different situations. The choice of the settings areoften best determined by trial and error.
Here are some recommended starting settings for different situations:
Only 1 transient is recorded.
START RECORD =Manual
STOP RECORD =Automatic
In this case, the recordingstarts as soon as the RUNbutton is tapped, but stopsalmost immediately, since thepressure readings are alreadybelow the STOP Threshold.
This combination is notuseful. In most cases, theresults will beunpredictable.
Recommended Settings
- 6" diameter pipe with nominal operating pressure of 100 PSI - manual 5 second recording
- 10" diameter pipe with nominal operating pressure of 200 PSI - automatic recording
Page 43 of 61Running the Transient Pressure Monitoring System
12/23/2016file:///C:/Users/efierro/AppData/Local/Temp/~hhFF57.htm

6" diameter pipe with nominal operating pressure of 100 PSI - manual 5 second recording
10" diameter pipe with nominal operating pressure of 200 PSI - automatic recording
PRV output with nominal operating pressure of 100 PSI - automatic recording
- PRV output with nominal operating pressure of 100 PSI - automatic recording
Setting Value Units
START RECORD Auto
High Frequency 50 mSec
Threshold (St.Dev.x10) 20
Absolute Difference 10 PSI
STOP RECORD Manual
Manual Record Time 5 Sec
Threshold (St.Dev.x10) 10
Background Sample Rate 50 mSec
Background Record Rate 1 Hr
Samples Averaged 100
Setting Value Units
START RECORD Auto
High Frequency 50 mSec
Threshold (St.Dev.x10) 30
Absolute Difference 20 PSI
STOP RECORD Auto
Manual Record Time 5 Sec
Threshold (St.Dev.x10) 20
Background Sample Rate 500 mSec
Background Record Rate 1 Hr
Samples Averaged 100
Setting Value Units
START RECORD Auto
Page 44 of 61Running the Transient Pressure Monitoring System
12/23/2016file:///C:/Users/efierro/AppData/Local/Temp/~hhFF57.htm

The Processor has a fairly accurate internal clock. The optional GPS receiver can be used to provide avery accurate time standard for all of the time measurements in the system.
When the GPS is enabled, and the satellites have been acquired, the Processor's internal clock is updatedevery hour to within a few milliseconds of the GPS time. This happens on the hour, every hour.
High Frequency 50 mSec
Threshold (St.Dev.x10) 30
Absolute Difference 10 PSI
STOP RECORD Auto
Manual Record Time 3 Sec
Threshold (St.Dev.x10) 20
Background Sample Rate 500 mSec
Background Record Rate 1 Hr
Samples Averaged 100
Using the GPS Setup Program
If you are using a wireless card in your PDA,such as the D-Link Air card, be sure that it isinserted in the compact flash slot on the PDA,and that its light is flashing, or is oncontinuously.
If your PDA has built-in WiFi, be sure that it isturned on. See the Configuring WiFi page forinformation on how to turn it on.
Start QViewPlus.
In the 'Select a Device' screen, tap 'GPS Setup',then tap 'Run'.
The GPS Setup program has only one screen.When the GPS is enabled and acquiring location
Page 45 of 61Running the Transient Pressure Monitoring System
12/23/2016file:///C:/Users/efierro/AppData/Local/Temp/~hhFF57.htm

information from the satellites, the Latitude andLongitude will be displayed. The Time from theGPS satellites will also be displayed. If you donot see this information, you will need toreposition the receiver.
Note: It may take several minutes toacquire the satellites. This isparticularly true if the unit hasbeen turned off for an extendedperiod of time.
This program has only one control. Tapping the"No GPS" will turn off the GPS so that it willnot be used for adjusting the time.
To turn the GPS on again, tap the "Use GPS"button.
Page 46 of 61Running the Transient Pressure Monitoring System
12/23/2016file:///C:/Users/efierro/AppData/Local/Temp/~hhFF57.htm

The Transient Pressure Monitoring System system can produce an output signal whenever a transient isdetected. This is a relay contact located on the Output connector that is closed when a spike is detectedin the Transient Pressure programs. This relay contact closure can be used as an input to a SCADAtelemetry unit, to turn on a light or warning bell, or any other device that uses an ON and OFF switch.
You can specify how the output signal will behave.
Using the Output Setup Program
If you are using a wireless card in your PDA, such asthe D-Link Air card, be sure that it is inserted in thecompact flash slot on the PDA, and that its light isflashing, or is on continuously.
If your PDA has built-in WiFi, be sure that it is turnedon. See the Configuring WiFi page for information onhow to turn it on.
Start QViewPlus.
Page 47 of 61Running the Transient Pressure Monitoring System
12/23/2016file:///C:/Users/efierro/AppData/Local/Temp/~hhFF57.htm

In the 'Select a Device' screen, tap 'Output Setup', thentap 'Run'.
Select one of the parameters to change by tapping theappropriate button or the corresponding white box.
The three buttons at the top of the screen select themode for the output signal. Only one of these can beselected at a time.
No output is produced regardless of theconditions.
The relay contact is closed when a transientis detected. The contact is opened when the
Page 48 of 61Running the Transient Pressure Monitoring System
12/23/2016file:///C:/Users/efierro/AppData/Local/Temp/~hhFF57.htm

The Differential Pressure Monitor and the Transient Pressure Monitors record their data in files that arestored on the Processor. You can easily retrieve these files using the PDA, for later analysis.
transient has passed.
The relay contact is closed when a transientis detected. The contact is opened when thespecified time has elapsed, regardless of thepressure.
When the PULSE mode is set, the output relay willclose when a transient is detected. Tap on the white boxto set the length of the pulse.
The keypad will appear. Tap on the number you wish toenter. Tap on the Set button to change the limit value orCancel to keep the old one.
The acceptable range for the chosen value is shown tothe right of the keypad. If you enter a value outside ofthis range, it will be corrected to the upper of lowerlimit of the range.
When the Retrigger box is cleared, the output relay willclose once for the duration of the Pulse Length. It willthen open, regardless of the pressure. If the Retriggerbox is set, the output relay will close and stay closed forthe duration of the pulse length after the pressure valuesare back to normal. In other words, the output relaykeeps resetting itself to the closed position.
Tap on the Retrigger check box to toggle its value.
Minimum Maximum Units
Pulse Length 1 1000 Sec
The channel selection buttons are not used in theTransient Pressure Monitoring System. The currentchannel (Sensor 1 or Sensor 2) will trigger the output.
Retrieving the Data Files
Monitor File name Description
Page 49 of 61Running the Transient Pressure Monitoring System
12/23/2016file:///C:/Users/efierro/AppData/Local/Temp/~hhFF57.htm

When Switch 3 inside the box is set to 'OFF' (see diagram below), the Transient Pressure Monitor has 3single data files as shown in the table above.
When Switch 3 is set to 'ON', a new data file for each of the 3 types is created every day. This keeps thesize of the individual data files relatively small, which is important if the wireless connection is slow orexpensive. The file names contain the date at the beginning of the name, for example: 2009-07-21-PTD_Sensor_1_data.dat
When Switch 4 is set to 'ON', deleted data files are actually moved to a folder named 'Backup' on theLevel 1 Module, rather than being deleted. This is called the 'Hidden Backup' feature.
Differential Pressure DPhistory.dat Settings, current readings, and statistics,recorded at user-specified intervals.
Transient Pressure(SENSOR 1) PTD_Sensor_1_data.dat
Settings, background averages, fulltransient data, recorded as specified byuser.
Transient Pressure(SENSOR 2) PTD_Sensor_2_data.dat
Settings, background averages, fulltransient data, recorded as specified byuser.
Note: The Level 1 module stores its data on a USB memory "flash drive" located on the maincircuit board. The Level 1 Module has 1GByte of memory or more available for data,allowing the unit to record for a very long time. However, this will take a long time toupload using the PDA. If you are using the QWICcell cellular option, this will be veryexpensive. You may wish to remove the USB memory from the Level 1 unit and copy thefiles directly to your PC. Instructions for doing this are in the "Accessing the USBMemory" memory section of the manual.
Page 50 of 61Running the Transient Pressure Monitoring System
12/23/2016file:///C:/Users/efierro/AppData/Local/Temp/~hhFF57.htm

Retrieving Single Data Files
Select the monitor whose files you wish toupload. In this case, select "DifferentialPressure", and then tap on the Files button.
You will see a list of the files that are associatedwith that monitor. Select the .dat file, and tap onUpload.
Note that there may be a file called ErrorFile.txt.In the unlikely event that the Processor has anerror, it will write a message to this file. Uploadthe file, and read it in a text editor. Please contactQameleon Technology if this happens.
If the file is preceded by "Cannot read the file ",it means that either the Processor is performingsome action on the file that cannot be interrupted,or the file has not yet been created. Stop themonitor if necessary, and try again.
You can name the uploaded file anything that youwish. Tap the filename, and use the keyboard tochange it to the name that you want. In theexample at right, the uploaded file will be named'DPhistory 6-10'. The 'Type:' field shows whatwill be appended to the end of the name, in thiscase, '.dat'. The final file name will be 'DPhistory6-10.dat'.
Page 51 of 61Running the Transient Pressure Monitoring System
12/23/2016file:///C:/Users/efierro/AppData/Local/Temp/~hhFF57.htm

The file will be stored in the '\My Documents'folder on the PDA. If you would like to have itstored elsewhere, use the pull-down list in the'Folder:' field to select another location. In thisexample, the file will be stored in the '\MyDocuments\Business' folder.
Finally, click OK. After a short delay, the filewill be stored on the PDA.
As the monitors run, they append their new datato the existing data (.dat) files on the Processor.After uploading a file, it is a good idea to deleteit, and start over with an empty file.
Select the monitor, and tap on the Files button.
Select the file you wish to delete, and then tap onthe Delete button.
Page 52 of 61Running the Transient Pressure Monitoring System
12/23/2016file:///C:/Users/efierro/AppData/Local/Temp/~hhFF57.htm

Stopping the Monitors
If you see the text "Cannot read the file ..." in the QView window, it means that the file either has notbeen created yet, or that the monitor is currently writing to the file. Wait a few seconds and then tryagain.
The Monitors lock their data files when they are writing to the files. This can occur if you have specifiedthat the files be written at short time intervals. You need to stop the monitors first. Do the following:
You will be asked to confirm the deleteoperation. Tap Yes to delete the file, or No tokeep it on the Processor.
Page 53 of 61Running the Transient Pressure Monitoring System
12/23/2016file:///C:/Users/efierro/AppData/Local/Temp/~hhFF57.htm

From the selection screen, select "EmergencyStop for Monitors", and tap on the Run button.
When the red screen appears, tap on Commands.
Tap on Select a Device.
Page 54 of 61Running the Transient Pressure Monitoring System
12/23/2016file:///C:/Users/efierro/AppData/Local/Temp/~hhFF57.htm

Follow the steps above to retrieve the data filesthat you want.
Do not forget to restart a monitor when youare finished uploading the files. Select the
Page 55 of 61Running the Transient Pressure Monitoring System
12/23/2016file:///C:/Users/efierro/AppData/Local/Temp/~hhFF57.htm

Retrieving Daily Data Files
monitor you want, and tap the RUN button.
From the 'Select a Device' screen, select'Transient Pressure (SENSOR 1)', and then tapthe 'Files' button.
You will see the 'PTD_Sensor_1_data.dat' file.Select it, and tap the 'Upload' button.
Note that there may be a file called ErrorFile.txt.In the unlikely event that the Processor has an
Page 56 of 61Running the Transient Pressure Monitoring System
12/23/2016file:///C:/Users/efierro/AppData/Local/Temp/~hhFF57.htm

error, it will write a message to this file. Uploadthe file, and read it in a text editor. Please contactQameleon Technology if this happens.
If the file is preceded by "Cannot read the file ",it means that either the Processor is performingsome action on the file that cannot be interrupted,or the file has not yet been created. Wait aminute, and then try again.
QView will tell you first and last dates on whichit has a data file of the type you selected.
Now, you must specify the first and last file datesthat you want to upload. (QView will upload thefiles from those dates, as well as all the dates inbetween.)
Tap the box to the right of 'Start Date'.
A calendar appears, with the first file datehighlighted. Select the starting date for fileupload, then tap the 'OK' button.
Page 57 of 61Running the Transient Pressure Monitoring System
12/23/2016file:///C:/Users/efierro/AppData/Local/Temp/~hhFF57.htm

Repeat for the 'End Date'.
Select the 'OK' button.
QView will tell you the number of files and thetotal number of bytes that will be uploaded. Ifyou want to continue with the upload, select the
Page 58 of 61Running the Transient Pressure Monitoring System
12/23/2016file:///C:/Users/efierro/AppData/Local/Temp/~hhFF57.htm

'Yes' button.
Select the 'Begin Upload' button.
As QView uploads the files, it shows you thename of the file currently being uploaded, and aprogress bar that indicates how much of the filehas been uploaded so far.
The files are stored in the 'DailyFiles' folder onyour PDA. If you are running QView on a PC,
Page 59 of 61Running the Transient Pressure Monitoring System
12/23/2016file:///C:/Users/efierro/AppData/Local/Temp/~hhFF57.htm

You can use QViewPlus on your laptop or desktop PC to provide the graphical user interface to theProcessor. You must use this version of QViewPlus if you are connecting to the Processor over theInternet.
The PC will need either a WiFi card or built-in WiFi to connect with the Processor wirelessly, or a wired
you specify the folder where the files are storedusing the 'Options' feature.
Hidden Backup Files
If the Hidden Backup feature is enabled, files that are deleted will actually be moved to abackup directory on the Transient Pressure Monitor rather than being deleted. You cannotaccess these files using Transient Pressure Monitor. Because the available flash memory isso large (at least 1 Gb), storing all of these files should not fill up the memory, undernormal conditions.
To enable the Hidden Backup feature, set switch 4 inside the Transient Pressure Monitorto 'ON'.
If you want to retrieve these files, or if the flash memory is full and you want to delete thefiles, do one of the following:
Remove the USB memory card from the Transient Pressure Monitor. Plug it in toany Windows PC, and use File Explorer to access the 'Backup' directory.
Use FTP to access the 'Backup' directory on the Transient Pressure Monitor.
Using QViewPlus on a Laptop or Desktop PC
Page 60 of 61Running the Transient Pressure Monitoring System
12/23/2016file:///C:/Users/efierro/AppData/Local/Temp/~hhFF57.htm

LAN connection to the Processor. If you use a WiFi card or built-in WiFi in the PC, be sure toconfigure it using the same settings as described in 'Configuring WiFi on your PDA'. If you use a wiredLAN, follow the instructions for 'Connecting the Wired LAN'. The PC can also connect to the Processorover the Internet.
Use QViewPlus on your PC as follows: (Windows 2000 is shown, but other Windows versions aresimilar)
From this point on, the QViewPlus program on the PC runs nearly the same as the QViewPlus programon the PDA. Follow those instructions to use QViewPlus on the PC. The only exception is when youare connecting to a Level 1 Module over the Internet. See 'Using QViewPlus on the Internet' forconnection instructions.
Start QViewPlus: From the 'Start' menu in the lower left of your PC screen, select 'Programs','Qameleon', 'QViewPlus', Launch QViewPlus.exe'
Page 61 of 61Running the Transient Pressure Monitoring System
12/23/2016file:///C:/Users/efierro/AppData/Local/Temp/~hhFF57.htm

The Data Analysis programs run on your PC (desktop or laptop). They convert the data recorded by theProcessor or PDA (or PC) into a form you can use.
The Processor saves data from the Differential Pressure monitor and the Transient Pressure monitor intheir own data files. You retrieve these files from the Processor by using QViewPlus on your PDA orPC. The data analysis programs, QAnalyze and ConvertData, run on your laptop or desktop PC. Theyupload the data files from your PDA to your PC, and convert the data to a form that you can use. (If youare using QViewPlus on a laptop or desktop PC to retrieve the data files from the Processor, QAnalyzeand ConvertData can be used to convert the data directly.)
Data Analysis Programs
Data AnalysisProgram Transient Pressure Data Differential Pressure Data
QAnalyze Places the transient pressure datain a database, and graphs the data.Microsoft Access can be used toview the database.
not used
ConvertData Converts the data to a MicrosoftExcel spreadsheet format.
Converts the data to a MicrosoftExcel spreadsheet format.
System Requirements PC running Windows 2000, XP, NT, or Vista.
To install the data analysis programs on your desktop or laptop PC, insert the TransientPressure Monitoring System Installation CD into the computer. When the page appearscontaining the CD Contents, follow the instructions for "Install the QAnalyze program onyour PC" or "Install the ConvertData program on your PC".
Page 1 of 40Data Analysis Programs
12/23/2016file:///C:/Users/efierro/AppData/Local/Temp/~hh73BB.htm

Using the QAnalyze Program
Using the ConvertData Program
Database Format
The QAnalyze program runs on your PC, and provides a graphical interface to the data collected by theTransient Pressure program on the Processor.
QAnalyze
Start QAnalyze: From the 'Start' menu in the lower left of your PC screen, select 'Programs','Qameleon', 'QAnalyze', 'Launch QAnalyze.exe'.
Page 2 of 40Data Analysis Programs
12/23/2016file:///C:/Users/efierro/AppData/Local/Temp/~hh73BB.htm

With the QAnalyze program, you can:
Read the data file from your PDA or PC and store the data in a database; Graph the transient pressure data; Record details of the Processor (monitor) installation.
If you are using a PDA:
If you are NOT using a PDA:
The Processorrecordspressure data ina file.
WiFi
You use QViewPlus onthe PDA to upload thedata file from theProcessor to the PDA.
ActiveSync
QAnalyze reads the datafile from the PDA, storesthe data in a database,and graphs the data.
Page 3 of 40Data Analysis Programs
12/23/2016file:///C:/Users/efierro/AppData/Local/Temp/~hh73BB.htm

The QAnalyze program has many options that let you graph and examine the data.
The QAnalyze Database
QAnalyze reads the data files that are created by the Processor, and stores the data in a database. Thedatabase format is that of a Microsoft Access database, and the database file ends with a ".mdb" fileextension. You do not need Microsoft Access installed on your PC to use QAnalyze. If you do haveMicrosoft Access installed, you can use it to view and analyze the database.
The data in the database includes:
Time and pressure data points, labeled as to whether they were collected in background ortransient mode.
Parameter settings on the Processor, with start and end times Monitor installation details. A Monitor corresponds to the Monitor ID that you entered on the
Setup screen of the Transient Pressure program. You enter the Monitor installation details intoQAnalyze, including items such as date and location of the installation.
Recommendations for using QAnalyze:
The Processorrecords pressuredata in a file.
WiFior
Wired LAN
You use QViewPlus on your laptop or desktopPC to upload the data file from the Processorto the PC. QAnalyze reads the data file, storesthe data in a database, and graphs the data.
Keep databasessmall
As the database grows, it takes longer to record new data, and toretrieve and graph data. It is a good idea to create separate databaseswhen possible; for example, for each installation location, or for eachMonitor ID.
Save the sourcedata files
If your database becomes corrupted in some way, QAnalyze will notbe able to read it or create graphs. Also, once you read a data file intoQAnalyze, it is not possible to "undo" it, or delete that data from thedatabase. In these cases, it is best to recreate the database by usingQAnalyze to read the original data files.
Do not modifythe databasestructure
The database tables have a specific structure that QAnalyze expects. Ifyou use Microsoft Access to view the data, it is possible to change thestructure of these tables. DO NOT DO THIS! Specifically, do notadd or delete any columns in the tables, and do not change any datatypes. You may modify specific data values in the tables. You mayalso delete entire records from the tables, or add new records.
Page 4 of 40Data Analysis Programs
12/23/2016file:///C:/Users/efierro/AppData/Local/Temp/~hh73BB.htm

The QAnalyze program builds a database of all of the Transient Pressure data on your PC.
Creating a new Database:
Creating and Accessing Databases in QAnalyze
To create a new database, click on the 'SelectDatabase' item in the 'File' menu.
In the File Opendialog box, go to thefolder where youwish to store thenew database. Typein the new databasename in the 'Filename:' field, thenclick the 'Open'button.
Page 5 of 40Data Analysis Programs
12/23/2016file:///C:/Users/efierro/AppData/Local/Temp/~hh73BB.htm

Accessing an Existing Database:
Once you have created or selected an existing database, QAnalyze will continue to use that databaseuntil you create or select a different database.
To access an existing database, click on the 'SelectDatabase' item in the 'File' menu.
In the File Opendialog box, go to thefolder where theexisting database isstored. Click on theexisting databasename to select it,then click the 'Open'button.
Page 6 of 40Data Analysis Programs
12/23/2016file:///C:/Users/efierro/AppData/Local/Temp/~hh73BB.htm

You can use QAnalyze to read a Transient Pressure data file in any of the following ways:
Retrieve the data file from the Processor using your PDA. Read the data file from the PDA usingQAnalyze.
Retrieve the data file from the Processor using your laptop or desktop PC. Read the data file fromthe PC using QAnalyze.
Retrieve the data file from the Processor using your PDA. Use ActiveSync to transfer your datafile from the PDA to your PC first. Then read the data file from the PC using QAnalyze.
Read a Data File from a PDA
Reading Data Files using QAnalyze
Connect your PDA to yourPC using ActiveSync. (If youhave not yet installedActiveSync on your PC, do sobefore continuing.)
Select 'Read File from Mobile Device' in the'Files' menu.
Page 7 of 40Data Analysis Programs
12/23/2016file:///C:/Users/efierro/AppData/Local/Temp/~hh73BB.htm

Navigate to the location ofthe data file on the PDA.Click on one or more filenames, then click the 'OK'button.
If this is the first data filefor this Monitor ID thatyou have read into thisdatabase, QAnalyze willask you to enterinformation about theMonitor. Click the 'OK'button.
Enter theMonitorinformation onthis form. Youcan update it
Page 8 of 40Data Analysis Programs
12/23/2016file:///C:/Users/efierro/AppData/Local/Temp/~hh73BB.htm

Read a Data File from a PC
later if youwish. TheMonitor ID willbe enteredautomatically onthe form. Clickthe 'OK' buttonwhen you areready tocontinue.
When QAnalyze has finished reading the datafile and storing it in the database, it will ask ifyou would like to view a graph of the data thatwas just read. Click on 'Yes' to view the graph,otherwise 'No'.
Page 9 of 40Data Analysis Programs
12/23/2016file:///C:/Users/efierro/AppData/Local/Temp/~hh73BB.htm

Select 'Read File to Database' in the 'Files' menu.
Navigate to thelocation of the datafile on the PC.Click on one ormore file names,then click the 'Open'button.
If this is the first data filefor this Monitor ID thatyou have read into thisdatabase, QAnalyze willask you to enterinformation about theMonitor. Click the 'OK'button. If the databasealready contains data forthis Monitor ID, you willnot see this screen or thenext.
Page 10 of 40Data Analysis Programs
12/23/2016file:///C:/Users/efierro/AppData/Local/Temp/~hh73BB.htm

Enter theMonitorinformation onthis form. Youcan update itlater if youwish. TheMonitor ID willbe enteredautomatically onthe form. Clickthe 'OK' buttonwhen you areready tocontinue.
When QAnalyze has finished reading the datafile and storing it in the database, it will ask ifyou would like to view a graph of the data thatwas just read. Click on 'Yes' to view the graph,otherwise 'No'.
Page 11 of 40Data Analysis Programs
12/23/2016file:///C:/Users/efierro/AppData/Local/Temp/~hh73BB.htm

QAnalyze will create graphs of pressure vs. time. When you read in a new data file, QAnalyze will plota graph of that new data if you desire. At any time, you can create a graph of any pressure data thatexists in the database.
To create a graph:
Graphing Data using QAnalyze
Select 'New Graph' from the 'File' menu.
The 'Graph Data' dialog box appears. Thislets you select the Monitor ID and timerange for the data you wish to graph.Graphs may only be created for oneMonitor ID at a time. It is not possible tocreate a single graph showing two MonitorIDs using QAnalyze.
Notice the text at the upper right. Thisshows the range of dates and times forpressure data for Monitor ID 174 in thisdatabase. Notice that the date and time inthis example is given in GMT (GreenwichMean Time). You can switch betweenGMT and Local time, where Local time isthe time zone of your PC. We will seehow to switch later on this page.
Page 12 of 40Data Analysis Programs
12/23/2016file:///C:/Users/efierro/AppData/Local/Temp/~hh73BB.htm

Notice that in this Graph Data dialog, weselected Monitor ID 174, Start time ofJune 3, 2004 at 17:52:00 GMT, End timeof June 3, 2004 at 17:53:59 GMT.
Click on the 'GRAPH' button, andQAnalyze will extract the pressure datafrom the database, and plot the graph.
This is the graph that QAnalyze plots for the selections above.
Notice that the background data is plotted in blue, and the transient data is plotted in red.
Notice the gaps in the graph. Gaps occur whenever the Transient Pressure program isstopped on the Processor. This happens every time the parameters are changed orchecked by the user, and every time the files are uploaded.
Page 13 of 40Data Analysis Programs
12/23/2016file:///C:/Users/efierro/AppData/Local/Temp/~hh73BB.htm

To zoom in on a portion of this graph:
Position the cursor at the left edge of the area you wish to view. Hold down the left mouse button and drag the mouse to the right. A purple dashed
line will be drawn around the area you have selected. Release the mouse buttonwhen you have reached the right edge of the area.
Position the cursor inside the purple box. Click the right mouse button. A menu will appear. Select 'Graph'.
Page 14 of 40Data Analysis Programs
12/23/2016file:///C:/Users/efierro/AppData/Local/Temp/~hh73BB.htm

QAnalyze zooms in on the graph, drawing it as shown below.
If you wish to see the individual data points:
Move the cursor anywhere over the graph. Click the right mouse button. A menu appears. Select 'Show Points'.
QAnalyze plots the individual data points on the graph, as shown below.
Page 15 of 40Data Analysis Programs
12/23/2016file:///C:/Users/efierro/AppData/Local/Temp/~hh73BB.htm

There are two options that you can set for the graphs:
The pressure range to be plotted. GMT vs. Local time
To set these options, select 'Options' from the 'View'menu.
Selecting 'Options' causes the 'Options' dialog to be displayed.
In the example below, notice that there are two selections for the 'Pressure Range inGraphs':
Automatic - QAnalyze automatically selects the pressure range so that all of theselected data is visible in the graph.
Limits - QAnalyze uses the specified maximum and minimum to define thepressure range that is plotted. Some of the selected data may not be visible in thegraph.
In the example below, we are setting the pressure range to 30-104 PSI.
Page 16 of 40Data Analysis Programs
12/23/2016file:///C:/Users/efierro/AppData/Local/Temp/~hh73BB.htm

When you click the 'OK' button, the graph is redrawn to have the specified pressure range.
This pressure range will be used by QAnalyze for all subsequent graphs, until youchange it to a different range, or sets the option to 'Automatic'.
Page 17 of 40Data Analysis Programs
12/23/2016file:///C:/Users/efierro/AppData/Local/Temp/~hh73BB.htm

The other option that can beset is the selection of GMT(Greenwich Mean Time) orLocal Time for graphs. LocalTime is the time zone of thePC. For example, in Arizona,Local Time is GMT minus 7hours.
Clicking on the "What isthis?" buttons will display anexplanation of the time zones.
When you switch betweenGMT and Local Time, thecurrent graph is not redrawnwith the new times, but allsubsequent graphs are drawnusing the new selection (GMTor Local). Also, the timeranges in the 'Graph Data'dialog and the 'ParameterSettings' dialog are shown inthe new selection.
Note:
"GMT" stands for Greenwich Mean Time. This is the time zone for Greenwich,England. GMT is universally considered to be time zone 0. All other time zonesare expressed relative to GMT.
This program stores all times in the database using the time zone of GMT. In otherwords, the time of a data point in the database is the time that it was in Greenwich,England, when that data point was collected.
"Local Time" is the local time zone of this computer. When displaying the graphs,the program takes the time of each data point, which is stored in the databaseusing the GMT time zone, and applies the time zone correction factor for the timezone of this computer. This is NOT the local time zone where the data wascollected, but rather the local time zone of the computer you are currently using.
Here, the last graph shown above is drawn again using Arizona local time.
Notice that all of the times on the graph are 7 hours earlier than in the previous GMTgraph.
Page 18 of 40Data Analysis Programs
12/23/2016file:///C:/Users/efierro/AppData/Local/Temp/~hh73BB.htm

QAnalyze stores the parameter settings that were current in the Transient Pressure program when thedata was collected.
After you have drawn afew graphs, use the'Window' menu toarrange them. You canCascade or Tile them inthe QAnalyze mainwindow. You can alsoselect one of them fromthe list of windows (eachgraph is in a separatewindow).
Viewing Parameter Data in QAnalyze
To show the parameters:
Place the cursor over the point on the graph that you wish to see. Click the right mouse button. A menu appears. Select show parameters.
Page 19 of 40Data Analysis Programs
12/23/2016file:///C:/Users/efierro/AppData/Local/Temp/~hh73BB.htm

When QAnalyze reads the first data file containing a specific Monitor ID, it asks you to enter
QAnalyze displays theparameters that were current atthat time for that Monitor ID.
Notice that the time is shown ineither GMT or Local Time,depending on the currentOptions setting.
Click the 'OK' button when youhave finished viewing theparameters.
Editing Monitor Data using QAnalyze
Page 20 of 40Data Analysis Programs
12/23/2016file:///C:/Users/efierro/AppData/Local/Temp/~hh73BB.htm

information about that Monitor. You can edit that information at any time.
To edit the Monitor data, select 'Edit Monitor Info'from the 'Edit' menu.
Select the ID ofthe Monitor thatyou wish to edit.Change any ofthe fields asdesired, thenselect the 'OK'button.
QAnalyze Menus
Page 21 of 40Data Analysis Programs
12/23/2016file:///C:/Users/efierro/AppData/Local/Temp/~hh73BB.htm

File Menu
Read File to Database
Read File from Mobile Device
New Graph
Select Database
Print / Print Preview / Print Setup...
Edit Menu
Edit Monitor Info
View Menu
Options
Window Menu
Window
QAnalyze Menus - File - Read File to Database
Page 22 of 40Data Analysis Programs
12/23/2016file:///C:/Users/efierro/AppData/Local/Temp/~hh73BB.htm

This menu item reads a Transient Pressure data file from thePC, and records the data in the database.
For more information, see Reading Data Files usingQAnalyze.
QAnalyze Menus - File - Read File from Mobile Device
This menu item reads a Transient Pressure data file from thePDA, and records the data in the database.
For more information, see Reading Data Files usingQAnalyze.
QAnalyze Menus - File - New Graph
This menu item creates a new graph using data already inthe database.
For more information, see Graphing Data using QAnalyze.
Page 23 of 40Data Analysis Programs
12/23/2016file:///C:/Users/efierro/AppData/Local/Temp/~hh73BB.htm

QAnalyze Menus - File - Select Database
This menu item creates a new database or selects anexisting database.
For more information, see Creating and AccessingDatabases in QAnalyze.
QAnalyze Menus - File - Print
This menu item prints the current graph. 'Print Preview'shows on the PC display what the printout will look like.'Print Setup' lets you to select a printer and a layout.
QAnalyze Menus - Edit - Edit Monitor Info
Page 24 of 40Data Analysis Programs
12/23/2016file:///C:/Users/efierro/AppData/Local/Temp/~hh73BB.htm

QAnalyze reads data files created by the Transient Pressure monitor on the Processor. It stores the datain a database.
This menu item lets you to edit the information for specific MonitorIDs.
For more information, see Editing Monitor Data using QAnalyze.
QAnalyze Menus - View - Options
This menu item lets you set the options regarding the range ofpressure data in the graphs, and also GMT vs. Local Time.
For more information, see Graphing Data using QAnalyze.
QAnalyze Menus - Window
This menu item lets you to arrange the graph windows within the QAnalyze main window.
For more information, see Graphing Data using QAnalyze.
Database Format
This information is for users who are familiar with Microsoft Access who
Page 25 of 40Data Analysis Programs
12/23/2016file:///C:/Users/efierro/AppData/Local/Temp/~hh73BB.htm

The database created and used by QAnalyze contains four tables. These tables, and the items in eachrecord, are shown below.
Important: wish to create reports from the database.
The database tables have a specific structure that QAnalyze expects. If youuse Microsoft Access to view the data, it is possible to change the structure ofthese tables. DO NOT DO THIS! Specifically, do not add or delete anycolumns in the tables, and do not change any data types. You may modifyspecific data values in the tables. You may also delete entire records fromthe tables, or add new records.
Table: PTD Parameters Stores the parameter settings from the Transient Pressureprogram.
Field Name DataType
Description
Start Record Time Date/Time Date and time that data sampling and recording began using thisset of parameters, in GMT.
Monitor ID LongInteger
User-assigned ID of the Monitor
Setup ParametersID
LongInteger
Index of this record, automatically assigned by the database.
Last Reset Date/Time Last date and time the parameters were reset, in GMT.
BackgroundSample Rate
LongInteger
Interval between background samples that are used to calculatethe average pressure, in milliseconds.
BackgroundRecord Rate
LongInteger
Interval between recording the average pressure to the file, inseconds.
Samples in Mean LongInteger
Number of pressure samples that are used to calculate theaverage pressure.
High FrequencyRecord Rate
LongInteger
Interval between recording the pressure values to the file duringa transient event.
Manual RecordTime
LongInteger
If transient recording stop is manual, this is the total time periodfor recording the transient, in seconds.
Start Threshold LongInteger
Standard deviation threshold for automatically determining thestart of a transient, in standard deviations of the mean x 10.
Stop Threshold LongInteger
Standard deviation threshold for automatically determining theend of a transient, in standard deviations of the mean x 10.
Auto StartTransientRecording
Yes/No Indicates if transient start is determined automatically.
Auto Stop Yes/No Indicates if transient end is determined automatically.
Page 26 of 40Data Analysis Programs
12/23/2016file:///C:/Users/efierro/AppData/Local/Temp/~hh73BB.htm

TransientRecording
Sensor Offset LongInteger
Internal value used to compute the pressure value from the rawsensor value.
Sensor Multiplier LongInteger
Internal value used to compute the pressure value from the rawsensor value.
AbsoluteDifference
LongInteger
Absolute difference from mean for automatically determiningthe start and end of a transient, in psi.
Table: PTD Monitors Stores the user-entered information regarding each uniqueMonitor ID.
Field Name DataType
Description
Device ID LongInteger
User-assigned Monitor ID.
LocationDescription
Text User-entered location description.
Location StreetAddress
Text User-entered street address.
Location City Text User-entered city name.
Location State orProvince
Text User-entered state name.
Location ZIPCode or MailCode
LongInteger
User-entered zip code or postal code
Installation Date Date/Time User-entered date of installation.
Date Time of FirstData
DoublePrecision
Date and time of first record in the PTD Data table for thisMonitor ID. Stored in the form of a double precision floatingpoint value, where the portion of the number to the left of thedecimal point is a C language time_t value representing the dateand time to the nearest second in GMT, and the portion of thenumber to the right of the decimal point is the fractional second.
Date Time of LastData
DoublePrecision
Date and time of last record in the PTD Data table for thisMonitor ID. Stored in the form of a double precision floatingpoint value, where the portion of the number to the left of thedecimal point is a C language time_t value representing the dateand time to the nearest second in GMT, and the portion of thenumber to the right of the decimal point is the fractional second.
Page 27 of 40Data Analysis Programs
12/23/2016file:///C:/Users/efierro/AppData/Local/Temp/~hh73BB.htm

Table: PTD Data Stores the time and pressure values recorded by the Processor
Field Name DataType
Description
Date and Time Date/Time Date and time when this data value was recorded. In GMT.
Time in Seconds DoublePrecision
Data and time to the nearest millisecond of this data value.Stored in the form of a double precision floating point value,where the portion of the number to the left of the decimal pointis a C language time_t value representing the date and time tothe nearest second in GMT, and the portion of the number to theright of the decimal point is the fractional second.
Background orTransient
Text B or T, indicating a record written in background or transientmode.
Sensor Reading LongInteger
Raw sensor value.
Computed Value SinglePrecision
Computed pressure value, in PSI.
Parameters ID LongInteger
Index in the PTD Parameters table (Setup Parameters ID)corresponding to the parameters in effect when this data valuewas recorded.
Monitor ID LongInteger
Monitor ID of the monitor on which this data was collected.
Table: GPS Data Stores the time and location values from the GPS unit
Field Name DataType
Description
Date and Time Date/Time Date and time when this data value was recorded. In GMT.
Time in Seconds DoublePrecision
Data and time to the nearest millisecond of this data value.Stored in the form of a double precision floating point value,where the portion of the number to the left of the decimal pointis a C language time_t value representing the date and time tothe nearest second in GMT, and the portion of the number to theright of the decimal point is the fractional second.
Latitude in Tenthsof a Second
LongInteger
Latitude, stored as tenths of second rather than degrees, minutes,and seconds.
Longitude inTenths of aSecond
LongInteger
Longitude, stored as tenths of second rather than degrees,minutes, and seconds.
Parameter TableIndex
LongInteger
Index in the PTD Parameters table (Setup Parameters ID)corresponding to the parameters in effect when this data value
Page 28 of 40Data Analysis Programs
12/23/2016file:///C:/Users/efierro/AppData/Local/Temp/~hh73BB.htm

The Transient Pressure Monitoring System creates a lot of data that you can analyze. The easiest way tolook at the Transient Pressure monitor data is using the QAnalyze program. However, the data from theDifferential Pressure monitor is best viewed using a spreadsheet program like Microsoft Excel.
The monitors store their data files in a format that is very compact to save memory, but is difficult toexamine. The ConvertData program converts the data files to comma-separated variable (.csv) files,which can be viewed in Microsoft Excel. The program converts data files from both the DifferentialPressure and Transient Pressure monitors running on the Processor.
You only need to run this program if you want to look at the data in the four files listed below in aspreadsheet. The conversion can be applied to any of the files that you wish.
Once you have the data in the .csv format, you can use the spreadsheet to generate reports, create graphs,or perform your own calculations.
The ConvertData program will process any of the .dat files produced by the system.
The ConvertData program automatically determines the type of data file it is processing.
was recorded.
Monitor ID LongInteger
Monitor ID of the monitor on which this data was collected.
How to Use The ConvertData Program
Monitor File Name Description
DifferentialPressure
DPhistory.dat
DPdata.dat
Settings, current readings, and statistics,recorded at user-specified intervals on theProcessor.
Current readings stored on the PDA fromone or more monitors.
Transient PressurePTD_Sensor_1_data.dat
PTD_Sensor_2_data.dat
Settings, background averages, full transientdata, recorded as specified by user on theProcessor
Page 29 of 40Data Analysis Programs
12/23/2016file:///C:/Users/efierro/AppData/Local/Temp/~hh73BB.htm

StartConvertData:From the 'Start'menu in thelower left ofyour PC screen,select'Programs','Qameleon','ConvertData','LaunchConvertData.exe'
This screen appears when you run theConvertData program.
If this is the first time that you haverun the program, you have to specifywhich files to convert. Click on the'Setup' button.
In the Setup screen, you must firstspecify the source data file. There are3 options, specified by the small round"radio buttons" inside the red box atright:
1. Copy the data file from the PDA .
Page 30 of 40Data Analysis Programs
12/23/2016file:///C:/Users/efierro/AppData/Local/Temp/~hh73BB.htm

to the PC, leaving the data fileon the PDA, then convert it.
2. Copy the data file from the PDAto the PC, and delete the datafile on the PDA, then convert it.
3. The data file is already on thePC. Convert it.
In this screen, we select Option 1, andclick the 'Browse' button to find thefile on the PDA.
This is the file dialog box for thePDA. Find the file name, click on it,then click the 'OK' button.
Page 31 of 40Data Analysis Programs
12/23/2016file:///C:/Users/efierro/AppData/Local/Temp/~hh73BB.htm

Next, specify the location and namefor the data file on the PC.ConvertData will copy the file fromthe PDA to this location and filename.
Option 2 does the same thing asOption 1: it copies the data file fromthe PDA to the PC before processingit. But Option 2 then deletes the filefrom the PDA.
Page 32 of 40Data Analysis Programs
12/23/2016file:///C:/Users/efierro/AppData/Local/Temp/~hh73BB.htm

Option 3 does not use the PDA. Itsimply processes a data file that isalready on the PC.
Next, select whether the newlyconverted data will be appended to theoutput file, or whether it willoverwrite any data that may alreadyexist in the file.
The output file location and name willbe identical to the name of the datafile on the PC, except that the fileextension '.csv' will be added.
When you have completed the setup,click the 'OK' button.
Page 33 of 40Data Analysis Programs
12/23/2016file:///C:/Users/efierro/AppData/Local/Temp/~hh73BB.htm

If you selected Option 1 or Option 2in the Setup dialog, ConvertData willretrieve the data file from your PDA.Be sure that your PDA is connected toyour PC with ActiveSync, beforeselecting Run in ConvertData.
(If you have not yet installedActiveSync on your PC, do so beforecontinuing.)
Now, the ConvertData programdisplays the options you have selectedfrom the Setup dialog. These settingswill be saved and used every time yourun ConvertData, until you changethem.
Click the 'Run' button to convert thedata.
If none of the information about thefiles changes, you can just startConvertData and click 'Run'.
While ConvertData is running, itshows you how many data records ithas processed.
If the file being converted is small,you may not even notice this count.
ConvertData will quit as soon as the
Page 34 of 40Data Analysis Programs
12/23/2016file:///C:/Users/efierro/AppData/Local/Temp/~hh73BB.htm

file is converted.
ConvertDataproducesa .csv file.Open thisfile usingMicrosoftExcel.
The format of the .csv files depends on its type. These are listed in next section, "CSV FileFormat".
CSV File Format
Page 35 of 40Data Analysis Programs
12/23/2016file:///C:/Users/efierro/AppData/Local/Temp/~hh73BB.htm

The ConvertData program converts data files to comma-separated variable (.csv) files, which can beviewed in Microsoft Excel. The program converts data files from both the Differential Pressure andTransient Pressure monitors running on the Processor.
The format of the .csv file depends on the type of data file used to create it.
Note: All dates and times are in GMT.
The PTD_Sensor_1_data.dat.csv and PTD_Sensor_2_data.dat.csv files contain all ofthe data recorded by the Transient Pressure monitors, as well as the parameters used foreach recording session (the time from when a monitor is started until it is stopped). Thefile may contain more than 1 session.
Each session has 2 sections. The PARAMETER section shows the settings of themonitor for the current set of readings. It is identified with a 'P' in column A of the firstline of the section.
The DATA section has all of the pressure readings recorded by the monitor. Each linecontains the following information:
Column Description
A Tag identifying the type of readingB Background
ST Start ofTransient
T Transient
B Date of sample
C Time of sample
D Milliseconds into the current second
E Raw sensor dataB Average background level
ST Average background level
T Current pressure
F Combined data and time
G Pressure in PSI
Page 36 of 40Data Analysis Programs
12/23/2016file:///C:/Users/efierro/AppData/Local/Temp/~hh73BB.htm

The DPhistory.dat.csv file contains all of the data recorded by the Differential Pressuremonitor at the specified History Interval.
The data recorded on each line of the file is dependent on the TAG field for the line.
Column Description
A Line number
B Tag identifying the type of dataPARAM Parameters
CURRENT Current readings
Page 37 of 40Data Analysis Programs
12/23/2016file:///C:/Users/efierro/AppData/Local/Temp/~hh73BB.htm

The CURRENT record is written at each History Interval, and contains the followinginformation:
The STATS record is written at each History Interval, only if any of the values hadchanged since the last time it was written. It contains the following information:
STATS Max and min readings forSensors 1 & 2
Column Description
C Date of reading
D Time of reading
E Current Sensor 1 pressure in PSI
F Current Sensor 2 pressure in PSI
Column Description
C Sensor 1 Maximum - Date of occurrence
D Sensor 1 Maximum - Time of occurrence
E Sensor 1 Maximum - Pressure in PSI
F Sensor 1 Minimum - Date of occurrence
G Sensor 1 Minimum - Time of occurrence
H Sensor 1 Minimum - Pressure in PSI
I Sensor 2 Maximum - Date of occurrence
J Sensor 2 Maximum - Time of occurrence
K Sensor 2 Maximum - Pressure in PSI
L Sensor 2 Minimum - Date of occurrence
M Sensor 2 Minimum - Time of occurrence
N Sensor 2 Minimum - Pressure in PSI
Page 38 of 40Data Analysis Programs
12/23/2016file:///C:/Users/efierro/AppData/Local/Temp/~hh73BB.htm

The DPdata.dat.csv file contains the data recorded on the PDA during the running ofthe Differential Pressure monitor. It is written when the user taps the "Save and Reset"button on the Differential Pressure RUN Screen. This file may contain data from morethan one monitor.
Each line starts with a DP tag. Descriptions of the data are written into the some of thecolumns, and are not described in the table. The file contains the following information:
Column Description
C Monitor ID
E Date of collection (PDA time)
F Time of collection (PDA time)
H Date of current pressure readings
I Time of current pressure readings
K Current Sensor 1 pressure in PSI
M Current Sensor 2 pressure in PSI
O Sensor 1 Maximum - Date of occurrence
P Sensor 1 Maximum - Time of occurrence
R Sensor 1 Maximum - Pressure in PSI
T Sensor 1 Minimum - Date of occurrence
U Sensor 1 Minimum - Time of occurrence
Page 39 of 40Data Analysis Programs
12/23/2016file:///C:/Users/efierro/AppData/Local/Temp/~hh73BB.htm

Note that the PDA time and the monitor time may be different. Each monitor and PDAhas its own clock. They should be synchronized periodically.
W Sensor 1 Minimum - Pressure in PSI
Y Sensor 2 Maximum - Date of occurrence
Z Sensor 2 Maximum - Time of occurrence
AB Sensor 2 Maximum - Pressure in PSI
AD Sensor 2 Minimum - Date of occurrence
AE Sensor 2 Minimum - Time of occurrence
AG Sensor 2 Minimum - Pressure in PSI
AI Alert in progress (TRUE or FALSE)
Page 40 of 40Data Analysis Programs
12/23/2016file:///C:/Users/efierro/AppData/Local/Temp/~hh73BB.htm

The Processor module is the heart of the system. It collects data from the sensor, performs analysis of the data, stores it, andcommunicates with the remote devices.
Processor Module
There are several keycomponents inside the boxthat can be accessed byremoving the 4 screws on thecover.
Power Connector
Connects external powersources to the Level 1Module.
Fuse
Page 1 of 22Alternate Processor Module
12/23/2016file:///C:/Users/efierro/AppData/Local/Temp/~hh7F7E.htm

Protects the Level 1 Modulefrom connecting the powercable in reverse. Can bereplaced by the user.
Sensor Connectors
Connects sensors to theLevel 1 Module. Eachconnector is labeled for itssensor number.
Antenna Connector
Connects the Antenna to theLevel 1 Module.
USB Memory
All of the system programsand data files are stored onthis module. It can beremoved and accessed usinga PC.
Setup Switches
These are located on themain circuit board. There arefour switches. Switch 1enables/disables remoteaccess via Telnet and FTP.Switch 3 determines howdata files are stored. Switch4 enables the Hidden Backupfeature. Switch 2 is not usedin this system.
Wired LAN Connector
Allows you to connect theLevel 1 Module to a wiredLAN for both operation andmaintenance.
Serial/GPS Connector
Connects the optional GPSreceiver to the Level 1module.
External LAN Connector
Connects a wired LAN to theLevel 1 Module. (optional).Used when the Processormust be sealed and stillconnect to a wired LAN.
RS485
Used to connect the Level 1Module to other devices thatuse ModBus forcommunication (optional)
Page 2 of 22Alternate Processor Module
12/23/2016file:///C:/Users/efierro/AppData/Local/Temp/~hh7F7E.htm

Power Requirement
The Level 1 Module requires 10VDC - 18VDC at 370mA (1 A peak). On-board regulators provide power for the internalelectronics. The internal regulated power is not available for external use.
Replacing the cover
The Level 1 Module is a weatherproof unit that is designed to withstand dust and water spray. When replacing the cover, it isimportant to follow this procedure to insure the integrity of the seal.
Certain limit conditions canproduce an output signal forother devices, such as lights,buzzers, or the elevatorProcessor
Important: You must follow these instructions when replacing the cover.Improper tightening of the screws may cause the case to leak. Thiswill void the warranty.
Start the 4 screws into thethreaded inserts. Hold thecover down firmly with thepalm of your hand whiletightening the screwsfinger-tight.
Progressively tighten thescrews in the diagonalpattern.
Using a torque screwdriver,tighten the screws to 12in/lbs.
Do not over tighten thescrews.
The screws are correctlytightened when the cornersof the lid just barely makecontact with the body of theunit. It is normal for thecenter of the lid's span to bebowed.
Page 3 of 22Alternate Processor Module
12/23/2016file:///C:/Users/efierro/AppData/Local/Temp/~hh7F7E.htm

Specifications
Size 210 x 130 x 76 mm (8.3 x 5.2 x 3.0 inches)
Power 10 - 18 VDC (360 mA @ 12 VDC) - AC adapter is optional
Weight 800 g (1.8 lbs)
Environmental Weatherproof polycarbonate NEMA 4x enclosure withweatherproof connectors
Communication Integral WiFiEthernet LAN (optional)Cellular (optional)
Sensor resolution 12 Bits
Internal data storage 1 or more GB flash (non-volatile) on replaceable USB flashdrive
Sample rate for detecting pressurechange
1000 Hz (.001 Sec)
Recording rate for transient pressure(User specified)
1 Hz to 100 Hz (.01 – 1 Sec per sample)
Outdoor Antenna (optional) Size 330 x 19 mm (13.0 x 0.7 inches)
Weight 142 g (5 oz)
Cable 3 M (10 feet)
Environmental Weatherproof fiberglass
AC Adapter (optional) Size 113 x 61 x 34 mm (4.5 x 2.4 x 1.4inches)
Weight 242g (8.5 oz)
Input Power 90 to 264VAC, 47 to 63Hz1.0A (rms) max. @ 115VAC0.5A (rms) max. @ 230VAC
Environmental Not weatherproof. Indoor use only.
Networks
Page 4 of 22Alternate Processor Module
12/23/2016file:///C:/Users/efierro/AppData/Local/Temp/~hh7F7E.htm

The Level 1 Module (Processor) supports both a wired LAN and a WiFi wireless LAN. It can be set to either use fixed IPaddresses or receive IP addresses from a DHCP server for each network The wireless LAN has a specific name (SSID). Youcan change these settings to match your existing networks, by changing the "RegConfig.txt" file on the Level 1 Module.
In addition, the Level 1 Module can support an optional Machine Room Monitor (MRM) on its WiFi wireless LAN. Adding aMRM to the WiFi LAN imposes some restrictions on that LAN. Specifically, the Level 1 Module cannot be set to receive IPaddresses from a DHCP server on its wireless LAN. In other words, when using a MRM, the IP address of the Level 1 Moduleon the wireless LAN must be a fixed address.
The table below lists the available settings for the wired and WiFi wireless LANs.
Settings Default FactoryValue
Description
Ethernet WiredLAN
Get IP Address from DHCP Server
No When set to 'No', uses the Fixed IP Address, FixedSubnet Mask, and Default Gateway settings. Whenset to 'Yes', gets its IP address, Subnet Mask, andDefault Gateway from a DHCP server on LAN towhich it is physically connected. Set this value to'Yes' when you have an existing wired LAN thatcontains a DHCP server, and you want to add theLevel 1 Module to this LAN.
Fixed IPAddress
192.94.147.100 Used as the IP address of the Level 1 Module on thewired LAN when the value described above (Get IPAddress from DHCP Server) is set to 'No'.
Fixed SubnetMask
255.255.255.0 Used as the Subnet Mask for the Fixed IP Address.
DefaultGateway
192.94.147.1 Used as the Default Gateway on the wired LANwhen the value described above (Get IP Addressfrom DHCP Server) is set to 'No'.
WiFi WirelessLAN
Get IP Address from DHCP Server
No When set to 'No', uses the Fixed IP Address, FixedSubnet Mask, and Default Gateway settings. Whenset to 'Yes', gets its IP address, Subnet Mask, andDefault Gateway from a wireless DHCP server thatis within range. Set this value to 'Yes' when youhave an existing wireless LAN that contains aDHCP server, and you want to add the Level 1Module to this LAN.
Can NOT be set to 'Yes' if using a Machine RoomMonitor.
Fixed IPAddress
Between192.94.148.2and192.94.148.254
Used as the IP address of the Level 1 Module on thewireless LAN when the value described above (GetIP Address from DHCP Server) is set to 'No'.
Fixed Subnet Mask
255.255.255.0 Used as the Subnet Mask for the Fixed IP Address.
DefaultGateway
0.0.0.0 Used as the Default Gateway on the wireless LANwhen the value described above (Get IP Addressfrom DHCP Server) is set to 'No'.
Network name (SSID)
Qameleon This is a public identifier for the ad hoc wirelessnetwork. All devices that connect on this network
Page 5 of 22Alternate Processor Module
12/23/2016file:///C:/Users/efierro/AppData/Local/Temp/~hh7F7E.htm

The Level 1 Module will alternately try to connect to PCs or PDAs on both the Wired LAN and the WiFi network.
The additional parameters for the WiFi network are as follows:
See the section on Configuring WiFi on your PDA for more information.
The Level 1 Module can be used with a wired LAN as well as with the wireless network. (You will need to install QViewPlus on
must use the same SSID.
If using a Machine Room Monitor, this name mustconsist of ASCII (single byte) characters only.
Machine RoomMonitor
Fixed IPAddress
Between192.94.148.2and192.94.148.254
Number following the last dot must be 1 greaterthan the WiFi IP address of the Level 1 Module.Contact Qameleon Technology for instructions onsetting this value.
Fixed Subnet Mask
255.255.255.0 Subnet Mask must be equal to the Subnet Mask ofthe Level 1 Module. Contact Qameleon Technologyfor instructions on setting this value.
Network name (SSID)
Qameleon The SSID must be identical to the SSID of the Level1 Module. Contact Qameleon Technology forinstructions on setting this value.
Important: All Level 1 Modules, Machine Room Monitors, PDAs, and PCs within range of each other must haveunique IP addresses. If the IP addresses are assigned by a DHCP server, they will be unique. If youset fixed IP addresses on the devices, you must ensure that they are unique. REMEMBER that the IPaddress of the Machine Room Monitor is 1 greater than the IP address of the Level 1 Module. Do notassign that IP address to another device.
The factory settings for the fixed IP addresses and Subnet Masks are listed on the card included withthe Processor. The fixed WiFi IP address for the Processor will be in the range of 192.94.148.2 to192.94.148.254. The fixed wired LAN IP address for the Processor will be 192.94.147.100.
Note: The Wired LAN and the WiFi network must have different network addresses. For the default factory valuesshown in the table above, the wired network address is 192.94.147.nnn and the wireless network address is192.94.148.nnn. You can use any two network addresses that you wish, as long as they are different.
Network Name (SSID): Qameleon
Network Type: '802.11 Ad-Hoc'
Connecting the Wired LAN
Page 6 of 22Alternate Processor Module
12/23/2016file:///C:/Users/efierro/AppData/Local/Temp/~hh7F7E.htm

any PCs you wish to use.)
The Level 1 Module has a wired LAN connector inside its enclosure. Remove the four screws holding the cover in place.
(If your Level 1 module has the External LAN Connector Option, simply connect the cable.)
Important: You must follow the important instructions when replacing thecover. Improper tightening of the screws may cause the case to leak.This will void the warranty.
Important: The locking tab on the LAN cable will be facing downward towardthe main circuit board. To remove it, TURN OFF THE POWER first.You may need to use a paper clip or a loop of wire to depress thelocking tab.
For direct connection to a PC,plug one end of a LAN cableinto the wired LAN connectoron the Level 1 module. Plug theother end into the Ethernetadapter on the PC.
You can also plug the cableinto a hub on an existing LAN.
Page 7 of 22Alternate Processor Module
12/23/2016file:///C:/Users/efierro/AppData/Local/Temp/~hh7F7E.htm

The Level 1 Module uses fixed IP addresses by default. If your network requires different addresses or settings, follow theinstruction in the section called Changing the Network Settings.
The Level 1 Module has both a Telnet server and an FTP server. These are common programs that can be used to configure andmaintain the system. They provide external access to the operating system in the Level 1 Module.
You can use either the wired LAN or the WiFi network to access the operating system. To use the WiFi network, you will needto use a laptop or desktop PC with a WiFi card or built-in WiFi configured as described earlier.
Enabling System Access
You can also disable the Telnet and FTP servers to prevent unauthorized access to the operating system. This is done by settingSwitch 1 on the Level 1 Module main circuit board to its OFF position. The switch is located on the main circuit board betweenthe ribbon cable connectors. You can use a pen or other object to set the switch.
The switch setting takes affect when the system is restarted.
Telnet
The Telnet program allows you to use a PC as a console to the Level 1 Module's operating system. This is similar to the"Command Prompt" on Windows, and accepts most of the same commands. There are only a few functions that you canperform, but it is useful for configuration and troubleshooting.
The telnet program is included with the Windows operating system on your PC.
Using Telnet and FTP
Note: The Level 1 Module will start communicating in approximately 60 seconds after power is applied. Please wait asufficient amount of time before using Telnet or FTP.
Important: You must follow the important instructions when replacing thecover. Improper tightening of the screws may cause the case to leak.This will void the warranty.
Page 8 of 22Alternate Processor Module
12/23/2016file:///C:/Users/efierro/AppData/Local/Temp/~hh7F7E.htm

When the window appears, type "open nnn", where nnn = the IP address (WiFi or wired) of the Level 1 Module.
The Level 1 Module accepts most of the commands that are used in the "Command Prompt" on Windows. Some of them arelisted below, as well as some additional commands that are exclusive to the Level 1 Module.
It is easier to manipulate files using FTP instead of Telnet.
The directories and files of the Level 1 Module are listed on the Files page.
FTP
cd Change directory.
dir Lists the files in the current directory.
exit quits Telnet
help displays all of the available standard commands
ps Lists currently running processes. (look for pm05.exe)
setGMT Sets the date and time of the system. Uses GMT.
type filename displays the contents of a text file
Important: Do not use the Telnet "date" or "time" commands, since the timezone setting may not match your local time. Use "setGMT" instead.
Page 9 of 22Alternate Processor Module
12/23/2016file:///C:/Users/efierro/AppData/Local/Temp/~hh7F7E.htm

FTP allows you to transfer files between a PC and the Level 1 Module. You can use any FTP program you wish. The exampleshown here is WS_FTP95.exe.
Click on the Connect button. Configure the FTP connection with the IP address of the Level 1 Module. Use the appropriateaddress for the wired LAN or the WiFi network. You will use an "anonymous" User ID. The password is ignored, and can beanything. Then click OK to connect to the Level 1 Module.
The FTP commands are shown in the picture above. You should consult the instructions for your particular FTP program. Themost common use of FTP is to copy the data and error files from the Level 1 Module to the PC. However, it is much easier toretrieve these files from the Processor using QViewPlus.
Page 10 of 22Alternate Processor Module
12/23/2016file:///C:/Users/efierro/AppData/Local/Temp/~hh7F7E.htm

The Level 1 Module (Processor) supports both a wired LAN and a WiFi wireless LAN. It can be set to either use fixed IPaddresses or receive IP addresses from a DHCP server for each network. You can set it to adhoc or infrastructure mode. Thewireless LAN has a specific name (SSID), and it also supports encryption. You can change all of these settings to match yourexisting networks, by changing the values in the file "RegConfig.txt".
Please see the "Networks" section to view the rules for network addressing and the current settings of this Level 1 Module.
The standard network IP addresses are arranged in different classes, each with their own default subnet masks. The rules fornetwork addresses are as follows:
Other addresses can be used in special cases. Please check with your network administrator before assigning IP addresses oncorporate networks.
Encryption Settings for Wi-Fi
The Level 1 Module's Wi-Fi can be set to have no encryption, WPA-PSK with TKIP, or WPA2-PSK with AES (also calledCCMP). The latter two options are personal mode, and need a pre-shared key (also called a pass phrase). The key must be 8 to 63characters long. A key containing at least 13 characters is recommended for better security. The characters can be any printablealphanumeric character or symbol, including spaces. The same key must be entered into your PDA's Wi-Fi settings (or any otherWi-Fi device that you are using with the Level 1 Module). The Machine Room Monitor only supports no encryption or WPA-PSK with TKIP, so only use these options if you have a MSM.
Changing the Network Addressing
To change the network addressing in the Level 1 Module, you must modify the "RegConfig.txt" file on the USB flash drive.Remove the USB flash drive from the Level 1 Module, as described in "Accessing the USB Memory", and plug it into your PC.You will find the file "RegConfig.txt" in the "NVRAM" folder on the USB flash drive. Edit it using a text editor. It may be eitherASCII or Unicode. Modify it to contain your desired settings.
The file contains one setting per line, as shown in the tables below. The settings can occur in any order. A tag at the beginning ofthe line identifies the setting. Each tag must appear exactly as shown in the table below, all caps, followed by a colon (:). Thecolon may be followed by any number of spaces, including 0 spaces. After the spaces, type your setting value, followed by areturn. If there is more than one entry containing a particular tag, the Level 1 Module will use the last setting. The only exceptionto this is the "EMAIL RECIPIENT" tag. There may be as many as 10 valid email recipients.
When you are finished editing the file, return the USB flash drive to the Level 1 Module.
Important: Do not delete the QWIC directory, or any of the files contained in it. These are essential for the system.Also, do not delete any of the setup files.
The control program has a "watchdog timer" that restarts the system in case of an error. If you deletethe QWIC files, it will cause the system to restart every 2 minutes. If this happens, please contactQameleon Technology.
Changing the Network Settings
NetworkClass
IP Address Range Default Subnet Mask
A 1.0.0.0 to126.255.255.255
255.0.0.0
B 128.0.0.0 to191.255.255.255
255.255.0.0
C 192.0.0.0 to223.255.255.255
255.255.255.0
Page 11 of 22Alternate Processor Module
12/23/2016file:///C:/Users/efierro/AppData/Local/Temp/~hh7F7E.htm

If you prefer not to remove the USB flash drive from the Level 1 Module, you may use FTP to transfer the "RegConfig.txt" fileto your PC for editing, then transfer it back when done. When you connect to the Level 1 Module using FTP, you will find the"RegConfig.txt" file in the folder "\Hard Disk\NVRAM".
The following table shows the tags, example settings, and a description of the setting.
Following is a sample "RegConfig.txt" file:
Tag Example Setting Description
ETHERNET DHCP n 'y' if unit will get wired LAN IP address fromDHCP server, 'n' if IP address is fixed.
ETHERNET IP 192.94.147.100 Fixed wired LAN IP address, in dottednotation.
ETHERNET MASK 255.255.255.0 Fixed wired LAN network mask.ETHERNET GATEWAY 192.94.147.1 Fixed wired LAN IP address of gateway.
WIFI DHCP n 'y' if unit will get WiFi IP address fromDHCP server, 'n' if IP address is fixed.
WIFI IP 192.94.148.254 Fixed WiFi IP address.WIFI MASK 255.255.255.0 Fixed WiFi network mask.WIFI GATEWAY 0.0.0.0 Fixed IP address of WiFi gateway.
WIFI ADHOC y 'y' if WiFi network is ad hoc, 'n' if an accesspoint is being used (infrastructure mode).
WIFI SSID Qameleon SSID of WiFi network
WIFI TXRATE 1 Desired WiFi transmission rate, in kbps. (1 isrecommended, for greater distance.)
WIFI AUTH wpa-pskor wpa2-psk
The examples are the only 2 encryptionoptions allowed. If wpa-psk is specified,TKIP encryption is automatically used. Forwpa2-psk, AES (CCMP) is used. Ifsomething other than these options isspecified, or if WIFI AUTH is missing fromRegConfig.txt, the Level 1 Module will useno encryption.
WIFI KEY ABC 123?&ghkm
A string of printable alphanumeric andspecial characters, containing at least 8characters but no more than 63. Leadingspaces are not accepted. If the string is tooshort or too long, or if WIFI KEY is missingfrom RegConfig.txt, the Level 1 Module willuse no encryption.
WIFI B BAND ONLY y'y' to use WiFi B band only, 'n' to use both Band G ('y' is recommended for greaterdistance)
TRIM 10000000 A correction factor for the internal clock. DONOT CHANGE.
The remaining tags are for email settings.
ETHERNET DHCP: nETHERNET IP: 192.94.147.100ETHERNET MASK: 255.255.255.0ETHERNET GATEWAY: 192.94.147.1WIFI DHCP: nWIFI IP: 192.94.148.254WIFI MASK: 255.255.255.0WIFI GATEWAY: 0.0.0.0WIFI ADHOC: yWIFI SSID: QameleonWIFI TXRATE: 1WIFI AUTH: wpa-psk
Page 12 of 22Alternate Processor Module
12/23/2016file:///C:/Users/efierro/AppData/Local/Temp/~hh7F7E.htm

After you have modified the "RegConfig.txt" file, reboot the Level 1 Module.
If you have a Machine Room Module (MRM), the SSID must contain ASCII characters only (1 byte per character). These arethe standard English characters. Please contact Qameleon Technology for instructions on how to change the SSID on yourMRM.
The easiest way to set up an Internet connection to a Level 1 Module (Processor) is to use cellular communication. You can orderthe Level 1 Module with a built-in EDGE cellular modem, configured to use the AT&T cellular data network. You then set up acontract with CrossBridge Solutions for air time (www.crossbridgesolutions.com). CrossBridge Solutions resells AT&T cellulardata service, and also provides a secure Virtual Private Network over the Internet from your PC to the Level 1 Module. Thediagram below illustrates the cellular connection. Please contact Qameleon Technology for assistance in setting up the contractwith CrossBridge Solutions.
WIFI KEY: my Quick?post449_ThawWIFI B BAND ONLY: yTRIM: 10000000EMAIL CROSSBRIDGE: nEMAIL ENV_FROM:EMAIL RECIPIENT:EMAIL RECIPIENT:EMAIL HOST_NAME1:EMAIL HOST_NAME2:EMAIL DOMAIN:EMAIL USERNAME:EMAIL PASSWORD:EMAIL PORT: 25BIGENDIAN: y
Setting Up an Internet Connection
Page 13 of 22Alternate Processor Module
12/23/2016file:///C:/Users/efierro/AppData/Local/Temp/~hh7F7E.htm

You will use QViewPlus on a PC to communicate with the Level 1 Module over the Internet. See the topic 'Using QViewPlus onthe Internet' to make this work. The PC that you use must have a connection to the Internet.
You can also connect the Level 1 Module to the Internet using a different type of modem, such as DSL or cable, or through alocal area network that has a server or modem connection to the Internet. This must be done by an experienced computernetworking professional. To do this, they need to know the following:
You will need the external LAN connector option on the Level 1 Module.
If you need to modify the Ethernet IP addresses on the Level 1 Module, modify the 'RegConfig.txt' file.
The Level 1 Module uses port 49999 to communicate with QViewPlus. Use port forwarding on the modem or server tosend messages to the Level 1 Module through port 49999.
If you have two or more Level 1 Modules to connect through the modem or server, assign each of them a different portnumber on the Internet side of the modem or server. Use port forwarding to map those port numbers to the LAN side IPaddresses and port 49999 of the specific modules. Enter the Internet-side port numbers when configuring QViewPlus.
You will need a fixed IP address on the Internet side of the modem or server that connects the Level 1 Module to theInternet. This IP address is used to configure QViewPlus so that it can connect to the Level 1 Module.
The Level 1 Module stores its setup, configuration, and data files on a USB flash drive. It uses only 3 directories:
Files
Page 14 of 22Alternate Processor Module
12/23/2016file:///C:/Users/efierro/AppData/Local/Temp/~hh7F7E.htm

The user data files are:
hard disk\NVRAM The main directory directory for the USB flash memory. This iswhere the setup parameters for the Transient Pressure MonitoringSystem are written. Look for the following files after the programsare run the first time. Not all of these files will be present. You shouldnot try to change these files, since they are managed by the programs.
GPSsetup.dat Contains the setup information for theGPS option.
Options.dat Contains information about purchasedoptions for this unit.
OutputSetup.dat Contains the setup information for theoutput signal.
PRVcalibrate.dat Contains the sensor calibration datafor the Transient Pressure MonitoringSystem.
PRVsetup.dat Contains the settings for theDifferential Pressure monitor
PTD_Sensor_1_setup.dat Contains the settings for the Sensor 1Transient Pressure monitor
PTD_Sensor_2_setup.dat Contains the settings for the Sensor 2Transient Pressure monitor
DPhistory.dat Data recorded by the DifferentialPressure monitor
PTD_Sensor_1_data.dat Data recorded by the Sensor 1Transient Pressure monitor
PTD_Sensor_2_data.dat Data recorded by the Sensor 2Transient Pressure monitor
RegConfig.txt Contains the IP addresses for thewired Ethernet and WiFi.
ErrorFile.txt System error messages are written tothis file. May not exist.
SCADAinfo.dat Transient summary information forSCADA systems. Contact PipeTechInternational for details.
HardDisk\NVRAM\Backup
This is the "Hidden Backup" directory. If Switch 4 is set to ON, thisdirectory contains a backup of all deleted files. The name of thedeleted file is preceded by the date and time that it was deleted. So thenames of the deleted files in the Backup directory are in the form:
YYYYMMDDHHMMSSfilename
harddisk\NVRAM\QWIC
Contains all of the QWIC configuration files.
Monitor File name Description
Differential Pressure DPhistory.dat Settings, current readings, and statistics,recorded at user-specified intervals.
Transient Pressure Settings, background averages, full
Page 15 of 22Alternate Processor Module
12/23/2016file:///C:/Users/efierro/AppData/Local/Temp/~hh7F7E.htm

The Processor is protected against connecting the power cable in reverse. No permanent damage to the unit will result from thisaction, but it will be necessary to replace the fuse.
You must use the following fuse: 2AG 1Amp fast-acting
The Processor stores all of its programs and user data on a USB flash drive. This is a standard memory module that can be readby any Windows PC. If you have collected a lot of data, you may want to remove the memory and copy the data directly to yourPC, rather than uploading it from QView. This is especially useful if you are using the QWICcell, cellular option, since you willbe paying for each byte you transfer.
(SENSOR 1) PTD_Sensor_1_data.dat transient data, recorded as specified byuser.
Transient Pressure(SENSOR 2) PTD_Sensor_2_data.dat
Settings, background averages, fulltransient data, recorded as specified byuser.
Replacing the Fuse
Important: You must follow the important instructions when replacing thecover. Improper tightening of the screws may cause the case to leak.This will void the warranty.
Remove the 4 screwsholding the cover in place.The fuse is located at thecorner of the main circuitboard.
Remove the fuse by pryingit out of its clips. Replacethe fuse, and replace thecover.
Accessing the USB Memory
Important: You must follow the important instructions when replacing thecover. Improper tightening of the screws may cause the case to leak.This will void the warranty.
Remove the 4 screws
Page 16 of 22Alternate Processor Module
12/23/2016file:///C:/Users/efierro/AppData/Local/Temp/~hh7F7E.htm

When you insert the USB memory into a USB socket on your PC, a window will open and you can manipulate the files usingWindows. The user data is located in the following folder:
\Hard Disk\NVRAM
The user data files are listed on the Files page.
If the Hidden Backup option is enabled, there will also be a backup folder at
\Hard Disk\NVRAM\Backup
The files in this folder are copies of data and error files that the user has deleted. See the Files page for a description of thesefiles.
If you are going to replace the USB memory with an empty one, you must be sure the necessary files of the the USB module.The easiest way to do this is to copy all of the files from the current USB module onto the new one. Then delete the user datafiles from the new module. You should also delete the "Backup" folder, and the "ErrorFile.txt" file.
The connections to the Processor are shown below.
holding the cover in place.The USB module isplugged into a socket on thesmaller processor board onthe main circuit board. Pullthe USB memory out of itssocket while holding thesocket. If you don't supportthe socket, the board can bedamaged.
Replace the USB memoryby pushing it into thesocket until it snaps intoplace.
Important: Do not disturb any of the other files on the USB memory. These arerequired for the system to operate correctly. You can delete the datafiles after you copy them to your PC.
Important: Some USB memory drives are not compatible with the Level 1module. We recommend SanDisk modules. Do not use Kingston orHP modules.
If you have any questions, please contact Qameleon Technology.
Connectors
Page 17 of 22Alternate Processor Module
12/23/2016file:///C:/Users/efierro/AppData/Local/Temp/~hh7F7E.htm

Power Connector
Type: Switchcraft EN3 Weathertight 3-position, part number EN3P3M
Matching Plug Type: Switchcraft EN3C3F
External LAN Connector (Optional)
Type: AMP/Tyco, part number 1546410
Viewed from frontof socket
Pin Description
1 Supply Voltage (-)
2 (reserved for future use)
3 Supply Voltage (+)
Page 18 of 22Alternate Processor Module
12/23/2016file:///C:/Users/efierro/AppData/Local/Temp/~hh7F7E.htm

Matching Plug: AMP/Tyco, part number 1546440
Sensor Connectors
Type: Switchcraft EN3 Weathertight -position, part number EN3P6F
Matching Plug Type: Switchcraft EN3C6M
Connecting Alternate Sensors
You can connect different sensors to the Level 1 module, as long as they have the following characteristics:
The Supply Voltage (+) is filtered to reduce any noise. Be sure to recalibrate the system for the new sensors.
Viewed from frontof socket
Pin Description (Sensor 1) Description (Sensor 2)
1 Supply Voltage (-) andGround
Supply Voltage (-) andGround
2 Pressure Sensor 1 Pressure Sensor 2
3 (reserved for future use) (reserved for future use)
4 Alert Switch Alert Switch
5 Supply Voltage (+) Supply Voltage (+)
6 (reserved for future use) (reserved for future use)
Supply Voltage 10 VDC - 18 VDC
Supply Current < 50 mA
Output 0 VDC - 5 VDC
Output Impedance < 1000 Ohms
Page 19 of 22Alternate Processor Module
12/23/2016file:///C:/Users/efierro/AppData/Local/Temp/~hh7F7E.htm

Alert Switch (Optional)
You can connect a switch to the Level 1 module to show an Alert on the Differential Pressure RUN Screen when it is closed.This can be anything you chose, such as a float switch to indicate a flood in a vault or a switch to indicate that a door is open.Connect a normally open switch to either of the Sensor Connectors using the Supply Voltage (+) and the Alert Switch pins.
Output Connector
Type: Switchcraft EN3 Weathertight 8-position, part number EN3P8M
Matching Plug Type: Switchcraft EN3C8F
This is a relay contact that can be closed when a transient is detected, as described in the Output Signal section. The relay isisolated from the Level 1 module. The maximum load is 2A @ 30 VDC.
Viewed from frontof socket
Pin Description
1 transient relay output
2 transient relay output
3 (reserved for future use)
4 (reserved for future use)
5 (reserved for future use)
6 (reserved for future use)
7 (reserved for future use)
8 (reserved for future use)
Page 20 of 22Alternate Processor Module
12/23/2016file:///C:/Users/efierro/AppData/Local/Temp/~hh7F7E.htm
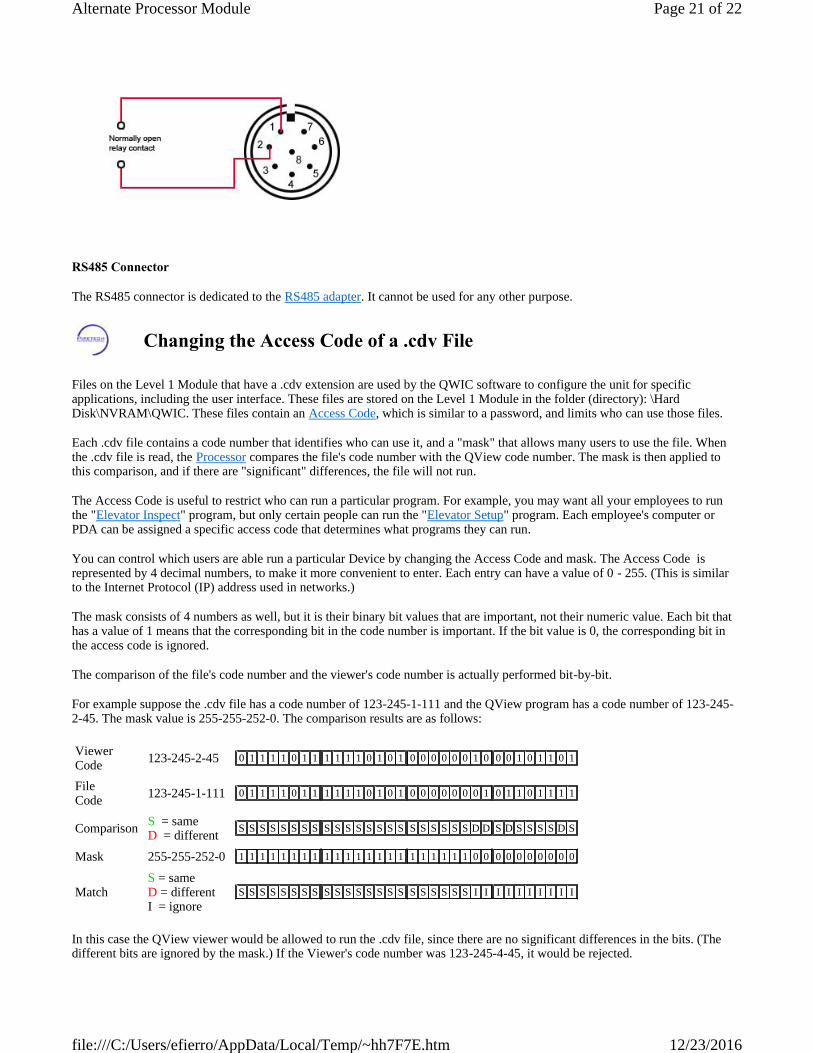
RS485 Connector
The RS485 connector is dedicated to the RS485 adapter. It cannot be used for any other purpose.
Files on the Level 1 Module that have a .cdv extension are used by the QWIC software to configure the unit for specificapplications, including the user interface. These files are stored on the Level 1 Module in the folder (directory): \HardDisk\NVRAM\QWIC. These files contain an Access Code, which is similar to a password, and limits who can use those files.
Each .cdv file contains a code number that identifies who can use it, and a "mask" that allows many users to use the file. Whenthe .cdv file is read, the Processor compares the file's code number with the QView code number. The mask is then applied tothis comparison, and if there are "significant" differences, the file will not run.
The Access Code is useful to restrict who can run a particular program. For example, you may want all your employees to runthe "Elevator Inspect" program, but only certain people can run the "Elevator Setup" program. Each employee's computer orPDA can be assigned a specific access code that determines what programs they can run.
You can control which users are able run a particular Device by changing the Access Code and mask. The Access Code isrepresented by 4 decimal numbers, to make it more convenient to enter. Each entry can have a value of 0 - 255. (This is similarto the Internet Protocol (IP) address used in networks.)
The mask consists of 4 numbers as well, but it is their binary bit values that are important, not their numeric value. Each bit thathas a value of 1 means that the corresponding bit in the code number is important. If the bit value is 0, the corresponding bit inthe access code is ignored.
The comparison of the file's code number and the viewer's code number is actually performed bit-by-bit.
For example suppose the .cdv file has a code number of 123-245-1-111 and the QView program has a code number of 123-245-2-45. The mask value is 255-255-252-0. The comparison results are as follows:
In this case the QView viewer would be allowed to run the .cdv file, since there are no significant differences in the bits. (Thedifferent bits are ignored by the mask.) If the Viewer's code number was 123-245-4-45, it would be rejected.
Changing the Access Code of a .cdv File
ViewerCode 123-245-2-45 0 1 1 1 1 0 1 1 1 1 1 1 0 1 0 1 0 0 0 0 0 0 1 0 0 0 1 0 1 1 0 1
FileCode 123-245-1-111 0 1 1 1 1 0 1 1 1 1 1 1 0 1 0 1 0 0 0 0 0 0 0 1 0 1 1 0 1 1 1 1
Comparison S = sameD = different S S S S S S S S S S S S S S S S S S S S S S D D S D S S S S D S
Mask 255-255-252-0 1 1 1 1 1 1 1 1 1 1 1 1 1 1 1 1 1 1 1 1 1 1 0 0 0 0 0 0 0 0 0 0
MatchS = sameD = differentI = ignore
S S S S S S S S S S S S S S S S S S S S S S I I I I I I I I I I
Page 21 of 22Alternate Processor Module
12/23/2016file:///C:/Users/efierro/AppData/Local/Temp/~hh7F7E.htm

Also note that in this case there are many access codes that will match, as long as the significant bit positions match. This allowsyou to construct Device files that match a group of users, such as employees of your company, while preventing others fromusing the .cdv file.
To change the Access Code of a file, use Telnet to connect to the Level 1 Module.
Once you are connected by Telnet, type "ResetAccessCode".
Enter the name of the .cdv file whose access code you want to change.
Enter the file's current Access Code.
Enter the new Access Code.
Enter the new mask.
The program will then change the Access Code in the file and save it.
Note: Make sure you remember the Access Codes of the .cdv files or you will not be able to change them.
Page 22 of 22Alternate Processor Module
12/23/2016file:///C:/Users/efierro/AppData/Local/Temp/~hh7F7E.htm