Embed Size (px)
Citation preview

Transforming Disease Vector Management Through the Development
of User Friendly Applications
CDR Kenneth J. Stein, Ph.D.,MSC, USNR
OIC FH FT Dix Det 05
February 9, 2004

Objectives
I. To review the basics of tick ecologyII. To review current issues within GIS
methodologyIII. To review the procedures involved
in producing tick threat mapsIV. To review uses of tick threat maps

IntroductionWhy ticks?
• Recent increases in the number of diseases transmitted by ticks
• Lyme Disease, Rocky Mountain Spotted Fever, Ehrlichiosis, and Babesiosis
• Newly emerging diseases throughout the World; e.g., West Nile Virus

IntroductionWhy ticks?
(cont.)
• Developed for personnel on Federal Lands; e.g., Military, National Parks, etc.
• Personnel could reduce exposure to ticks if they could predict where ticks were located
• Preventive measures for various tick species exist—compliance is poor

IntroductionSite Location
• Fort Pickett is a 45,000 acre Virginia National Guard training area
• It consists of mixed hardwood forests, mostly oaks and loblolly pines
• Fort Pickett holds a variety of other habitats: riverine and wetlands, meadows and thickets
• Large number of personnel who train annually, > 10,000 in summer

Tick Habitat: Forested Bivouac Areas

0
500
1000
1500
2000
2500
# organisms
Habitat 1
Ecotone
Habitat 2
Edge or Ecotone Effects
Tick Habitat: Wetlands

Tick Habitat:Young Woodlands & Thickets

Tick Habitat: Meadows/Old Fields
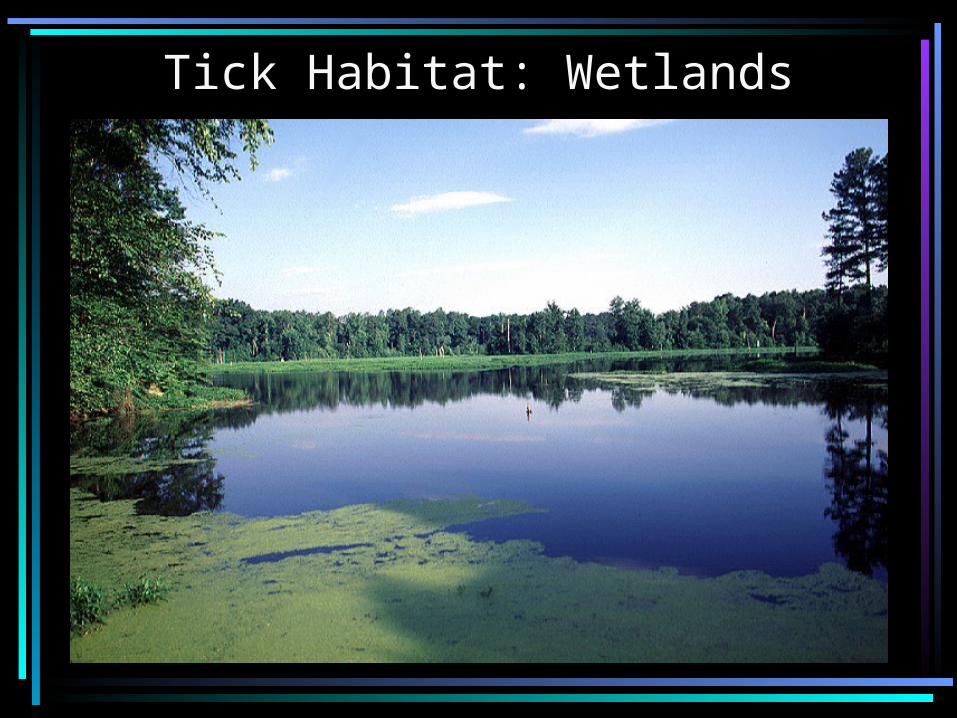
GIS Challenge
• Problems that stem from limitations of equipment and interpreting results:
1) Issues of Scale
2) Habitat Heterogeneity
3) Paucity of Data

MethodsGeographic Information Systems

MethodsTick Collection
Ticks were collected using timed-walks with tick dragsTicks were collected using timed-walks with tick drags

MethodsTick Collection
• 1st yr. 18 sites and visited each site 10 times = 180 collections– Baseline data– Presence/Absence models– Tentative density predictions
• 2nd yr. 136 unique site visits– 350 minutes in each of 7 habitat/edge
categories

Habitat /Ecological Zone
Structure and Characteristics
ForestUnfragmented, evidence of fewdisturbances, well developed canopy andunderstory, no pioneer vegetationcommunities, > 8 m from edges of otherhabitats or road
Forest EdgeFragmented, evidence of disturbance,porous wall-like barrier, presence of fewpioneer vegetation communities, contiguouswith edges of adjacent habitats, but havingvegetation unique to forest, < 8 m into forest
Young WoodlandUnfragmented, trees ranging in size fromsapling to moderate size, no developedcanopy or understory, floor consists ofgrasses, forbs, and some brambles, thicketsabsent, > 4 m from edges of other habitatsor road
Young WoodlandEdge
Fragmented, trees ranging in size fromsapling to moderate size, no developedcanopy or understory, floor consists ofgrasses, forbs, and some brambles,contiguous with edges of adjacent habitats,but having vegetation unique to youngwoodland, < 4 m into young woodland
MeadowUnfragmented, grasses, forbs, few scatteredbrambles, saplings and thickets absent, > 2.5m from edges of other habitats or road
Meadow Edge Fragmented, grasses, forbs, presence of fewbrambles and saplings, thickets present,contiguous with edges of adjacent habitats,but having vegetation unique to meadow, <2.5 m into meadow
Wetland EdgeVariable structure, characterized by wetlandvegetation, < 4.5 m from water, edges ofother habitats, and roads

Vegetation Density
Low Density0 - <25% coverage: some bare ground isapparent in all habitats, if forest floor isbare, then covered with pine needles andleaf litter, can walk through withoutcontacting grasses, forbs, and saplings
Moderate Density25 - 75% coverage: bare ground is absent inyoung woodlands, meadows, and wetlands,occasional bare patches of ground on forestfloor, can walk through all habitats easily
High Density> 75% coverage: grasses, forbs, saplingsand shrubs are dense in all habitats; inforest, the presence of a well-developedunderstory and/or shrub layer, all habitatsrequire much effort to walk through
Disturbance
DisturbedEvidence of recent disturbances including:mowing, off road vehicle use, other humanuse, heavy deer use/browsing, stormdamage; openings on forest floor result fromfallen trees and broken canopies.
UndisturbedNo evidence of recent disturbance, a nearexact match of the characteristics by whicha habitat is designated, transitionalvegetation is rare or absent.
MaturingTransitional stage, some vegetation appearsto be following a successional pattern,almost ecotonal; e.g., a meadow with anumber of small sweetgum or red maplesaplings 1.0 – 1.5 m high, a forest withdeveloping understory.

MethodsGeographic Information Systems
Ticks were collected from over 136 sites during the 2nd year

Results: Tick and Habitat DataProc GENMOD - SAS
• 2 variables– Nymphs and Adults: Forest and Edge– Larvae: No relationships, primary aspects
• 4 variables– Nymphs and Adults: Forest and Edge– Larvae: Disturbed and Maturing

ResultsMean Encounter Rates
• Nymphs and Adults– 0-1 = low– 2-4 = moderate– > 4 = high
• Larvae– 0-1 = low– 2-10 = moderate– > 10 = high

ResultsMean Encounter Rates
• 1st yr.– Adults = 78%– Nymphs = 90%– Larvae = 98%
• 2nd yr.– Adults = 78%; P=0.001– Nymphs = 95%; P=0.001– Larvae = 98%; P=0.037

ResultsData Analysis
• Linking the results from our habitat models and mean encounter rates with…
• Vegetation map is embedded within our orthophoto

Results: SummaryTwo sets of Analyses
1) Models that show distributions or associations with habitats
2) Mean encounter rates implicit within tick distribution models

Orthographic Photo
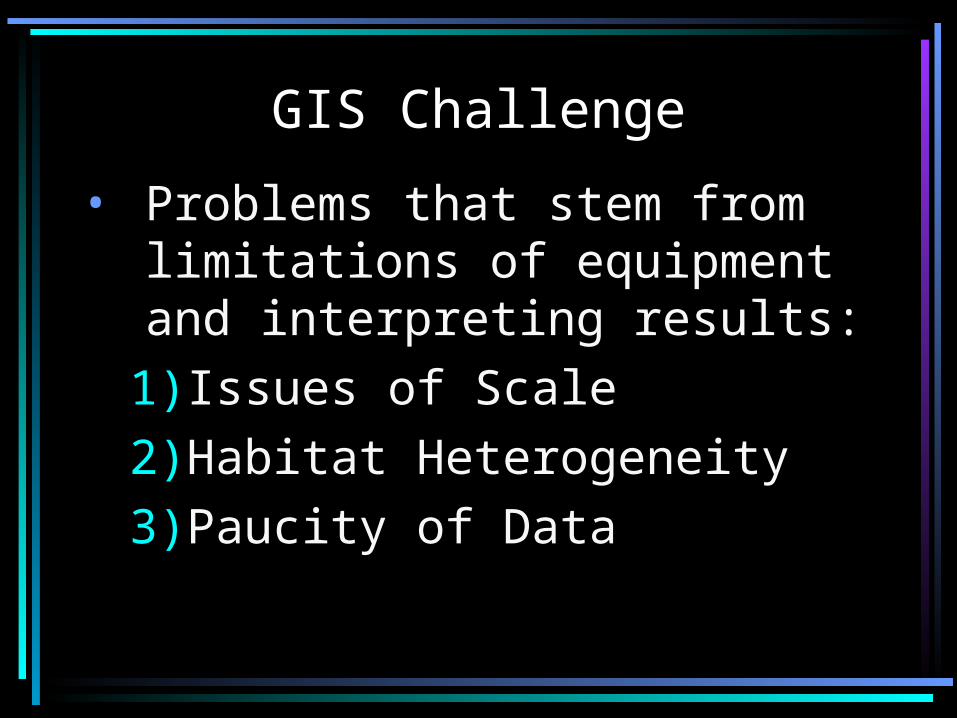
Tick Threat Assessment


Conclusions
• Tick threat assessment maps are a decision-making tool for:
1) Minimizing exposure to ticks
2) IPM & reducing insecticides in the environment
3) As a guide for vegetation management to reduce tick habitat

Conclusions(cont.)
• For use by:
1) Troops before/after deployment
2) Field crews/natural resource personnel
3) Preventive medicine personnel

Vision

Vision
1) Develop set of rules for disease vectors
2) Develop predictive models
3) Develop these as components
4) Develop disease vector maps

Acknowledgments
• LTC Cannon, LTC Johnson, Karl Neidhardt, Ben Pagac, Melissa Miller, and Alexandra Spring, CHPPM
• Scott Klopfer, Conservation Management Institute
• Virginia Department of Military Affairs, Fort Pickett, VA
• Clara M. Stein