Embed Size (px)
Citation preview

Transformation systems monitoring in forested tropical landscapes in Jambi
Province, Sumatra
Sub-project of Collaborative Research Center (CRC) 990: Ecological and Socioeconomic Functions of
Tropical Lowland Rainforest Transformation Systems (Sumatra, Indonesia)
DAAD Forest Asia Workshop
PhD student: Dian N. Melati Master student: Edwine S. Purnama Indonesia: Prof. I Nengah Surati Jaya (IPB), Dr. Tatang Tiryana (IPB), Muhammad Zuhdi (UNJA) Goettingen: Prof. Christoph Kleinn, Dr. Lutz Fehrmann, Dr. César Pérez-Cruzado
Muh. Zuhdi and Dian Melati
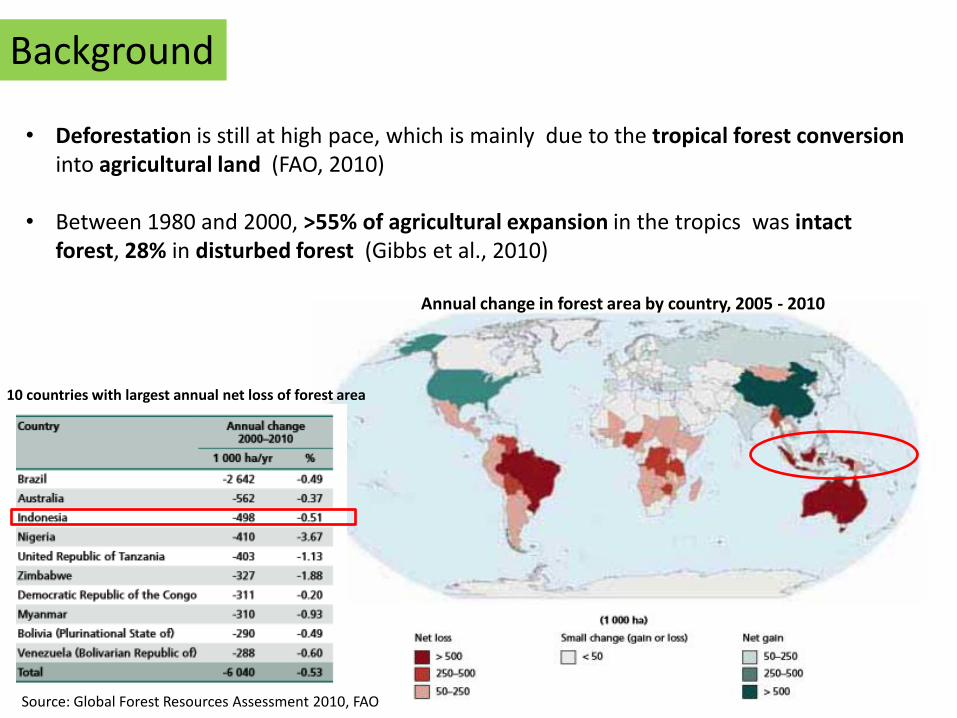
Annual change in forest area by country, 2005 - 2010
10 countries with largest annual net loss of forest area
Source: Global Forest Resources Assessment 2010, FAO
Background
• Deforestation is still at high pace, which is mainly due to the tropical forest conversion into agricultural land (FAO, 2010)
• Between 1980 and 2000, >55% of agricultural expansion in the tropics was intact
forest, 28% in disturbed forest (Gibbs et al., 2010)
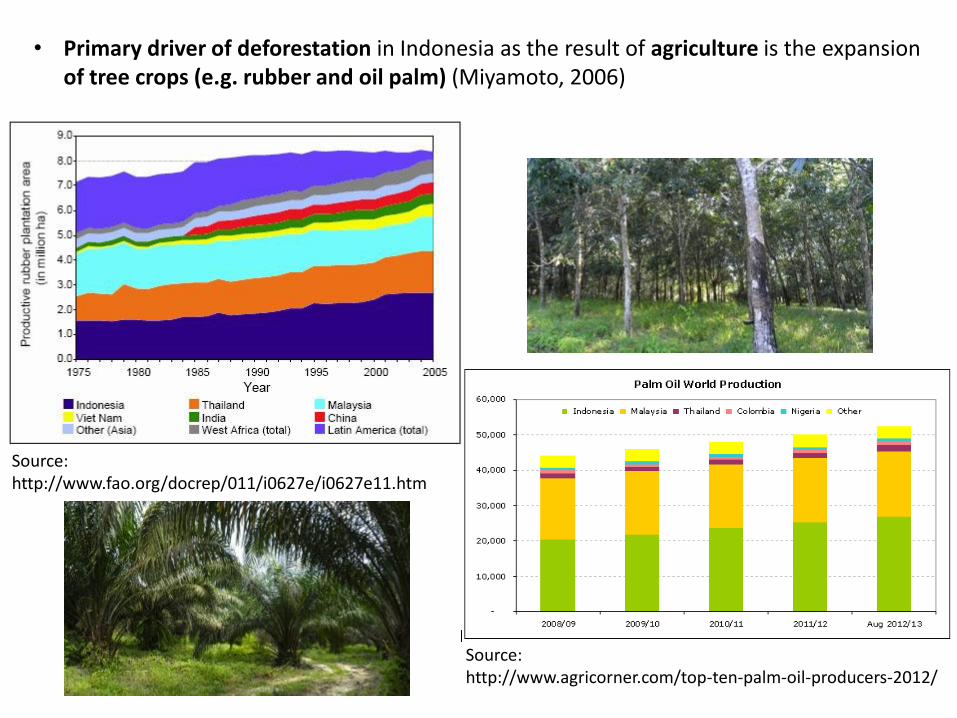
• Primary driver of deforestation in Indonesia as the result of agriculture is the expansion
of tree crops (e.g. rubber and oil palm) (Miyamoto, 2006)
Source: http://www.fao.org/docrep/011/i0627e/i0627e11.htm
Source: http://www.agricorner.com/top-ten-palm-oil-producers-2012/
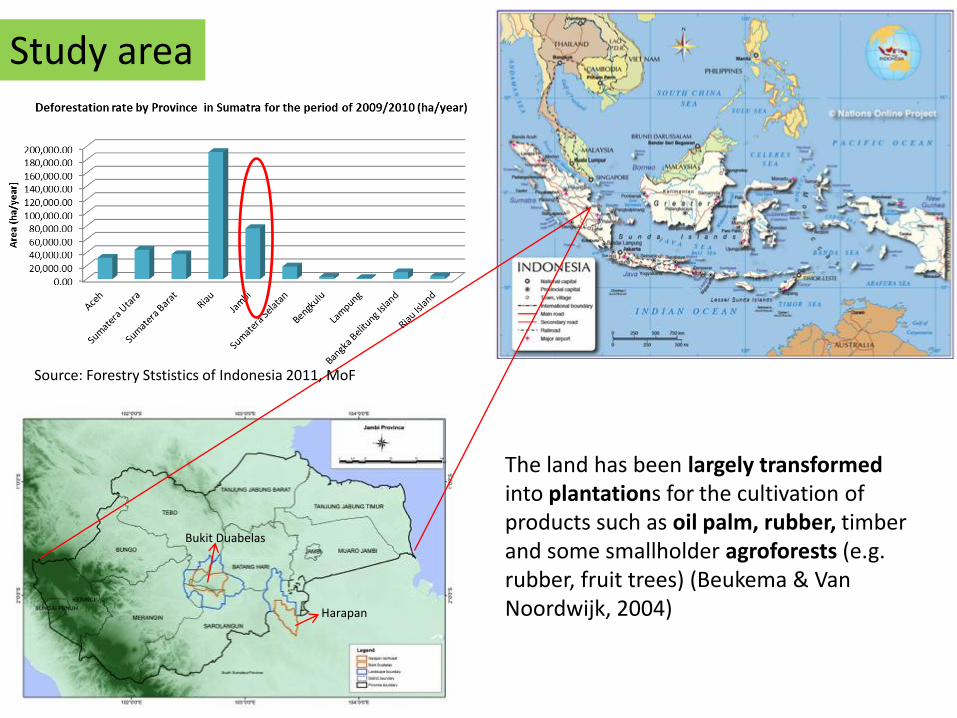
The land has been largely transformed into plantations for the cultivation of products such as oil palm, rubber, timber and some smallholder agroforests (e.g. rubber, fruit trees) (Beukema & Van Noordwijk, 2004)
Source: Forestry Ststistics of Indonesia 2011, MoF
Study area
Bukit Duabelas
Harapan
Objectives
1. To investigate the land use land cover change between 1990 and 2011 in Jambi Province
2. To investigate the spatial pattern of the land use land cover between 1990 and 2011 in Jambi Province
3. To investigate the transformation systems within study area (i.e. secondary forest, jungle rubber, oil palm, and rubber plantation)
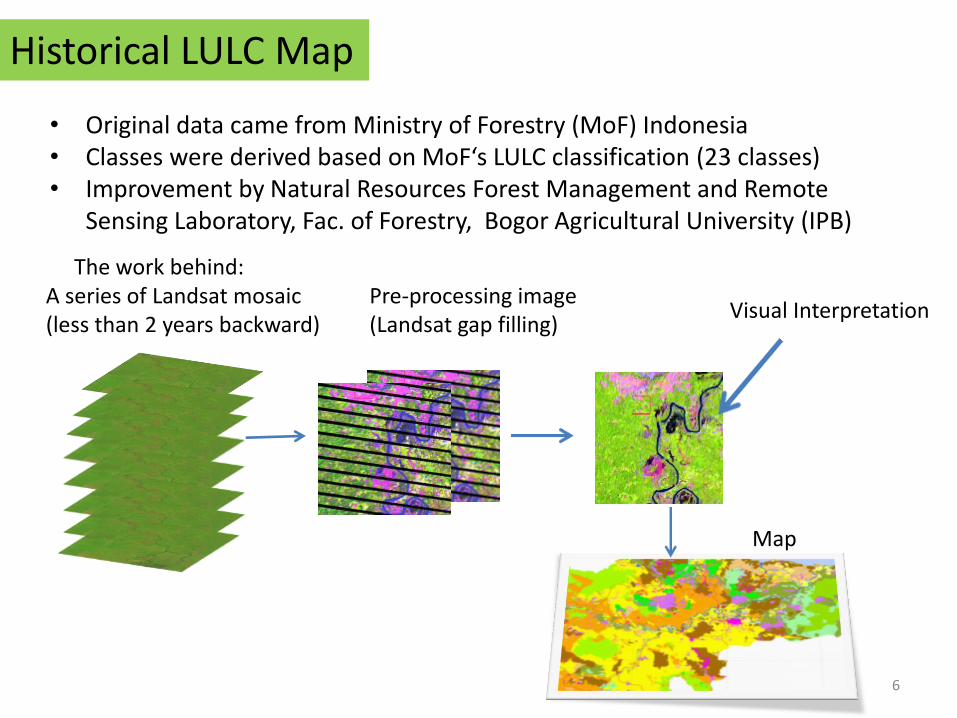
Historical LULC Map
• Original data came from Ministry of Forestry (MoF) Indonesia • Classes were derived based on MoF‘s LULC classification (23 classes) • Improvement by Natural Resources Forest Management and Remote
Sensing Laboratory, Fac. of Forestry, Bogor Agricultural University (IPB)
The work behind: A series of Landsat mosaic (less than 2 years backward)
Pre-processing image (Landsat gap filling)
Visual Interpretation
Map
6

Historical LULC Map 1990
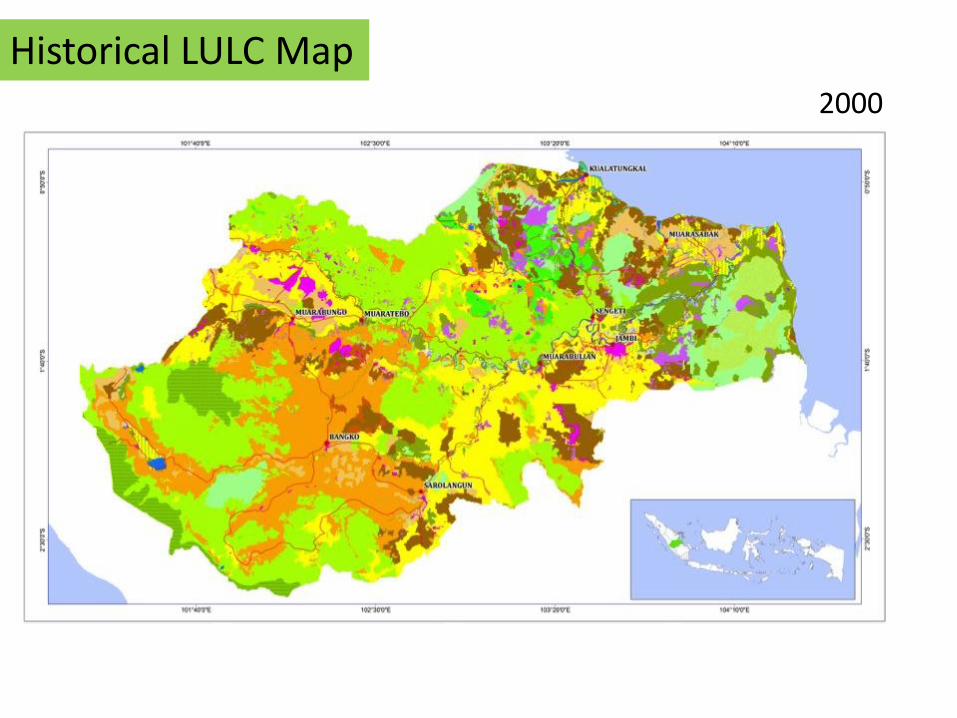
Historical LULC Map 2000
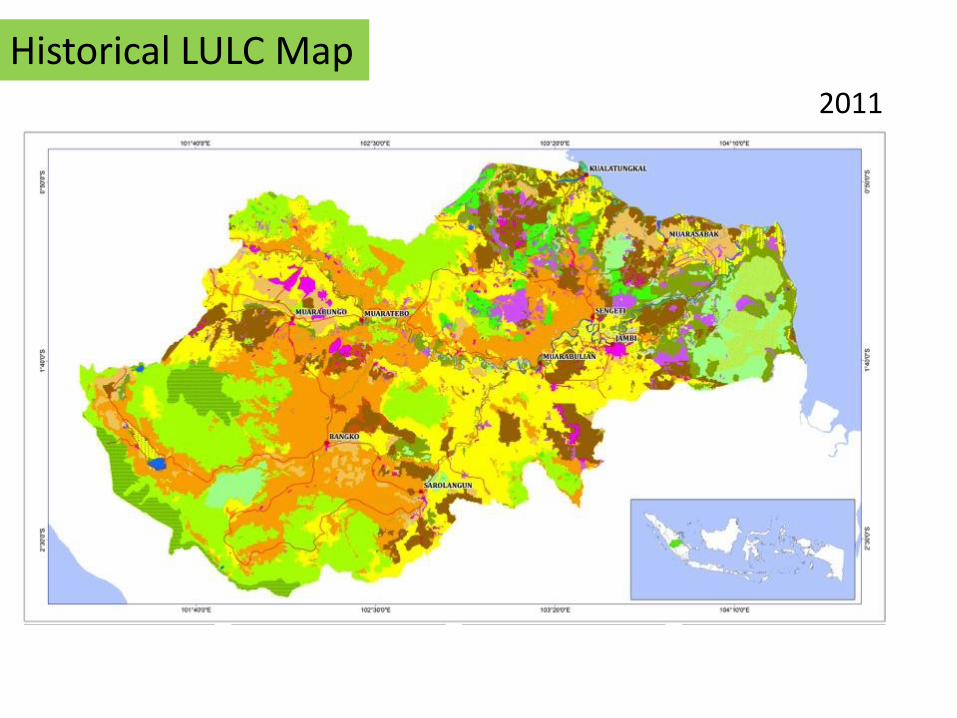
Historical LULC Map 2011
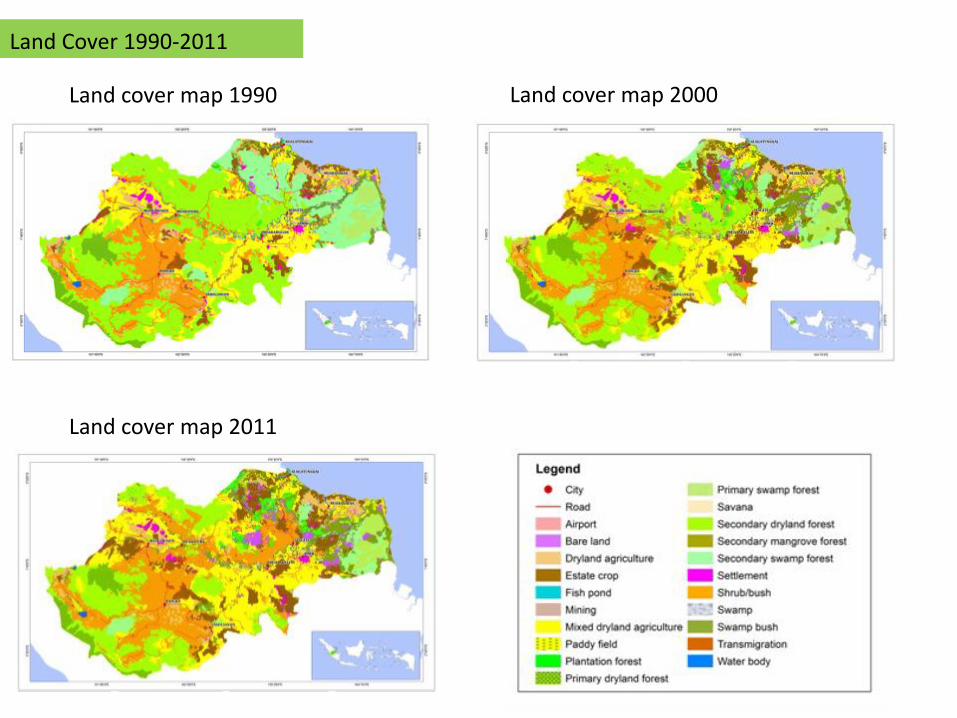
Land cover map 1990 Land cover map 2000
Land Cover 1990-2011
Land cover map 2011
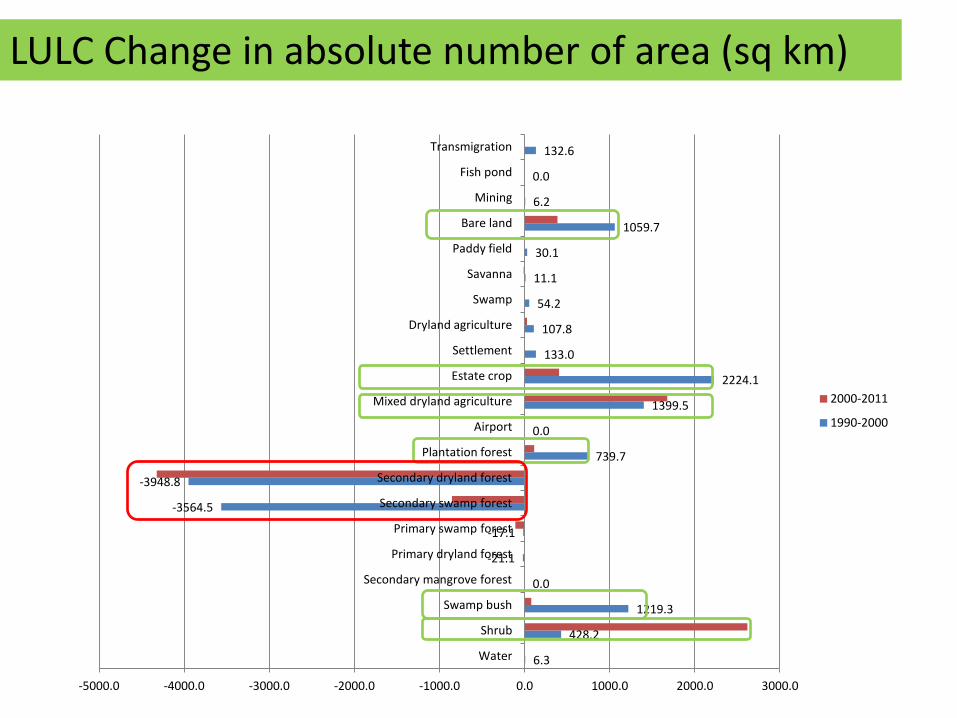
6.3
428.2
1219.3
0.0
-21.1
-17.1
-3564.5
-3948.8
739.7
0.0
1399.5
2224.1
133.0
107.8
54.2
11.1
30.1
1059.7
6.2
0.0
132.6
-5000.0 -4000.0 -3000.0 -2000.0 -1000.0 0.0 1000.0 2000.0 3000.0
Water
Shrub
Swamp bush
Secondary mangrove forest
Primary dryland forest
Primary swamp forest
Secondary swamp forest
Secondary dryland forest
Plantation forest
Airport
Mixed dryland agriculture
Estate crop
Settlement
Dryland agriculture
Swamp
Savanna
Paddy field
Bare land
Mining
Fish pond
Transmigration
2000-2011
1990-2000
LULC Change in absolute number of area (sq km)
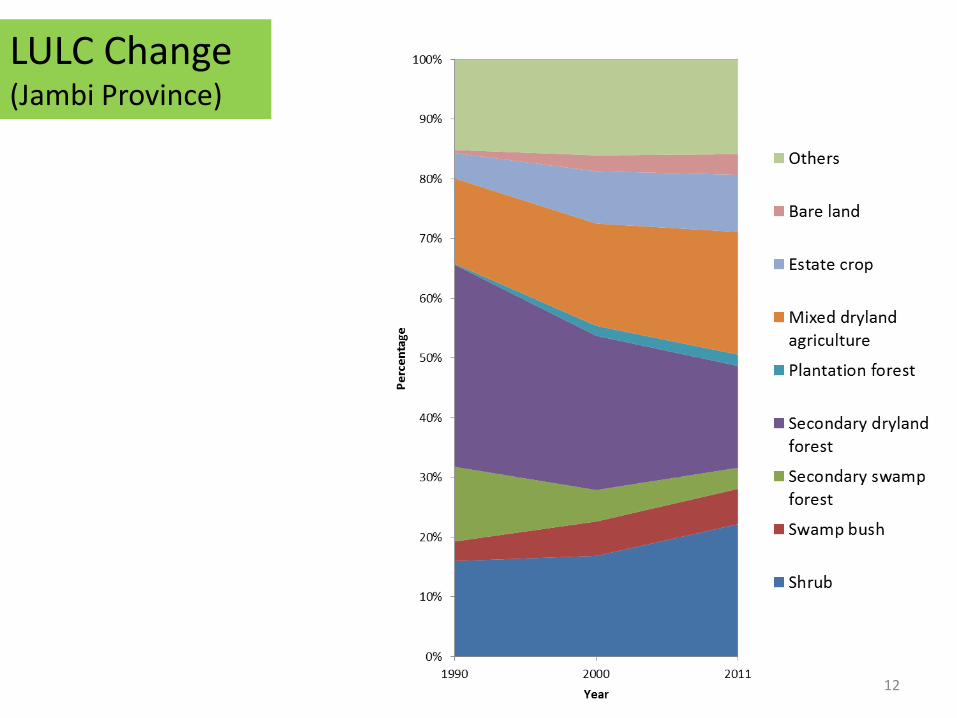
LULC Change (Jambi Province)
12
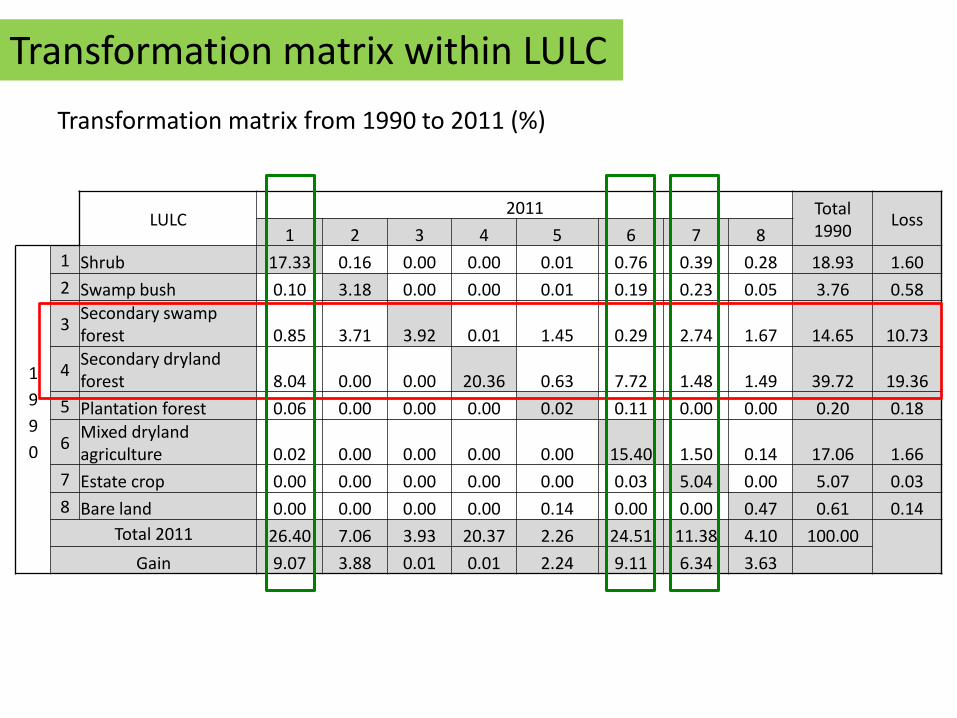
Transformation matrix from 1990 to 2011 (%)
Transformation matrix within LULC
LULC 2011 Total
1990 Loss
1 2 3 4 5 6 7 8
1
9
9
0
1 Shrub 17.33 0.16 0.00 0.00 0.01 0.76 0.39 0.28 18.93 1.60
2 Swamp bush 0.10 3.18 0.00 0.00 0.01 0.19 0.23 0.05 3.76 0.58
3 Secondary swamp forest 0.85 3.71 3.92 0.01 1.45 0.29 2.74 1.67 14.65 10.73
4 Secondary dryland forest 8.04 0.00 0.00 20.36 0.63 7.72 1.48 1.49 39.72 19.36
5 Plantation forest 0.06 0.00 0.00 0.00 0.02 0.11 0.00 0.00 0.20 0.18
6 Mixed dryland agriculture 0.02 0.00 0.00 0.00 0.00 15.40 1.50 0.14 17.06 1.66
7 Estate crop 0.00 0.00 0.00 0.00 0.00 0.03 5.04 0.00 5.07 0.03
8 Bare land 0.00 0.00 0.00 0.00 0.14 0.00 0.00 0.47 0.61 0.14
Total 2011 26.40 7.06 3.93 20.37 2.26 24.51 11.38 4.10 100.00
Gain 9.07 3.88 0.01 0.01 2.24 9.11 6.34 3.63

Spatial Pattern
(Source: http://ec.europa.eu/agriculture/publi/landscape/ch1.htm)
Example:
NP = 1 NP = 13
Class area are identical
to understand the spatial structure (arrangement) of phenomena in space
the fundamental way to monitor landscape change in patch-based of the pattern.
Patch represents an area of a single land cover class quantification is performed using landscape metrics
Number of Patches (NP)

Spatial Pattern
Aggregation Index (AI)
(Source: He et al., 2000)
AIi: Aggregation Index of class i ei,i: number of like adjacencies (joins) between pixels of patch type (class) i based on the single account method max_ei,i: maximum number of like adjacencies (joins) between pixels of patch type (class) i based on the single-count method max_ei,i = 2n(n-1), where m=0, or max_ei,i = 2n(n-1)+2m-1, where m≤n, or max_ei,i = 2n(n-1)+2m-2, where m≥n n is the side of of largest integer square smaller thab Ai (areaa of class i), m=Ai-n2
ei,i : 12
max_ei,i: 12
= 100%
ei,i : 6
max_ei,i: 12
= 50%
ei,i : 0
max_ei,i: 12
= 0
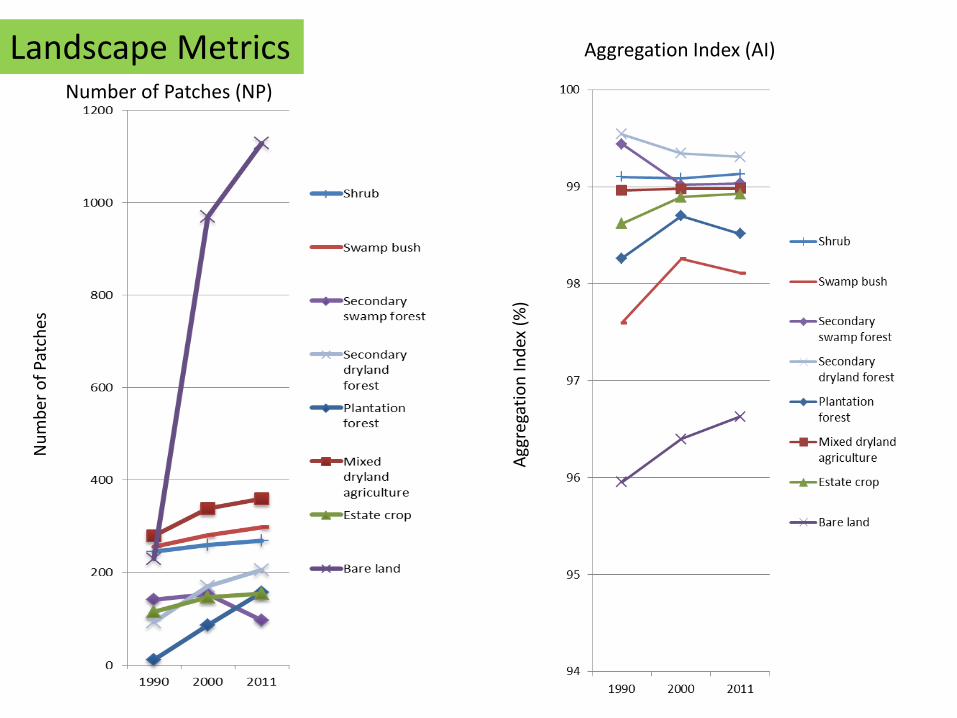
Landscape Metrics Number of Patches (NP)
Aggregation Index (AI) N
um
ber
of
Patc
hes
Agg
rega
tio
n In
dex
(%
)
VILLAGES
OR
CITIES
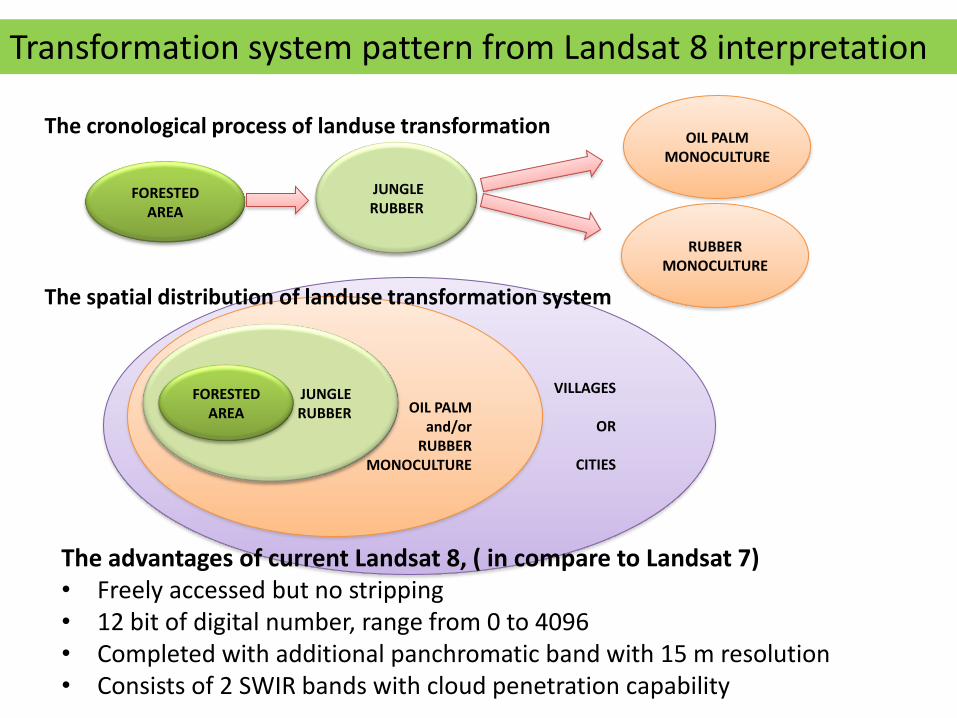
Transformation system pattern from Landsat 8 interpretation
The advantages of current Landsat 8, ( in compare to Landsat 7) • Freely accessed but no stripping • 12 bit of digital number, range from 0 to 4096 • Completed with additional panchromatic band with 15 m resolution • Consists of 2 SWIR bands with cloud penetration capability
OIL PALM and/or
RUBBER MONOCULTURE
JUNGLE RUBBER
FORESTED AREA
RUBBER MONOCULTURE
OIL PALM MONOCULTURE
JUNGLE RUBBER
FORESTED AREA
The cronological process of landuse transformation
The spatial distribution of landuse transformation system
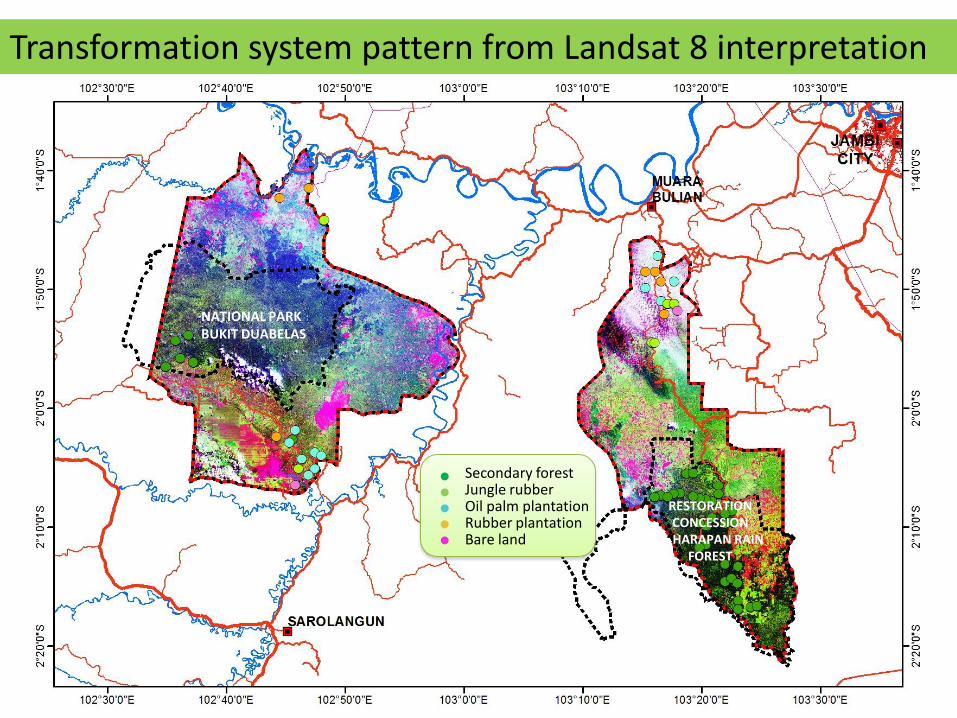
The used image was from 27 June 2013 It was 37.5 % of cloud cover (cirrus cloud)
Secondary forest Jungle rubber Oil palm plantation Rubber plantation Bare land
NATIONAL PARK BUKIT DUABELAS
RESTORATION CONCESSION
HARAPAN RAIN FOREST
Transformation system pattern from Landsat 8 interpretation
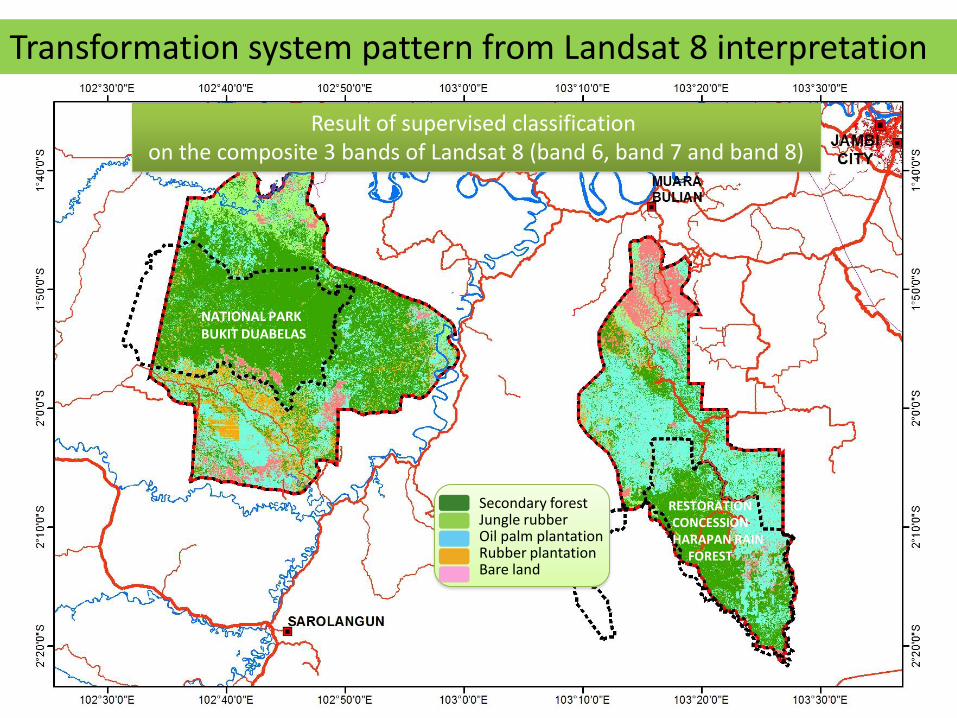
NATIONAL PARK BUKIT DUABELAS
RESTORATION CONCESSION
HARAPAN RAIN FOREST
Secondary forest Jungle rubber Oil palm plantation Rubber plantation Bare land
Result of supervised classification on the composite 3 bands of Landsat 8 (band 6, band 7 and band 8)
Transformation system pattern from Landsat 8 interpretation
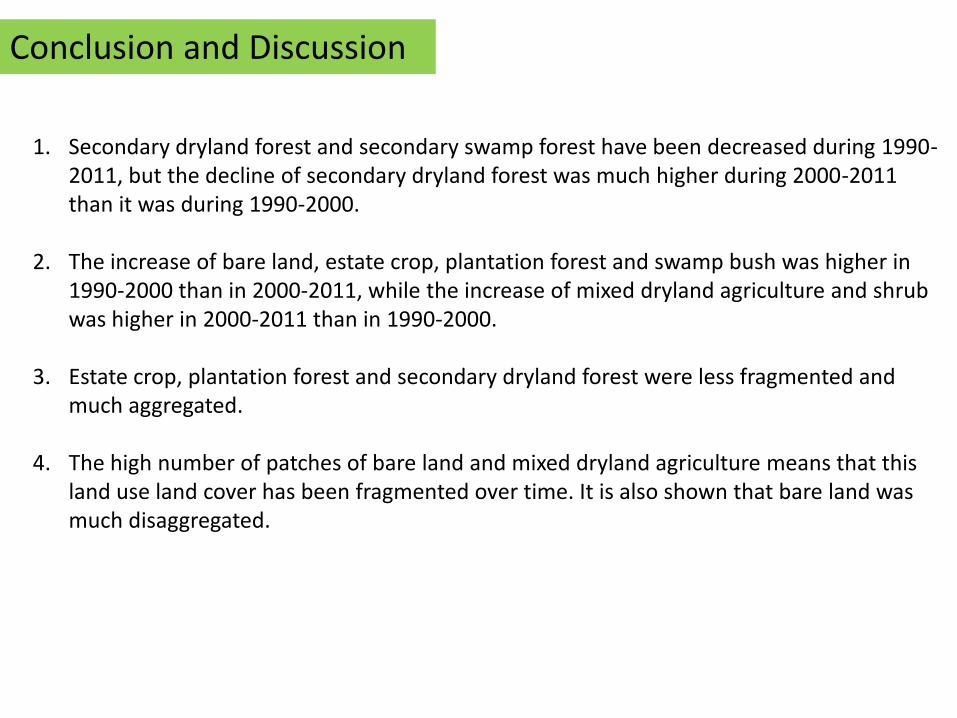
Conclusion and Discussion
1. Secondary dryland forest and secondary swamp forest have been decreased during 1990-2011, but the decline of secondary dryland forest was much higher during 2000-2011 than it was during 1990-2000.
2. The increase of bare land, estate crop, plantation forest and swamp bush was higher in 1990-2000 than in 2000-2011, while the increase of mixed dryland agriculture and shrub was higher in 2000-2011 than in 1990-2000.
3. Estate crop, plantation forest and secondary dryland forest were less fragmented and much aggregated.
4. The high number of patches of bare land and mixed dryland agriculture means that this land use land cover has been fragmented over time. It is also shown that bare land was much disaggregated.

THANK YOU