Embed Size (px)
Citation preview
Transfer Pricing
November 26, 2013
Smita Aggarwal
Importance and Impact of Transfer Pricing
Introduction
Simulation Exercise in groups
Discussion with a panel of experts
2
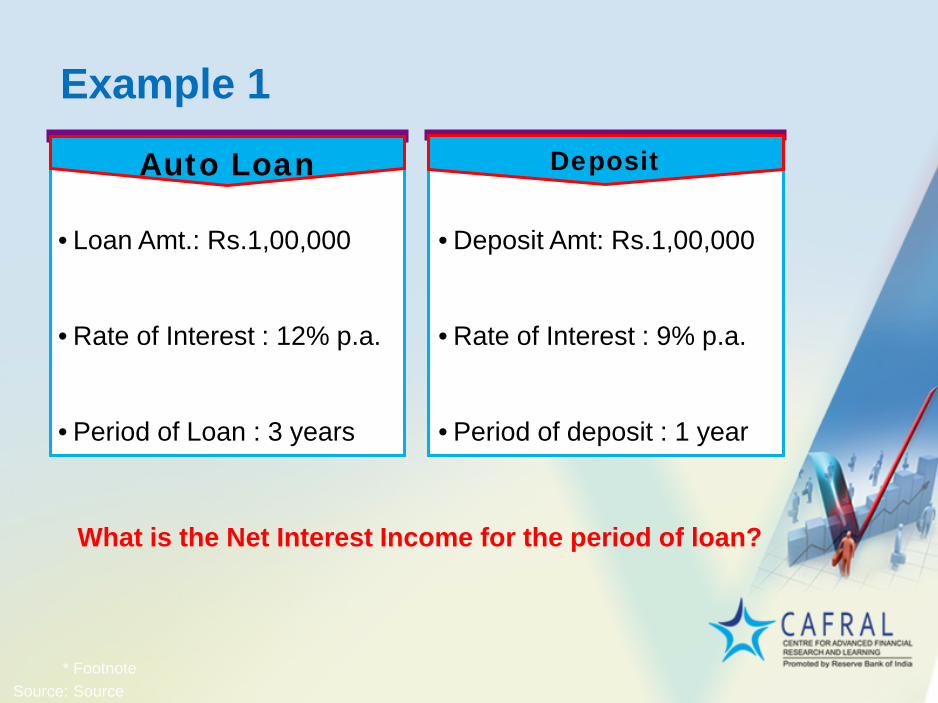
Example 1
Auto Loan Deposit
• Loan Amt.: Rs.1,00,000
• Rate of Interest : 12% p.a.
• Period of Loan : 3 years
• Deposit Amt: Rs.1,00,000
• Rate of Interest : 9% p.a.
• Period of deposit : 1 year
* Footnote Source: Source
What is the Net Interest Income for the period of loan?
3
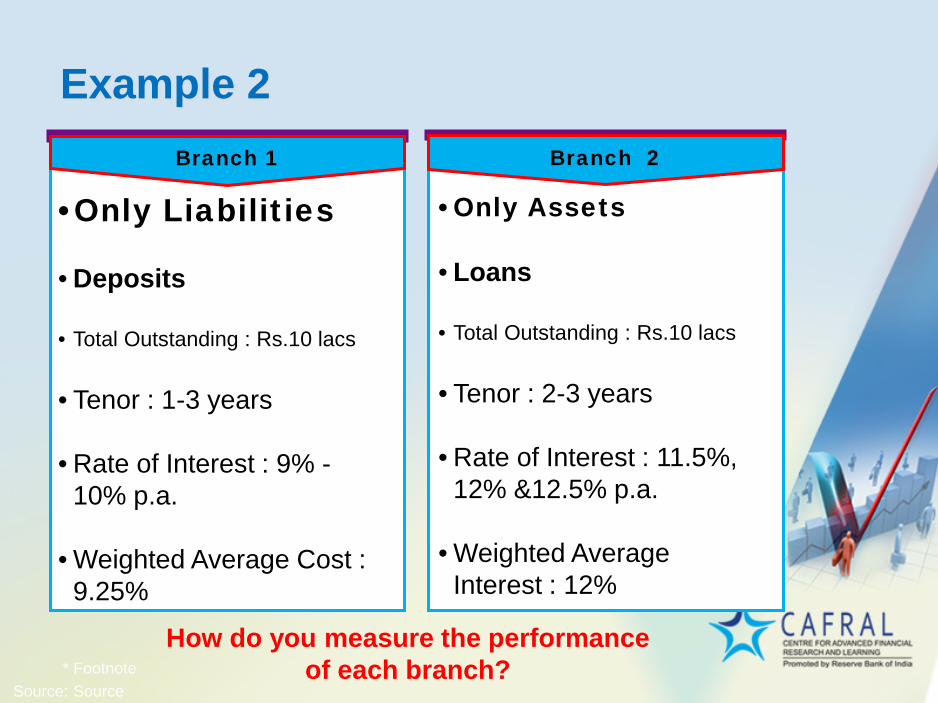
Example 2 Branch 1 Branch 2
•Only Liabilities
• Deposits
• Total Outstanding : Rs.10 lacs
• Tenor : 1-3 years
• Rate of Interest : 9% - 10% p.a.
• Weighted Average Cost : 9.25%
•Only Assets
• Loans
• Total Outstanding : Rs.10 lacs
• Tenor : 2-3 years
• Rate of Interest : 11.5%, 12% &12.5% p.a.
• Weighted Average Interest : 12%
* Footnote Source: Source
How do you measure the performance of each branch?
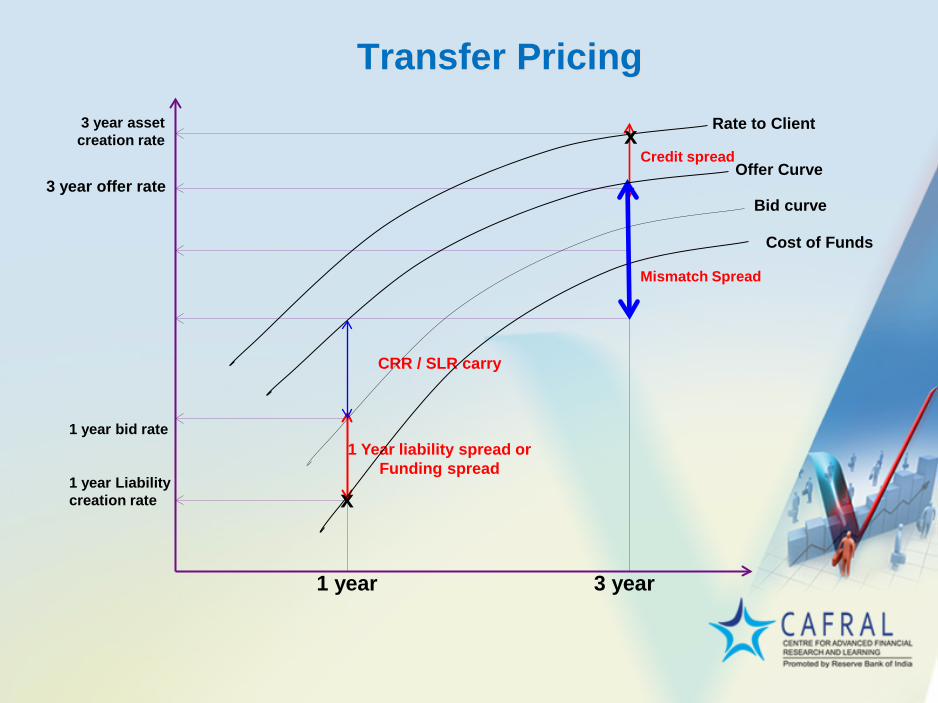
Transfer Pricing
CRR / SLR carry
1 Year liability spread or Funding spread
Credit spread
Mismatch Spread
3 year 1 year
3 year asset creation rate
3 year offer rate
1 year bid rate
1 year Liability creation rate
Rate to Client
Bid curve
Cost of Funds
Offer Curve
x
x
5
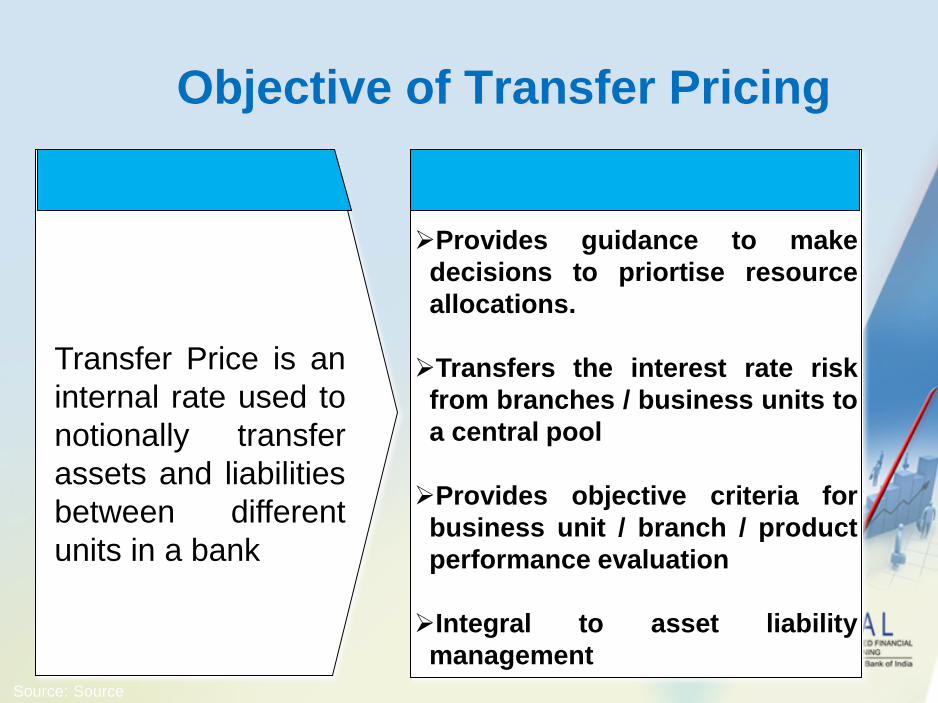
Objective of Transfer Pricing
* Footnote Source: Source
Transfer Price is an internal rate used to notionally transfer assets and liabilities between different units in a bank
Provides guidance to make decisions to priortise resource allocations. Transfers the interest rate risk
from branches / business units to a central pool Provides objective criteria for
business unit / branch / product performance evaluation Integral to asset liability
management
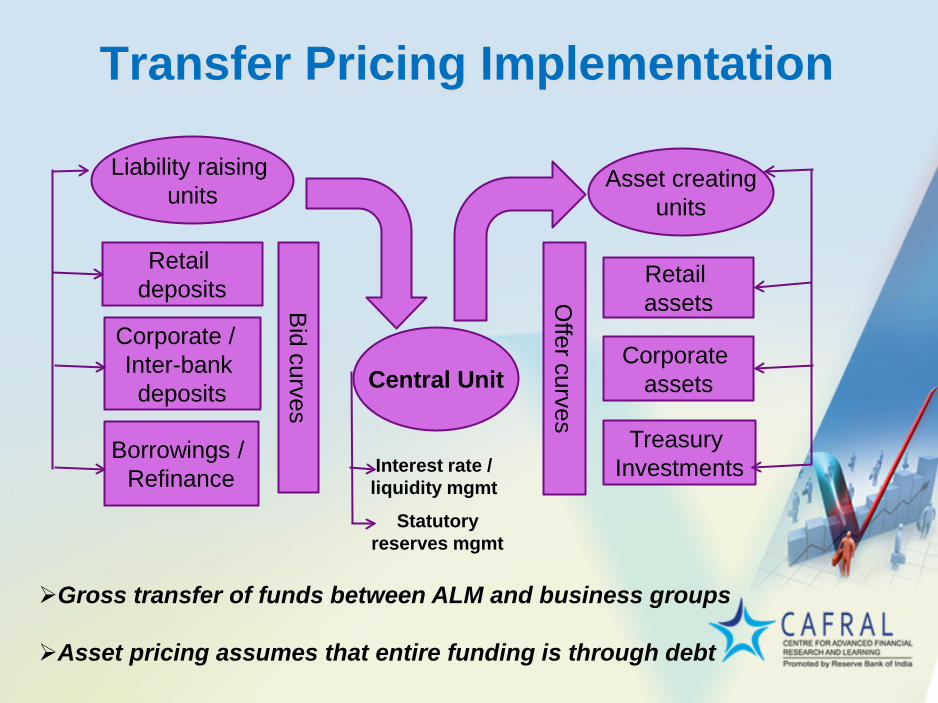
Transfer Pricing Implementation
Liability raising units
Asset creating units
Retail deposits B
id curves
Corporate / Inter-bank deposits
Borrowings / Refinance
Offer curves Treasury
Investments
Corporate assets
Retail assets
Central Unit
Interest rate / liquidity mgmt
Statutory reserves mgmt
Gross transfer of funds between ALM and business groups Asset pricing assumes that entire funding is through debt
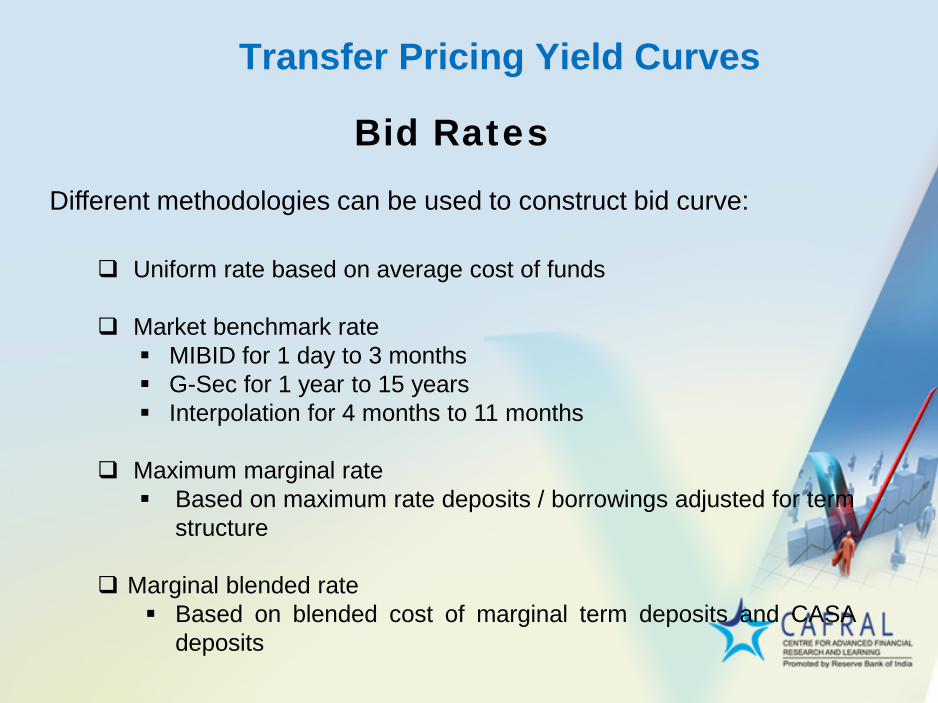
Transfer Pricing Yield Curves
Bid Rates
Different methodologies can be used to construct bid curve: Uniform rate based on average cost of funds
Market benchmark rate MIBID for 1 day to 3 months G-Sec for 1 year to 15 years Interpolation for 4 months to 11 months
Maximum marginal rate Based on maximum rate deposits / borrowings adjusted for term
structure
Marginal blended rate Based on blended cost of marginal term deposits and CASA
deposits

Transfer Pricing Yield Curves
Offer Rates
Offer curve is calculated as bid rate adjusted for: CRR and SLR negative carry
Liquidity charge for maintenance of liquid assets
Term premia depending upon slope of deposit rate
curve and other market rates.
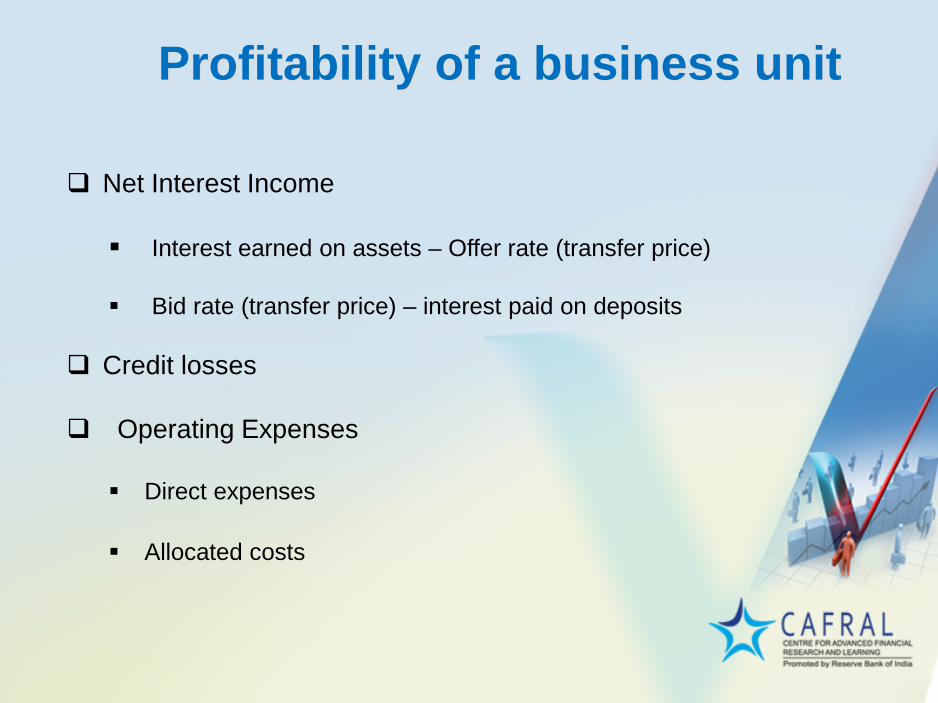
Profitability of a business unit
Net Interest Income Interest earned on assets – Offer rate (transfer price)
Bid rate (transfer price) – interest paid on deposits
Credit losses
Operating Expenses Direct expenses
Allocated costs
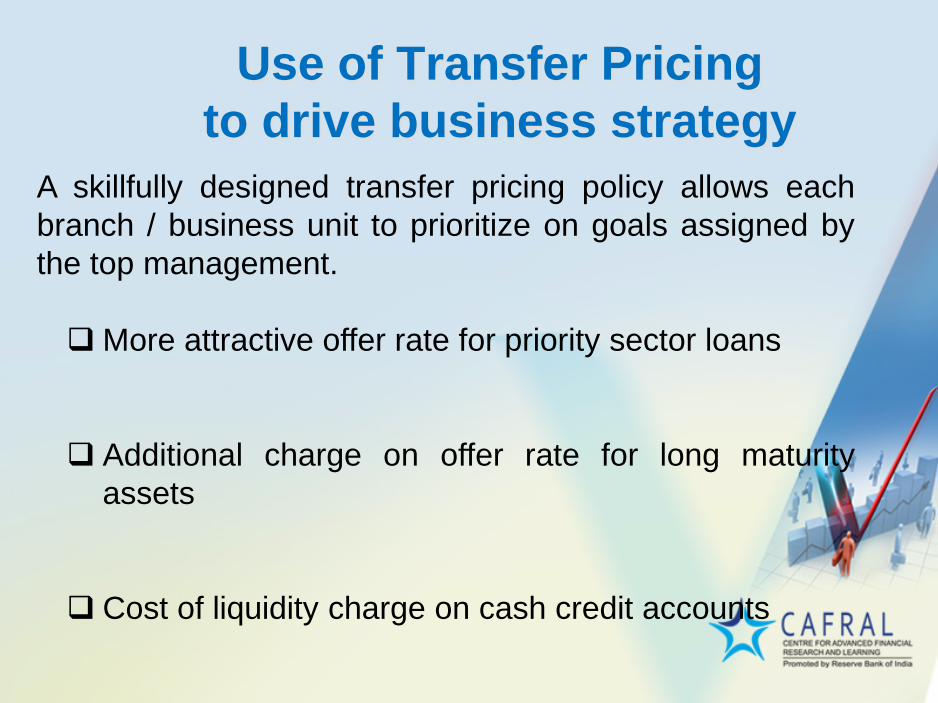
Use of Transfer Pricing to drive business strategy
A skillfully designed transfer pricing policy allows each branch / business unit to prioritize on goals assigned by the top management. More attractive offer rate for priority sector loans
Additional charge on offer rate for long maturity assets
Cost of liquidity charge on cash credit accounts
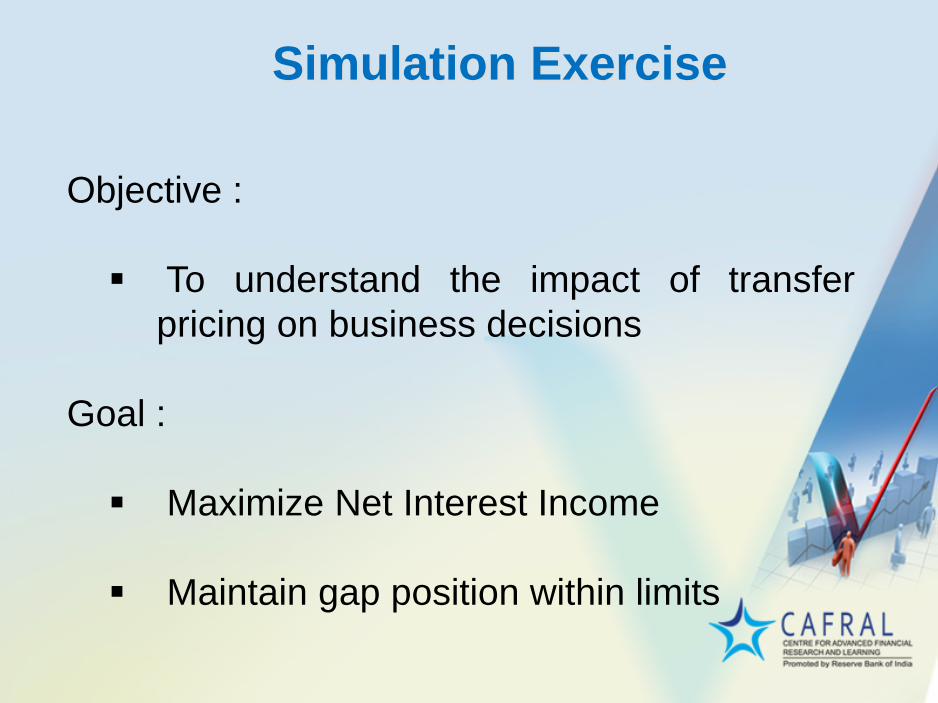
Simulation Exercise
Objective : To understand the impact of transfer
pricing on business decisions
Goal : Maximize Net Interest Income
Maintain gap position within limits

Groups for Simulation Exercise
Group I 1. Gauri Shankar 2. Jai Kumar Garg 3. M Sreenatha Sastry 4. B B Joshi Group II 1. Ashutosh Khajuria 2. Ram S Sangapore 3. R K Takkar 4. Charan Singh

Groups for Simulation Exercise
Group III 1. N Krishnamachari 2. B K Divakara 3. Melwyn Rego 4. Binod Kumar Group IV 1. P S Rawat 2. Mahesh Kumar Jain 3. Rajendra D Adsul 4. G Sreeram

Groups for Simulation Exercise
Group V 1. Rakesh Sethi 2. N R Narayanan 3. Raj Kumar Bansal 4. K R Mohanachandran Group VI 1. Amar Lal Daultani 2. Sanjay Mallik 3. Atul Kumar Agarwal 4. B S Rama Rao

Lets begin…..
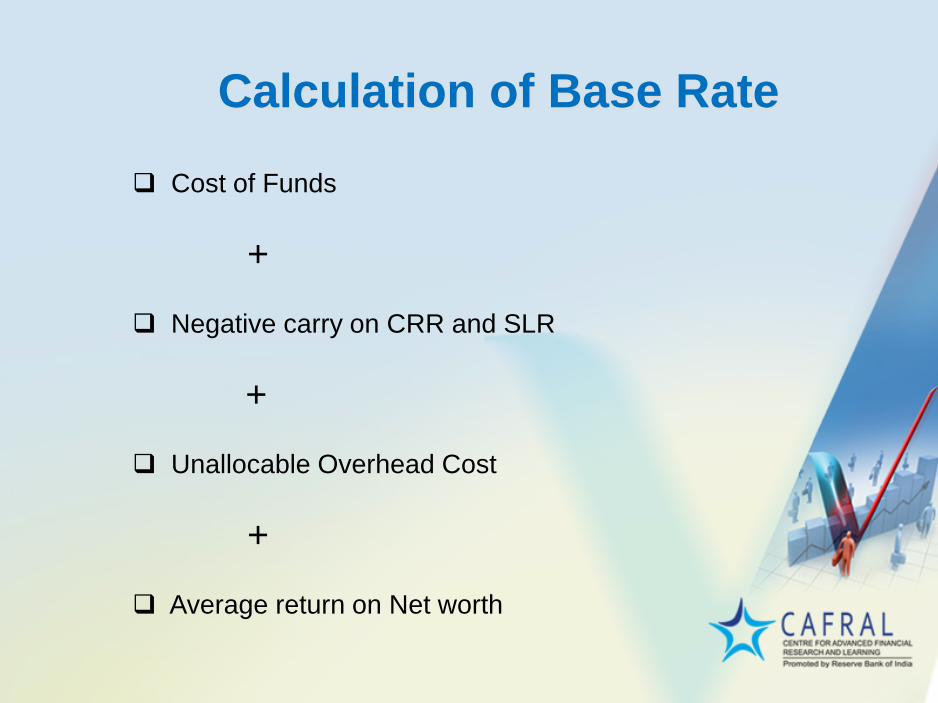
Calculation of Base Rate
Cost of Funds
+
Negative carry on CRR and SLR
+
Unallocable Overhead Cost
+
Average return on Net worth

Various Methods for Transfer Pricing
Single Rate Transfer Pricing Uniform rate (based on average cost)
applied to all assets and liabilities
Market related yield curve
Marginal highest borrowing cost
Average blended cost based yield curve