Embed Size (px)
Citation preview

1
TRANSFER PRICING: HOW TO APPLY THE ECONOMICS OF DIFFERENTIAL PRICING TO HIGHER EDUCATIONMarshall Horton, Ouachita Baptist UniversityJohn Cox, Ouachita Baptist UniversityJames Files, Ouachita Baptist University
ABSTRACT
This paper outlines how transfer pricing is applied in modern American colleges and universities. Economic concepts from marketing, such as efficiency templates, are employed to illustrate the practical nature of budgeting and how it falls short. The implications of differential price elasticities and limited information reporting are explored, with recommendations as to how the process may be optimized. JEL Classification: D4
INTRODUCTION
American universities have traditionally resisted charging different prices for different academic subjects.1 Some have found this practice objectionable, since it leads to “implicit cross-subsidy across major fields that results from the conventional practice of charging similar prices.” (Strange (2013), p. 5) Differential tuition is increasing in American higher education (Ehrenberg (2012), p. 211). Although most differential tuition rates are charged based on whether students are lower-level or upper-level, more programs such as business, engineering, and nursing are charging premiums for their classes at flagship, research-oriented, state universities. Strange (2013) performed an event-study which indicated that raising tuition for engineering courses had a significant, negative, effect on engineering enrollment, but that the effect of raising tuition for business and nursing courses had negligible or even positive effects, respectively. The purpose of the current study is to analyze tuition decisions, i.e., pricing policy, in the context of transactions costs economics. Differentiating institutions according to operational goals and contrasting them should allow us to model pricing policy and make some simple predictions about the direction of the marketplace.
TRANSFER PRICING APPLIES TO REVENUES AS WELL AS TO COSTS
How would a university go about deciding on differential prices for academic programs? The practice of transfer pricing (Baldenius and Reichelstein (2006)) as it has
2
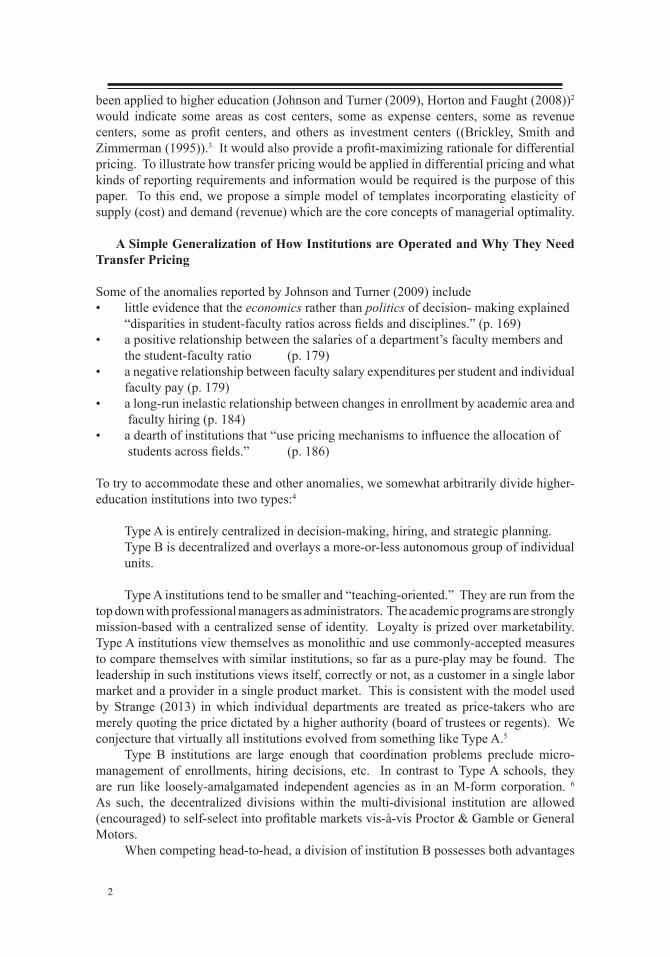
been applied to higher education (Johnson and Turner (2009), Horton and Faught (2008))2 would indicate some areas as cost centers, some as expense centers, some as revenue centers, some as profit centers, and others as investment centers ((Brickley, Smith and Zimmerman (1995)).3 It would also provide a profit-maximizing rationale for differential pricing. To illustrate how transfer pricing would be applied in differential pricing and what kinds of reporting requirements and information would be required is the purpose of this paper. To this end, we propose a simple model of templates incorporating elasticity of supply (cost) and demand (revenue) which are the core concepts of managerial optimality.
A Simple Generalization of How Institutions are Operated and Why They Need Transfer Pricing
Some of the anomalies reported by Johnson and Turner (2009) include• little evidence that the economics rather than politics of decision- making explained “disparities in student-faculty ratios across fields and disciplines.” (p. 169)• a positive relationship between the salaries of a department’s faculty members and the student-faculty ratio (p. 179)• a negative relationship between faculty salary expenditures per student and individual faculty pay (p. 179)• a long-run inelastic relationship between changes in enrollment by academic area and faculty hiring (p. 184)• a dearth of institutions that “use pricing mechanisms to influence the allocation of students across fields.” (p. 186)
To try to accommodate these and other anomalies, we somewhat arbitrarily divide higher-education institutions into two types:4
Type A is entirely centralized in decision-making, hiring, and strategic planning. Type B is decentralized and overlays a more-or-less autonomous group of individual units.
Type A institutions tend to be smaller and “teaching-oriented.” They are run from the top down with professional managers as administrators. The academic programs are strongly mission-based with a centralized sense of identity. Loyalty is prized over marketability. Type A institutions view themselves as monolithic and use commonly-accepted measures to compare themselves with similar institutions, so far as a pure-play may be found. The leadership in such institutions views itself, correctly or not, as a customer in a single labor market and a provider in a single product market. This is consistent with the model used by Strange (2013) in which individual departments are treated as price-takers who are merely quoting the price dictated by a higher authority (board of trustees or regents). We conjecture that virtually all institutions evolved from something like Type A.5
Type B institutions are large enough that coordination problems preclude micro-management of enrollments, hiring decisions, etc. In contrast to Type A schools, they are run like loosely-amalgamated independent agencies as in an M-form corporation. 6 As such, the decentralized divisions within the multi-divisional institution are allowed (encouraged) to self-select into profitable markets vis-à-vis Proctor & Gamble or General Motors. When competing head-to-head, a division of institution B possesses both advantages

3
and disadvantages relative to institution A. Some advantages are deep pockets from a large, parent, institution and name recognition and the ability to offer complementary programs. Some disadvantages are (1) lack of institution-wide commitment to recruiting, and (2) lack of market-niche status (i.e., “liberal arts” institution with individual attention). But the most prominent differences between the two are in (1) hiring specialized labor (faculty resources) and (2) recruiting students. The biggest disadvantage that Type A institution has is its treatment of all faculty resources as perfectly substitutable and all students as homogeneous. It practices neither price discrimination between its various academic programs nor differential salaries between faculty hires in various fields. The lack of departmental price discrimination is reflected in a relatively elastic demand, while the tendency to pay all faculty resources the same because of a strong mission commitment is reflected in a relatively inelastic supply. Administrators of Type A institutions may think that they are optimizing at the institutional level by employing a mark-up over cost. But they are failing in at least two regards. First, they tend to treat all programs alike as to revenue potential, discarding potentially valuable information and “leaving money on the table.” Second, they tend to make little effort to estimate marginal cost, even if the concept is known to them, much less equate it to marginal cost in order to find the optimal markup. Instead, they likely begin with a pool of scholarship funds with which they can give discounts, sparingly at first, liberally at last as their desperation to meet enrollment expectations, fill dorm rooms, etc, mounts.7 Rather than using discounts strategically from the first in order to practice first-degree price discrimination, they make path-independent assignments of financial aid based on enrollment projections that will be needed to meet the budget (“feeding the beast”). The budget is the anchor that dooms Type A institutions to tie all decisions to historical cost and thereby live a permanent hand-to-mouth existence, never getting control of their discount rates. Why does this matter? Consider an exogenously-imposed cost increase on the institution. This is reflected by an upward shift in the supply curve for each program on campus. In the Type A institution on the left, all departments bear the increase in cost equally. For simplicity, both supply and demand are characterized as linear, although a constant elasticity of either is unlikely. Who will bear the burden of cost increases? Similar to the analogy of tax burden, the Type B institution will be able to pass along more of its cost increase to students in the form of higher (less discounted) tuition, while the Type A institution will have to absorb more of its costs by forgoing raises, curtailing supplies and services, etc. The Type A institution must frequently subsidize operations with undesignated gifts and endowment income, while the Type B institution finds itself in the enviable position of actually adding to its endowment in good years from surplus operating funds. Which is more viable in the long-run? The question is purely rhetorical, since the Type A institution’s sustainability is a matter of fundraising and hope while the Type B institution’s sustainability is a matter of sound management. But practicing price discrimination requires (1) market power, (2) knowledge of elasticities, and (3) barriers to entry that effectively preclude low-cost arbitrage profits. Through accreditation, universities have effective barriers to entry, so the third requirement appears to have been met. What about the first two requirements? Type B institutions tend to deal with the problem by simply letting individual departments operate autonomously, mimicking independent contractors as closely as
4
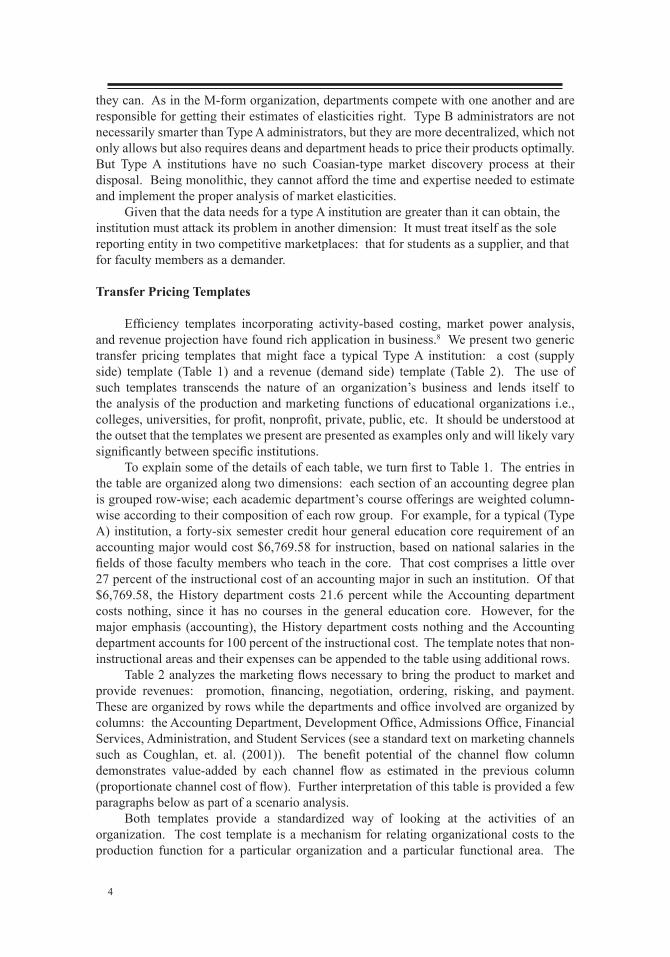
they can. As in the M-form organization, departments compete with one another and are responsible for getting their estimates of elasticities right. Type B administrators are not necessarily smarter than Type A administrators, but they are more decentralized, which not only allows but also requires deans and department heads to price their products optimally. But Type A institutions have no such Coasian-type market discovery process at their disposal. Being monolithic, they cannot afford the time and expertise needed to estimate and implement the proper analysis of market elasticities. Given that the data needs for a type A institution are greater than it can obtain, the institution must attack its problem in another dimension: It must treat itself as the sole reporting entity in two competitive marketplaces: that for students as a supplier, and that for faculty members as a demander.
Transfer Pricing Templates
Efficiency templates incorporating activity-based costing, market power analysis, and revenue projection have found rich application in business.8 We present two generic transfer pricing templates that might face a typical Type A institution: a cost (supply side) template (Table 1) and a revenue (demand side) template (Table 2). The use of such templates transcends the nature of an organization’s business and lends itself to the analysis of the production and marketing functions of educational organizations i.e., colleges, universities, for profit, nonprofit, private, public, etc. It should be understood at the outset that the templates we present are presented as examples only and will likely vary significantly between specific institutions. To explain some of the details of each table, we turn first to Table 1. The entries in the table are organized along two dimensions: each section of an accounting degree plan is grouped row-wise; each academic department’s course offerings are weighted column-wise according to their composition of each row group. For example, for a typical (Type A) institution, a forty-six semester credit hour general education core requirement of an accounting major would cost $6,769.58 for instruction, based on national salaries in the fields of those faculty members who teach in the core. That cost comprises a little over 27 percent of the instructional cost of an accounting major in such an institution. Of that $6,769.58, the History department costs 21.6 percent while the Accounting department costs nothing, since it has no courses in the general education core. However, for the major emphasis (accounting), the History department costs nothing and the Accounting department accounts for 100 percent of the instructional cost. The template notes that non-instructional areas and their expenses can be appended to the table using additional rows. Table 2 analyzes the marketing flows necessary to bring the product to market and provide revenues: promotion, financing, negotiation, ordering, risking, and payment. These are organized by rows while the departments and office involved are organized by columns: the Accounting Department, Development Office, Admissions Office, Financial Services, Administration, and Student Services (see a standard text on marketing channels such as Coughlan, et. al. (2001)). The benefit potential of the channel flow column demonstrates value-added by each channel flow as estimated in the previous column (proportionate channel cost of flow). Further interpretation of this table is provided a few paragraphs below as part of a scenario analysis. Both templates provide a standardized way of looking at the activities of an organization. The cost template is a mechanism for relating organizational costs to the production function for a particular organization and a particular functional area. The
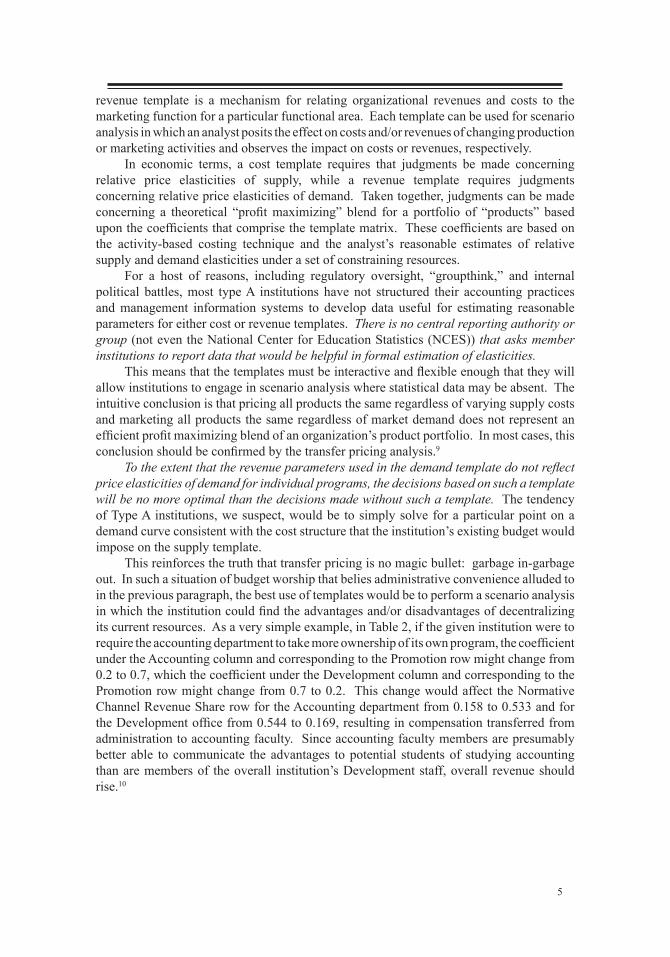
5
revenue template is a mechanism for relating organizational revenues and costs to the marketing function for a particular functional area. Each template can be used for scenario analysis in which an analyst posits the effect on costs and/or revenues of changing production or marketing activities and observes the impact on costs or revenues, respectively. In economic terms, a cost template requires that judgments be made concerning relative price elasticities of supply, while a revenue template requires judgments concerning relative price elasticities of demand. Taken together, judgments can be made concerning a theoretical “profit maximizing” blend for a portfolio of “products” based upon the coefficients that comprise the template matrix. These coefficients are based on the activity-based costing technique and the analyst’s reasonable estimates of relative supply and demand elasticities under a set of constraining resources. For a host of reasons, including regulatory oversight, “groupthink,” and internal political battles, most type A institutions have not structured their accounting practices and management information systems to develop data useful for estimating reasonable parameters for either cost or revenue templates. There is no central reporting authority or group (not even the National Center for Education Statistics (NCES)) that asks member institutions to report data that would be helpful in formal estimation of elasticities. This means that the templates must be interactive and flexible enough that they will allow institutions to engage in scenario analysis where statistical data may be absent. The intuitive conclusion is that pricing all products the same regardless of varying supply costs and marketing all products the same regardless of market demand does not represent an efficient profit maximizing blend of an organization’s product portfolio. In most cases, this conclusion should be confirmed by the transfer pricing analysis.9 To the extent that the revenue parameters used in the demand template do not reflect price elasticities of demand for individual programs, the decisions based on such a template will be no more optimal than the decisions made without such a template. The tendency of Type A institutions, we suspect, would be to simply solve for a particular point on a demand curve consistent with the cost structure that the institution’s existing budget would impose on the supply template. This reinforces the truth that transfer pricing is no magic bullet: garbage in-garbage out. In such a situation of budget worship that belies administrative convenience alluded to in the previous paragraph, the best use of templates would be to perform a scenario analysis in which the institution could find the advantages and/or disadvantages of decentralizing its current resources. As a very simple example, in Table 2, if the given institution were to require the accounting department to take more ownership of its own program, the coefficient under the Accounting column and corresponding to the Promotion row might change from 0.2 to 0.7, which the coefficient under the Development column and corresponding to the Promotion row might change from 0.7 to 0.2. This change would affect the Normative Channel Revenue Share row for the Accounting department from 0.158 to 0.533 and for the Development office from 0.544 to 0.169, resulting in compensation transferred from administration to accounting faculty. Since accounting faculty members are presumably better able to communicate the advantages to potential students of studying accounting than are members of the overall institution’s Development staff, overall revenue should rise.10
6
CONCLUSION
In conclusion, several points are instructive. Some of these points lend themselves to testable hypotheses with data are generally available. Others, with data that are available at this time, do not. As James (1990) and others have pointed out, universities are still very guarded against releasing data (this is addressed again in point six, below). First, the type A (teaching) institutions that do not practice differential tuition policies between departments are not optimizing resources. In a non-competitive marketplace they may be able to do this for many years, but in an industry that is becoming increasingly competitive, they cannot do it for long. Second, there are substantial cost differentials between degrees in the same institution. This hold for both type A (teaching) and type B (research) schools. Third, cost differentials are identifiable through supply elasticities. Institutions have, if they choose to use it, sufficient information to find average cost parameters, although marginal cost parameters are more difficult to obtain because they require understanding of opportunity cost rather than just relying on the inertia of historical average cost information from last year’s budget. Fourth, in the absence of differential tuition (particularly in the tuition-driven, type A, institutions), marginal revenue is treated as constant for each major as a practical matter. The unfortunate result is that the institution loses the ability to compete in different product lines. Fifth, in theory at least, price elasticities of demand may be used to construct optimizing efficiency templates for revenue centers. In practice, rougher estimates for internal allocation of resources will do. Sixth, because of a lack of accountability to a market-driven source of funding, institutions tend not to keep, much less report, necessary information for estimating meaningful demand elasticities. Seventh, without the ability or willingness to use price elasticity of demand information by department and engage in contribution margin maximization, type A institutions cannot determine, much less charge, optimal markups. This is before non-instructional activities are even considered. The lack of requiring reporting data that is market-meaningful to markets helps decentralized (type B) institutions, since they let (require) individual departments on large campuses “duke it out” with their own budgets and funding sources. Such departments are often large enough to possess sufficient slack to take over administering marketing efforts, product development, etc., while Type A institutions are not. The lack of managerial slack in Type A institutions precludes their optimal behavior. The best hope for teaching institutions is to decentralize and try to become research institutions.

7
REFERENCES
Ansary, Asim, S. Siddarth, and Charles B. Weinberg (1996) “Pricing a Bundle of Products or Services: The Case of Nonprofits,” Journal of Marketing Research 33:1 (February), 86-93.Baldenius, Tim, and Stefan Reichelstein (2006) “External and Internal Pricing in Multidivisional Firms,” Journal of Accounting Research 44:1 (March), 1-28.Becker, William E. (1990) “The Demand for Higher Education,” Chapter 7 in The Economics of American Universities: Management, Operations, and Fiscal Environment, Stephen A. Hoenack, Editor, pp. 155-187. Albany: State University of New York Press.Bergmann, Barbara R. (1991) “Bloated Administration, Blighted Campuses,” Academe (November-December), 12- 16.Bhaskar, V., Alan Manning, and Ted To (2002) “Oligopsony and Monopsonistic Competition in Labor Markets,” Journal of Economic Perspectives 16:2 (Spring), 155-174.Brickley, James A., Clifford W. Smith, and Jerold L. Zimmerman (1995) “Transfer Pricing and the Control of Internal Corporate Transactions,” Journal of Applied Corporate Finance (Summer), 60-67.Brinkman, Paul T. (1990) “Higher Education Cost Functions,” Chapter 5 in The Economics of American Universities: Management, Operations, and Fiscal Environment, Stephen A. Hoenack, Editor, pp. 107-128. Albany: State University of New York Press.Burnett, Sharon, and Darlene Pulliam (2014) “Transfer Pricing Seven Years after Glaxo Smith Kline,” Southwestern Economic Review 41:1, 99-108. Coase, Ronald (1937) “The Nature of the Firm,” Economica 4:16, 386-405.Coughlan, Anne T., Erin Anderson, Louis W. Stern, and Adel I. El-Ansary (2001) Marketing Channels: Sixth Edition. Upper Saddle River, NJ: Prentice-Hall.Ehrenberg, Ronald G. (2012) “American Higher Education in Transition,” Journal of Economic Perspectives 26:1 (Winter), 193-216.Giardini, Valerie (1983) Internal Transfer Pricing of Bank Funds. Rolling Meadows, Illinois: Bank Administration Institute.Ginsberg, Benjamin (2011) The Fall of the Faculty: The Rise of the All-Administrative University and Why it Matters. New York: Oxford University Press.Hoenack, Stephen A. (1990) “An Economist’s Perspective on Costs within Higher Education Institutions,” Chapter 6 in The Economics of American Universities: Management, Operations, and Fiscal Environment, Stephen A. Hoenack, Editor, pp. 129-154. Albany: State University of New York Press.Holstrom, Bengt, and Jean Tirole (1991) “Transfer Pricing and Organizational Form,” Journal of Law, Economics, and Organizations 7:2 (Autumn), 201-228.Horton, Marshall J., and Kent S. Faught (2008) “Transfer Pricing and the American University,” Southwestern Economic Review 35:1 (Spring), 227-242.James, Estelle (1990) “Decision Processes and Priorities in Higher Education,” Chapter 4 in The Economics of American Universities: Management, Operations, and Fiscal Environment, Stephen A. Hoenack, Editor, pp. 77-106. Albany: State University of New York Press.Johnson, William R., and Sarah Turner (2009) “Faculty without Students: Resource Allocation in Higher Education,” Journal of Economic Perspectives 23:2 (Spring), 169-189.

8
Kaplan, Robert S. and Steven R. Anderson (2004) “Time-Driven Activity-Based Costing,” Harvard Business Review 82:11, 131-138. Kaplan, Robert S., and Robin Cooper (1998) Cost and Effect: Using Integrated Cost Systems to Drive Profitability and Performance. Cambridge, Massachusetts: Harvard Business School Publishing.Pope, Justin (2013) “From the Recession’s Wake, Education Innovation Blooms,” Hot Springs Sentinel Record (Sunday) August 4, p. 6BPugliese, Alfred (1970) “Tuition, Fees, Deposits, and Other Charges,” Chapter 2 in Handbook of College and University Administration, General, Asa S. Knowles, Editor-in-Chief, pp. 8-13 to 8-26. New York: McGraw-Hill Book Company. Strange, Kevin (2013) “Differential Pricing in Undergraduate Education: Effects on Degree Production by Field”, NBER Working Paper No. 19183 (June) available at http://nber. org/papers/w19183Trussel, John M., and Larry N. Bitner (1996) “As Easy as ABC: Re-engineering the Cost Accounting System,” NACUBO Business Officer (June), 34-39.Williamson, Oliver E. (1975) Markets and Hierarchies: Analysis and Antitrust Implications. New York: The Free Press.

9

10
TABLE 2. DEMAND SIDE ANALYSIS USING REVENUES AND MARKETING COSTS
Transfer Pricing Revenue Template Revenue Generated and Marketing Costs by division (functional area)DEMAND SIDE Major: Accounting
Proportional Flow Performance by Area
Weights contributed by each functional area Benefit to each component of marketing cost:
Potential of Proportion of each channel flow performed by each functional areaProportionate Channel ACADEMIC----------------Non-academic departments--------
Marketing Channel Flow FINAL DEPT: FinancialFlows Cost of Flow Value WEIGHT Accounting Development Admissions Services Admin Student TOTALPromotion 0.6 HIGH 0.75 0.2 0.7 0.05 0 0 0.05 1Financing 0.15 MEDIUM 0.15 0 0 0 0.7 0 0.3 1Negotiation 0.1 HIGH 0.03 0.2 0.5 0.05 0.1 0 0.15 1Ordering 0.05 LOW 0.02 0.1 0.1 0.15 0.1 0.5 0.05 1Risking 0.05 LOW 0.02 0 0 0 0 0.25 0.75 1Payment 0.05 LOW 0.02 0 0.1 0.1 0.1 0.5 0.2 1 TOTAL 1 0.99 0.5 1.4 0.35 1 1.25 1.5
Normative Channel Revenue Share 0.158 0.544 0.044 0.112 0.025 0.107 0.99
TABLE 1. SUPPLY SIDE ANALYSIS USING ACTIVITY BASED COST TEMPLATE
Transfer Pricing Cost Template Direct Activity-Based Instructional Costs by division (functional area)SUPPLY SIDE Major: Accounting
Proportional Flow Performance by Area
Weighted % ofAcademic Average Academic Phil/ Psych/ Fine Phys Life
Areas Hrs Cost Cost Educ Eng Lang Rel Soc Hist Arts Bus Econ Acct Math Sci Sci TotalCore 46 $6,769.58 0.2719 0.079 0.185 0.000 0.126 0.000 0.216 0.108 0.031 0.000 0.000 0.066 0.093 0.098 1
Major core 39 $9,422.08 0.3785 0.000 0.000 0.000 0.000 0.000 0.000 0.000 0.734 0.125 0.141 0.000 0.000 0.000 1Major emphasis 27 $5,658.75 0.2273 0.000 0.000 0.000 0.000 0.000 0.000 0.000 0.000 0.000 1.000 0.000 0.000 0.000 1
Basic School 12 $2,246.25 0.0902 0.000 0.000 0.000 0.000 0.202 0.000 0.000 0.798 0.000 0.000 0.000 0.000 0.000 1Language 6 $799.17 0.0321 0.000 0.000 1.000 0.000 0.000 0.000 0.000 0.000 0.000 0.000 0.000 0.000 0.000 1
0 0.1 0.1 0.1 0.5 0.2 1 2 3.9 7.7 15.3 30.1 60
TOTAL 120 $24,895.83 1.0000
Departmental Cost 0.021 0.05 0.032 0.034 0.018 0.059 0.0293 0.3582 0.0473 0.2807 0.0179 0.0252 0.0265
Non-instructionalCosts may be added as needed below in format illustrated above

11
12

13

14