Embed Size (px)
Citation preview

RESEARCH ARTICLE Open Access
Transcriptomic network analyses of leafdehydration responses identify highlyconnected ABA and ethylene signalinghubs in three grapevine species differing indrought toleranceDaniel W. Hopper, Ryan Ghan, Karen A. Schlauch and Grant R. Cramer*
Abstract
Background: Grapevine is a major food crop that is affected by global climate change. Consistent with field studies,dehydration assays of grapevine leaves can reveal valuable information of the plant’s response at physiological,transcript, and protein levels. There are well-known differences in grapevine rootstocks responses to dehydration. Weused time-series transcriptomic approaches combined with network analyses to elucidate and identify importantphysiological processes and network hubs that responded to dehydration in three different grapevine species differingin their drought tolerance.
Results: Transcriptomic analyses of the leaves of Cabernet Sauvignon, Riparia Gloire, and Ramsey were evaluated atdifferent times during a 24-h controlled dehydration. Analysis of variance (ANOVA) revealed that approximately 11,000transcripts changed significantly with respect to the genotype x treatment interaction term and approximately 6000transcripts changed significantly according to the genotype x treatment x time interaction term indicating massivedifferential changes in gene expression over time. Standard analyses determined substantial effects on the transcriptabundance of genes involved in the metabolism and signaling of two known plant stress hormones, abscisic acid(ABA) and ethylene. ABA and ethylene signaling maps were constructed and revealed specific changes in transcriptabundance that were associated with the known drought tolerance of the genotypes including genes such as VviABI5,VviABF2, VviACS2, and VviWRKY22. Weighted-gene coexpression network analysis (WGCNA) confirmed these results. Inparticular, WGCNA identified 30 different modules, some of which had highly enriched gene ontology (GO) categoriesfor photosynthesis, phenylpropanoid metabolism, ABA and ethylene signaling. The ABA signaling transcription factors,VviABI5 and VviABF2, were highly connected hubs in two modules, one being enriched in gaseous transport and theother in ethylene signaling. VviABI5 was distinctly correlated with an early response and high expression for the droughttolerant Ramsey and with little response from the drought sensitive Riparia Gloire. These ABA signaling transcriptionfactors were highly connected to VviSnRK1 and other gene hubs associated with sugar, ethylene and ABA signaling.(Continued on next page)
* Correspondence: [email protected] of Biochemistry and Molecular Biology, University of Nevada,Reno, NV 89557, USA
© 2016 Hopper et al. Open Access This article is distributed under the terms of the Creative Commons Attribution 4.0International License (http://creativecommons.org/licenses/by/4.0/), which permits unrestricted use, distribution, andreproduction in any medium, provided you give appropriate credit to the original author(s) and the source, provide a link tothe Creative Commons license, and indicate if changes were made. The Creative Commons Public Domain Dedication waiver(http://creativecommons.org/publicdomain/zero/1.0/) applies to the data made available in this article, unless otherwise stated.
Hopper et al. BMC Plant Biology (2016) 16:118 DOI 10.1186/s12870-016-0804-6

(Continued from previous page)
Conclusion: A leaf dehydration assay provided transcriptomic evidence for differential leaf responses to dehydrationbetween genotypes differing in their drought tolerance. WGCNA proved to be a powerful network analysis approach; itidentified 30 distinct modules (networks) with highly enriched GO categories and enabled the identification of genehubs in these modules. Some of these genes were highly connected hubs in both the ABA and ethylene signalingpathways, supporting the hypothesis that there is substantial crosstalk between the two hormone pathways. This studyidentifies solid gene candidates for future investigations of drought tolerance in grapevine.
Keywords: ABA, ABI5, Dehydration, Ethylene, Grapevine, Network analysis, Transcriptomics, Vitis, WGCNA
BackgroundBoyer [1] reviewed the impact of the environment on cropproduction and highlighted the need for crops bettersuited to these environments. Much has been learnedsince then, yet our understanding of plant responses toabiotic and biotic stresses is very incomplete. Drought sig-naling within plants is a complex process involving manydifferent signaling cascades [2]. A rapid assay was devel-oped to assess the physiological response of differentgrapevine genotypes to dehydration [3]. This assay is asimple approach that can determine differences in dehy-dration sensitivity at the physiological and Omic levels.Climate change is expected to affect water and land
availability [4, 5]. Rootstocks are used in viticulture be-cause they can confer pest or drought resistance, altervigor to the scion or the fruit-bearing portion of theplant, thus, impacting fruit quality; rootstocks are vitalin most viticultural regions [6, 7]. Much research hasfocused on the scion-rootstock relationship [8–11], butthere is little research on the rootstock response toabiotic conditions.Three different Vitis genotypes were shown previously to
have differences in their dehydration sensitivity [3, 6, 12].Cabernet Sauvignon (Vitis vinifera L.) along with twoNorth American Vitis species commonly used as root-stocks, Ramsey (Vitis champinii Planch., a naturally occur-ring hybrid between Vitis candicans Engelm. and Vitisrupestris Scheele) and Riparia Gloire (Vitis riparia Michx.).Ramsey, a drought tolerant genotype, originates from hot,dry regions of Texas. Riparia Gloire originates from wet,riparian areas and is drought sensitive [3, 6, 12].Transcriptomic analyses allow one to have a “holistic”
snapshot of the plant’s transcriptional response to achanging environment [2]. A time-series transcriptomicanalysis allows one to begin to elucidate the sensitivities ofthe response and the primary or secondary responses. Co-expression analyses allow one to identify networks, genesthat have high connectivity or correlation with each other.A particularly powerful approach is the weighted coex-pression network analysis (WGCNA) method [13–16].This analysis can identify clusters (modules) of genes withhigh biological meaning. It can also identify those geneswith high connectivity or module membership, which are
essentially hub genes. Similar to airport hubs, if one hub isnot functioning, the whole system can slow down orbecome chaotic. Therefore we consider hub genes import-ant or essential genes for the proper functioning of thesystem or organism.Abscisic acid (ABA) and ethylene are two important
hormones that regulate abiotic stress responses in plants[2, 17]. In a preliminary survey of more than 30 geno-types, we found variation in the increase in transcriptabundance of VviNCED3, the rate-limiting step in ABAbiosynthesis, in response to rapid dehydration. Wehypothesize that the transcriptomic responses to rapiddehydration between these grapevine genotypes are dif-ferent and may involve ABA signaling. In this time-series transcriptomic study, we identify significant genesby standard and network (WGCNA) analysis methods; anumber of these genes are involved in ABA and ethylenesignaling and correlate with the relative drought toler-ance between the genotypes. In particular, ABI5, a tran-scription factor gene normally associated with ABAregulation of germination, was highly sensitive and in-creased in Ramsey leaves, the most drought tolerant ofthe three genotypes, early in the response to dehydra-tion, but there was little effect of dehydration on abscisicacid insensitive 5 (ABI5) transcription factor expressionin Riparia Gloire leaves, the most drought sensitive ofthe genotypes. This gene and other hub genes are identi-fied as “solid” candidates for future drought toleranceresearch.
MethodsPlant material and experimental conditionsThree grapevine genotypes (Vitis vinifera cv. CabernetSauvignon clone 8, Vitis riparia cv. Riparia Gloire, andVitis champinii cv. Ramsey (a naturally occurring hybridbetween Vitis candicans and Vitis rupestris)) were prunedto two shoots and grown in 13.3 liter pots containing 10 LSuperSoil® potting mix supplemented with slow releasefertilizer (5-10-10). The original vine cuttings of RipariaGloire and Ramsey were obtained from Dr. AndrewWalker at the University of California, Davis, CA, USA.The original vine cuttings of Cabernet Sauvignon vineswere obtained from Inland Desert Nursery in Benton City,
Hopper et al. BMC Plant Biology (2016) 16:118 Page 2 of 20
WA, USA. Vines were grown in a greenhouse withsupplemental sodium vapor lamp lighting (day/nightcycles of 16 h/8 h light (minimum 400 μE m−2 s−1) and28 °C/18 °C). Fully-developed leaves were subjected todehydration as previously described [3]. Leaves wereremoved from dehydration boxes at 1, 2, 4, 8, and 24 hand frozen immediately in liquid nitrogen. Control leaveswere taken from the second shoot of the intact plant atthe corresponding daytime of the dehydration assay toaccount for circadian effects on transcript abundance.
RNA extraction and microarray hybridizationFrozen leaves were ground using a Retsch MM 301 ballmill [18] for 1 min at 30 revolutions s−1. Total RNA wasextracted from approximately 100 mg of tissue using acetyl trimethylammonium bromide (CTAB)-based method[19, 20]. Extracts were treated with DNase (Qiagen RNeasyPlant Kit, [21]) according to manufacturer’s instructions.RNA quality and quantity were assessed with a NanodropND-1000 spectrophotometer (ThermoFisher Scientific,Waltham, MA) and an Agilent 2100 Bioanalyzer (AgilentTechnologies, Santa Clara, CA, USA) according to themanufacturer’s instructions. Microarrays were hybridizedby MOgene (St. Louis, MO, USA) using the NimbleGenmicroarray 090818 Vitis exp HX12 (Roche, NimbleGenInc., Madison, WI, USA) according to the manufacturer’sinstructions.
Statistical analysisAll microarrays were analyzed as one set as previouslydescribed [22–24]. One of ninety arrays (Rip4S2) exhibitedconsiderable spatial variation, and thus was excluded. Twoother arrays (Cab4S3 and Cab8S1) had notable statisticallysignificant outliers across replicates when compared toother arrays, and were thus also excluded.A simple 3-way analysis of variance (ANOVA) was
performed on normalized (log-transformed) and quality-controlled processed data to determine which probesetson the array were differentially expressed with statisticalsignificance across Genotype, Treatment, and Time, andthe 2-way and 3-way interaction of these effects. The proc-essed and normalized expression values were not normallydistributed, thus an extension of the Kruskal Wallis ranksum test was used for the ANOVA [25]. A multiple testingcorrection was applied to the p-values of the ANOVA[26], and any probeset with a significant Genotype x Treat-ment or Genotype x Treatment x Time interaction termwith adjusted p-value ≤ 0.05 was examined further.Principal component analysis (PCA) was applied to
quality-controlled expression data using the covariancematrix to visualize any trends in the expression data[27–30]. The PCA (Additional file 1) showed a very clearseparation between genotypes, supporting the large
number of probesets with a statistically significant tissueeffect (95.6 %).Gene expression was also evaluated with WGCNA
[15] using the following settings for the adjacencyfunction (datExpr, power = 16, type = "signed hybrid",corFnc = "bicor", corOptions = "use = 'p', maxPOutliers =0.1") and for the cuttreeDynamic function (dendro = gene-Tree, distM= dissTOM, method = "hybrid", deepSplit = 2,pamRespectsDendro = F, minClusterSize = 30); these func-tions have been shown to be the best approach for biologic-ally meaningful results [16]. WGCNA also confirmed clearseparation by genotype and treatment (Additional file 2).Functional categorization of significant transcripts was
performed with the BiNGO plugin [31] in Cytoscape[32] using a gene ontology (GO) file created with theEnsemblPlants BioMart [33] for Vitis vinifera. Overrep-resented (enriched) categories were determined using ahypergeometric test with a significance threshold at 0.05after a Benjamini and Hochberg false discovery ratecorrection.
ResultsDehydration causes massive changes in gene expressionFully mature Cabernet Sauvignon, Riparia Gloire, andRamsey leaves were dehydrated [3] to asses rapid tran-scriptomic changes. Briefly, the leaf was excised fromthe plant and placed into a dehydration box for varioustime points over a 24-h period. Leaf dehydration oc-curred in the air above a solution of NaCl in a sealedcontainer in a growth chamber. Leaves were removedfrom the box and immediately frozen in liquid nitrogenat specific time points of dehydration. Control sampleswere taken from the same plant at the correspondingtime to account for any circadian effect on transcriptabundance. RNA was extracted from three experimentalreplicates for treatment and control samples at eachtime point.In order to test the hypothesis that the response to
rapid dehydration between the different genotypes isdifferent over time at the transcript level, a 2 × 2 × 5factorial (Genotype x Treatment x Time) experimentaldesign was established. Transcriptomic analysis was carriedout using the NimbleGen Grape Whole-Genome Micro-array. A parametric ANOVA was originally performed butbecause the expression data were not quite normally dis-tributed, the expression data were reanalyzed using a non-parametric ANOVA. The nonparametric ANOVA reducedthe overall number of genes with differential expression byabout 10 %. The nonparametric ANOVA determined thatthe abundance of 28,030 transcripts changed significantlywith an adjusted p-value ≤ 0.05 (herein referred to as “sig-nificant” throughout the paper) with respect to genotype(Table 1, Additional file 3). Clearly there are large differ-ences in gene expression between these species regardless
Hopper et al. BMC Plant Biology (2016) 16:118 Page 3 of 20

of treatment. There were 18,237 and 23,656 transcriptsthat changed significantly with Treatment and Time,respectively; 11,436 transcripts changed significantlywith respect to Genotype x Treatment; 24,543 tran-scripts changed significantly with genotype over time;17,488 transcripts changed significantly with Treat-ment x Time, and finally 6,285 transcripts changedsignificantly for the Genotype x Treatment x Timeterm (Table 1, Additional file 3).Two approaches were taken to analyze these large
datasets: “standard analysis” and “network analysis”.With standard analysis we used a posteriori knowledgeto sort through known biochemical and signaling path-ways affected by dehydration. With network analysis, wetook an a priori approach by using WGCNA and GOenrichment methods.As we are interested in elucidating mechanisms of
drought tolerance, we focused on the Genotype x Treat-ment and the Genotype x Treatment x Time interactionsets of genes. GO categories for these gene sets were deter-mined with a custom Vitis GO file (see Methods) and ana-lyzed for significant overrepresentation using BiNGO, aCytoscape plug-in [31]. However, GO enrichment analysiswas not very informative with these large datasets. Therewere two biological processes significantly overrepresentedfor the Genotype x Treatment gene set (Additional file 4):translation and phenylpropanoid metabolism (more willbe discussed about these categories later in the networkanalysis section). The Genotype x Treatment x Time geneset had one category that was significantly overrepre-sented: oxidation-reduction (Additional file 5). This latterinteraction term did not provide any obvious clues aboutdifferences between the genotypes, so we used previousknowledge from our research to ascertain if there weredifferences in ABA metabolism and signaling, the hypoth-esis in which we were most interested.
Dehydration induces significant changes in ABAmetabolism transcripts between the genotypesThe rate-limiting step in ABA biosynthesis is catalyzedby genes that encode 9-cis-epoxycarotenoid dioxygenase(NCED) [34, 35]. In Vitis there are three NCED genes,which can lead to the production of ABA [36]. The genesymbols used are based upon the symbol used to theclosest ortholog in Arabidopsis. Vitis and Arabidopsisloci for these symbols are listed in Additional file 6. Asignificant difference in the transcript abundance forthese three genes was observed (Fig. 1). In Cabernet
Sauvignon, VviNCED3 expression was slightly decreasedat 1 h of dehydration while the expression in RipariaGloire and Ramsey was increased in response to dehy-dration. Riparia Gloire had larger initial response thanRamsey, but after 4 h, VviNCED3 expression of Ramseyand Cabernet Sauvignon exceeded that of Riparia Gloire.These results confirmed our preliminary results that therewere differences between the genotypes in the expressionof VviNCED3 in response to dehydration.VviNCED5 transcript abundance increased in Cabernet
Sauvignon leaves from 2 to 8 h; there was an increase inRiparia Gloire at the 8 h time point and a slight increase inRamsey (Fig. 1). The transcript abundance of VviNCED6in both North American genotypes increased within 1 h ofdehydration, but there was little response in CabernetSauvignon (Fig. 1). These data indicate a different regula-tion of these genes in response to dehydration as well asdifferences between the genotypes.ABA action within the plant is also dependent on
degradation, conjugation and transport. Significant dif-ferences in the transcript abundance of genes involvedin these processes were different between the genotypes.Degradation of ABA is catalyzed by a group of cytochromeP450 enzymes known as ABA-hydroxylases, and thencontinues by a few non-enzymatic steps leading to theformation of phaseic acid. Two genes annotated to beABA-hydroxylases, VviCYP707A3 and VviCYP707A4,responded differently to the dehydration (Fig. 1). Thetranscript abundance of VviCYP707A4 decreased through-out the experiment for all genotypes. At 4 h of dehydration,transcript abundance in both Riparia Gloire and Ramseywere at their lowest points with a log2 fold decrease greaterthan 4. Interestingly,VviCYP707A3 increased in expressionthroughout the experiment, most notably in CabernetSauvignon (Fig. 1).Active ABA can also be produced through β-glucosidase,
which involves the hydrolysis of an inactive form of ABA,Glc-conjugated ABA (ABA-GE), to active ABA. Theseenzymes are localized in the vacuole where ABA-GEis known to be stored [37]. Previously, Zhang et al.[38] found significant differences in the expression ofthree genes in Vitis encoding β-glucosidases in Vitisvinifera cv. Muscat Hamburg berry ripening. In ourstudy, transcript abundance of VviBGLU40 increasedin Riparia Gloire leaves, most notably at 2 h of dehydration(Fig. 1). Interestingly, Zhang et al. [38] reported thatVviBG3 transcript abundance decreased through véraisonin berry samples. A similar expression profile was observed
Table 1 Number of significant transcripts for each effects and interaction term in the ANOVA. Significance mentioned in themanuscript refers to an adjusted p≤ 0.05
Genotype (G) Treatment (TRT) Time G x Trt G x Time Trt x Time G x Trt x Time
28,030 18,237 23,656 11,436 24,543 17,488 6285
Hopper et al. BMC Plant Biology (2016) 16:118 Page 4 of 20

in this study in all genotypes surveyed, most notably inRiparia Gloire at 8 h of dehydration (Fig. 1).ABA transport can also affect ABA concentrations.
The transcript abundance of two ABA transporters wasshown to increase significantly in response to dehydra-tion (Fig. 1) and was different between the genotypesover time. VviABCG25 is an ATP-binding cassette(ABC) transporter that exports ABA from vascular tis-sues allowing ABA to reach distant guard cells [39, 40].After 4 h of dehydration, transcript abundance increasedwith a log2 fold change of more than 2. All genotypesdisplayed a large increase in transcript abundance by 8 hof dehydration.In Arabidopsis, AtABCG40 imports ABA directly into
guard cells [41]. In our study, transcript abundance in allgenotypes increased within 1 h of dehydration (Fig. 1).Interestingly, Riparia Gloire increased nearly 5-fold indi-cating a massive change in transcript abundance. Thisgene may contribute to the dehydration and ABA sensitiv-ity of stomatal conductance of Riparia Gloire leaves [3].Together these results indicate that transcripts in-
volved in ABA metabolism changed significantly in re-sponse to rapid dehydration and the responses between
the genotypes were different, consistent with the differ-ences in dehydration sensitivity previously observed [3].
ABA core-signaling response to dehydrationDownstream of ABA biosynthesis is a complex ABA sig-naling network involving many different genes. Recently,Lumba et al. [42] took a systems biology approach tocreate an ABA core-signaling network consisting of over500 interactions between 138 proteins in Arabidopsis.Many different processes are represented such as pro-teins involved in transport, metabolism, proteolysis,calcium sensing, as well as numerous transcription fac-tors and kinases. Vitis orthologs were compiled based onthe closest orthologs identified by Gramene ([43] release44 (January 2015); see list in Additional file 6. Significantdifferences in gene expression within the ABA core-signaling network were detected (Fig. 2).ABA binds to receptors in the cytoplasm known as
PYR/PYL/RCAR proteins [44, 45]. Evidence indicatesthat there are additional receptors located at the plasmamembrane [46]. Interestingly, the transcript abundanceof VviPYL4 changed significantly in response to dehy-dration between the genotypes; transcript abundance
Chloroplast
9 -cis-neoxanthin
NCED
Xanthoxin
Cytoplasm
ABA2
VviNCED5
VviNCED3
VviNCED6
Abscisic acid
ABA-aldehyde
AAO4
(active)
DegradationPhaseic acidABAHASE (inactive)
VviCYP707A3
VviCYP707A4
VviABCG25 (vascular efflux)
VviABCG40 (guard cell influx)
Transport
Synthesis
UGT
ABA-GE(inactive)
VviBG3
VviBGLU40
Storage
> 2.0> 1.5> 1.0> 0.5
Log2 Stress:Control
Time Scale (hours)
CabernetRip. G
1 2 4 8 24
< -0.5< -1.0< -1.5< -2.0
Ramsey
VviUGT71B6L
VviABA2
VviAAO4
Fig. 1 A simplified model of transcripts involved in ABA metabolism and transport. Corresponding Vitis loci ID and ANOVA results for the gene symbolsused in this figure are listed in Additional file 6. Data are presented as heatmaps of mean values of a log2 ratio (Stress:Control), n = 3 at each time point
Hopper et al. BMC Plant Biology (2016) 16:118 Page 5 of 20
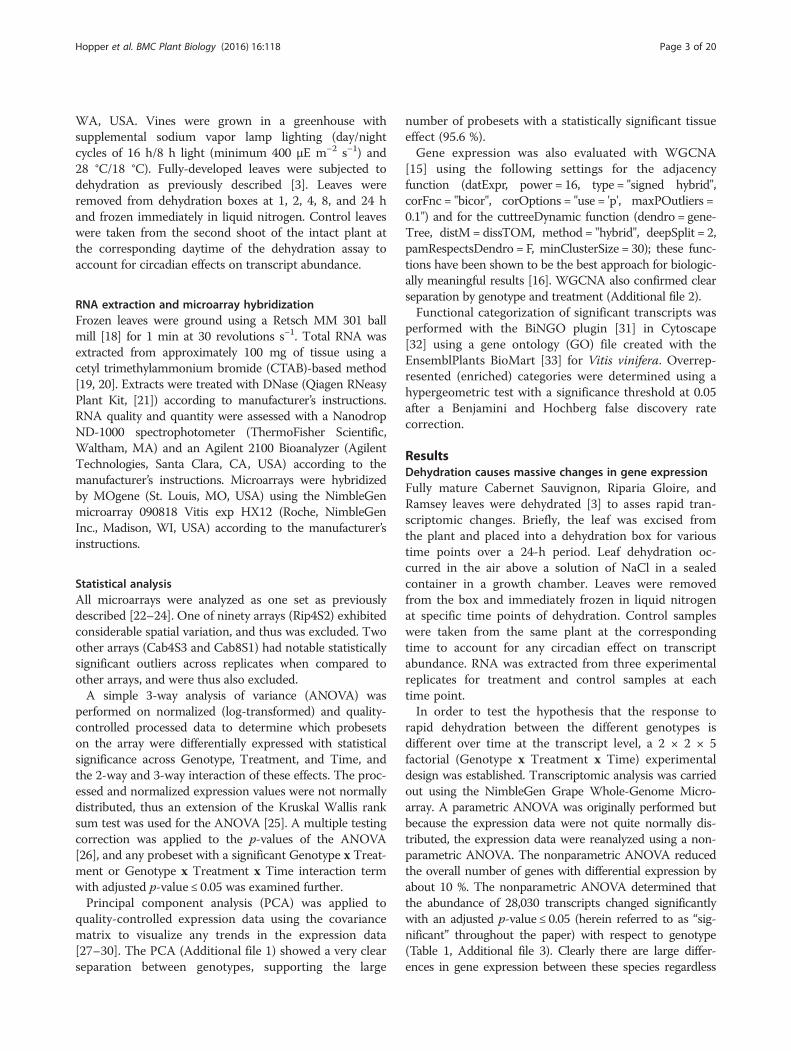
was decreased in Cabernet Sauvignon leaves while therewas a slight increase in Riparia Gloire and little responsein Ramsey (Fig. 2). ABA receptors interact with specifictype 2C protein phosphatases (PP2C), which inhibit theactivity of serine/threonine-protein kinase 2.6 (SnRK2.6;OST1) when ABA is not present. In the presence ofABA, PP2C proteins dissociate from the kinase allowingautophosphorylation and subsequent downstream sig-naling. The transcript abundance of two PP2C genes,VviHAI1 and VviAHG3, increased significantly in re-sponse to dehydration between the genotypes (Fig. 2).The transcript abundance of VviOST1 significantly in-creased in response to dehydration, most notably inRamsey after 24 h of dehydration (Fig. 2). Downstreamtargets of VviOST1 also increased significantly in re-sponse to dehydration (Fig. 2). Targets include an ABA-responsive binding elements factor (ABF) that containsan ABA-responsive element (ABRE; PyACGTGG/TC) asa conserved cis-element in the promoter region [47].In our study, VviABF2 transcript abundance increased
significantly in response to dehydration in all the ge-notypes (Fig. 2). Another ABF protein that is a targetof OST1 is ABI5. VviABI5 transcript abundance in-creased significantly in response to dehydration, mostnotably in Ramsey leaves as early as 1 h of dehydra-tion (Fig. 2). Recently, Yoshida et al. [48] noted thatABF2 in Arabidopsis is one of four predominantAREB/ABF transcription factors downstream of SnRK2.6(OST1) in response to various osmotic stress conditions.Interestingly, the authors did not see a significant increasein the expression of AtABI5 under their conditions. In ourstudy, there is clear evidence for the induction and differ-ential expression of VviABI5 in response to dehydration.A number of genes are induced by ABA, but lack the
specific binding element mentioned above includingproteins known to be involved in transport. The tran-script abundance of two genes, guard cell S-type anionchannel, VviSLAC1, and nitrate transporter, VviNRT1,changed significantly in response to dehydration (Fig. 2).SLAC1 is required for stomatal closure under conditions
Nuclear
Metabolism
Transport
Hormone
Kinases
VviPYL4
VviHAI1 VviAHG3
VviABF2
VviOST1
VviACS6
VviACS2VviARR5
VviARR4
VviERF11
VviERF6L1
VviERF6L3
VviMYB12 VviMYB77
VviANAC072VviHB6
VviHB12
VviRAP2.4
VviERF17
VviERF4
VviADH1 VviCAD5
VviBCAT2
VviGPX3
VviGAT1VviSLAC1 VviNRT1
VviHVA22D
VviMLO4
VviSnRK3.11
VviSnRK3.16
VviSnRK3.6
VviDGK2
VviMAP3Kd4
VviETR2 VviCCR2
VviWNK2
> 2.0> 1.5> 1.0> 0.5
Time Scale (hours)
CabernetRip. G
1 2 4 8 24
< -0.5< -1.0< -1.5< -2.0
Log2 Stress:Control
Ramsey
VviABI5
Fig. 2 Representation of the transcript abundance of some of the genes of the ABA core interactome. Corresponding Vitis loci ID and ANOVAresults for the gene symbols used in this figure are listed in Additional file 6. Data are presented as heatmaps of mean values of a log2 ratio(Stress:Control), n = 3 at each time point
Hopper et al. BMC Plant Biology (2016) 16:118 Page 6 of 20

of high CO2 and ABA [49]. Interestingly,VviSLAC1 tran-script abundance decreased in response to dehydration(Fig. 2). In contrast, the transcript abundance ofVviNRT1 increased significantly in response to dehydra-tion most notably in Cabernet Sauvignon and Ramseyleaves (Fig. 2). NRT1 acts as both a low- and high-affinity nitrate transporter in Arabidopsis depending onit phosphorylation status [50]. Nitrate concentrationsappear to be important because nitric oxide (NO) is animportant signaling molecule in ABA-induced stomatalclosure and the production of NO is mediated throughnitrate reductase activity [51].Two additional transcripts shown to be within the
ABA core-signaling network are the ABA-inducibleHVA22-like homolog D (HVA22D) and mildew resist-ance locus 4 (MLO4). In our study, VviHVA22D tran-script abundance increased significantly, most notably inRamsey at 24 h of dehydration (Fig. 2). In contrast,VviMLO4 transcript abundance significantly decreasedin response to dehydration, again most notably inRamsey starting at 4 h of dehydration and continuingthroughout the experiment (Fig. 2).
Metabolic transcripts within the ABA core-signalingnetworkMultiple transcripts within the ABA core-signaling net-work are known to be involved in metabolism. Changesin the expression of a number of these genes were ob-served (Fig. 2). Transcript abundance changes occurredmore noticeably in Ramsey. For example, VviGPX3 en-codes a glutathione peroxidase; its transcript abundancesignificantly decreased more than 1.5 log2 fold at 24 h ofdehydration in Ramsey (Fig. 2). In addition, VviBCAT2(branched-chain amino acid transaminase 2), VviGAT1(involved in amino acid transport), and VviCAD5 (cinna-myl alcohol dehydrogenase) significantly increased inexpression in response to dehydration (Additional files 3and 6). The transcript abundance of an alcohol dehydro-genase, VviADH1, increased in response to dehydra-tion within 4 h in Cabernet Sauvignon leaves withboth Riparia Gloire and Ramsey increasing later inthe experiment (Fig. 2).
Kinase transcripts within the ABA core-signaling networkIn addition to VviOST1, a number of other transcriptsencoding kinases significantly changed in response todehydration. For example, a number of SnRK3 kinasessignificantly increased in expression in response todehydration (Fig. 2). These kinases are involved in anumber of plant stress responses including cold, salt, anddrought [52]. For example, the transcript abundance ofVviSnRK3.11 increased most notably in Riparia Gloire at2 h of dehydration (Fig. 2). Another, VviSnRk3.16 in-creased with a peak in expression at 8 h in both Cabernet
Sauvignon and Ramsey with little response in RipariaGloire. Finally, the transcript abundance of VviSnRK3.6increased in all genotypes surveyed, the earliest in RipariaGloire leaves at 4 h of dehydration (Fig. 2).Another kinase of note changing in response to dehy-
dration is a diacylglycerol kinase (DGK), VviDGK2(Fig. 2). DGK synthesizes phosphatidic acid (PA), whichis an important lipid-signaling molecule in plants in-volved in both biotic and abiotic signaling pathways [53].The transcript abundance of VviDGK2 increased as earlyas 1 h of dehydration in all genotypes (Fig. 2). Thelargest increase was observed in Cabernet Sauvignonleaves with a log2 fold increase of nearly 2.5, with RipariaGloire lower at 1.8, and Ramsey at 1.2.Other kinases increasing in expression include
VviETR2 and VviMAP3Kδ4. Ethylene receptor 2 (ETR2)is a member of a group of ethylene receptors, whichupon binding ethylene initiate a large signaling cascade(see below). In response to dehydration, VviETR2 in-creased in all genotypes with Cabernet Sauvignon andRamsey increasing within 2 h of dehydration followed byRiparia Gloire at 4 h (Fig. 2). In contrast, VviMAP3Kδ4encodes an activated mitogen kinase, which increased inRiparia Gloire most notably at 2 h of dehydrationfollowed by both Cabernet Sauvignon and Ramsey.Two examples of kinases that significantly decreased in
transcript abundance were a CRINKLY4 related 2(VviCCR2) and VviWNK2 (with no lysine (K)) (Fig. 2);VviCCR2 decreased with a log2 fold change of −1.8 and −1.6in Cabernet Sauvignon and Ramsey, respectively, with littleresponse in Riparia Gloire. In contrast,VviWNK2 displayeda log2 fold decrease of more than 2 in Riparia Gloire at 24 hof dehydration, the lowest observed (Additional file 3). To-gether, these data indicate significant changes in the expres-sion of a number of kinases involved in multiple processes.
Transcription factor transcripts within the ABA core-signaling networkThere are many transcription factors in the ABA core-signaling network. An investigation into the expressionof all is outside the scope of this work. Instead, interestingdifferences between the genotypes are highlighted. Tran-scription factors from multiple families are representedindicating changes in many different signaling cascades.For example, a number of transcripts from the MYB (mye-loblastosis), NAC (for NAM (no apical meristem), ATAF(Arabidopsis transcription activation factor), CUC (cup-shaped cotyledon)), and AP2/ERF (APETALA2/Ethylene-Responsive Element Binding Protein) domain transcriptionfactor families changed significantly between the genotypesin response to dehydration.Two MYB genes in particular within the ABA core-
signaling network responded differently to dehydration.The transcript abundance of VviMYB12 decreased
Hopper et al. BMC Plant Biology (2016) 16:118 Page 7 of 20

particularly in Riparia Gloire beginning at 1 h of dehy-dration (Fig. 2). In Arabidopsis, MYB12 regulates flavon-oid biosynthetic genes [54] and subsequent reactiveoxygen species (ROS) scavenging leading to greaterdrought tolerance [55]. Conversely, a MYB77-like gene,VviMYB77 increased in expression particularly in Caber-net Sauvignon at 4 h of dehydration. MYB77 respondsto ethylene and is involved in stress memory [56].The transcript abundance of another two genes classi-
fied as homeodomain leucine zipper class I transcriptionfactors, VviHB6 and VviHB12, changed significantly be-tween the genotypes in response to dehydration. VviBH6transcript abundance decreased in expression, particularlyin Ramsey at 24 h of dehydration (Fig. 2). In contrast,VviBH12, followed a similar pattern in all genotypesdisplaying a decrease in expression early followed by anincrease throughout the rest of the experiment.One of the largest groups of transcription factors in
plants is the AP2/ERF superfamily. With more than 130members in Vitis, this particular family is known toregulate many different processes such as response tobiotic and abiotic stress, development, reproduction, andresponse to hormones [57]. Recently, Cramer et al. [23]reanalyzed the phylogeny of this family in Vitis. Out of130 family members on the Vitis microarray, 91 chan-ged significantly in response to dehydration betweenthe genotypes with 99 changing significantly in re-sponse to dehydration between genotypes over time(Additional files 3 and 6). This indicates that ethyleneand ethylene signaling may play important roles inthe dehydration response.Recently, Dubois et al. [58] classified ERF6 and ERF5
as the “master regulators” of leaf growth in Arabidopsis.A number of ERF6-like transcription factors changed inresponse to dehydration. VviERF6L3 and VviERF6L1responded similarly by increasing rapidly at 1 h of dehy-dration in Cabernet Sauvignon leaves with little responsein both Ramsey and Riparia Gloire (Fig. 2). In contrast,the ERF/AP2 transcription factors, VviRAP2.4 andVviERF11, displayed a similar pattern in Riparia Gloireincreasing with a peak in expression at 2 h of de-hydration. These data indicate a difference in theresponse between genotypes for multiple AP2/ERFtranscription factors.
Other hormone signaling transcripts within the ABAcore-signaling networkTranscripts involved in ABA signaling are also known tointeract with other hormone signaling pathways. Forexample, ARR5 (Arabidopsis response regulator 5) is anessential component of cytokinin signaling [59]. Thetranscript abundance of the closest Vitis ortholog,VviARR5, was decreased for all genotypes (Fig. 2). Thetranscript abundance in Cabernet Sauvignon decreased
as early as 2 h of dehydration, however, at 24 h ofdehydration the greatest changes were observed inRamsey with a log2 fold change decrease of −2.0. Thetranscript abundance of VviARR4 significantly de-creased in response to dehydration (Fig. 2). Thisparticular gene is known to be involved in the ethylenesignaling pathway [60].In plants, ethylene is synthesized from S-adenosine-L-
methionine (SAM), and 1-aminocyclopropane-1-carb-oxylate (ACC). The conversion of SAM to ACC iscatalyzed by ACC synthase (ACS), which is followed bythe oxidation of ACC to ethylene catalyzed by ACCoxidase (ACO) [61]. ACS is the rate-limiting enzyme forethylene biosynthesis. In our study, a number of putativeACS genes changed significantly in response to dehydra-tion (Figs. 2 and 3). For example, transcript abundanceof VviACS2 increased in all genotypes, most notably inRiparia Gloire at 1 h of dehydration (Fig. 2). In bothRiparia Gloire and Cabernet Sauvignon, gene expressionremained high throughout the experiment while Ramseywas increased at 4 h of dehydration. Another examplethat has been linked to the ABA core-signaling networkis VviACS6 (Fig. 2). Interestingly, this gene was differen-tially regulated between the genotypes. The transcriptabundance increased at 1 h in Cabernet Sauvignon,followed by Riparia Gloire, and the lowest expressionwas in Ramsey (Fig. 2).Together, these data indicate that there are many
changes in gene expression within the ABA core-signaling network as defined by Lumba et al. [42].Changes in gene expression involved in processes suchas transport, transcription factor expression, kinaseexpression, and hormone signaling, highlight a complexregulatory network that is involved in the response todehydration.
Dehydration induces significant changes in ethylenemetabolism transcriptsSimilar to ABA metabolism, massive changes in ethylenemetabolism and signaling were observed. Within plants,small gene families encode multiple ACS and ACOgenes that are known to be regulated differently depend-ing on environmental, developmental, and hormonalsignals [62–64]. In addition to the ACS genes previouslymentioned, others changed significantly in response todehydration (see Additional file 6 for gene annotations).VviACS4 and VviACS8-like increased in expression inboth Cabernet Sauvignon and Riparia Gloire with littleresponse in Ramsey (Fig. 3). Transcript abundance of yetanother, VviACS7, increased most notably in CabernetSauvignon leaves at 1 h of dehydration. Interestingly anegative regulator of ethylene production, ETHYLENEOVERPRODUCER 1 (VviETO1), also increased in ex-pression, particularly in Cabernet Sauvignon and Ramsey
Hopper et al. BMC Plant Biology (2016) 16:118 Page 8 of 20

(Fig. 3). Previously, Yoshida et al. [65] used yeast-twohybrid assays to establish that the Arabidopsis ETO1interacts with AtACS5 and not other ACS proteinssurveyed. There is no clear ortholog to AtACS5 in Vitis;therefore, further investigation is needed.Downstream of ACS, transcripts for ACC oxidase also
displayed a significant change in response to dehydra-tion. In particular, both VviACO4 and another ACO-likegene (VviACOL) increased in Cabernet Sauvignon leavesat 1 h of dehydration. VviACO1 increased notably inRamsey and 2 h and 8 h in Riparia Gloire with littleresponse in Cabernet Sauvignon (Fig. 3).
Dehydration induces significant changes in ethylenesignaling transcriptsA large number of transcripts involved in ethylene sig-naling significantly changed in response to dehydration(Figs. 3 and 4). The transcript abundance of a number ofethylene receptors increased significantly in response todehydration (Fig. 3). Ethylene receptors are broken downinto two subfamilies based on conserved histidine kinasedomains and are localized within the endoplasmicreticulum (for review see [66]). Ethylene receptor 2(VviETR2) increased notably in Cabernet Sauvignon andRiparia Gloire at 1 h of dehydration with Ramseyresponding later during the treatment. Ethylene responsesensor 2 (VviERS2) and VviERS1 followed a similar pat-tern by increasing at 2 h of dehydration in Cabernet
Sauvignon and Ramsey with a later response in RipariaGloire (Fig. 3).Additional transcripts involved in ethylene signaling
were mapped (Fig. 4) using the ATTED-II database as atemplate [67]. The closest Vitis orthologs were deter-mined according to Gramene ([43] release 44 (January2015)). A detailed investigation of all transcripts withinthis ethylene-signaling network is outside the scope ofthis study, however, a few key genes are discussed here.The transcript abundance of a number of WRKY do-
main transcription factors involved in ethylene signalingincreased in response to dehydration (Fig. 4). The tran-script abundance of VviWRKY33 and VviWRKY40 in-creased rapidly within 1 h of dehydration in all genotypes.The transcript abundance of VviWRKY22 also increasedrapidly within 1 h of dehydration in Riparia Gloire, butdecreased at later time points in Ramsey indicating differ-ences in the regulation of this transcription factor (Fig. 4).Recently, WRKY33 has been shown to bind directly to thepromoter of ACS2 and ACS6 to induce gene expressionin Arabidopsis [68]. AP2/ERF transcription factors appearto regulate the expression of WRKY40 [69], further indi-cating cross-talk between the WRKY transcription factorsand ethylene signaling.Within this network, AP2/ERF transcription factors
were also observed to change significantly. For example,the transcript abundance of VviERF6L1 increased at 1 hof dehydration with little response in Riparia Gloire andRamsey (Fig. 4). The transcript abundance of VviERF104
S-Adenosyl-L-methionine (SAM)
1-Aminocyclopropane-1-carboxylate (ACC)
ACC Synthase4.4.1.14
> 2.0> 1.5> 1.0> 0.5
Time Scale (hours)
CabernetRip. G
1 2 4 8 24
< -0.5< -1.0< -1.5< -2.0
Log2 Stress:Control
Ramsey
VviACS4
ACC Oxidase1.14.17.4
Ethylene
VviACO4
VviACS7
VviACS8L
VviERS1VviERS2
VviACO1
VviACOL
Ethylene Receptors
VviETO1
VviETR2
Fig. 3 Transcript abundance of genes involved in ethylene metabolism and signaling. Corresponding Vitis loci ID and ANOVA results for the gene symbolsused in this figure are listed in Additional file 6. Data are presented as heatmaps of mean values of a log2 ratio (Stress:Control), n= 3 at each time point
Hopper et al. BMC Plant Biology (2016) 16:118 Page 9 of 20

also increased at 1 h of dehydration, however, this in-crease was observed in Riparia Gloire and Ramsey withlittle response in Cabernet Sauvignon. Finally, The tran-script abundance of VviERF2 and VviERF1L2 increasedat 1 h of dehydration and remained high throughout theexperiment, notably in Cabernet Sauvignon and RipariaGloire leaves.
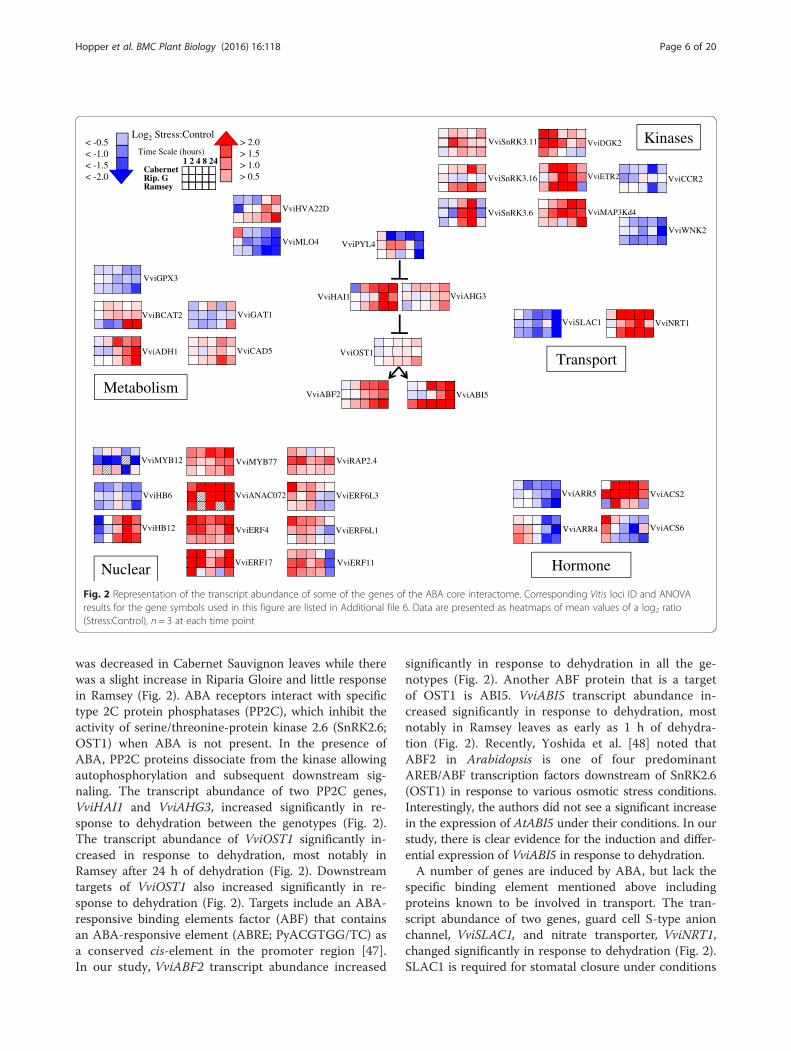
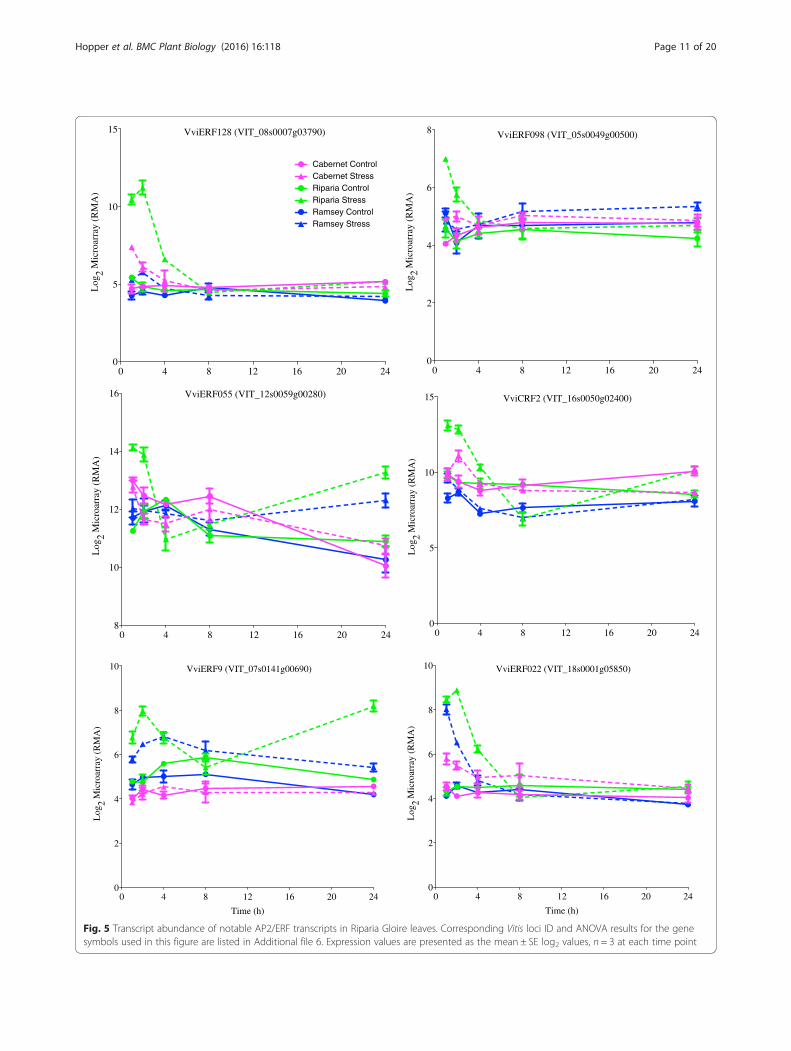
Notable AP2/ERF transcript responses in droughtsensitive Riparia GloireRiparia Gloire leaves are more sensitive to rapid dehy-dration by closing their stomata more quickly comparedto both Cabernet Sauvignon and Ramsey [3]. In thisstudy, multiple AP2/ERF transcription factors increasedin transcript abundance at 1 h in Riparia Gloire with lit-tle or no response in the other genotypes. For example,the transcript abundance of VviERF128 increased rapidlyat 1 h with a slight response in Cabernet Sauvignon andlittle response in Ramsey leaves (Fig. 5). According toCramer et al. [23] this gene does not have a clear
ortholog to Arabidopsis indicating the possibility for aunique function in Vitis. Another AP2/ERF transcriptthat had a similar pattern of expression was VviERF098(Fig. 5). The closest Arabidopsis ortholog AtERF98(At3g23230), increases ascorbic acid (AsA) biosynthesisleading to an increase in salt tolerance [70]. AsA has anumber of roles in plants including as an antioxidant,protecting the plant from reactive oxygen species (ROS),which can result in enhanced tolerance to a variety ofabiotic stresses [71, 72].The transcript abundance of other AP2/ERF trans-
cription factors in Riparia Gloire that increased rapidlyin response to dehydration included VviERF055 andVviERF022 (Fig. 5). Interestingly, VviERF055 is closelyrelated to TRANSLUCENT GREEN (TG), an ERF familytranscription factor in Arabidopsis. TG binds directly tothe promoter of multiple aquaporin genes, and overex-pression results in increased drought tolerance [73].CYTOKININ RESPONSE FACTOR 2 (VviCRF2) is an-other example of an AP2/ERF transcript that increases
VviCM-b
VviHSFA4A
VviZCF37
VviUNK3VviACS6
VviWRKY33
VIT_12s0034g02200
VIT_12s0034g02220
VviERF6L1
> 2.0> 1.5> 1.0> 0.5
Time Scale (hours)
CabernetRip. G
1 2 4 8 24
< -0.5< -1.0< -1.5< -2.0
Log2 Stress:Control
Ramsey
VviRING
VviUNK2
VviHSPRO2VviSZF1VviAR781
VviWRKY40 VviZAT10VviERF104
VQmotif
VviUNK1
VviRAV2
VviEDF1
VviERF2
VviWRKY11
VviWRKY22
VviDUF1645
VviERF1L2
N-tpm
VviMKK9
VviF-Box
Fig. 4 Representation of transcript abundance of some of the genes of the ethylene signaling network generated from ATTED-II database (seemanuscript). Corresponding Vitis loci ID and ANOVA results for the gene symbols used in this figure are listed in Additional file 6. Data are presented asheatmaps of mean values of a log2 ratio (Stress:Control), n = 3 at each time point
Hopper et al. BMC Plant Biology (2016) 16:118 Page 10 of 20
0 4 8 12 16 20 240
5
10
15
Log
2 Mic
roar
ray
(RM
A)
VviERF128 (VIT_08s0007g03790)
Cabernet ControlCabernet StressRiparia ControlRiparia StressRamsey ControlRamsey Stress
0 4 8 12 16 20 248
10
12
14
16
Log
2 Mic
roar
ray
(RM
A)
VviERF055 (VIT_12s0059g00280)
0 4 8 12 16 20 240
2
4
6
8
10
Time (h)
Log
2 Mic
roar
ray
(RM
A)
VviERF9 (VIT_07s0141g00690)
0 4 8 12 16 20 240
2
4
6
8
Log
2 Mic
roar
ray
(RM
A)
VviERF098 (VIT_05s0049g00500)
0 4 8 12 16 20 240
5
10
15L
og2 M
icro
arra
y (R
MA
)VviCRF2 (VIT_16s0050g02400)
0 4 8 12 16 20 240
2
4
6
8
10
Time (h)
Log
2 Mic
roar
ray
(RM
A)
VviERF022 (VIT_18s0001g05850)
Fig. 5 Transcript abundance of notable AP2/ERF transcripts in Riparia Gloire leaves. Corresponding Vitis loci ID and ANOVA results for the genesymbols used in this figure are listed in Additional file 6. Expression values are presented as the mean ± SE log2 values, n = 3 at each time point
Hopper et al. BMC Plant Biology (2016) 16:118 Page 11 of 20

in abundance in Riparia Gloire leaves with little to noresponse in the other genotypes (Fig. 5). The closestArabidopsis ortholog, cytokinin response factor 2 (CRF2,At4g23750), interacts with other CRF proteins withinthe cytokinin signaling pathway [74].The transcript abundance of two negative regulators of
ethylene signaling, VviERF9 and VviERF022, also in-creased rapidly at 1 h of dehydration in Riparia Gloireleaves. VviERF9 belongs to subgroup VIII in the ERFfamily [23, 75], which is known to be involved in tran-scriptional repression [76–78]. In our study, VviERF9expression increased rapidly in Riparia Gloire, to a lesserextent in Ramsey, with no response in Cabernet Sauvi-gnon (Fig. 5). VviERF022 in Riparia Gloire and Ramseyleaves increased in expression at 1 h of dehydration,followed by a decrease at later time points. Little isknown about the function of this gene in Vitis. Nowaket al. [79] demonstrated the importance of AtERF022,the closest ortholog, in somatic embryogenesis in Arabi-dopsis. This study provides direct evidence that ERF022regulates the biosynthesis and signaling of ethylene.These data indicate some unique changes occurred inRiparia Gloire leaves within the AP2/ERF family.Changes in both positive and negative regulators ofethylene signaling also indicate a complex regulatorynetwork requiring further investigation.Together, these data provide further evidence for
changes in the expression of genes involved in bothABA and ethylene metabolism and signaling in responseto dehydration. These changes were also observed to bedifferent between the genotypes surveyed indicating dif-ferent types of transcriptional regulation.
Network analysis: WGCNAWeighted gene coexpression network analysis (WGCNA)was performed to get a better understanding of whichgenes within these complex signaling networks were themost connected hubs. Thirty modules or gene networkswere detected, assigned color names, and correlated togenotype and treatment effects over time (Fig. 6). Allgenes were correlated with these 30 colored modules; thegrey category is not a true module, but a place to put allthe leftover genes not correlated well enough with one ofthe significant colored modules. In addition, a measurecalled the kME (module eigengene-based connectivity)was calculated for each gene to every module (Additionalfile 7). Genes with a kME score of 1 are perfectly positivelycorrelated with that particular module (network) andscores of −1 are perfectly negatively correlated to themodule. The advantage of computing kME scores for eachmodule is that genes can act as a hub in more than onemodule or network. Genes with the highest kME scorehave the most connectivity and are therefore designatedthe largest hubs. The largest hubs were identified along
with the top GO categories overrepresented in each mod-ule (Additional file 8). All top hub genes had kME scoresof 0.92 or higher. Some of the top hub genes in each mod-ule were of unknown function, making them interestingcandidates for future research (Additional files 7 and 8).In contrast to previous GO enrichment analyses done
with Genotype x Treatment or the Genotype x Treat-ment x Time subsets of genes, GO enrichment analysisof the individual modules identified with WGCNA pro-vided much more significant results with more biologicalmeaning. Some of the modules were highly enriched(based upon their p-value) in gene ontologies such asplum2 (translation), firebrick4 (photosynthesis) and yel-low2 (protein amino acid phosphorylation); a few wereless distinct or not significant, such as yellow3, blue, andtan4 (Additional file 8).The most interesting modules were modules (lightsteel-
blue, darkolivegreen, orangered3, and yellow3) becausethey were correlated positively with dehydration andgenotype (Fig. 6). The most interesting module is theyellow3 module, because the heat map for genotypes wasmost highly correlated with the genotype order of droughttolerance: Ramsey > Cabernet Sauvignon > Riparia Gloire,and there was an increase in response to dehydration. Thetop hub gene in the yellow3 module was a gene for anunknown protein with a TPR domain (Additional file 8;Fig. 7). TPR domains are structural motifs that facilitateprotein-protein interactions and assembly of protein com-plexes. There were several other TPR domain proteingenes in the top of this module. These genes are cleartargets for future research due to lack of knowledge ofthese genes in any plant species.The yellow3 module is overrepresented with a significant
but relatively high p-value (1.28 × 10⁻⁴) in gas (oxygen)transport. Basically this means that either this network ofgenes is poorly annotated or there is a general mix of allkinds of gene functions that is not very distinct from theentire genome. Nevertheless, there is a very interestingsubset of hub genes all having kME values above 0.80,including the before mentioned ABA core-signalingtranscription factors, ABF2 and ABI5 (Fig. 7; Additionalfile 7). Other notable hub genes in this module are aSNF1-related protein kinase (VviSnRK1; a central regu-lator of metabolism), a cinnamyl alcohol dehydrogenase(VviCAD; phenylpropanoid metabolism), a β-carotenehydroxylase (VviBCH; carotenoid metabolism), GSDLLipase 1 (VviGLIP1; ethylene signaling) and a universalstress protein (VviUSP; defense). The one gene thatstands out in this group is VviABI5, because of thedifferences displayed in transcript abundance betweenthe genotypes in their response to dehydration withRamsey > Cabernet Sauvignon > Riparia Gloire. Thereare 81 hub genes in this network with a kME higherthan 0.80, indicating a very complex network.
Hopper et al. BMC Plant Biology (2016) 16:118 Page 12 of 20

Module−trait relationships
−1
−0.5
0
0.5
1
Caber
net
Ramse
y
Riparia
Contro
l
Dehyd
ratio
n
Hour1
Hour2
Hour4
Hour8
Hour2
4
MEantiquewhite2
MEindianred4
MEdarkgrey
MElightsteelblue
MEyellow3
MEmediumpurple
MEdarkolivegreen
MEorangered3
MEyellow2
MEhoneydew
MEpaleturquoise
MEdarkseagreen4
MEsienna2
MEplum2
MEdarkmagenta
MEpalevioletred2
MEyellow4
MEcoral3
MEcoral4
MEfirebrick4
MEthistle3
MElightskyblue4
MEslateblue
MEdarkslateblue
MElavenderblush1
MElightyellow
MEblue
MEtan
MEtan4
MElightpink2
MEnavajowhite2
MEgrey
−0.48(3e−06)
0.97(3e−55)
−0.51(5e−07)
−0.055(0.6)
0.055(0.6)
−0.0082(0.9)
−0.079(0.5)
0.048(0.7)
0.012(0.9)
0.03(0.8)
−0.63(5e−11)
0.65(1e−11)
−0.028(0.8)
−0.094(0.4)
0.094(0.4)
−0.27(0.01)
−0.26(0.02)
0.025(0.8)
0.13(0.2)
0.37(3e−04)
−0.62(1e−10)
0.6(9e−10)
0.015(0.9)
−0.51(5e−07)
0.51(5e−07)
−0.21(0.05)
−0.12(0.3)
0.069(0.5)
0.081(0.5)
0.19(0.08)
−0.24(0.02)
−0.1(0.4)
0.34(0.001)
−0.79(2e−19)
0.79(2e−19)
−0.23(0.03)
−0.084(0.4)
0.035(0.7)
0.12(0.3)
0.17(0.1)
0.038(0.7)
0.21(0.05)
−0.25(0.02)
−0.63(7e−11)
0.63(7e−11)
−0.37(5e−04)
−0.22(0.04)
0.056(0.6)
0.2(0.07)
0.34(0.001)
−0.48(3e−06)
0.15(0.2)
0.32(0.003)
−0.42(5e−05)
0.42(5e−05)
0.063(0.6)
0.27(0.01)
0.079(0.5)
−0.22(0.04)
−0.2(0.07)
−0.13(0.2)
−0.11(0.3)
0.24(0.03)
−0.75(3e−17)
0.75(3e−17)
0.33(0.002)
0.11(0.3)
−0.063(0.6)
−0.16(0.1)
−0.22(0.04)
−0.67(8e−13)
0.53(1e−07)
0.13(0.2)
−0.43(3e−05)
0.43(3e−05)
0.26(0.01)
0.05(0.6)
−0.0078(0.9)
−0.083(0.4)
−0.22(0.04)
−0.56(2e−08)
0.062(0.6)
0.49(1e−06)
0.0097(0.9)
−0.0097(0.9)
−0.081(0.5)
−0.22(0.04)
0.15(0.2)
0.13(0.2)
0.026(0.8)
−0.73(1e−15)
−0.16(0.1)
0.88(5e−29)
−0.098(0.4)
0.098(0.4)
0.065(0.6)
0.033(0.8)
−0.081(0.5)
−0.026(0.8)
0.0053(1)
−0.99(4e−72)
0.48(2e−06)
0.49(1e−06)
−0.035(0.7)
0.035(0.7)
−0.054(0.6)
−0.055(0.6)
0.044(0.7)
0.072(0.5)
−0.0035(1)
−0.66(5e−12)
0.041(0.7)
0.61(4e−10)
0.4(1e−04)
−0.4(1e−04)
0.15(0.2)
0.14(0.2)
0.048(0.7)
−0.0063(1)
−0.33(0.002)
−0.71(2e−14)
0.38(3e−04)
0.32(0.002)
0.071(0.5)
−0.071(0.5)
0.14(0.2)
0.022(0.8)
−0.1(0.3)
−0.091(0.4)
0.025(0.8)
0.27(0.01)
0.21(0.05)
−0.48(3e−06)
0.2(0.06)
−0.2(0.06)
−0.31(0.004)
−0.12(0.3)
0.16(0.1)
0.24(0.03)
0.047(0.7)
0.24(0.02)
0.38(3e−04)
−0.62(2e−10)
−0.12(0.3)
0.12(0.3)
−0.26(0.02)
−0.23(0.03)
−0.024(0.8)
0.041(0.7)
0.47(5e−06)
0.48(3e−06)
0.52(3e−07)
−0.99(2e−78)
−0.0033(1)
0.0033(1)
−0.0098(0.9)
−0.036(0.7)
0.029(0.8)
−0.025(0.8)
0.042(0.7)
0.38(3e−04)
0.38(3e−04)
−0.76(8e−18)
0.026(0.8)
−0.026(0.8)
−0.15(0.2)
0.037(0.7)
0.12(0.3)
0.031(0.8)
−0.031(0.8)
−0.47(4e−06)
0.69(2e−13)
−0.23(0.04)
0.18(0.1)
−0.18(0.1)
−0.042(0.7)
0.062(0.6)
0.092(0.4)
0.066(0.5)
−0.17(0.1)
−0.053(0.6)
0.095(0.4)
−0.043(0.7)
0.33(0.002)
−0.33(0.002)
−0.25(0.02)
−0.096(0.4)
0.2(0.07)
0.13(0.2)
0.028(0.8)
0.36(7e−04)
−0.071(0.5)
−0.28(0.008)
0.67(2e−12)
−0.67(2e−12)
0.26(0.01)
0.16(0.1)
0.027(0.8)
−0.096(0.4)
−0.35(9e−04)
0.34(0.001)
−0.32(0.003)
−0.018(0.9)
0.29(0.007)
−0.29(0.007)
−0.076(0.5)
0.18(0.1)
0.17(0.1)
−0.012(0.9)
−0.25(0.02)
−0.26(0.01)
0.024(0.8)
0.24(0.03)
−0.15(0.2)
0.15(0.2)
−0.005(1)
0.027(0.8)
−0.25(0.02)
−0.15(0.2)
0.36(5e−04)
0.48(2e−06)
−0.29(0.007)
−0.19(0.09)
0.025(0.8)
−0.025(0.8)
0.21(0.05)
0.31(0.003)
−0.24(0.02)
−0.36(7e−04)
0.059(0.6)
−0.12(0.3)
−0.49(2e−06)
0.61(5e−10)
0.26(0.02)
−0.26(0.02)
0.014(0.9)
−0.035(0.7)
0.008(0.9)
0.31(0.003)
−0.29(0.006)
−0.24(0.03)
−0.2(0.06)
0.44(2e−05)
0.097(0.4)
−0.097(0.4)
−0.33(0.002)
−0.22(0.04)
0.15(0.2)
0.58(4e−09)
−0.16(0.1)
0.063(0.6)
−0.81(2e−21)
0.75(4e−17)
−0.025(0.8)
0.025(0.8)
0.14(0.2)
0.083(0.4)
−0.11(0.3)
−0.1(0.3)
−0.011(0.9)
0.54(8e−08)
−0.68(7e−13)
0.15(0.2)
0.047(0.7)
−0.047(0.7)
0.31(0.004)
0.24(0.03)
−0.17(0.1)
−0.18(0.1)
−0.21(0.05)
0.69(9e−14)
−0.86(9e−27)
0.18(0.09)
0.25(0.02)
−0.25(0.02)
0.12(0.3)
0.056(0.6)
−0.037(0.7)
1.4e−06(1)
−0.14(0.2)
0.48(3e−06)
−0.68(4e−13)
0.21(0.05)
−0.52(2e−07)
0.52(2e−07)
−0.14(0.2)
−0.087(0.4)
0.051(0.6)
0.092(0.4)
0.093(0.4)
0.7(6e−14)
−0.54(9e−08)
−0.15(0.2)
−0.25(0.02)
0.25(0.02)
−0.25(0.02)
−0.15(0.2)
0.046(0.7)
0.12(0.3)
0.23(0.03)
0.98(1e−63)
−0.45(1e−05)
−0.52(3e−07)
0.12(0.3)
−0.12(0.3)
0.034(0.8)
0.004(1)
−0.024(0.8)
−0.048(0.7)
0.032(0.8)
0.13(0.2)
−0.31(0.003)
0.18(0.09)
0.26(0.01)
−0.26(0.01)
0.27(0.01)
0.29(0.006)
0.092(0.4)
−0.08(0.5)
−0.58(5e−09)
Fig. 6 Heatmap of the correlation of WGCNA modules with treatments (traits)
Hopper et al. BMC Plant Biology (2016) 16:118 Page 13 of 20

0 4 8 12 16 20 248
10
12
14
16
Log
2 M
icro
arra
y (R
MA
)
VviTPRUnknown (VIT_10s0071g00840)
Cabernet Control
Cabernet Stress
Riparia Control
Riparia StressRamsey Control
Ramsey Stress
0 4 8 12 16 20 246
8
10
12
14
16
Log
2 M
icro
arra
y (R
MA
)
VviUSP (VIT_14s0060g01300)
0 4 8 12 16 20 2412
13
14
15
16
Log
2 M
icro
arra
y (R
MA
)
VviCAD (VIT_03s0180g00260)
0 4 8 12 16 20 240
5
10
15
Time (hours)
Log
2 M
icro
arra
y (R
MA
)
VviABI5 (VIT_08s0007g03420)
0 4 8 12 16 20 240
5
10
15
Log
2 M
icro
arra
y (R
MA
)
0 4 8 12 16 20 2412
13
14
15
16
17
Log
2 M
icro
arra
y (R
MA
)
VviABF2 (VIT_18s0001g10450)
0 4 8 12 16 20 240
5
10
15
Log
2 M
icro
arra
y (R
MA
)
VviGDSL1 (VIT_09s0002g00540)
0 4 8 12 16 20 248
10
12
14
16
18
Time (hours)
Log
2 M
icro
arra
y (R
MA
)
VviSnRK1 (VIT_17s0000g01460)
Fig. 7 Transcript abundance of some of the top gene hubs in the yellow3 module. Expression values are presented as the mean ± SE of the log2values, n = 3 at each time point
Hopper et al. BMC Plant Biology (2016) 16:118 Page 14 of 20

The other very interesting module is the lightsteelbluemodule (Additional file 7). A number of the genes withhigh kMEs in the yellow3 module also have high kMEs inthe lightsteelblue module, including VviABI5, VviABF2,VviSnRK1, some wound-inducible genes, and genes en-coding late-embryogenesis abundant (LEA) proteins ordehydrins. This module is significantly enriched in theethylene signaling GO category. The top hub gene is anunknown gene, whose ortholog in Arabidopsis is inducedby Al (Fig. 8; Additional files 7 and 8). Other top hubgenes with similar but slightly different expression pat-terns are Gibberellin Insensitive Dwarf 1B (VviGID1B; agibberellin receptor), an uncharacterized VviMYB, RAS-related Nuclear Protein (VviRAN1; GTPase signaling),VviERF1 (ethylene signaling), VviNCED3 (ABA biosyn-thesis), and Indeterminate Domain 2 (VviIDD2; a C2H2-type zinc finger protein). Interestingly, VviERF1, which isat the start of the ERF transcription factor cascade is morehighly expressed in Riparia Gloire in response to dehydra-tion (Fig. 8). Thus there is a clear overlap in ABA andethylene signaling hubs in these two modules, which sup-ports the argument that there is strong crosstalk betweenthese two hormone signaling pathways.Top hub genes from other modules with high GO en-
richment categories such as translation, photosynthesis,phenylpropanoid metabolism were less interesting becausethe transcripts in these sets were less correlated withdrought tolerance, and therefore will not be discussed fur-ther. We have only just scratched the surface of the ana-lyses of these data. This dataset (Additional file 7) is verydeep and can be exploited for years to come. Many otherfascinating networks are present within this dataset butthere is not enough space and time to describe them here.
DiscussionThere are thousands of different grapevine genotypes lead-ing to a large pool of natural genetic diversity [80, 81]. Thephylloxera devastation of the European wine industry dur-ing the 19th century resulted in the introduction of NorthAmerican genotypes as rootstocks for biotic and abioticstress resistance [6]. With global climate change, a betterunderstanding of the genes involved in drought tolerancewill be needed. Previous work by Padgett-Johnson et al.[12] clearly showed differences in water-use-efficiencybetween different genotypes of grapevine in the field.However, studies like this require multiple years for theestablishment of an experimental vineyard.
The strengths and weaknesses of the rapid dehydration assayTo complement previous field studies, Hopper et al. [3]developed a rapid dehydration assay that is amenable tolarge-scale phenotyping studies. The assay takes only afew hours and can precisely control the level of dehydra-tion. It is simple, not requiring expensive or sophisticated
equipment. It can be done at any time of the year as longas plant material is available, such as from a greenhouse.The results from the rapid dehydration assay are consist-ent with field assays, indicating that it is a suitable assayfor evaluating dehydration tolerance. This assay is excel-lent as a first screen for genetic tendencies.The screen only reflects the inherent tendencies of a
leaf. The leaf is isolated from the rest of the plant andcannot sense signals from other parts of the plant. Forexample, in an earlier study, massive changes in proteinswere detected in Cabernet Sauvignon shoots that hadbeen gradually dehydrated [82]. These changes occurredbefore any photosynthetic or growth symptoms indicat-ing that the shoot detected a feed-forward signal fromanother part of the plant, such as the roots.This rapid dehydration assay by its nature cannot look
at the more gradual changes that occur in a plant in amore natural setting. Nevertheless, it was able to detectdifferences between genotypes that are reflective of theirbehavior in the field.
Sensitivity and timing of stress responsesOne of the strengths of our transcriptomic approach inthis study was the collection of samples along a detailedtime course. This allowed detection of genotype sensitiv-ity to dehydration. Sensitivity could reflect sensitivity toinjury and thus indicate a stress-sensitive (dehydrationsensitive) plant or it could indicate a plant with height-ened awareness of impending drought, giving it more timeto respond and thus fostering dehydration resistance. Theuse of genotypes differing in their drought toleranceallowed us to distinguish between these sensitivities. ABAsignaling appears to be key in this response with thedrought tolerant genotype, Ramsey, showing heightenedresponses in ABA signaling and decreased responses inethylene signaling relative to the drought sensitive geno-type, Riparia Gloire, which showed slower responses inABA signaling and heightened responses in ethylene sig-naling. The intermediate genotype, Cabernet Sauvignon,was consistent with these responses, being intermediate inboth ABA and ethylene signaling.
The importance of ABA and ethylene responses todehydrationABA is a major plant hormone involved in plant responsesto dehydration. Significant differences in transcript abun-dance of genes involved in ABA metabolism and signalingwere observed between the genotypes. Previously, Hopperet al. [3] found that application of ABA to leaves prior todehydration decreased the overall amount and rate ofwater lost. Differences between the genotypes in their sto-matal conductance after application at various concentra-tions of ABA also indicate differences in ABA sensitivity.Differences observed in water loss are presumably through
Hopper et al. BMC Plant Biology (2016) 16:118 Page 15 of 20

0 4 8 12 16 20 240
5
10
15
Log
2 M
icro
arra
y (R
MA
)
VviHub Unknown Protein (VIT_19s0014g03130)
Cabernet Control
Cabernet Stress
Riparia Control
Riparia StressRamsey Control
Ramsey Stress
0 4 8 12 16 20 240
5
10
15
Log
2 M
icro
arra
y (R
MA
)
VviMYB (VIT_06s0080g00790)
0 4 8 12 16 20 2411
12
13
14
15
16
Log
2 M
icro
arra
y (R
MA
)
VviRAN1 (VIT_01s0011g01360)
0 4 8 12 16 20 2410
12
14
16
18
Time (hours)
Log
2 M
icro
arra
y (R
MA
)
VviNCED3 (VIT_19s0093g00550)
0 4 8 12 16 20 2411
12
13
14
15
16
17
Log
2 M
icro
arra
y (R
MA
)
VviGID1B (VIT_07s0104g00930)
0 4 8 12 16 20 2410
11
12
13
14
15
16
Log
2 M
icro
arra
y (R
MA
)
VviSTP3 (VIT_16s0013g01950)
0 4 8 12 16 20 240
5
10
15
Log
2 M
icro
arra
y (R
MA
)
VviERF1 (VIT_05s0049g00510)
0 4 8 12 16 20 2411
12
13
14
15
16
Time (hours)
Log
2 M
icro
arra
y (R
MA
)
VviIDD2 (VIT_04s0023g01430)
Fig. 8 Transcript abundance of some of the top gene hubs in the lightsteelblue module. Expression values are presented as the mean ± SE log2values, n = 3 at each time point
Hopper et al. BMC Plant Biology (2016) 16:118 Page 16 of 20

differences in stomatal conductance and regulation ofgene transcription, protein synthesis and other signalingpathways (for review see [83]).Based on both the standard and network analysis ap-
proaches, significant changes in the transcript abundanceof genes involved in ABA metabolism and signaling wereobserved (Figs. 2 and 3). For example, the transcript abun-dance of the three NCED genes in Vitis that catalyze therate-limiting step in ABA biosynthesis increased in re-sponse to dehydration. Interestingly, VviNCED6, is in-creased in both Riparia Gloire and Ramsey with a differentresponse in Cabernet Sauvignon. This indicates differencesin the regulation of these key genes to dehydration. Re-cently, Lumba et al. [42] created an ABA interactomeusing a systems biology approach. Utilizing transcriptomicand proteomic data, these authors were able to create adetailed interactome with over 500 interactions, highlight-ing the complexity of ABA signaling. Studies like this alsohighlight the need and utility for transcriptomic data suchas in the study presented here. Our study provides furtherevidence for differences in ABA metabolism and signalingat the transcript level that may be involved in dehydrationadjustment for the Vitis genotypes.Key candidate factors appear to be the transcription fac-
tors, ABI5 and ABF2, at the start of the ABA transcrip-tional signaling pathway. In particular, the transcriptionalresponse of VviABI5 to dehydration in Ramsey was moresensitive than Cabernet Sauvignon, which was more sensi-tive than Riparia Gloire. This makes it a good target forfuture research.ABI5 was first cloned in Arabidopsis [84]. Its expres-
sion is highest in seeds, but a low level of expression isobserved in vegetative tissues. The expression of someAtLEA genes is dependent upon AtABI5 expression inArabidopsis. Note that there were several VviLEA geneswithin the top kMEs (>0.80) in the yellow3 module(Additional file 7). ABI5 expression is largely associatedwith seed development and not vegetative organs or tis-sues [85]. However recent evidence has linked ABI5 tovegetative functions such as the induction of flowering[86], leaf senescence [87], drought tolerance [88], andstomatal movement [89]. With these exciting new find-ings, it is necessary to focus more research on the func-tion of ABI5 in grapevine vegetative organs.The SnRK1 γ-subunit, another hub in the yellow3
module is a part of the SnRK1 complex that is a centralregulator of metabolism. SnRK1 responds to sugar andABA signaling [90]. PP2Cs (ABI1 and AHG3) directlydephosphorylate the SnRK1 α-subunit [91]; thus, the in-hibition of PP2C activity by ABA directly stimulatesSnRK1 expression and activity, complementing the stressresponse through energy regulation and coordination.Ethylene is another plant hormone involved in dehydra-
tion stress signaling (for review see [76]). The ethylene
response may reflect dehydration adjustment, damagecontrol or senescence. The ERF domain of ERF transcrip-tion factors contains 60 to 70 conserved amino acids andwas first identified in four DNA binding proteins NtERF1-4 from Nicotiana tabacum [92]. Group I ERF transcrip-tion factors have previously been shown to be importantin mediating drought tolerance in plants [93–95]. VviERF1had a high kME in the lightsteelblue module, which wassignificantly enriched in ethylene signaling gene ontol-ogies. The closest orthologs to VviRAP2.4 and VviERF055belong to Group I in Arabidopsis [23] and were both up-regulated in response to dehydration, most notably inRiparia Gloire leaves (Figs. 2 and 5).ERF5 and ERF6 are also important transcription fac-
tors involved in drought signaling and have been calledthe “master regulators” in leaf growth in response to en-vironmental changes [58]. In Cabernet Sauvignon leaves,a number of VviERF6-like transcription factors increasedin response to dehydration (Fig. 2). A similar trend inthe expression of VviERF6-like genes was seen as sugar(°Brix) levels increased within the skins of ripening Cab-ernet Sauvignon berries [23]. This may indicate a similarlevel of regulation of these genes in response to dehydra-tion, ripening or other stress responses.Similar to ABA, transcripts involved in ethylene me-
tabolism and signaling also changed significantly in re-sponse to dehydration (Figs. 3 and 4). A number oftranscripts were observed to be changing significantlybased on the Genotype x Treatment and Genotype xTreatment x Time interaction terms indicating a differ-ent response between the genotypes in response to dehy-dration and over time.There is substantial evidence that there is crosstalk
between ABA and ethylene in response to dehydration[88, 96]. Overexpression of an ethylene responsive tran-scription factor RAV2 along with the ABA-responsetranscription factor ABI5 had synergistic effects ondrought tolerance in cotton [88]. Interestingly, VviRAV2has a high kME (0.81) in the lightsteelblue module alongwith VviABI5 (Additional file 7). Lumba et al. [42] pro-vide evidence for hormonal crosstalk with a number ofgenes involved in ethylene metabolism and signalingwithin the ABA core network. For example, ACS cata-lyzes the rate-limiting step in ethylene biosynthesis andACS6 in Arabidopsis is regulated by ABA Insensitive 1(ABI1), a negative regulator of ABA signaling [97]. Mul-tiple ACS genes in Vitis changed significantly betweenthe genotypes in response to dehydration (Figs. 2 and 3).
ConclusionIn summary, the leaf dehydration time-series assayallowed the detection of a very large number of transcrip-tional changes in a coordinated fashion. Key genes wereidentified by a standard a posteriori analysis that involved
Hopper et al. BMC Plant Biology (2016) 16:118 Page 17 of 20

mapping known biochemical pathways in leaves respond-ing to dehydration (e.g. ABA and ethylene metabolismand signaling pathways). An a priori data analysis ap-proach using WGCNA proved more powerful; it con-firmed the results from the standard approach and itidentified 30 distinct modules (networks), most of whichhad highly enriched GO categories that were biologicallyand functionally relevant. In addition, WGCNA enabledthe identification of gene hubs in these modules that arelikely to be important and significant operators withinthese networks.The results from this study confirmed our hypothesis
that ABA signaling pathways were different between thegrapevine genotypes. Furthermore, the results indicatethat the dehydration response had substantial cross-talkbetween the ABA and ethylene signaling pathways. Someof the genes in the ABA and ethylene signaling pathwayswere highly connected hubs and were correlated withdrought tolerance. A number of interesting unknowngenes were also identified and associated with these path-ways. VviABI5 is one of the best candidate hubs fordrought tolerance because its expression was more rapidand higher in the drought tolerance genotypes and be-cause of its known functions in ABA signaling anddrought tolerance. The facts that this gene is normallyassociated with seed dormancy, that the transcript abun-dance of VviABI5 in leaves increased significantly in aspecies (Vitis champinii) that has evolved in a hot and dryclimate, and did not respond substantially in the leaves ofa species (Vitis riparia) that has evolved in a cooler andwetter climate, make this gene particularly interesting.This study provides a very rich data set that can be
further explored for new discoveries. Only the tip ofthis data “iceberg” has been discussed here. Futureresearch will focus on the further elucidation of theregulation of these gene networks and on gradualresponses of the root to dehydration, since multiplelines of evidence indicate it may act as the initialsensor for drought stress signaling.
Additional files
Additional file 1: Principal component analysis (PCA) of expression data.Symbol names refer to genotype (Ram = Ramsey, Rip = Riparia andCS = Cabernet Sauvignon); the following number is the time in hours(1, 2, 4, 8, and 24), then there is a separating “.”, followed by thetreatment (C = control, S = stress or dehydration), and the finalnumber refers to the sample replicate number. (PDF 19 kb)
Additional file 2: WGCNA sample dendrogram and trait heatmap ofexpression data. (PDF 29 kb)
Additional file 3: Annotation, transcript abundance values, and statistics ofall genes on the NimbleGen Grape Whole-Genome microarray. (XLSX 20763 kb)
Additional file 4: Overrepresented GO categories of all significantlychanging transcripts in response to Genotype x Treatment interaction.(XLSX 192 kb)
Additional file 5: Overrepresented GO Categories of all significantlychanging transcripts with the Genotype x Treatment x Time interaction.(XLSX 130 kb)
Additional file 6: Updated annotation of genes involved in ABAmetabolism and signaling, ethylene metabolism and signaling, andtranscription factors including those in Figs. 1, 2, 3 and 4. (XLS 285 kb)
Additional file 7: kME values of all transcripts in each of the genemodules determined by WGCNA. (XLSX 15417 kb)
Additional file 8: Summary table of WGCNA modules including tophub genes and gene ontologies. (XLSX 50 kb)
AcknowledgementsThis material is based upon work that is supported by the National Instituteof Food and Agriculture, U.S. Department of Agriculture, Hatch Grant(NEV00345) and was supported by a grant from the National Institute ofGeneral Medical Sciences (P20GM103440).
Availability of supporting dataAll microarray expression data are available at Gene Expression Omnibus(GEO) database [98] with the accession number GSE78920. This array hasbeen validated multiple times using qPCR [22–24].
Authors’ contributionsDWH designed and conducted the experiments, analyzed the data and wrotethe body of the paper; RG helped in the data analysis; KAS performed statisticalanalysis; GRC acquired the funding and supervised all aspects of the project. Allauthors reviewed, edited and approved the final version of the manuscript.
Competing interestsThe authors declare that they have no competing interests.
Consent to publishNot applicable.
EthicsNot applicable.
Received: 2 November 2015 Accepted: 17 May 2016
References1. Boyer JS. Plant productivity and environment. Science. 1982;218(4571):443–8.2. Cramer GR, Urano K, Delrot S, Pezzotti M, Shinozaki K. Effects of abiotic
stress on plants: a systems biology perspective. BMC Plant Biol. 2011;11:163.3. Hopper DW, Ghan R, Cramer GR. A rapid dehydration leaf assay reveals
stomatal response differences in grapevine genotypes. Hortic Res. 2014;1:2.4. Hannah L, Roehrdanz PR, Ikegami M, Shepard AV, Shaw MR, Tabor G, Zhi L,
Marquet PA, Hijmans RJ. Climate change, wine, and conservation. Proc NatlAcad Sci U S A. 2013;110(17):6907–12.
5. van Leeuwen C, Schultz HR, Garcia de Cortazar-Atauri I, Duchene E, Ollat N,Pieri P, Pieri P, Bois B, Goutouly JP, Quenol H, Touzard JM et al. Why climatechange will not dramatically decrease viticultural suitability in main wine-producing areas by. Proc Natl Acad Sci U S A 2013. 2050;110(33):E3051–3052.
6. Lowe KM, Walker MA. Genetic linkage map of the interspecific grape rootstockcross Ramsey (Vitis champinii) x Riparia Gloire (Vitis riparia). Theor Appl Genet.2006;112(8):1582–92.
7. Marguerit E, Brendel O, Lebon E, Van Leeuwen C, Ollat N. Rootstock controlof scion transpiration and its acclimation to water deficit are controlled bydifferent genes. New Phytol. 2012;194(2):416–29.
8. Gambetta GA, Manuck CM, Drucker ST, Shaghasi T, Fort K, Matthews MA,Walker MA, McElrone AJ. The relationship between root hydraulics andscion vigour across Vitis rootstocks: what role do root aquaporins play?J Exp Bot. 2012;63(18):6445–55.
9. Candolfi-Vasconcelos MC, Candolfi MP, Kohlet W. Retranslocation of carbonreserves from the woody storage tissues into the fruit as a response todefoliation stress during the ripening period in Vitis vinifera L. Planta.1994;192(4):567–73.
Hopper et al. BMC Plant Biology (2016) 16:118 Page 18 of 20

10. Padgett-Johnson M, Williams LE, Walker MA. The influence of Vitis ripariarootstock on water relations and gas Exchange of Vitis vinifera cv. Carignanescion under non-irrigated conditions. Am J Enol Vitic. 2000;51(2):137–43.
11. Soar CJ, Dry PR, Loveys BR. Scion photosynthesis and leaf gas exchange inVitis vinifera L. cv. Shiraz: Mediation of rootstock effects via xylem sap ABA.Aust J Grape Wine Res. 2006;12(2):82–96.
12. Padgett-Johnson M, Williams LE, Walker MA. Vine water relations, gasexchange, and vegetative growth of seventeen vitis species grown underirrigated and nonirrigated conditions in California. J Amer Soc Hort Sci.2003;128(2):269–76.
13. Dong J, Horvath S. Understanding network concepts in modules. BMC SystBiol. 2007;1:24.
14. Langfelder P, Horvath S. Eigengene networks for studying the relationshipsbetween co-expression modules. BMC Syst Biol. 2007;1:54.
15. Langfelder P, Horvath S. WGCNA: an R package for weighted correlationnetwork analysis. BMC Bioinformatics. 2008;9:559.
16. Song L, Langfelder P, Horvath S. Comparison of co-expression measures:mutual information, correlation, and model based indices. BMCBioinformatics. 2012;13:328.
17. Goda H, Sasaki E, Akiyama K, Maruyama-Nakashita A, Nakabayashi K, Li W,Ogawa M, Yamauchi Y, Preston J, Aoki K et al. The AtGenExpress hormoneand chemical treatment data set: experimental design, data evaluation,model data analysis and data access. Plant J. 2008;55(3):526–42.
18. Retsch: Solutions in Milling and Sieving. [http://www.retsch.com/]19. Gambino G, Perrone I, Gribaudo I. A rapid and effective method for RNA
extraction from different tissues of grapevine and other woody plants.Phytochem Anal. 2008;19(6):520–5.
20. Tattersall EAR, Ergul A, AlKayal F, Deluc L, Cushman JC, Cramer GR. Comparisonof methods for isolating high-quality RNA from leaves of grapevine. Am J EnolVitic. 2005;56:400–6.
21. Qiagen. [http://www.qiagen.com/]22. Rattanakon S, Ghan R, Gambetta G, Deluc L, Schlauch KA, Cramer GR.
Transcriptomic analysis reveals that abscisic acid signaling differs in differentorgans of grapevine (Vitis vinifera L.). BMC Plant Biol 2016. (in press).
23. Cramer GR, Ghan R, Schlauch KA, Tillett RL, Heymann H, Ferrarini A, DelledonneM, Zenoni S, Fasoli M, Pezzotti M. Transcriptomic analysis of the late stages ofgrapevine (Vitis vinifera cv. Cabernet Sauvignon) berry ripening revealssignificant induction of ethylene signaling and flavor pathways in the skin.BMC Plant Biol. 2014;14(1):370.
24. Ghan R, Van Sluyter SC, Hochberg U, Degu A, Hopper DW, Tillet RL, SchlauchKA, Haynes PA, Fait A, Cramer GR. Five omic technologies are concordant indifferentiating the biochemical characteristics of the berries of five grapevine(Vitis vinifera L.) cultivars. BMC Genomics. 2015;16(1):946.
25. Sokal R, Rohlf F. Biometry: the principles and practice of statistics inbiological research. 3rd ed. New York: W.H.Freeman; 1995.
26. Benjamini Y, Hochberg Y. Controlling the false discovery rate: a practicaland powerful approach to multiple testing. J Royal Stat Soc: Series B (StatMethodol). 1995;57:289–300.
27. Knudsen S. Guide to analysis of DNA microarray data. 2nd ed. New York:John Wiley & Sons; 2004.
28. Baldi P, Hatfield GW. DNA microarrays and gene expression: fromexperiments to data analysis and modeling. Cambridge: CambridgeUniversity Press; 2002.
29. Gordon AD. Classification. Boca Raton: Chapman & Hall/CRC; 1999.30. Stekel D. Microarray bioinformatics. Cambridge: Cambridge University
Press; 2003.31. Maere S, Heymans K, Kuiper M. BiNGO: a Cytoscape plugin to assess
overrepresentation of gene ontology categories in biological networks.Bioinformatics. 2005;21(16):3448–9.
32. Shannon P, Markiel A, Ozier O, Baliga NS, Wang JT, Ramage D, AminN, Schwikowski B, Ideker T. Cytoscape: a software environment forintegrated models of biomolecular interaction networks. Genome Res.2003;13(11):2498–504.
33. Kinsella RJ, Kahari A, Haider S, Zamora J, Proctor G, Spudich G, Almeida-KingJ, Staines D, Derwent P, Kerhornou A et al. Ensembl BioMarts: a hub for dataretrieval across taxonomic space. Database (Oxford). 2011;2011:bar030.
34. Schwartz SH, Qin X, Zeevaart JA. Elucidation of the indirect pathway ofabscisic acid biosynthesis by mutants, genes, and enzymes. Plant Physiol.2003;131(4):1591–601.
35. Endo A, Sawada Y, Takahashi H, Okamoto M, Ikegami K, Koiwai H, Seo M,Toyomasu T, Mitsuhashi W, Shinozaki K et al. Drought induction of
Arabidopsis 9-cis-epoxycarotenoid dioxygenase occurs in vascularparenchyma cells. Plant Physiol. 2008;147(4):1984–93.
36. Grimplet J, Adam-Blondon AF, Bert PF, Bitz O, Cantu D, Davies C, Delrot S,Pezzotti M, Rombauts S, Cramer GR. The grapevine gene nomenclaturesystem. BMC Genomics. 2014;15:1077.
37. Burla B, Pfrunder S, Nagy R, Francisco RM, Lee Y, Martinoia E. Vacuolar transportof abscisic acid glucosyl ester is mediated by ATP-binding cassette andproton-antiport mechanisms in Arabidopsis. Plant Physiol. 2013;163(3):1446–58.
38. Zhang G, Duan C, Wang Y, Wang Y, Ji K, Xu H, Dai S, Li Q, Chen P, Sun Y et al.The expression pattern of β-glucosidase genes (VvBGs) during grape berrymaturation and dehydration stress. Plant Growth Regul. 2012;70(2):105–14.
39. Kuromori T, Miyaji T, Yabuuchi H, Shimizu H, Sugimoto E, Kamiya A, MoriyamaY, Shinozaki K. ABC transporter AtABCG25 is involved in abscisic acid transportand responses. Proc Natl Acad Sci U S A. 2010;107(5):2361–6.
40. Kuromori T, Sugimoto E, Shinozaki K. Intertissue signal transfer of abscisicacid from vascular cells to guard cells. Plant Physiol. 2014;164(4):1587–92.
41. Kuromori T, Shinozaki K. ABA transport factors found in Arabidopsis ABCtransporters. Plant Signal Behav. 2010;5(9):1124–6.
42. Lumba S, Toh S, Handfield LF, Swan M, Liu R, Youn JY, Cutler SR, Subramaniam R,Provart N, Moses A et al. A mesoscale abscisic acid hormone interactome revealsa dynamic signaling landscape in Arabidopsis. Dev Cell. 2014;29(3):360–72.
43. Ware DH, Jaiswal P, Ni J, Yap IV, Pan X, Clark KY, Teytelman L, Schmidt SC,Zhao W, Chang K et al. Gramene, a tool for grass genomics. Plant Physiol.2002;130(4):1606–13.
44. Ma Y, Szostkiewicz I, Korte A, Moes D, Yang Y, Christmann A, Grill E. Regulatorsof PP2C phosphatase activity function as abscisic acid sensors. Science. 2009;324(5930):1064–8.
45. Park SY, Fung P, Nishimura N, Jensen DR, Fujii H, Zhao Y, Lumba S, SantiagoJ, Rodrigues A, Chow TF et al. Abscisic acid inhibits type 2C proteinphosphatases via the PYR/PYL family of START proteins. Science.2009;324(5930):1068–71.
46. Pandey S, Nelson DC, Assmann SM. Two novel GPCR-type G proteins areabscisic acid receptors in Arabidopsis. Cell. 2009;136(1):136–48.
47. Hauser F, Waadt R, Schroeder JI. Evolution of abscisic acid synthesis andsignaling mechanisms. Curr Biol. 2011;21(9):R346–355.
48. Yoshida T, Fujita Y, Maruyama K, Mogami J, Todaka D, Shinozaki K, Yamaguchi-Shinozaki K. Four Arabidopsis AREB/ABF transcription factors functionpredominantly in gene expression downstream of SnRK2 kinases inabscisic acid signalling in response to osmotic stress. Plant Cell Environ.2015;38(1):35–49.
49. Vahisalu T, Kollist H, Wang Y-F, Nishimura N, Chan W-Y, Valerio G,Lamminmäki A, Brosché M, Moldau H, Desikan R et al. SLAC1 is required forplant guard cell S-type anion channel function in stomatal signalling.Nature. 2008;452(7186):487–91.
50. Liu KH, Tsay YF. Switching between the two action modes of the dual-affinitynitrate transporter CHL1 by phosphorylation. EMBO J. 2003;22(5):1005–13.
51. Yamasaki H, Sakihama Y. Simultaneous production of nitric oxide andperoxynitrite by plant nitrate reductase: in vitro evidence for theNR-dependent formation of active nitrogen species. FEBS Lett.2000;468(1):89–92.
52. Coello P, Hey SJ, Halford NG. The sucrose non-fermenting-1-related (SnRK)family of protein kinases: potential for manipulation to improve stresstolerance and increase yield. J Exp Bot. 2011;62(3):883–93.
53. Arisz SA, Testerink C, Munnik T. Plant PA signaling via diacylglycerol kinase.Biochim Biophys Acta. 2009;1791(9):869–75.
54. Stracke R, Ishihara H, Huep G, Barsch A, Mehrtens F, Niehaus K, Weisshaar B.Differential regulation of closely related R2R3-MYB transcription factorscontrols flavonol accumulation in different parts of the Arabidopsis thalianaseedling. Plant J. 2007;50(4):660–77.
55. Nakabayashi R, Yonekura-Sakakibara K, Urano K, Suzuki M, Yamada Y,Nishizawa T, Nishizawa T, Matsuda F, Kojima M, Sakakibara H, Shinozaki K etal. Enhancement of oxidative and drought tolerance in Arabidopsis byoveraccumulation of antioxidant flavonoids. Plant J. 2014;77(3):367–79.
56. Ding Y, Liu N, Virlouvet L, Riethoven JJ, Fromm M, Avramova Z. Four distincttypes of dehydration stress memory genes in Arabidopsis thaliana. BMCPlant Biol. 2013;13:229.
57. Licausi F, Ohme-Takagi M, Perata P. APETALA2/Ethylene Responsive Factor(AP2/ERF) transcription factors: mediators of stress responses anddevelopmental programs. New Phytol. 2013;199(3):639–49.
58. Dubois M, Skirycz A, Claeys H, Maleux K, Dhondt S, De Bodt S, VandenBossche R, De Milde L, Yoshizumi T, Matsui M et al. Ethylene Response
Hopper et al. BMC Plant Biology (2016) 16:118 Page 19 of 20

Factor6 acts as a central regulator of leaf growth under water-limitingconditions in Arabidopsis. Plant Physiol. 2013;162(1):319–32.
59. Kurepa J, Li Y, Smalle JA. Proteasome-dependent proteolysis has a criticalrole in fine-tuning the feedback inhibition of cytokinin signaling. PlantSignal Behav. 2013;8(3):e23474.
60. Mira-Rodado V, Veerabagu M, Witthoft J, Teply J, Harter K, Desikan R.Identification of two-component system elements downstream of AHK5in the stomatal closure response of Arabidopsis thaliana. Plant SignalBehav. 2012;7(11):1467–76.
61. Yang SF, Hoffman NE. Ethylene biosynthesis and its regulation in higherplants. Annu Rev Plant Physiol. 1984;35:155–89.
62. Rottmann WH, Peter GF, Oeller PW, Keller JA, Shen NF, Nagy BP, Taylor LP,Campbell AD, Theologis A. 1-Aminocyclopropane-1-carboxylate synthase intomato is encoded by a multigene family whose transcription is inducedduring fruit and floral senescence. J Mol Biol. 1991;222(4):937–61.
63. El-Sharkawy I, Kim WS, Jayasankar S, Svircev AM, Brown DC. Differentialregulation of four members of the ACC synthase gene family in plum.J Exp Bot. 2008;59(8):2009–27.
64. Van de Poel B, Van Der Straeten D. 1-aminocyclopropane-1-carboxylic acid(ACC) in plants: more than just the precursor of ethylene! Front Plant Sci.2014;5:640.
65. Yoshida H, Nagata M, Saito K, Wang KL, Ecker JR. Arabidopsis ETO1 specificallyinteracts with and negatively regulates type 2 1-aminocyclopropane-1-carboxylatesynthases. BMC Plant Biol. 2005;5:14.
66. Gallie DR. Appearance and elaboration of the ethylene receptor familyduring land plant evolution. Plant Mol Biol. 2015;87(4–5):521–39.
67. Obayashi T, Okamura Y, Ito S, Tadaka S, Aoki Y, Shirota M, Kinoshita K.ATTED-II in 2014: evaluation of gene coexpression in agriculturallyimportant plants. Plant Cell Physiol. 2014;55(1):e6.
68. Li G, Meng X, Wang R, Mao G, Han L, Liu Y, Zhang S. Dual-level regulationof ACC synthase activity by MPK3/MPK6 cascade and its downstream WRKYtranscription factor during ethylene induction in Arabidopsis. PLoS Genet.2012;8(6):e1002767.
69. Koyama T, Nii H, Mitsuda N, Ohta M, Kitajima S, Ohme-Takagi M, Sato F.A regulatory cascade involving class II ETHYLENE RESPONSE FACTORtranscriptional repressors operates in the progression of leaf senescence.Plant Physiol. 2013;162(2):991–1005.
70. Zhang Z, Wang J, Zhang R, Huang R. The ethylene response factor AtERF98enhances tolerance to salt through the transcriptional activation of ascorbicacid synthesis in Arabidopsis. Plant J. 2012;71(2):273–87.
71. Upadhyaya, Hemavathi CP, Akula N, Young KE, Chun SC, Kim DH, Park SW.Enhanced ascorbic acid accumulation in transgenic potato confers toleranceto various abiotic stresses. Biotechnol Lett. 2009;32(2):321–30.
72. Huang C, He W, Guo J, Chang X, Su P, Zhang L. Increased sensitivity tosalt stress in an ascorbate-deficient Arabidopsis mutant. J Exp Bot.2005;56(422):3041–9.
73. Zhu D, Wu Z, Cao G, Li J, Wei J, Tsuge T, Gu H, Aoyama T, Qu LJ.TRANSLUCENT GREEN, an ERF family transcription factor, controls waterbalance in Arabidopsis by activating the expression of aquaporin genes.Mol Plant. 2014;7(4):601–15.
74. Cutcliffe JW, Hellmann E, Heyl A, Rashotte AM. CRFs form protein–proteininteractions with each other and with members of the cytokinin signallingpathway in Arabidopsis via the CRF domain. J Exp Bot. 2011;62(14):4995-5002.
75. Licausi F, Giorgi FM, Zenoni S, Osti F, Pezzotti M, Perata P. Genomic andtranscriptomic analysis of the AP2/ERF superfamily in Vitis vinifera. BMCGenomics. 2010;11:719.
76. Nakano T, Suzuki K, Fujimura T, Shinshi H. Genome-wide analysis of the ERFgene family in Arabidopsis and rice. Plant Physiol. 2006;140(2):411–32.
77. Hiratsu K, Matsui K, Koyama T, Ohme-Takagi M. Dominant repression oftarget genes by chimeric repressors that include the EAR motif, a repressiondomain, in Arabidopsis. Plant J. 2003;34(5):733–9.
78. Ohta M, Matsui K, Hiratsu K, Shinshi H, Ohme-Takagi M. Repression domainsof class II ERF transcriptional repressors share an essential motif for activerepression. Plant Cell. 2001;13(8):1959–68.
79. Nowak K, Wojcikowska B, Gaj MD. ERF022 impacts the induction of somaticembryogenesis in Arabidopsis through the ethylene-related pathway.Planta. 2015;241(4):967–85.
80. This P, Lacombe T, Thomas MR. Historical origins and genetic diversity ofwine grapes. Trends Genet. 2006;22(9):511–9.
81. Myles S, Boyko AR, Owens CL, Brown PJ, Grassi F, Aradhya MK, Prins B,Reynolds A, Chia JM, Ware D et al. Genetic structure and domesticationhistory of the grape. Proc Natl Acad Sci U S A. 2011;108(9):3530–5.
82. Cramer GR, Van Sluyter SC, Hopper DW, Pascovici D, Keighley T, Haynes PA.Proteomic analysis indicates massive changes in metabolism prior to theinhibition of growth and photosynthesis of grapevine (Vitis vinifera L.) inresponse to water deficit. BMC Plant Biol. 2013;13:49.
83. Seki M, Umezawa T, Urano K, Shinozaki K. Regulatory metabolic networks indrought stress responses. Curr Opin Plant Biol. 2007;10(3):296–302.
84. Finkelstein RR, Lynch TJ. The Arabidopsis abscisic acid response geneABI5 encodes a basic leucine zipper transcription factor. Plant Cell.2000;12(4):599–609.
85. Fujita Y, Fujita M, Shinozaki K, Yamaguchi-Shinozaki K. ABA-mediatedtranscriptional regulation in response to osmotic stress in plants. J PlantRes. 2011;124(4):509–25.
86. Wang Y, Li L, Ye T, Lu Y, Chen X, Wu Y. The inhibitory effect of ABA on floraltransition is mediated by ABI5 in Arabidopsis. J Exp Bot. 2013;64(2):675–84.
87. Sakuraba Y, Jeong J, Kang MY, Kim J, Paek NC, Choi G. Phytochrome-interactingtranscription factors PIF4 and PIF5 induce leaf senescence in Arabidopsis. NatCommun. 2014;5:4636.
88. Mittal A, Gampala SS, Ritchie GL, Payton P, Burke JJ, Rock CD. Related toABA-Insensitive3(ABI3)/Viviparous1 and AtABI5 transcription factorcoexpression in cotton enhances drought stress adaptation. PlantBiotechnol J. 2014;12(5):578–89.
89. Qiao Z, Li CL, Zhang W. WRKY1 regulates stomatal movement indrought-stressed Arabidopsis thaliana. Plant Mol Biol. 2016;91(1-2):53–65.
90. Jossier M, Bouly JP, Meimoun P, Arjmand A, Lessard P, Hawley S, GrahameHD, Thomas M. SnRK1 (SNF1-related kinase 1) has a central role in sugarand ABA signalling in Arabidopsis thaliana. Plant J. 2009;59(2):316–28.
91. Rodrigues A, Adamo M, Crozet P, Margalha L, Confraria A, Martinho C,Elias A, Rabissi A, Lumbreras V, Gonzalez-Guzman M et al. ABI1 and PP2CAphosphatases are negative regulators of Snf1-related protein kinase1signaling in Arabidopsis. Plant Cell. 2013;25(10):3871–84.
92. Ohme-Takagi M, Shinshi H. Ethylene-inducible DNA binding proteins thatinteract with an ethylene-responsive element. Plant Cell. 1995;7(2):173–82.
93. Zhang JY, Broeckling CD, Blancaflor EB, Sledge MK, Sumner LW, Wang ZY.Overexpression of WXP1, a putative Medicago truncatula AP2 domain-containing transcription factor gene, increases cuticular wax accumulationand enhances drought tolerance in transgenic alfalfa (Medicago sativa).Plant J. 2005;42(5):689–707.
94. Saleh A, Lumbreras V, Lopez C, Kizis ED-PD, Pagès M. Maize DBF1-interactorprotein 1 containing an R3H domain is a potential regulator of DBF1activity in stress responses. Plant J. 2006;46(5):747–57.
95. Lin R-C, Park H-J, Wang H-Y. Role of Arabidopsis RAP2.4 in RegulatingLight- and Ethylene-Mediated Developmental Processes and Drought StressTolerance. Mol Plant. 2008;1(1):42–57.
96. Wilkinson S, Davies WJ. Drought, ozone, ABA and ethylene: new insightsfrom cell to plant to community. Plant Cell Environ. 2010;33(4):510–25.
97. Ludwikow A, Ciesla A, Kasprowicz-Maluski A, Mitula F, Tajdel M, Galganski L,Ziolkowski PA, Kubiak P, Malecka A, Piechalak A et al. Arabidopsis proteinphosphatase 2C ABI1 interacts with type I ACC synthases and is involved inthe regulation of ozone-induced ethylene biosynthesis. Mol Plant.2014;7(6):960–76.
98. Barrett T, Wilhite SE, Ledoux P, Evangelista C, Kim IF, Tomashevsky M, MarshallKA, Phillippy KH, Sherman PM, Holko M et al. NCBI GEO: archive for functionalgenomics data sets–update. Nucleic Acids Res. 2013;41(Database issue):D991–995.
Hopper et al. BMC Plant Biology (2016) 16:118 Page 20 of 20