Embed Size (px)
Citation preview
ECONOMIC AND SOCIAL COMMISSION FOR ASIA AND THE PACIFIC
DEVELOPMENT OF THE TRANS-ASIAN RAILWAY
TRANS-ASIAN RAILWAY IN THE SOUTHERN CORRIDOR OF ASIA-EUROPE ROUTES
UNITED NATIONS

ECONOMIC AND SOCIAL COMMISSION FOR ASIA AND THE PACIFIC
DEVELOPMENT OF THE TRANS-ASIAN RAILWAY
TRANS-ASIAN RAILWAY IN THE SOUTHERN CORRIDOR
OF ASIA-EUROPE ROUTES
UNITED NATIONSNew York, 1999

ST/ESCAP/1980
This publication was prepared by Peter Hodgkinson, Consultant, with financial support by the Government of Germany through GTZ German Technical Cooperation.
The description employed and the presentation of material in this publication do notimply the expression of any opinion whatsoever on the part of the Secretariat of the United Nations concerning the legal status of any country, territory, city or area, or of its authorities, or concerning the delimitation of its frontiers or boundaries.
This publication has been issued without formal editing.

CONTENTS
Page
1. INTRODUCTION .................................................................................................................1
2. NETWORK IDENTIFICATION ............................................................................................32.1 Routes of international significance .........................................................................3
2.1.1 Route TAR-S1 .............................................................................................52.1.2 Route TAR-S2 .............................................................................................52.1.3 Route TAR-S3 .............................................................................................7
2.2 Routes of subregional significance ..........................................................................82.3 Description of TAR links within participating countries ...........................................8
2.3.1 TAR (Southern Corridor) in Bangladesh ......................................................82.3.2 TAR (Southern Corridor) in China .............................................................112.3.3 TAR (Southern Corridor) in India ...............................................................132.3.4 TAR (Southern Corridor) in the Islamic Republic of Iran ...........................172.3.5 TAR (Southern Corridor) in Myanmar ........................................................212.3.6 TAR (Southern Corridor) in Pakistan .........................................................252.3.7 TAR (Southern Corridor) in Sri Lanka .......................................................292.3.8 TAR (Southern Corridor) in Thailand .........................................................312.3.9 TAR (Southern Corridor) in Turkey ............................................................33
3. ROUTE CHOICES FOR USERS OF TAR SERVICES .....................................................383.1 Rail route choices, Kunming - Europe and Kunming -
Central Asia and Islamic Republic of Iran ............................................................383.2 Rail route choices, Kunming to seaports ..............................................................423.3 Rail route choices, Bangkok - Europe and Bangkok -
Central Asia and Islamic Republic of Iran .............................................................433.4 General observations concerning route choice .....................................................45
4. CLOSING THE GAPS IN THE NETWORK .......................................................................464.1 Assumed technical standards ...............................................................................484.2 Assumed unit costs of missing link construction ...................................................484.3 Method of estimating breakeven or threshold traffic volumes ...............................494.4 Assessment of individual missing links .................................................................51
4.4.1 Links between Thailand and Myanmar ......................................................514.4.2 Links between China and Myanmar ..........................................................564.4.3 Links between Myanmar and India ............................................................594.4.4 Missing link within the Islamic Republic of Iran .........................................61
4.5 Summarized capital cost and threshold tonnage estimates ..................................63
5. TRAFFIC DEMAND ..........................................................................................................645.1 Existing traffic demand ..........................................................................................65
5.1.1 Bangladesh ................................................................................................655.1.2 India ...........................................................................................................665.1.3 Pakistan .....................................................................................................68
i

Page5.1.4 Islamic Republic of Iran .............................................................................705.1.5 Turkey ........................................................................................................71
5.2 Diverted traffic demand .........................................................................................725.2.1 China .........................................................................................................735.2.2 Thailand .....................................................................................................745.2.3 Myanmar ....................................................................................................755.2.4 Bangladesh ................................................................................................755.2.5 India ...........................................................................................................765.2.6 Pakistan .....................................................................................................765.2.7 Islamic Republic of Iran .............................................................................77
5.3 Generated traffic demand ......................................................................................775.4 Summarized forecasts of border crossing traffic ...................................................775.5 Traffic forecasts in relation to missing link construction ........................................775.6 General observations concerning traffic demand forecasts ..................................79
6. TECHNICAL REQUIREMENTS ........................................................................................806.1 Load and structure dimensions .............................................................................80
6.1.1 Standards and requirements .....................................................................806.1.2 Conformity of individual railway systems with TAR structure
profile standards ........................................................................................816.2 Axle load ................................................................................................................84
6.2.1 Standards and requirements .....................................................................846.2.2 Conformity of individual railway systems with TAR axle load standards ....86
6.3 Speed ....................................................................................................................886.3.1 Standards and requirements .....................................................................886.3.2 Conformity of individual railway systems with TAR speed standards ........89
7. OPERATIONAL REQUIREMENTS .................................................................................1007.1 Compatible and efficient rolling stock design ......................................................1007.2 Compatibility of train assembly and load scheduling practices ...........................1037.3 Adequacy of route capacity .................................................................................104
7.3.1 Bangladesh ..............................................................................................1047.3.2 India .........................................................................................................1057.3.3 Islamic Republic of Iran ...........................................................................1057.3.4 Myanmar ..................................................................................................1057.3.5 Pakistan ...................................................................................................1067.3.6 Sri Lanka .................................................................................................1067.3.7 Thailand ...................................................................................................1077.3.8 Turkey ......................................................................................................107
7.4 Overcoming break-of-gauge problems ................................................................1087.5 Adequacy of container handling capacity in ports and hinterland .......................109
7.5.1 Bangladesh ..............................................................................................1097.5.2 India .........................................................................................................1127.5.3 Islamic Republic of Iran ...........................................................................1157.5.4 Myanmar ..................................................................................................1167.5.5 Pakistan ...................................................................................................1177.5.6 Turkey ......................................................................................................118
ii

Page8. COMMERCIAL REQUIREMENTS ..................................................................................120
8.1 Transit times ........................................................................................................1218.2 Tariffs ..................................................................................................................126
8.2.1 Tariff setting principles .............................................................................1268.2.2 Tariff benchmarks ....................................................................................128
9. DEVELOPMENT PLANS ................................................................................................1329.1 TAR network development in the participating countries ....................................132
9.1.1 Bangladesh ..............................................................................................1329.1.2 China .......................................................................................................1349.1.3 India .........................................................................................................1349.1.4 Islamic Republic of Iran ...........................................................................1359.1.5 Myanmar ..................................................................................................1369.1.6 Pakistan ...................................................................................................1379.1.7 Sri Lanka .................................................................................................1389.1.8 Thailand ...................................................................................................1399.1.9 Turkey ......................................................................................................139
10. TRANSPORT FACILITATION ISSUES ..........................................................................14210.1 Current status of administrative arrangements for border crossing
rail traffic within the countries of the TAR Southern Corridor ..............................14210.1.1 International transit agreements and conventions....................................14310.1.2 International rail transit agreements ........................................................14310.1.3 Bilateral transit agreements and conventions ..........................................145
10.2 Resolving the deficiencies of current border crossing procedures ......................14910.2.1 Excessive border crossing delays ...........................................................14910.2.2 Operational inefficiencies ........................................................................15010.2.3 Tariff setting inefficiencies .......................................................................15010.2.4 Railway adoption of EDI systems ............................................................151
11. MAIN CONCLUSIONS AND RECOMMENDATIONS ....................................................15211.1 TAR network designation ....................................................................................15211.2 Fundamental role and operational priorities ........................................................15311.3 Closing the gaps in the network ..........................................................................15311.4 Identifying and achieving targets for competitive rail service .............................15411.5 Recommended minimum technical standards ....................................................15411.6 Specific container handling needs .......................................................................15511.7 TAR network development needs .......................................................................15611.8 Traffic information and forecasting system enhancement .................................... 15711.9 Facilitation measures for cross border traffic ......................................................15711.10 Action Plan ...........................................................................................................158
iii
ANNEXES
PageAnnex 1: Freight traffic costing sub-model ...................................................................163Annex 2: Estimate of container traffic financial contribution .........................................166Annex 3: Estimate of breakeven volume required to justify construction of
missing links ..................................................................................................170
LIST OF MAPS
PageMap 1 Proposed Trans-Asian Railway routes ....................................................................2Map 2 Trans-Asian Railway Southern Corridor ..................................................................4Map 3 Trans-Asian Railway Southern Corridor: Network in Bangladesh ...........................9Map 4 Trans-Asian Railway Southern Corridor: Network in China ..................................12Map 5 Trans-Asian Railway Southern Corridor: Network in India .....................................14Map 6 Trans-Asian Railway Southern Corridor: Network in Islamic Republic of Iran .......18Map 7 Trans-Asian Railway Southern Corridor: Network in Myanmar..............................22Map 8 Trans-Asian Railway Southern Corridor: Network in Pakistan ...............................26Map 9 Trans-Asian Railway Southern Corridor: Network in Sri Lanka..............................30Map 10 Trans-Asian Railway Southern Corridor: Network in Thailand ...............................32Map 11 Trans-Asian Railway Southern Corridor: Network in Turkey..................................34Map 12 Missing links in relation to existing TAR network in
northern Myanmar, Bangladesh and northeastern India .......................................47Map 13 Missing links between Thailand and Myanmar in the TAR southern corridor .......53Map 14 Missing links between China and Myanmar in the TAR southern corridor ............57Map 15 Missing links between India and Myanmar in the TAR southern corridor .............60Map 16 TAR missing links in the Islamic Republic of Iran ..................................................62
LIST OF FIGURES
PageFigure 6.1 Structure and Loading Gauge Restriction in Bangladesh .....................................92Figure 6.2 Structure and Loading Gauge Restriction in China ................................................93Figure 6.3 Structure and Loading Gauge Restriction in India .................................................94Figure 6.4 Structure and Loading Gauge Restriction in Islamic Republic of Iran ...................95Figure 6.5 Structure and Loading Gauge Restriction in Myanmar .........................................96Figure 6.6 Structure and Loading Gauge Restriction in Pakistan ...........................................97Figure 6.7 Structure and Loading Gauge Restriction in Sri Lanka .........................................98Figure 6.8 Structure and Loading Gauge Restriction in Turkey .............................................99
iv

LIST OF TABLESPage
Table 2.1 Profile of Route TAR-S1 - Main intercontinental trunk route between Kunming (China) and Kapikule (Turkey) ...........................................................6
Table 2.2 Profile of Route TAR-S2 - East-west trunk route between Nam Tok (Thailand) and Mandalay (Myanmar) part of intercontinental route between Bangkok and Kapikule ......................................................................................7
Table 2.3 Profile of Route TAR-S3(North - south trunk route between Sarakhs and Bandar Abbas, Islamic Republic of Iran, part of international routeCentral Asia - Europe and South/Southeast Asia) ............................................8
Table 2.4 Basic characteristics of TAR (Southern Corridor) links in Bangladesh ...........10Table 2.5 Basic characteristics of TAR (Southern Corridor) links in China ..................13Table 2.6 Basic characteristics of TAR (Southern Corridor) links in India........................15Table 2.7 Basic characteristics of TAR (Southern Corridor) links
in the Islamic Republic of Iran .........................................................................19Table 2.8 Basic characteristics of TAR (Southern Corridor) links in Myanmar ................23Table 2.9 Basic characteristics of TAR (Southern Corridor) links in Pakistan .................27Table 2.10 Basic characteristics of TAR (Southern Corridor) links in Sri Lanka ...............31Table 2.11 Basic characteristics of TAR (Southern Corridor) links in Thailand .................33Table 2.12 Basic characteristics of TAR (Southern Corridor) links in Turkey ...................35
Table 3.1 Rail distance matrix, TAR Southern Corridor (with direct link Fariman - Bafq) .......................................................................39
Table 3.2 Distance comparison - alternative routes from Kunming to (i) Europe, (ii) Central Asia, (iii) Islamic Republic of Iran....................................................40
Table 3.3 Distance comparison - alternative routes from Bangkok to (i) Europe, (ii) Central Asia, (iii) Islamic Republic of Iran ...................................................44
Table 4.1 Assumed Technical Standards for New TAR Links .........................................49Table 4.2 Assumed unit capital costs of new line construction .......................................50Table 4.3 Summary of new line construction costs vs threshold freight tonnages ..........63
Table 5.1 Trend in rail container feeder volume and share, Dhaka-Chittagong-Dhaka ...66Table 5.2 Rail hauled international container traffic forecast, all TAR links in India ........67Table 5.3 Forecast of rail hauled container traffic across India=s borders ......................68Table 5.4 Loaded container throughputs, Lahore Dry Port .............................................68Table 5.5 Summarized forecasts of rail hauled border crossing container traffic ............78Table 5.6 Traffic forecasts in relation to threshold tonnage requirement,
missing links ....................................................................................................78
Table 6.1 Dimensions and maximum weights of most commonly used ISO and non-ISO containers ...........................................................................81
Table 6.2 Conformity with structure profile requirements ................................................84Table 6.3 Axle loads in Pakistan .....................................................................................87
v

PageTable 7.1 Comparison of container wagons in service within TAR Southern Corridor ..101Table 7.2 Container throughput trend, Chittagong Port ................................................110Table 7.3 Container throughputs, TAR-connected ports in India ...................................112Table 7.4 Trend in container throughput, CONCOR terminals, 1993/94 - 1997/98 .......114Table 7.5 Trend in port container throughput, Islamic Republic of Iran, 1992 - 1997 ....115Table 7.6 Container throughput trend, Lahore Dry Port, 1993/94 - 1996/97 .................118
Table 8.1 Estimate of sea transit time for container movement, Dhaka-Frankfurt .........121Table 8.2 Estimated all-rail transit time for container movement, Dhaka-Frankfurt .......122Table 8.3 Estimate of sea transit time for container movement, intermediate routes ....124Table 8.4 Estimated all-rail transit time for container movement, intermediate routes...125Table 8.5 Estimate of sea handling and transport charges for container movement,
Dhaka-Frankfurt ............................................................................................128Table 8.6 Estimate of sea handling and transport charges for container movement,
Ashgabat-Lahore ...........................................................................................130Table 8.7 Estimate of sea handling and transport charges for container movement,
Ashgabat-Dhaka ...........................................................................................131Table 8.8 Estimate of sea handling and transport charges for container movement,
Ashgabat-Delhi ..................................................................................................................131
Table 10.1 Status of ESCAP member countries= and area=s accession or being party to international conventions listed in Commission resolution 48/11,as of January1999 .........................................................................................144
Table 10.2 Bilateral agreements governing transit at borders within TARsouthern corridor ............................................................................................146
Table 10.3 Border trade agreements between Myanmar and neighbouringcountries ........................................................................................................149
vi
1. INTRODUCTION
The southern corridor of the Trans-Asian Railway is one of three Asia-Europe rail landbridges studied by ESCAP as part of the Asian Land Transport Infrastructure Development(ALTID) project which was endorsed by the 48th ESCAP Commission Session in Beijing in April1992. The overall network comprising these three landbridges is illustrated in Map 1.
The principal objective of this study is to identify, and to evaluate the development and operation of a network of routes allowing through railway transport of containers between South Asia and Europe, southern China and Europe and Thailand and Europe. These routes would run via Myanmar, Bangladesh, India, Pakistan, the Islamic Republic of Iran, and Turkey. Further objectives are to identify and evaluate routes which will allow the rail transportation of containersfrom Central Asia to the ports of Bandar Abbas and Bandar Imam Khomeini and from the SouthAsian hinterland (in particular, from Nepal, Bhutan and the Northeastern states of India) to ports on the Bay of Bengal and the Arabian Sea.
In 1995, ESCAP undertook a preliminary study of the route requirements for the TAR Southern Corridor.1 This study was restricted to routes within the territories of the five participating countries, namely: Bangladesh, India, the Islamic Republic of Iran, Pakistan and Sri Lanka. Apart from identifying a basic network of routes, the preliminary study report recommended certain technical and operational standards for this network and provided alimited appraisal of the status of existing routes in relation to these standards. Resourcelimitations prevented this study from considering the connection of the Southern Corridor to aTAR network east of Bangladesh or from reviewing in detail the requirements for railwayconnections between the South Asian hinterland and its nearest ports. In addition, it was notpossible within these resource limitations to investigate the international container trafficpotential of the identified TAR network in the corridor, nor to give full consideration to the improvements required in existing institutional and commercial procedures and arrangements in order to realize this potential.
In the light of recent significant developments in trade and economic exchanges among thecountries of the sub-region, the present study is intended to re-evaluate and, as necessary, to re-define the route network in the corridor, as well as to assess an outline plan for its development which will allow it to facilitate further inter and intra-regional trade and economic growth.
This report presents the findings of this second, more detailed study which was extended to include southern China, Myanmar, the western part of Thailand, and Turkey. The countries comprising the Southern Corridor of the TAR actively participated in and provided inputs for thestudy. These countries are: Bangladesh, China, India, the Islamic Republic of Iran, Myanmar, Nepal, Pakistan, Sri Lanka, Thailand and Turkey.
1 Trans-Asian Railway Route Requirements: Preliminary Study on Development of Trans-Asian Railway in the Southern Corridor of Asia-Europe Routes, United Nations, New York 1996.
1

JANUARY 1999
B A NDA R A MIR A B A D
L E K HA P A NI
P E S HA WA R
P A R B A T IP UR
L A S HIO
XIANGYUN
JINGHONG
CETINKAYADOGUKAPI
MAP 1:
VOLGOGRAD
DRUJBA
AKTOGAI
GUANGZHOU
PARKSE
HANOI
TOPRAKKALA
MALATYA
INDONE S IA
B A NDUNG
B A NY UWA NG I
S UR A B A Y A
ME R A KJ A K A R T A
P A NJ A NG
K E R T A P A T I
J OHOR E
L UB UK L ING G A U
K UA L A L UMP UR
K E L A NG
R A NT A UP R A P A T
B E L A WA N
B A NDA A C E H
HO C HI MINH C IT Y
S IS OP HON
S IHA NOUK V IL L E
P HNOMP E NH
P OIP E T
B A NG K OKNA M TOK
V UNG A NH
HA IP HONG
Y A NG ON
K UNMING
MY IT K Y INA
V IE NT IA NE
C A L C UT T A
MA T HUR A
A T T A R I
WA G A H
L A HOR E
R OHR I
S P E ZA ND
C HA MA N
C HIT T A G ONG
DOHA ZA R I
T A MU
MA NDA L A Y
DA R S A NA
R A XA UL
S HE NZHE NNA NNING
C OL OMB O
T A L A MA NNA RT UT IC OR IN
MA DR A S
MUMB A I
IT A R A S I
NE W DE L HI
K A R A C HI
J A MMUA NDK A S HMIR
ZA HE DA N
MIR J AVE H
B A F Q
F A R IMA N
S OP IA N
V E C E L OY E
B A T UMI
Y E R A V A N
S A MURT B IL IS I
P OT I
B A K U
J UL F AR A ZI
S A R A K HS
A S HG A B A TC HA R DJ E V
T UR K ME NB A S HI
K E R MA N
K OH-I-T A F T A N
T E HR A N
A B A DA N
B A NDA R IMA N K HOME INI
T A S HK E NT
NUK US
A NK A R A
MOS C OW
IS T A NB UL
C ONS T A NT A
S A MS UN
ME R S INIS K E NDE R UN
A L A T A W P A S S
A S T A NA
K OK S HE T A U
OMS KNOV IS IB IR S K
Y E K A T E R INB UR G
NIZHNIY NOV G OR OD
P R E S NOG OR 'K OV K A
TOB OL
OZINK I
R Y A ZA N
A S T R A K HA NODE S A
S UZE MK A
B A T A Y S K
C HE NG E L DY
K R A S NOY E
L A NZHOU
UR UMQI
UL A N UDE K A R IMS K A Y A
MA NZHOUL I
HA R B IN
S UIF E NHE
NA K HODK A
K HA S A NR A J IN
DA NDONG
DA L IA N P Y UNG Y A NG
MOK P O P US A N
QING DA O
T IA NJ IN
NA US K I
HOIT
ZA MY N UUDE R E NHOT
UL A A NB A A T A R
S E OUL
B E IJ ING
S HA NG HA I
L IA NY UNG A NG
ZHE NG ZHOU
DHA K A
K A P IC UL E
B A NDA R A B B A S
MA T A R A
LAO CAI
QOM
B R UNE IDA R US S A L A M
P HIL IP P INE SV IE TNA M
T HA IL A ND
C AMB ODIA
L A OP DRMY A NMA R
B HUT A N
NE P AL
C HINA
MONG OL IA
R US S IA N F E DE R A T ION
DE M. P E OP L E 'SR E P. OF K OR E A
R E P. OFK OR E A
J A P A N
MA L A Y S IA
S ING A P OR E
B A NG L A DE S H
INDIA
S R I L A NK A
P A K IS T A N
T A J IK IS T A N
K Y R G Y ZS T A N
UZB E K IS T A N
K A ZA K HS T A N
IS L A MIC R E P.OF IR A N
T UR K ME NIS T A N
A ZE R B A IJ A N
C A S P IA N S E AB L A C K S E A
G E OR G IA
T UR K E Y
E UR OP E
E UR OP E
A R ME NIA A R A L S E A
AF G HANIS TAN
L E G E ND
T A R L INK S (1676 MM)
T A R L INK S (1520 MM)
T A R L INK S (1435 MM)
T A R L INK S (1067 MM)
T A R L INK S (1000 MM)
NE W T A R L INK S (P L A NNE D)
P OT E NT IA L T A R L INK S
B R E A K - OF - G A UG E P OINT
F E R R Y C R OS S ING
T he des ignations employed and the pres entation of material on this map do not imply theexpres s ion of any opinion whats oever on the part of the S ec retariat of the United Nationsc onc erning the legal s tatus of any c ountry, territory, c ity or area or of its authorities , orc onc erning the delimitation of its frontiers or boundaries .
Dotted line in J ammu and K as hmir repres ents approximately the L ine of C ontrol agreedupon by India and P akis tan. T he final s tatus of J ammu and K as hmir has not been agreedupon by the parties .
PROPOSED TRANS-ASIAN RAILWAY ROUTES

2. NETWORK IDENTIFICATION
The southern corridor of the Trans-Asian Railway is intended to provide, ultimately, acontinuous railway connection between Southeast Asia and Europe as well as betweenSouthwestern China and Europe. While it has other functions, such as the connection by rail of the hinterland regions of the countries in the corridor with their nearest seaports, its primary purpose must always be to provide a conduit through which it is possible for trains topass without interruption between Asia and Europe.
Whether such a continuous link has the potential to attract sufficient traffic and revenueto cover the substantial injections of capital funds likely to be needed for construction of its component missing links is another (albeit crucial) matter which is addressed elsewhere in this report. It is sufficient here to identify first the various routes within the corridor satisfyingthe primary function mentioned above and, second, the links comprising these routes and other routes of secondary significance.
The links in the TAR comprising this route network were identified by the participatingcountries in accordance with the criteria set out in the document E/ESCAP/CTC(3)/2ARefinement of the strategy for implementation of the ALTID project@ adopted at the 54th
session of the Commission, stipulating that nominated links should be one or more of the following:
i. capital-to-capital links (for international traffic); ii. connections to main industrial and agricultural centres as well as Agrowth
triangles/zones@ (links to important origin and destination points);iii. connections to major sea- and river ports (integration of land and water transport
networks);iv. connections to major inland container terminals and depots (integration of rail and
road networks).
Using these criteria, two types of railway routes have been identified within the corridor.These are:
i. routes of international significance, which will facilitate uninterrupted transportationbetween: Southeast Asia and Europe; Southwestern China and Europe; Central Asia and Europe; and Central, South and Southeast Asia;
ii. routes of subregional significance, which will facilitate country to country, or hinterland to port, transportation within the corridor.
The main east-west trunk routes from Thailand and Southwestern China to Europe through Myanmar, Bangladesh, India, Pakistan, the Islamic Republic of Iran and Turkey constitute routes of type (i), while routes connecting the hinterland of India to its ports, for example, are routes of type (ii). Routes of both categories are shown in Map 2, whichillustrates the entire network comprising the southern corridor of the Trans-Asian Railway.
2.1 Routes of international significance
Three routes of international significance were identified in the southern corridor of the Trans-Asia Railway. For convenience, they have been designated TAR-S1, TAR-S2, and TAR-S3.
3

Black Sea
Caspian Sea
Arabian Sea
Bay of Bengal
Indian Ocean
Andaman Sea
Mediterranean Sea
TURKEY
BULGARIA
ISLAMIC REPUBLIC OF IRAN
PAKISTAN
IRAQ
ARMENIA
GEORGIA
AZERBAIJAN
SYRIANARAB
REPUBLIC
BANGLADESH
MYANMAR
THAILAND
CAMBODIA
LAO PEOPLE’SDEMOCRATICREPUBLIC
CHINA
BHUTANNEPAL
INDIA
SRI LANKATAR ROUTES OF INTERNATIONAL SIGNIFICANCE (FUTURE)
TAR ROUTES OF SUBREGIONAL SIGNIFICANCE (EXISTING)
TAR ROUTES OF SUBREGIONAL SIGNIFICANCE (FUTURE)
AFGHANISTAN
TURKMENISTAN
XIAGUAN KUNMINGRUILI
MAWLAMYAINGMOKTAMA
THANBYUZAYAT
TOUNGOO
MANDALAY
LASHIO
TAMU
KALAY
BAGO
THREE PAGODA PASS
BANBONG
TEE
TAUNGGYI
GANGAWPAKOKKU
CHAUNG-U
MU-SE
YE
DAWEI
YANGON
DHAKA
KANCHANA BURI
BANGKOK
DARSANA
CHITTAGONG
SHAHBAZPUR
SHILIGURI
CALCUTTA
VIJAYAWADA
TIRUCHCHIRAPPALLI
MATARA
GALLE
COLOMBO
ALLAHABAD
KANPUR RAXAUL
MUGHALSARAI
PATNAVARANASI
HYDERABADWARANGAL
BHOPAL
NAGPUR
HARSI
SURAT
BARODA
JHANSI
RATLAM
TUTICORIN
TELAIMANNAR
ERODEBANGALORE
AMRITSAR
ATTARI
AMBALA
LUDHIANA
LUMDING
LEKHAPANI
PANGSAW PASS
BINA PTAWA
KOTA
MATHURA
CHANDRAPUR
ASANSOLGEDESITARAMPUR
GAYA
NEW DELHIJACOBABAD
ROHRI
SIBI
SPEZANDQUETTA
CHAMAN
NUSHKI
AHMADWAL
KOH-I-TAFTAN
DALBANDIN
KARACHIDRIG ROAD
HYDERABADKOTRI
NAWABSHAH
KHANPUR
MULTAN CANTT KHANEWAL
SAMASATA LODHRAN
WAGHA
WAZIRABADLALA MUSA
ATTOCK
FAISALABADSHEKHUPURA
PESHAWAR
RAWALPINDI
TEHRAN
ISLAMABAD
KERMAN
BANDAR ABBAS
MIRJAVEH
YAZD
MASHHAD
FARIMAN
KASHAN
GARMSAR
BANDAR AMIRABAD SARAKHS
QOM
ARAK
SIRJANZAHEDAN
BAD
DEZFUL
AHWAZ
BANDAR IMAM KHOMEINI
MEYBOD
BAFQ
QAZVIN
RAZIDJOLFA
TABRIZ
SOUFIAN
ESFAHAN
KAPIKULE ARIFLYEHAYDARPASA
SVILENGRAD
ESKISEHIR
SINCAN
KIRIKKALE
KAYSERI
MALATYA
CETINKAYA
SIVASKALIN
SAMSUN
ISKENDERUN
TOPRAKKALAADANA
MERSIN
ERZURUM
DOGUKAPI
AKTAS
KARS
TATVAN
KAPICOYVAN
ANKARA
ISTANBUL
TAR - S.1TAR - S.1
TAR - S.1
TAR - S.1
TAR - S.1
TAR - S.1
TAR - S.1
TAR - S.1
TAR - S.3
TAR - S.3
TAR - S.3
TAR - S.2
TAR - S.2
CHENNAI(MADRAS)
MUMBAI(BOMBAY)
MAP 2: TRANS-ASIAN RAILWAY SOUTHERN CORRIDOR
TAR ROUTES OF INTERNATIONAL SIGNIFICANCE (EXISTING)
The boundaries and names shown and thedesignations used on this map do not implyofficial endorsement or acceptance by theUnited Nations.
TAR ROUTES OF INTERNATIONAL SIGNIFICANCE (EXISTING BY FERRY)
4

2.1.1 Route TAR-S1
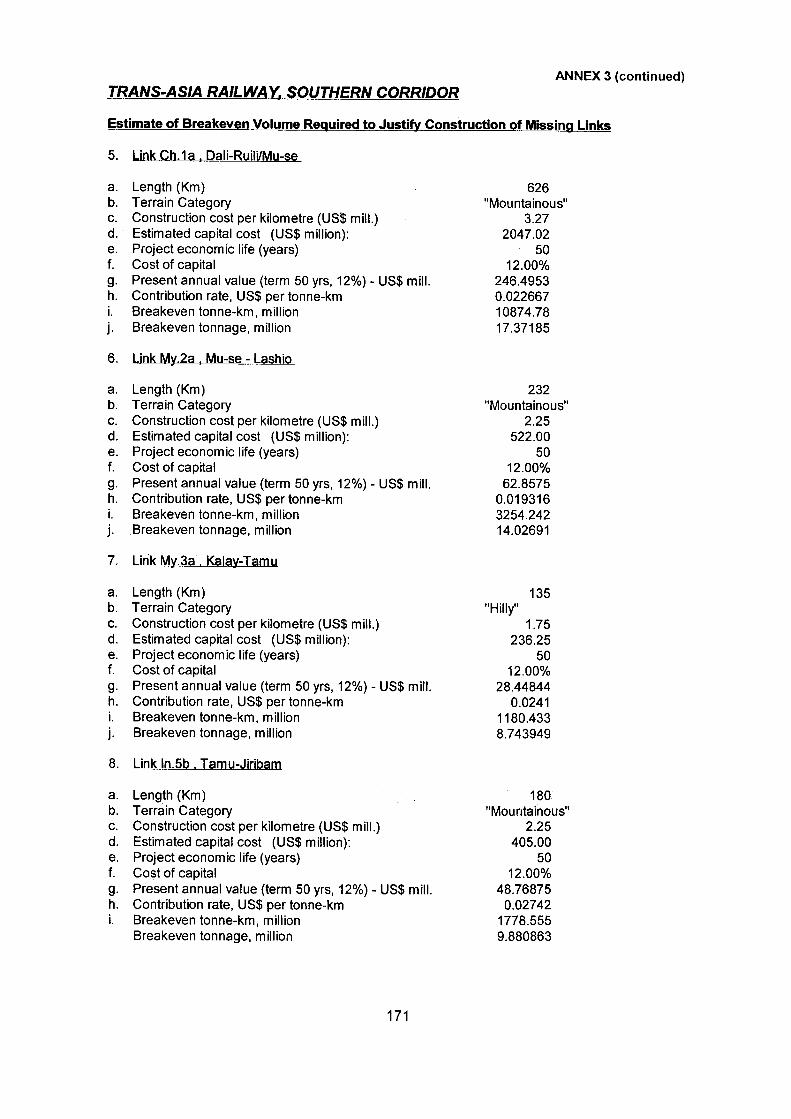
This is the main route of international significance within the corridor. It would commencein Kunming (China), running southwest from the existing Chinese railhead at Xiaguan (near Dali) to the border with Myanmar at Ruili, thence to the existing railhead of Lashio inMyanmar and along what is currently a branch line, to Mandalay. From Mandalay, it wouldfollow a broadly east-west axis, crossing the territory of Myanmar, India (twice), Bangladesh,Pakistan, the Islamic Republic of Iran, as far as the border between Turkey and Bulgaria, atKapikule. From its western extremity it would allow access to Western Europe via Bulgaria, Roumania, Hungary and Austria. From Kunming to Kapikule, it would have a total length of 11,700 km of which 9,790 km (or 84 per cent) is in place, 95 km (1 percent) comprises ferrylinks, and 1,820 km (15 per cent) would need to be constructed, most of it through difficultmountainous terrain.
From the border between Turkey and Bulgaria, Frankfurt (Germany) is another 1,785 km by rail, giving a total distance between Kunming and Frankfurt of approximately 13,500km.
Between its eastern and western extremities, route TAR-S1 would cross 7 nationalborders (with another 5 to be crossed west of Turkey) and would contain three different track gauges - metre (1,000 mm), standard (1,435 mm) and broad (1,676 mm).1 In future if it is toprovide a continuous rail link, Route TAR-S1 could have up to five inter-gauge transferpoints, but if it were currently to be used for intercontinental traffic, freight shippers couldface up to 12 locations at which modal transfer (transhipment) would be necessary. Table 2.1 summarizes the characteristics of Route TAR-S1.
2.1.2 Route TAR-S2
This route would start from the westernmost railhead on the Thai system at Nam Tok,210 km by rail from Bangkok, proceeding west or northwest to the border with Myanmar andjoining the existing railway network of the Myanma Railways before running north toMandalay where it would connect with Route TAR-S1. A connection to Yangon would beprovided at the junction station of Bago which is 75 km north of Yangon on the Yangon-Mandalay trunk line.
In fact, there are two alignment options for Route TAR-S2, both starting from Nam Tok and both of which are assessed in detail in Chapter 4 of this report.
The first, for which a detailed alignment survey has already been completed by the Malaysian consultants engaged for the Singapore-Kunming Rail Link Feasibility Study,would proceed in a northwesterly direction from Nam Tok to the border with Myanmar at Three Pagoda Pass, a distance of 153 km, and from there a further 110 km toThanbyuzayat, a major station on the isolated Mawlamyaing (Moulmein) - Ye line of the Myanma Railways. From Thanbyuzayat, Route TAR-S2 would run north to the railhead of Mawlamyaing on the southern bank of the Thanlwin (Salween) River, a distance of 70 km, and from there a 4 km ferry crossing would be necessary in order to reach the railhead onthe northern bank at Moktama (Martaban).2 From Moktama, Route TAR-S2 would followthe existing line to Bago, a distance of 196 km, and from there to the junction with TAR-S1 at Mandalay, a further 545 km. The total length of TAR-S2 via Three Pagoda Pass would be 1,078 km, of which 810 km (or 75 per cent) is in place, 4 km is a ferry link and 263 km (25per cent) would have to be constructed.
1 This includes 2 border crossings between India and Bangladesh.
2 While it is understood that the Government of Myanmar has a concept plan to construct a road/rail bridgeacross the Thanlwin River, there is as yet no evidence that this project has reached detailed design stage.
5

Table 2.1 Profile of Route TAR-S1 - Main intercontinental trunk route, Kunming(China) to Kapikule (Turkey)
Route component Route length (Km) % of total route length
Total route 11,705 100.0
Missing links 1,820 15.6
Existing rail links 9,790 83.6
Existing ferry links 95 0.8
Existing rail links 9,790 100.0
Metre gauge (1000 mm) 1,130 11.5
Standard gauge (1435 mm) 4,560 46.6
Broad gauge (1676 mm) 4,100 41.9
Non-electrified, single track 6,170 63.0
Electrified, single track 1,040 10.6
Non-electrified, multiple track 640 6.6
Electrified, multiple track 1,940 19.8
Number of border crossings Breaks of gauge (Number)
Total Route (existing) 7 0
Total Route (future) 7 5*
Number of modal transfers
Total Route (existing) 12
Total Route (future)** 0
* These might include: Ruili (China/Myanmar); Tamu (Myanmar/India); Shahbazpur (India/Bangladesh); one point within Bangladesh; and Mirjaveh (Pakistan/Islamic Republic of Iran).
** When route is continuous
The second alignment alternative has not thus far been subjected to detailed survey, buthas been supported by representatives of the State Railway of Thailand at meetings of the Special Working Group for the Singapore-Kunming Rail Link Feasibility Study. From NamTok, it would proceed in a westerly direction to the border with Myanmar at Ban Bong Tee, a distance of about 40 km, thence a further 110 km across the coastal range of southernMyanmar to the port of Dawei (Tavoy). From Dawei, Route TAR-S3 would run north alongthe soon-to-be completed 161 km Ye-Tavoy line,3 and from Ye (which is currently the southernmost railhead on the Myanma Railways system) would run for another 74 km toreach Thanbuyuzat. The total length of Route TAR-S2 via Ban Bong Tee and Dawei wouldbe about 1,200 km, of which 1,046 km (or 87 per cent) is currently or soon to be in place,four km is a ferry link and 150 km (13 per cent) would have to be constructed.
Depending upon the alignment alternative adopted, intercontinental rail traffic usingRoute TAR-S2 would travel a total distance between Bangkok and Kapikule of 11,460 km (via Three Pagoda Pass) or 11,580 (via Ban Bong Tee and Dawei), and between Bangkokand Frankfurt of 13,240 km (via Three Pagoda Pass) or 13,360 km (via Dawei). This route
3 Advice received from Myanma Railways during a November 1997 mission in connection with the presentstudy was that construction of this line would be completed in Aearly 1998", but it is doubtful that this target wasachieved.
6
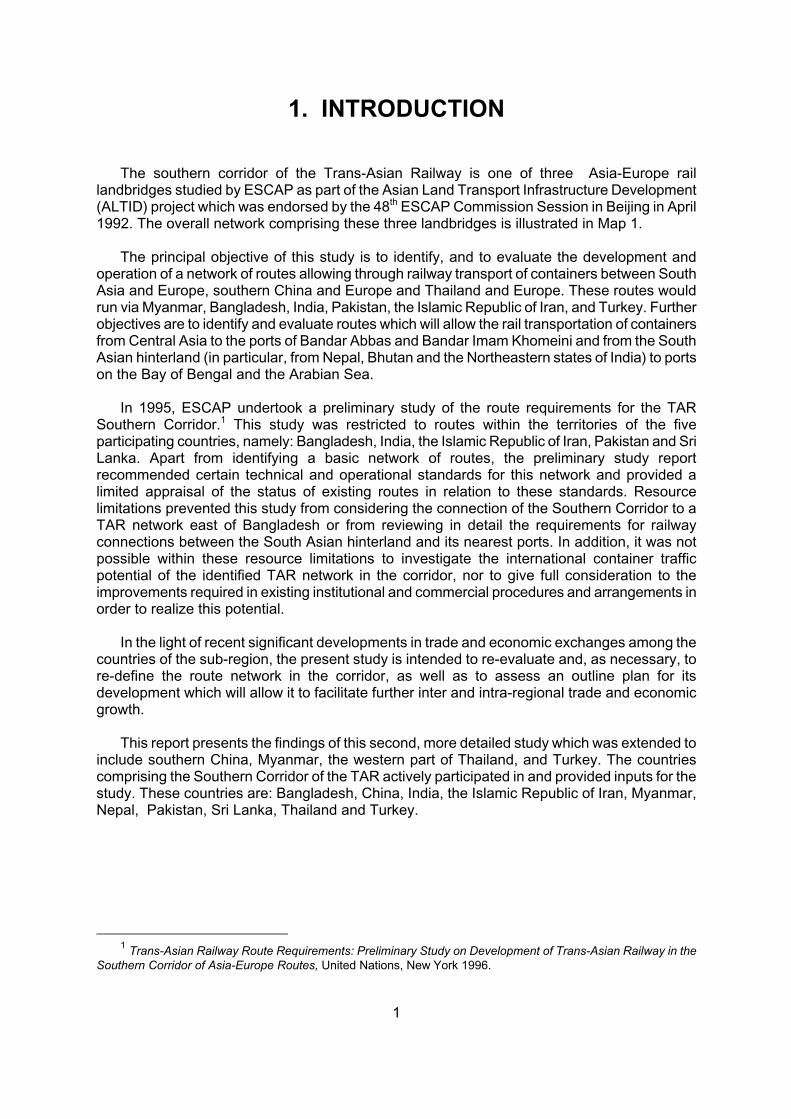
would cross seven national borders, with inter-gauge transfers being required at four locations. Current use of the route would involve modal transfers at 14 locations.
Table 2.2 Profile of Route TAR-S2 - East-west trunk route between Nam Tok(Thailand) and Mandalay (Myanmar) as part of intercontinental routeBangkok to Kapikule
Route component Route length (Km) % of total route length
Total route - via Three Pagoda Pass 1,078* 100.0
Missing links 263 24.4
Existing rail links 811 75.2
Ferry links 4 0.4
Total route - via Bongty, Dawei 1,200* 100.0
Missing links 150 12.5
Existing rail links 1,046 87.2
Ferry links 4 0.3
Number of border crossings Breaks of gauge (Number)
Total Route (existing) 1 0
Total Route (future) 1 0
Number of modal transfers
Total Route (existing) 4
Total Route (future) 0
* The entire route would comprise single metre gauge non-electrified track.
2.1.3 Route TAR-S3
This route has been designated as a route of international significance owing to its importance in connecting the landlocked countries of Central Asia with Europe and South/Southeast Asia.
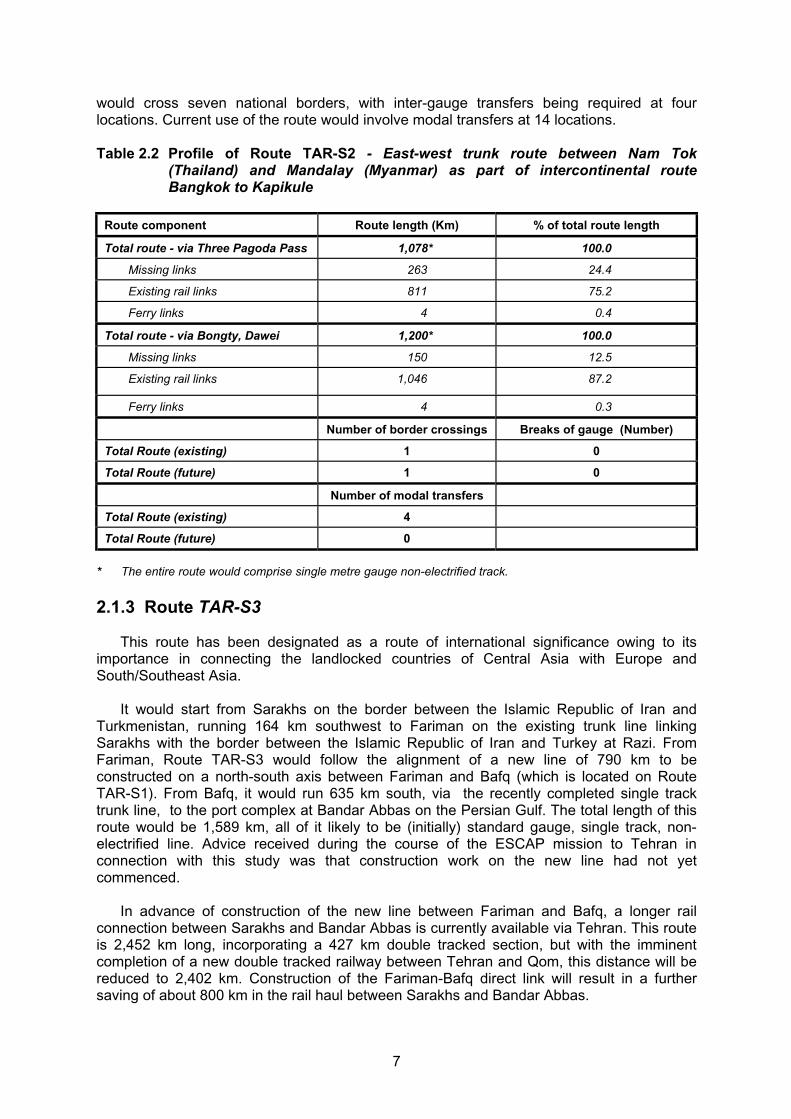
It would start from Sarakhs on the border between the Islamic Republic of Iran and Turkmenistan, running 164 km southwest to Fariman on the existing trunk line linkingSarakhs with the border between the Islamic Republic of Iran and Turkey at Razi. From Fariman, Route TAR-S3 would follow the alignment of a new line of 790 km to be constructed on a north-south axis between Fariman and Bafq (which is located on RouteTAR-S1). From Bafq, it would run 635 km south, via the recently completed single track trunk line, to the port complex at Bandar Abbas on the Persian Gulf. The total length of this route would be 1,589 km, all of it likely to be (initially) standard gauge, single track, non-electrified line. Advice received during the course of the ESCAP mission to Tehran in connection with this study was that construction work on the new line had not yet commenced.
In advance of construction of the new line between Fariman and Bafq, a longer rail connection between Sarakhs and Bandar Abbas is currently available via Tehran. This routeis 2,452 km long, incorporating a 427 km double tracked section, but with the imminentcompletion of a new double tracked railway between Tehran and Qom, this distance will be reduced to 2,402 km. Construction of the Fariman-Bafq direct link will result in a further saving of about 800 km in the rail haul between Sarakhs and Bandar Abbas.
7

Table 2.3 Profile of Route TAR-S3 - north-south trunk route between Sarakhs and Bandar Abbas (Islamic Republic of Iran) as part of international route betweenCentral Asia and Europe and between Central Asia and South/Southeast Asia
Route component Route length (Km) % of total route length
Total route - via Fariman-Bafq direct 1,589 100.0
Missing links 790 49.7
Existing rail links 799 50.3
Total route - via Tehran and Qom (new line) 2,402 100.0
Missing links - -
Existing rail links 2,402 100.0
Notes: (a) Both route alternatives are standard gauge. Break-of-gauge exists at border with Turkmenistanwhere Russian broad gauge of 1520 mm begins.
(b) The first route alternative is single track throughout. The second route alternative is single track, with the exception of a 427 km double tracked section between Semnan and Negh-Ab on theSarakhs-Tehran mainline. There are plans to duplicate the trunk line between Bafq and BandarAbbas. Both route alternatives are non-electrified.
2.2 Routes of subregional significance
Routes which are of subregional or national significance are considered within thedescription of links comprising the TAR network in each participating country (Section 2.3). They comprise a considerable number of long routes connecting major hinterland locations with seaports, such as for example the 1,319 km route linking Delhi with Mumbai (Bombay)and the 2,866 km route linking Delhi with Chennai (Madras) and Tuticorin, as well as the main rail transit route linking Birganj in Nepal with Calcutta, Haldia and Mumbai ports and the TAR connecting route in Sri Lanka.
2.3 Description of TAR links within participating countries
2.3.1 TAR (Southern Corridor) in Bangladesh
The TAR links in Bangladesh are shown in Map 3 and their primary characteristics are described in Table 2.4. They are five in number, designated Bn.1, Bn.2, Bn.2a, Bn.3 and Bn.4.
The first such link, Bn.1 forms part of the principal transcontinental route TAR-S1,described in the foregoing section. It starts from the northeastern Bangladeshi border stationof Shahbazpur, opposite Mahisasan in the southern part of Assam state of India. From Shahbazpur, Link Bn.1 follows the existing Bangladeshi metre gauge branch line in asouthwesterly direction to the junction with the mainline to Sylhet at Kulaura, thence the metre gauge mainline via Akhaura and Bhairab Bazar to Tongi, to which Dhaka is connectedby a 22 km double tracked metre gauge line. From Tongi, this link runs north to Joydebpur,from which point a new dual gauge (1000/1676 mm) line is being constructed via Tangail toconnect with the new Jamuna River Bridge (opened 23 June 1998), providing a continuousrail link with Jamtoil, 15 km southwest of Serajganj Ghat, the existing broad gauge railhead on the western bank of the river. From Jamtoil, the route follows the existing broad gaugeline to the border with the Indian state of West Bengal at Darsana (opposite the Indianborder station of Gede). Of the existing broad gauge route between Jamtoil and Darsana, a66 km section between Jamtoil and Ishurdi will be converted to dual gauge as part of theJamuna Bridge Railway Link Project, to be co-financed by the Asian Development Bank,OPEC and the governments of Bangladesh, Canada, France and Spain. Link Bn.1 would
8

have a length of 522.5 km, comprising 277.4 km of metre gauge, 165.1 km of dual gaugeand 80 km of broad gauge line. For its entire length this link would be single tracked and non-electrified.
TURKMENISTAN
AFGHANISTAN
PAKISTAN
TURKEY
IRAQ
CASPIAN SEA
ARABIAN SEA
TEHRAN
KERMAN
BANDAR ABBAS
FOHRAJ
MIRJAVEH
YAZD
MASHHAD
FARIMAN
KASHAN
GARMSAR
BANDAR AMIRABADSARAKHS
QOM
ARAK
SIRJANBAN
ZAHEDAN
BAD
DEZFUL
AHWAZ
BANDAR IMAM KHOMEINI
MEYBOD
BAFQ
QAZVIN
RAZI
SOUFAIN
DJOLFA
TABRIZ
ESFAHAN
TRANS-ASIAN RAILWAY SOUTHERN CORRIDORNETWORK IN ISLAMIC REPUBLIC OF IRAN
N
MAP 3: TRANS-ASIAN RAILWAY SOUTHERN CORRIDORNETWORK IN BANGLADESH
Bn.1Bn.4
Bn.2a
INDIA
INDIA
MYANMAR
BAY OF BENGAL
DHAKA
FENI
PAKSEY
ISHURDI
CHITTAGONG
DOHAZARI
GUNDHUM
AKHAURA
BHAIRAB BAZAAR
TONGI
TANGAIL
BIROL
JOYDEBPUR
KULAURA
N
Feet
13,123
6,562
3,281
1,640
656
0
Meters
4,000
2,000
1,000
500
200
0
100 km67 mi
LEGEND
EXISTING LINK
FUTURE LINK(route of international significance)
FUTURE LINK(route of subregional significance)
EXISTING LINK(route of subregional significance)
Ports integrated with TAR
TAR border station
TAR link designation
SHAHBAZPUR
DARSANA
Bn.1
ABDULPUR
JAMTOIL
ROHANPUR
PARBATIPUR
Bn.2
Bn.3
(route of international significance)
The boundaries and namesshown and the designationsused on this map do not implyo ff ic ia l endorsement oracceptance by the UnitedNations.
9

Table 2.4:Basic characteristics of TAR links in Bangladesh
Route length distribution, by number of tracks andtraction type (Km)
Link/Line Section Trackgauge(mm)
Totallength
Singletrack / non-elec.
Multipletrack / non-elec.
Singletrack /elec.
Multipletrack / elec.
Max.grade(%)*
Min.radius ofcurves(metres)
Max.singleloco load,( tonnes)
Axle loadlimit(tonnes)
Bn.1
Shahbazpur-Joydebpur
1,000 277 277 0.5
Joydebpur-Jamtoila
Dual1,000/1,676
99 99 0.5
Jamtoil-Ishurdi Dual1,000/1,676
66 66 0.5
Ishurdil-Darsana 1,676 80 80 0.5
Sub-total Bn.1 522 442 80
104
TOTAL 1,358 1,154 204
Bn.2
Dhaka-Tongi 1,000 22 22 0.5
Tongi- Akhaura** 1,000 98 65 33 0.5
Akhaura-Chittagong
1,000 201 132 69 0.5
Sub-total Bn.2 321 197 124
Bn.2a
Chittagong - Dohazari
1,000 47 47 0.5
Dohazari-border(Gundhum)
1,000 145 145
Sub-total Bn.2a 192 192
Bn.3
Ishurdii-Parbatipur Dual1000/1676(underconstruc-tion)
174 174 0.5
Parbatipur-Dinajpur
1,000 31 31 0.5
Dinajpur-Kanchan 1,000 3 3 0.5
Kanchan - Birolborder
1,000 11 11 0.5
Sub-total Bn.3 219 219
Bn.4
Abdulpur-Rajshabi 1,676 41 41 0.5
Rajshabi-Rohanpur border
1,676 63 63 0.5
Sub-total Bn.4 1041042191
* Bangladesh Railways have reported Aruling grades@, i.e. prevailing gradients which limit the trailing tonnage scheduled fora particular route.
** Section between Tongi and Akhaura (98 km) shared with Bn.1.
10
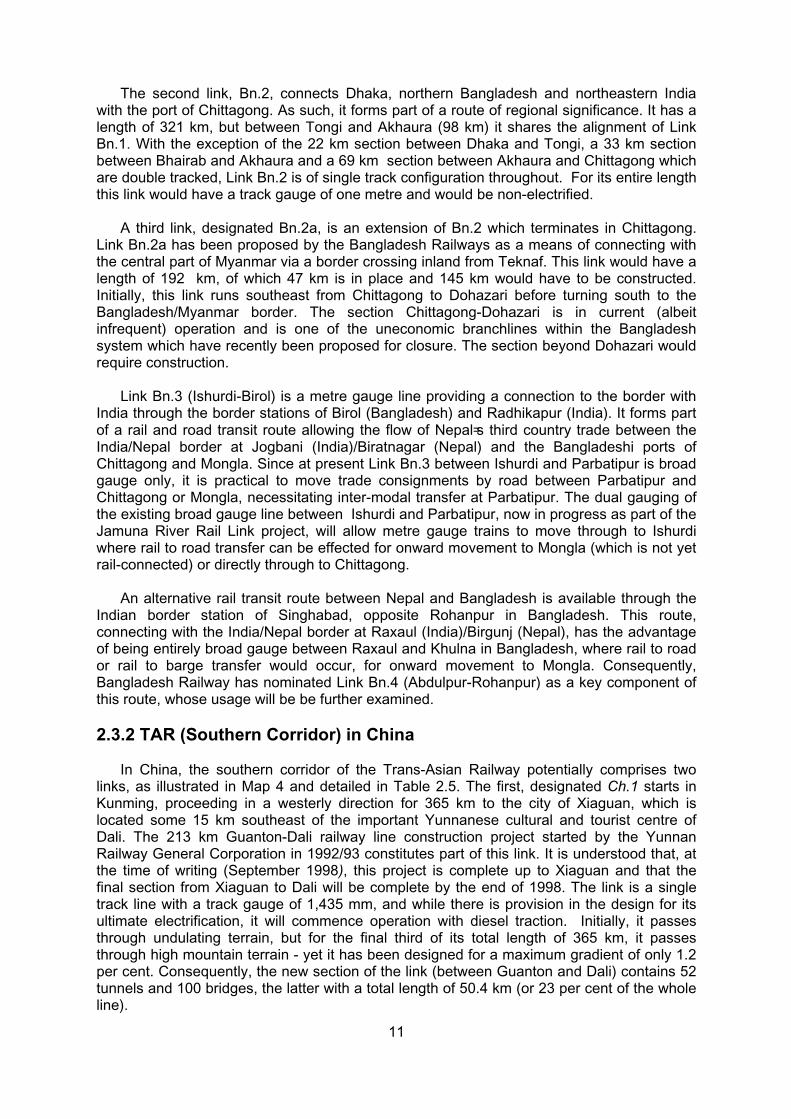
The second link, Bn.2, connects Dhaka, northern Bangladesh and northeastern Indiawith the port of Chittagong. As such, it forms part of a route of regional significance. It has alength of 321 km, but between Tongi and Akhaura (98 km) it shares the alignment of Link Bn.1. With the exception of the 22 km section between Dhaka and Tongi, a 33 km sectionbetween Bhairab and Akhaura and a 69 km section between Akhaura and Chittagong which are double tracked, Link Bn.2 is of single track configuration throughout. For its entire lengththis link would have a track gauge of one metre and would be non-electrified.
A third link, designated Bn.2a, is an extension of Bn.2 which terminates in Chittagong.Link Bn.2a has been proposed by the Bangladesh Railways as a means of connecting withthe central part of Myanmar via a border crossing inland from Teknaf. This link would have alength of 192 km, of which 47 km is in place and 145 km would have to be constructed. Initially, this link runs southeast from Chittagong to Dohazari before turning south to the Bangladesh/Myanmar border. The section Chittagong-Dohazari is in current (albeit infrequent) operation and is one of the uneconomic branchlines within the Bangladeshsystem which have recently been proposed for closure. The section beyond Dohazari wouldrequire construction.
Link Bn.3 (Ishurdi-Birol) is a metre gauge line providing a connection to the border withIndia through the border stations of Birol (Bangladesh) and Radhikapur (India). It forms part of a rail and road transit route allowing the flow of Nepal=s third country trade between the India/Nepal border at Jogbani (India)/Biratnagar (Nepal) and the Bangladeshi ports of Chittagong and Mongla. Since at present Link Bn.3 between Ishurdi and Parbatipur is broad gauge only, it is practical to move trade consignments by road between Parbatipur and Chittagong or Mongla, necessitating inter-modal transfer at Parbatipur. The dual gauging ofthe existing broad gauge line between Ishurdi and Parbatipur, now in progress as part of theJamuna River Rail Link project, will allow metre gauge trains to move through to Ishurdi where rail to road transfer can be effected for onward movement to Mongla (which is not yetrail-connected) or directly through to Chittagong.
An alternative rail transit route between Nepal and Bangladesh is available through the Indian border station of Singhabad, opposite Rohanpur in Bangladesh. This route, connecting with the India/Nepal border at Raxaul (India)/Birgunj (Nepal), has the advantageof being entirely broad gauge between Raxaul and Khulna in Bangladesh, where rail to roador rail to barge transfer would occur, for onward movement to Mongla. Consequently,Bangladesh Railway has nominated Link Bn.4 (Abdulpur-Rohanpur) as a key component ofthis route, whose usage will be be further examined.
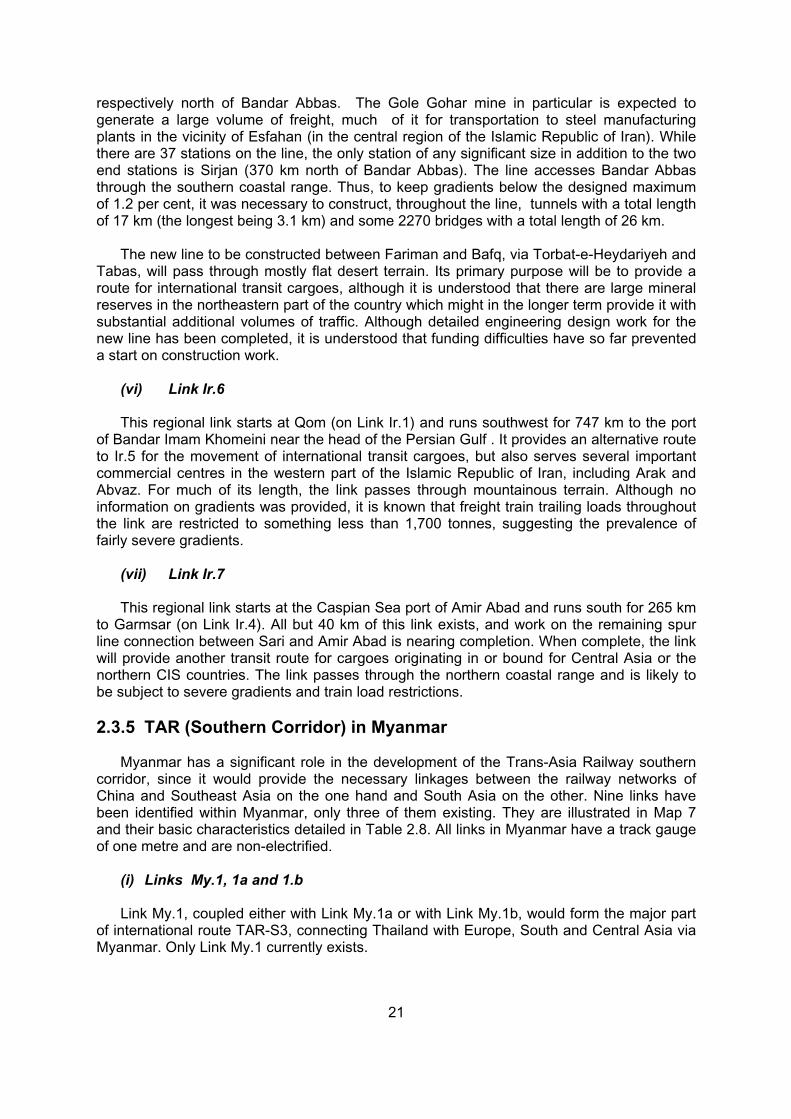
2.3.2 TAR (Southern Corridor) in China
In China, the southern corridor of the Trans-Asian Railway potentially comprises twolinks, as illustrated in Map 4 and detailed in Table 2.5. The first, designated Ch.1 starts inKunming, proceeding in a westerly direction for 365 km to the city of Xiaguan, which is located some 15 km southeast of the important Yunnanese cultural and tourist centre of Dali. The 213 km Guanton-Dali railway line construction project started by the YunnanRailway General Corporation in 1992/93 constitutes part of this link. It is understood that, atthe time of writing (September 1998), this project is complete up to Xiaguan and that the final section from Xiaguan to Dali will be complete by the end of 1998. The link is a singletrack line with a track gauge of 1,435 mm, and while there is provision in the design for its ultimate electrification, it will commence operation with diesel traction. Initially, it passes through undulating terrain, but for the final third of its total length of 365 km, it passes through high mountain terrain - yet it has been designed for a maximum gradient of only 1.2 per cent. Consequently, the new section of the link (between Guanton and Dali) contains 52 tunnels and 100 bridges, the latter with a total length of 50.4 km (or 23 per cent of the wholeline).
11

MAP 4: TRANS-ASIAN RAILWAY SOUTHERN CORRIDOR NETWORK IN CHINA (YUNNAN PROVINCE)
LAO
Fargcheng
Hangzhou
GuangzhouGuangzhouGuangzhou
Kunming
Druzhba
VIET NAMPEOPLE’S
REP.MY
AN
MA
R
DEM.
BEIJINGD. P. RP. KOREA
KAZAKHSTAN
ShanghaiChengdu
Ankang
Baoji
Lanzhou
Wuwei
Quingshui
Zhanjiang
Jayuguan
Daheyan
Dali
Rulli
RUSSIAN FEDERATION
MONGOLIA
The boundaries and namesshown and the designationsused on this map do not implyo ff ic ia l endorsement oracceptance by the UnitedNations.
12

Table 2.5: Basic characteristics of TAR (Southern Corridor) links in China
Route length distribution, by number of tracks andtraction type (Km)
Link/Line Section Trackgauge(mm)
Totallength
Singletrack / non-elec.
Multipletrack / non-elec.
Singletrack / elec.
Multipletrack / elec.
Max.grade
(%)
Min.radius of cuves(metres)
Max.single loco load,( tonnes)
Axle loadlimit(tonnes)
Ch.1
Kunming-Xiaguan 1,435 365 365 1.2 775
Ch.1A
Xiaguan-Ruili(missing link)
1,435(likely)
626 626 1.2 775
TOTAL 991 991
From Xiaguan, there is a proposal to construct a new line connecting the existingrailhead with the China/Myanmar border. This new line, designated Link Ch.1A, would runsouthwest for about 630 km to the border town of Ruili, opposite Mu-se in Myanmar. A fulldescription of this link is provided in Chapter 6.
2.3.3 TAR (Southern Corridor) in India
A total of six TAR links has been nominated for India. They are illustrated in Map 5 andtheir principal characteristics are described in Table 2.6. All but one of these links (In.5b) are currently in place.
(i) Link In.1
This link, forming part of the main intercontinental route TAR-S1, starts at Gede on theIndian side of Bangladesh=s western border and follows the Indian broad gauge east-westtrunkline system up to the border with Pakistan at Attari, passing through Ranaghat, Naihati,Bandel, Saktigarh, Sitarampur, Gaya, Sonnagar, Mughalsarai , Allahabad, Kanpur, Tundla,Aligarh, Ghaziabad, Delhi, Ambala, Sirhind, Ludhiana, Jalandhar, and Amritsar. This linkwhich is entirely broad gauged (1,676 mm) has a total length of 1,975 km, of which 138 km consists of quadrupled track, 127 km of triple track, 1,682 of double track and 28 km ofsingle track line. Additionally, all of the link is electrified except for two sections at theeastern and western extremities : 44 km between Gede and Ranaghat and 268 km betweenAmbala and Attari.
Apart from serving the Indian capital, New Delhi, and providing connections to port facilities at Calcutta and Haldia, the link is used intensively for the rail movement of coal andraw steel products from mines and steel plants in eastern India to power stations andmanufacturing plants in western India. It also provides the sole effective land transportconnection with Pakistan, although there is currently only a limited exchange of freight andpassenger traffic between the Indian border station of Attari and the Pakistani border stationof Wagah.
Since Link In.1 crosses the Northern India plain, for most of its length it has gradients nosteeper than 0.3 - 0.5 per cent, the only gradient of any significance being 1.25 per cent on asection of only 16 km between Mughalsarai and Sitarampur.
13

SHILIGURI
CALCUTTA
HALDIA
VIJAYAWADA
TIRUCHCHIRAPPALLI
ALLAHABAD
KANPUR
GHAZIABAD
RAXAUL
MUGHALSARAI
PATNAVARANASI
HYDERABAD
CHENNAI(MADRAS)
MUMBAI(BOMBAY)
WARANGAL
BHOPAL
NAGPUR
HARSI
SURAT
BARODA
JHANSI
RATLAM
TUTICORIN
ERODE
BANGALORE
AMRITSAR
AMBALA
LUDHIANA
TINSUKIA
LUMDING
LEKHAPANI
BINA PTAWA
KOTA
MATHURA
CHANDRAPUR
ASANSOL GEDESITARAMPUR
GAYA
In.1
In.4
In.5A
In.5BIn.3
In.2
MAP 5: TRANS-ASIAN RAILWAY SOUTHERN CORRIDORNETWORK IN INDIA
ARABIAN SEA
PAKISTAN
SRI LANKA
INDIANOCEAN
BAY OF BENGAL
NEPAL BHUTAN
MYANMAR
BANGLADESH
NEW DELHI
N
RAXAUL
ATTARI
MAHISASAN
GEDE
LEGEND
FUTURE LINK
FUTURE LINK
EXISTING LINK
EXISTING LINK
(route of international significance)
(route of international significance)
(route of subregional significance)
(route of subregional significance)
TAR border station
In.1 TAR link designation
Ports integrated with TAR
Feet Metres
13,123 4,0002,0001,000
500
500 km 330 km
200
6,5623,281
1,640656
0 0
The boundaries and namesshown and the designationsused on this map do not implyo f f i c i a l endo rsement oracceptance by the UnitedNations.
14

Table 2.6:Basic characteristics of TAR (Southern Corridor) links in India
Route length distribution, by number of tracksand traction type (Km)
Link/LineSection
Trackgauge(mm) Total
lengthSingletrack /non-elec.
Multipletrack / non-elec.
Singletrack / elec.
Multipletrack /elec.
Max.grade
(%)
Min.radiusofcurves(metres)
Max.singlelocoload,(tonnes)
Axle loadlimit,(tonnes)
In.1
Gede-Attari 1,676 1,975 28 283 1,664 0.5 20.32
In.2
Delhi-Tuticorin 1,676 2,866 360 2,506 1.7* 20.32
In.3
Mathura-Mumbai 1,676 1,380 1,380 20.32
In.4
Raxaul-Sitarampur
1,676 471 471 20.32
In.5a
Myanmar border-Lekhapani(missing link)
1,676**
45 45 20.32
Lekhapani-Mughalsarai
1,676 1,830 1,075 430 325 20.32
Sub-total In.5a 1,875 1,120 430 325
In.5b
Lumding-Badarpur
1,000 110 110 12.70
Tamu-Jiribam(missing link)
1,676**
180 180
Jiribam-Mahisasan
1,000 160 160 12.70
Sub-total In.5b 450 450
TOTAL 9,017 2,429 713 5,875
* Applying only within a 135 km section Itarsi-Amla** All new construction in India assumed to conform to broad gauge
(ii) Link In.2
This link, also broad gauged for its entire length, constitutes a route of regionalsignificance in that it connects Delhi with the ports of Chennai (Madras) and Tuticorin on the eastern and southern coasts of India respectively. It also provides a transit route for traffic toand from Sri Lanka, which arrives at and departs from the port of Tuticorin. From Delhi, Link In.2 runs for 2,866 km on a north-south axis, passing through the important commercialcentres of Faridabad, Mathura, Agra, Gwalior, Jhansi, Bhopal, Itarsi, Nagpur, Wardha, Vijaywada, Chennai, Salem, Erode and Tiruchchirappalli. The link runs throughpredominantly undulating country and has a maximum gradient of 1.7 per cent within the135 km section between Itarsi and Amla, where it traverses the Mahadeo Range. With theexception of a 39 km section at its northern end between Tuklakabad (Delhi) and Palwal(which is triple tracked and electrified) and a 360 km section at its southern end between Erode and Tuticorin (which is single tracked and non-electrified), the entire link is doubletracked and electrified.
15

(iii) Link In.3
Link In.3 constitutes another route of regional significance, since its primary purpose is to connect Delhi with the two gateway ports in the Mumbai (Bombay) area, i.e. Mumbai andJahawal Nehru ports which together handle nearly 60 per cent of container traffic throughIndia=s principal ports. For its first 130 km (Delhi-Mathura) it shares the alignment of Link In.2. From Mathura it runs for 1,380 km in a southwesterly direction to Mumbai. It passesthrough mainly flat terrain and is broad gauged, multiple tracked and electrified throughout.Important commercial centres served by Link In.3 include Faridabad, Mathura, Kota, Ratlam,Baroda, Bharuch, Mumbai and Vasco.
(iv) Link In.4
Link In.4 provides a regional route for the movement of transit cargoes between Nepaland its principal port outlets in Calcutta and Haldia. This link starts at Raxaul on the India/Nepal border and runs southeast, through predominantly flat terrain, for 471 km to the principal junction station at Sitarampur which is located on Link In.1. From Sitarampur, the link shares the alignment of In.1 for a further 200 km to Calcutta. In early 1998, it was announced that the World Bank would be providing a loan of US$ 27 million to fund construction of an Inland Container Depot at the Nepali border town of Birgunj oppositeRaxaul. The Indian government has agreed to undertake construction of a 5.4 km broadgauge line linking the new ICD with Raxaul. Broadgauging of Link In.4 was completed in 1995. The rail links also exist for connecting the gateway ports of Mumbai and Chennai with the link In.4.
(v) Link In.5a
Link In.5a would provide a connection between the northeastern states and the rest ofIndia. It would also have the potential to provide an international connection with YunnanProvince of China via northern Myanmar should it be decided in the future to construct themissing link along a more northerly alignment. Link In.5a would start at the border betweenIndia and Myanmar, about 45 km east of the existing Indian railhead at Lekhapani in thenortheastern part of Assam state. From Lekhapani, the existing alignment of Link In.5a runsfor 1,830 km east across Assam, West Bengal and Bihar states, passing through the narrow (30 km) passage, known as the Achicken=s neck@ between the borders of Nepal andBangladesh before joining Link In.1 (and international route TAR-S1) at Mughalsarai about 35 km east of the ancient city of Varanasi on the Ganges River. Broadgauging of the link was completed throughout in 1997 and its total length comprises 1074 km of single track,non-electrified line, 430 km of double track, non-electrified line and 325 km of double track,electrified line. Essentially, Link In.5a serves as a Awithin country@ link between theunderdeveloped northeastern states and the industrialized states of northern India. Significant commercial centres served by Link In.5a include Tinsukhia, Dimapur, Lumding(junction with the northeastern metre gauge network), Guwahati (location of the only ICD innortheastern India), New Jalpaiguri, Katihar, Barauni, Patna and Danapur.
(vi) Link In.5b
The final TAR link in India, designated In.5b, has two components. The first is an existingmetre gauge line of about 110 km connecting Lumding (located on Link In.5a) with Badarpur which lies on international Route TAR-S1. The second is part missing link and part existingmetre gauge link joining the border towns of Tamu in Myanmar and Mahisasan on the border with Bangladesh (opposite the Bangladeshi border town of Shahbazpur), via Silchar and Badarpur and having an estimated length of 340 km, of which the existing section from Jiribam (just inside Manipur State) to Marisasan is about 160 km long. The missing section of In.5b is fully described in Chapter 4. The Indian Railways has no immediate plans to build
16

this missing section, but does have a plan for conversion of the existing northeastern metregauge lines to broad gauge within the current five year plan.
2.3.4 TAR (Southern Corridor) in the Islamic Republic of Iran
Seven TAR links have been nominated for the Islamic Republic of Iran. They are illustrated in Map 6 and their primary characteristics detailed in Table 2.7. With the exception of a 92 km section of broad gauge line which extends across the border from Pakistan, all of these links have a track gauge of 1,435 mm.
(i) Link Ir.1
This link, forming part of international route TAR-S1, runs from the border with Pakistanto the border with Turkey, a distance of 2,573 km. From Koh-i-Taftan (Pakistan) it crossesthe border on the single track broad gauge (1,676 mm) line, which runs for 92 km in a northwesterly direction as far as the provincial city of Zahedan. This is the only broad gaugeline in the Islamic Republic of Iran and it is separated from the major portion of the Iranian Islamic Republic Railways system, which has a track gauge of 1,435 mm, by a gap of 545 km, between Zahedan and Kerman. This gap will be eliminated with the completion of a new single track non-electrified line of 1,435 mm gauge linking these two stations. Constructionof this line is presently underway, but progress has been retarded by funding restrictions andby the lack of evidence (to date) that the new line will attract sufficient traffic.
The broad gauge line between the border and Zahedan is owned and maintained by the Iranian Islamic Republic Railways, which also staffs the stations and administers freight handling operations under contract. Pakistan Railways is responsible for the supply ofmotive power and rolling stock, as well as for train operations on the line. Between the border and Zahedan, the only station of any significant size is located at Mirjaveh, 8 km fromKoh-i-Taftan. The line is maintained in operable condition, although the track is unballastedthroughout and passes through flat, sandy terrain. It is the intention of the Iranian Islamic Republic Railways to reconstruct this line on a formation running parallel to the existing alignment, but to 1,435 mm gauge, in conformity with the rest of the system. This wouldresult in creation of a break-of-gauge at the border with Pakistan.
The gap existing between the railheads at Zahedan and Kerman is currently bridged by road transport, although it is understood that comparatively little traffic is generated west ofZahedan.
From Kerman, Link Ir.1 runs in a northwesterly direction to Bafq, which is the junction station for the trunk line running south to the Bandar Abbas port complex. In future, Bafq will also be the junction station for a new line providing a direct link with Central Asia (see section 2.3.4 (i) for more details). From Bafq, the link follows the mainline to Tehran throughMeybod, Bad, Kashan and Qom. Recently, the Iranian Islamic Republic Railways completedthe realignment of this mainline between Bad and Meybod, cutting 100 km off the raildistance between these two stations. Between Kerman and Bad, the link passes throughpredominantly flat terrain, with a maximum gradient of one per cent, but from Bad to Tehranit passes through part of the central mountain range, where maximum gradients of 1.5 per cent are encountered. From Tehran, the route continues on a northwesterly bearing to theborder with Turkey at Razi, passing through the important agricultural and industrial centres of Qazvin, Miyaneh and Tabriz.
17

Ir.1
Ir.1
Ir.4
Ir.5
Ir.5
Ir.1
Ir.3Ir.7
Ir.2
Ir.6
TURKMENISTAN
AFGHANISTAN
PAKISTAN
TURKEY
AZERBAIJAN
IRAQ
CASPIAN SEA
PERSIAN GULF
TEHRAN
KERMAN
BANDAR ABBAS
FAHRAJ
YAZD
MASHHAD
FARIMAN
KASHAN
GARMSAR
BANDAR AMIRABAD
SARAKHS
QOM
ARAK
SIRJANBAM
ZAHEDAN
BAD
DEZFUL
AHWAZ
BANDAR IMAM KHOMEINI
MEYBOD
BAFQ
QAZVIN
SOUFIAN TABRIZ
ESFAHAN
MAP 6: TRANS-ASIAN RAILWAY SOUTHERN CORRIDOR NETWORK IN ISLAMIC REPUBLIC OF IRAN
N
Feet13,123
6,562
3,281
1,640
656
0
Meters4,000
2,000
1,000
500
200
0
280 km170 mi
LEGENDEXISTING LINK(route of international significance)FUTURE LINK(route of international significance)
FUTURE LINK(route of subregional significance)
EXISTING LINK(route of subregional significance)
Ports integrated with TAR
TAR border station
TAR link designationIr.1
SARAKHS
MIRJAVEH
RAZIDJOLFAI
The boundaries and names shownand the designations used on thismap d o n o t im p l y o f f i c i a lendorsement or acceptance by theUnited Nations.
18

Table 2.7 : Basic characteristics of TAR (Southern Corridor) linksin the Islamic Republic of Iran
Route length distribution, by number of tracks and traction type (Km)
Link/Line Section Trackgauge(mm)
Totallength
Singletrack / non-elec.
Multipletrack / non-elec.
Singletrack / elec.
Multipletrack / elec.
Max.grade
(%)
Min.radius of curves(metres)
Max.singleloco load,(tonnes)
Axle loadlimit(tonnes)
Ir.1
Mirjaveh-Zahedan 1,676 92 92 Flat 2,700
Zahedan-Kerman(missing link)
1,435 545 545 Flat toundulating
2,700
Kerman - Sistan 1,435 498 498 1.0 300-500 2,700
Sistan-Qom 1,435 328 328 1.5 300 2,000
Qom-Mianeh 1,435 589 589 1.0-1.5 400 1,700-1,800
Mianeh-Tabriz 1,435 297 297 1.5 300 1,200
Tabriz-Sofian 1,435 31 31 1.5 250 600
Sofian-Razi 1,435 193 193 1.5 250 600
Sub-total Ir.1 1,435 2,573 2,542 31
Ir.2
Julfa-Sofian 1,435 117 117 2.8 600
Ir.3
Sarakhs-Fariman 1,435 164 164 1.2 2,700
Ir.4
Fariman-Tehran 1,435 888 488 400+
Ir.5
Fariman-Bafq (missinglink)
1,435 790 790 Flat 2,700
Bafq-B. Abbas 1,435 635 635 1.2 2,700
Sub-total Ir.5 1,425 1,425
Ir.6
Qom-Bandar Imam 1,435 747 747
Ir.7
Amir Abad-Garmsar 1,435 265 265
TOTAL 6,179 5,631 400+ 148
The link=s total length of 2,573 km includes 545 km of new standard gauge line (once the gap between Kerman and Zahedan has been closed) and 92 km of broad gauge line (fromthe Pakistan border to Zahedan) converted to standard gauge. Except for a 31 km sectionbetween Tabriz and Soufian which was electrified as part of the project to electrify the line from Tabriz to Djolfa, the entire link would consist of single track, non-electrified line.
19

(ii) Link Ir.2
This link of only 117 km provides a regional rail connection between the Islamic Republic of Iran and Azerbaijan. Since it passes through mountainous terrain, the line contains steep gradients throughout (with a maximum of 2.8 per cent). With the 31 km section of Ir.1 from Tabriz to Soufian, the line is the only electrified portion of the Iranian Islamic Republic Railway network .
Owing to internal conflicts within Azerbaijan, however, the border has been closed for some five years and hence the link has been used only for local traffic.
(iii) Link Ir.3
This 164 km link which has been in operation only since May 1996 has the importantfunction of connecting Central Asia with the Iranian Islamic Republic Railway system. Assuch, it forms part of international route TAR-S3. It starts at Sarakhs on the border withTurkmenistan (opposite a border town of the same name within Turkmenistan) and runs west to Fariman. At present Fariman is the junction of the main east-west trunk line toTehran and a branchline running 38 km north to the provincial city and commercial centre of Masshad, but in future will also be the junction with the new line to be constructed fromFariman to Bafq, in order to provide a direct link between Central Asia and Bandar Abbas.
Although gradient details have not been provided for this link, it is considered likely that it would have gradient features similar to those of the Bafq-Bandar Abbas Line, i.e. a maximum gradient of 1.2 per cent, since the maximum trailing tonnages of freight trains on these lines is the same, at 2,700 tonnes. In common with the majority of the railway network in the Islamic Republic of Iran, this link is single tracked and diesel operated.
(iv) Link Ir.4
In the absence of a direct rail connection between Fariman and Bafq, Link Ir.4 provides part of international route TAR-S2 which connects Central Asia with the port complex atBandar Abbas, via Tehran. It commences at Fariman and runs west for 888 km to Tehran.Key commercial centres along this link include Neyshabur, Negh-Ab, Shahrod, Semnan,Varamin and Garmsar.
Owing to its importance as an international transit line, this link is now one of the most densely trafficked parts of the Iranian Islamic Republic Railway system, and priority is being given to increasing its capacity through double tracking. It is understood that approximately 400 km of the mainline between Fariman and Tehran has already been duplicated as part ofa plan to double track the entire link.
(v) Link Ir.5
With Ir.3, this link provides the international route TAR-S3, connecting Central Asia withthe port complex at Bandar Abbas. It has two components. The first is the existing 635 km line running south from Bafq to Bandar Abbas, inauguration of which occurred in March1995. The second is the yet to be constructed direct rail connection between Farimanand Bafq, with an estimated length of 790 km.
20
The Bafq-Bandar Abbas line was completed as a single track, diesel operated line, butplans call for its ultimate duplication and electrification. Apart from serving as a key transit route to and from Central Asia, the line also provides access via branchlines to the GoleGohar iron ore and Sarcheshmeh copper mines, located about 320 km and 420 km
respectively north of Bandar Abbas. The Gole Gohar mine in particular is expected to generate a large volume of freight, much of it for transportation to steel manufacturingplants in the vicinity of Esfahan (in the central region of the Islamic Republic of Iran). While there are 37 stations on the line, the only station of any significant size in addition to the twoend stations is Sirjan (370 km north of Bandar Abbas). The line accesses Bandar Abbas through the southern coastal range. Thus, to keep gradients below the designed maximumof 1.2 per cent, it was necessary to construct, throughout the line, tunnels with a total length of 17 km (the longest being 3.1 km) and some 2270 bridges with a total length of 26 km.
The new line to be constructed between Fariman and Bafq, via Torbat-e-Heydariyeh andTabas, will pass through mostly flat desert terrain. Its primary purpose will be to provide aroute for international transit cargoes, although it is understood that there are large mineral reserves in the northeastern part of the country which might in the longer term provide it withsubstantial additional volumes of traffic. Although detailed engineering design work for the new line has been completed, it is understood that funding difficulties have so far preventeda start on construction work.
(vi) Link Ir.6
This regional link starts at Qom (on Link Ir.1) and runs southwest for 747 km to the portof Bandar Imam Khomeini near the head of the Persian Gulf . It provides an alternative route to Ir.5 for the movement of international transit cargoes, but also serves several importantcommercial centres in the western part of the Islamic Republic of Iran, including Arak andAbvaz. For much of its length, the link passes through mountainous terrain. Although noinformation on gradients was provided, it is known that freight train trailing loads throughoutthe link are restricted to something less than 1,700 tonnes, suggesting the prevalence of fairly severe gradients.
(vii) Link Ir.7
This regional link starts at the Caspian Sea port of Amir Abad and runs south for 265 km to Garmsar (on Link Ir.4). All but 40 km of this link exists, and work on the remaining spurline connection between Sari and Amir Abad is nearing completion. When complete, the link will provide another transit route for cargoes originating in or bound for Central Asia or thenorthern CIS countries. The link passes through the northern coastal range and is likely to be subject to severe gradients and train load restrictions.
2.3.5 TAR (Southern Corridor) in Myanmar
Myanmar has a significant role in the development of the Trans-Asia Railway southern corridor, since it would provide the necessary linkages between the railway networks ofChina and Southeast Asia on the one hand and South Asia on the other. Nine links have been identified within Myanmar, only three of them existing. They are illustrated in Map 7and their basic characteristics detailed in Table 2.8. All links in Myanmar have a track gauge of one metre and are non-electrified.
(i) Links My.1, 1a and 1.b
Link My.1, coupled either with Link My.1a or with Link My.1b, would form the major partof international route TAR-S3, connecting Thailand with Europe, South and Central Asia via Myanmar. Only Link My.1 currently exists.
21

MAWLAMYANG
THANBYUZAYAT
MOKTAMA
TOUNGOO
MANDALAY
LASHIO
KALAY
BAGO
TAUNGGYI
SHWEBO
GANGAW
PAKOKKU
CHAUNG-U
YE
DAWEI
My.1a
My.1a
My.2a
My.3
My.3a
My.1
My.1b
My.1
YANGON
THAILAND
BANGLADESH
LAO P. DEM. R.
CHINA
GULFOF
THAILAND
N
MAP 7: TRANS-ASIAN RAILWAY SOUTHERN CORRIDORNETWORK IN MYANMAR
Feet13,123
6,562
3,281
1,640
656
0
Meters4,000
2,000
1,000
500
200
0
360 km220 mi
EXISTING LINK(route of international significance)
FUTURE LINK(route of international significance)
FUTURE LINK(route of subregional significance)
EXISTING LINK(route of subregional significance)
Ports integrated with TAR
TAR border station
TAR link designation
TAMU
MU-SE
My.1a
My.2
The boundaries and names shown andthe designations used on this map do notimply official endorsement or acceptanceby the United Nations.
22

Table 2.8:Basic characteristics of TAR (Southern Corridor) links in Myanmar
Route length distribution, by number of tracks andtraction type (Km)
Link/Line Section Trackgauge(mm)
Totallength
Singletrack / non-elec.
Multipletrack / non-elec.
Singletrack / elec.
Multipletrack / elec.
Max.grade
(%)
Min.radius ofcurves(metres)
Max.singleloco load(tonnes)
Axle loadlimit,(tonnes)
My.1
Thanbyuzayat-Bago
1,000 270 270 1.0 1,300 12.5
Bago-Kyi Taungkan 1,000 303 303 0.5 1,300 12.5
Kyi Taungkan -Mandalay
1,000 238 238 0.5 1,300 12.5
Sub-total My.1 811 508 303
My.1a
Three Pagoda Pass-Thanbyuzayat.(missing link)
1,000 110 110 1.00* 800*
My.1b
Bongty-Dawei-Thanbyuzayat(missing link)
1,000 345 345 1.00* 800*
My.2a
Mu-se-Lashio(missing link)
1,000 232 232 1.25* 150*
My.2
Lashio-Mandalay 1,000 313 313 4.0 103 220
My.3
Mandalay - Kalay 1,000 539 539
My.3a
Kalay-Tamu(missing link)
1,000 135 135 1.25* 150*
TOTAL 2,140 1,837 303
* Assumed
Links My.1a and My.1b, which would be constructed either as alternative or complementary schemes, are fully described in Chapter 4. Both would connect with thesouthern line of the Myanma Railways which is in current operation between Mawlamyaing(Moulmein) and Ye and is now being extended to Dawei (Tavoy). Link My.1a running from the border with Thailand at Three Pagoda Pass to Thanbyazayat would have a length of 153km, all of which would represent new construction and Link My.1b running from the border atBan Bong Tee to Dawei and then on to Thanbyazayat would have a length of 345 km, of which 110 km would represent new construction.
Link My.1 starts at Thanbyuzayat on this southern line and runs for 811 km north to Mandalay where it connects with Links My.2 and My.3, both forming part of internationalroute TAR-S1. At Mawlamyaing, 70 km north of Thanbyuzayat, all rail traffic is required to cross the Thanlwin (Salween) River by ferry to Moktama (Mataban). The Thanlwin River currently separates the southern line from the rest of the Myanma Railways system and the government of Myanmar has plans to construct a combined road/rail bridge across the river.
23

From Moktama, Link My.1 runs for 196 km in a northwesterly direction to Bago, which is a junction station located on the Yangon - Mandalay trunk line. From Bago, Yangon is 75 kmto the south and Mandalay 545 km to the north. While there are a number of sizeable towns along the trunk line, it is understood that rail freight traffic is heavily oriented to Yangon and Mandalay.
Link My.1 is double tracked for 303 km north of Bago and single tracked thereafter toMandalay. Throughout the link, gradients are not severe, with maxima of one per cent and 0.5 per cent south of Bago and north of Bago, respectively, but between Mawlamyaing and Ye, the minimum radius of curvature is only 146 metres as a consequence of which freighttrain speeds are limited to only 24 km per hour.
(ii) Links My.2, My.2a, My.3 and My.3a
These would form part of international route TAR-S1.
Link My.2a is a missing link, which is described fully in Chapter 4. It would begin at border with China at Mu-se (opposite Ruili in China) and run on a south-westerly bearing to the important commercial centre and railhead of Lashio, in northeastern Myanmar. It wouldhave a total length of 232 km, all of it passing through adverse mountainous terrain.
Link My.2, connecting Lashio with Mandalay, is an existing branchline which suffers from poor alignment and receives limited maintenance, as a consequence of which freight train speeds and trailing loads are severely restricted. The steepest gradients (maximum 4.0per cent) and tightest curves (minimum radius 103 metres) on this link are encounteredbetween Kyaukme-Pyin Oo Lwin, necessitating a tonnage limitation on 2000 HP locomotivesof only 220 tonnes and freight train speeds of only 22 km per hour within this critical section.These difficulties are compounded by the presence of several switchbacks or reversingtracks, which have the effect of reducing average operating speeds over the entire link touncommercial levels. It is likely, therefore, that the entire link of 313 km between Lashio andMandalay would require complete reconstruction on an improved alignment if it is to be used for the transit of freight trains of economic size in future years.
Link My.3 would begin at Mandalay, running for about 670 km in a westerly direction to the border with India (Manipur State) at Tamu. Recently, the Myanma Railways havecompleted a programme of new line construction to the west of the Chindwwin River. As at November 1997 when an ESCAP mission to Myanmar was conducted in connection with this project, a new line had been constructed from the western bank of the Chindwwin Riveropposite Chaung-U to Pakokku, a major provincial city near the confluence of the Chindwwinand Ayerwaddy Rivers, and then to Kyaw near the boundary of Magway State and the westernmost Chin State. Also, a line had by then been constructed north from Gangaw(about 30 km north of Kyaw) to Kalay, another significant provincial centre. A bridge with an overall length of 2.1 km and a tunnel with a length of 1.7 km remained to be constructedacross the Chindwwin River at Chaung U and through the Ponnyadaung Hills between Kyawand Gangaw, respectively. Completion of the bridge was expected by the end of 1998 and ofthe tunnel by the end of 1999. Upon completion of these works, through rail transit will be possible between Lashio and Kalay.
Link My.3a would be a northern extension of My.3 from Kalay to the official bordercheckpoint between Myanmar and India at Tamu - a distance of about 135 km. AlthoughMyanma Railways have firm plans for construction of this link, funding difficulties are likely todelay the commencement of this project.
24

Except for the 30 km section between Kyaw and Gangaw , where it is required to crosslow mountains, the link appears to pass through predominately flat to undulating terrain.From Gangaw north to Kalay, severe gradients appear to have been avoided by routing the link through the Myittha River valley.
2.3.6 TAR (Southern Corridor) in Pakistan
Five links have been nominated for the Trans-Asian Railway network in Pakistan. Theyhave been designated Pk.1 to Pk.5 and are illustrated in Map 8, with their basiccharacteristics described in Table 2.9. All of the nominated links in Pakistan are existing andhave a track gauge of 1,676 mm.
(iii) Link Pk.1
This link which has a total length of 1,730 km makes up the entirety of international routeTAR-S1 within Pakistan. It runs from the border with India to the border with the Islamic Republic of Iran, essentially following an east-west alignment.
The link starts at Wagah, the border station opposite Attari in India. From Wagah, it runs west to Lahore, the capital of Pakistan=s Punjab Province, which is 23 km from the border. The Wagah-Lahore section is double tracked but not electrified. Apart from being a major commercial and freight distribution centre, Lahore is also headquarters of the PakistanRailways and has major train marshalling, container dry port and railway workshop facilities.
From Lahore, Link Pk.1 follows the electrified double tracked trunk line in a southwesterly direction for 40 km to Raiwind. From Raiwind, the line reverts to single track,but remains electrified for another 245 km as far as Khanewal. From Khanewal there are twoalternative lines which can be taken to Lodhran: the shorter of the two (91 km) is known as the Achord line@ while the longer line (136 km) detours via the historically and commercially significant city of Multan and is known as the Aloop line@. The shorter line has been designated part of Link Pk.1 and the longer line, part of Link Pk.5 which also serves theimportant commercial centre of Faisalabad. From Lodhran, Link Pk.1 continues in asouthwesterly direction to the major junction station of Rohri, from which point a link designated as Pk.3 proceeds south to Karachi and Link Pk.1 proceeds northwest towards the borders with Afghanistan and the Islamic Republic of Iran.
From Rohri, the link passes through fertile plains in the Indus River valley, crossing the river on a 350 metre long steel arch bridge between Rohri and the historical city of Sukkur.Further to the northwest, the link passes through sandy plains to Jacobad and then on through rising terrain to Sibi and Abi-Gum. From Abi-Gum, mountainous terrain withgradients as steep as four per cent is encountered as the line proceeds through the Bolan Pass to Kolpur and Spezand. The 38 km section between Abi Gum and Kolpur, whichcontains the steepest gradients has in fact been duplicated in order to increase track capacity. Nevertheless, trailing loads for a single 2000 HP locomotive through this section are restricted to only 600 tonnes, as compared with nearly double and more three times this tonnage north and south of this section respectively.
Spezand is a major junction station, from which a link designated as Pk.2 proceeds norththrough Quetta to near the border with Afghanistan at Chaman and Link Pk.1 heads westtowards the border with the Islamic Republic of Iran. Between Spezand and the next major station, Nokundi, the link passes through sandy plains, before climbing through mountainous terrain to reach the border with the Islamic Republic of Iran at Koh-i-Taftan.
25
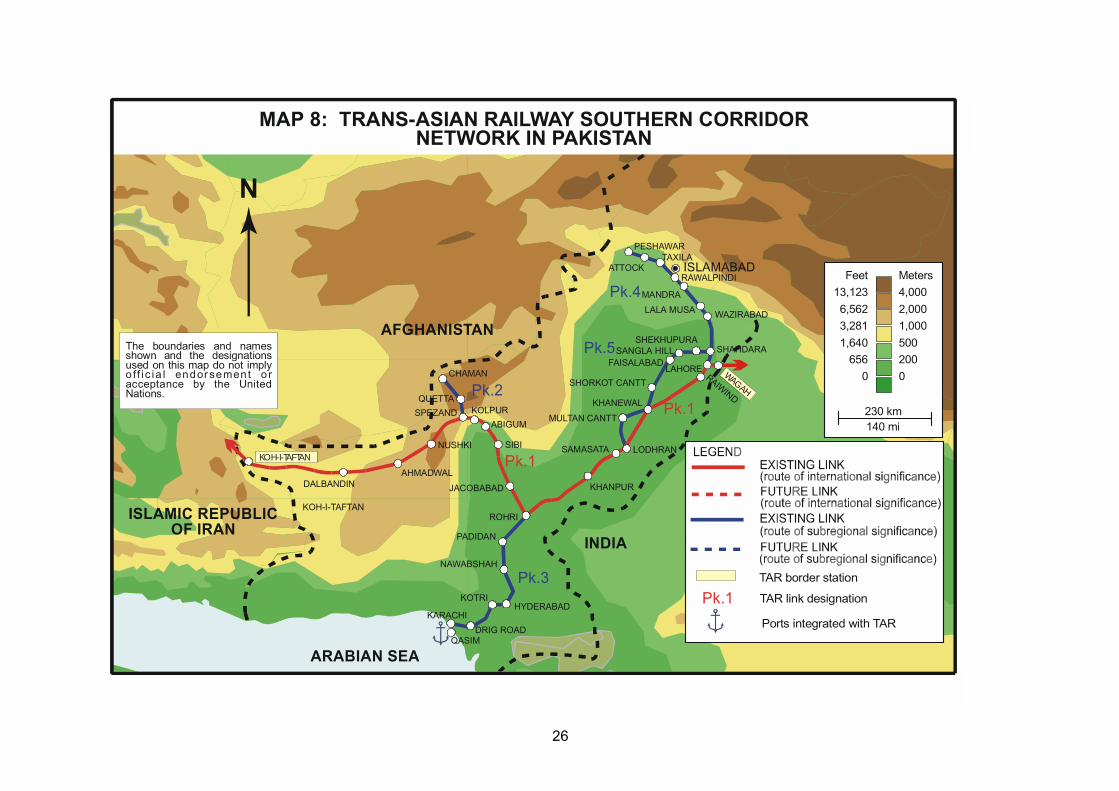
Feet
13,123
6,562
3,281
1,640
656
0
Meters
4,000
2,000
1,000
500
200
0
230 km140 mi
Ports integrated with TAR
TAR border station
TAR link designation
AFGHANISTAN
ISLAMIC REPUBLIC OF IRAN
INDIA
Pk.1
Pk.1
Pk.1
Pk.2
Pk.3
Pk.5
Pk.4
ARABIAN SEA
JACOBABAD
ROHRI
SIBI
ABIGUMSPEZAND
QUETTAKOLPUR
CHAMAN
NUSHKI
AHMADWAL
KOH-I-TAFTAN
DALBANDIN
KARACHI
DRIG ROAD
HYDERABAD
QASIM
NAWABSHAH
PADIDAN
KHANPUR
MULTAN CANTT
KHANEWAL
SAMASATA LODHRAN
RAIWIND
SHAHDARA
WAZIRABADLALA MUSA
ATTOCK
MANDRA
FAISALABADSANGLA HILL
SHORKOT CANTT
SHEKHUPURA
LAHORE
PESHAWARTAXILA
RAWALPINDIISLAMABAD
N
MAP 8: TRANS-ASIAN RAILWAY SOUTHERN CORRIDORNETWORK IN PAKISTAN
WAGAH
KOH-I-TAFTAN
The boundaries and namesshown and the designationsused on this map do not implyo ff i c ia l endorsement o racceptance by the UnitedNations.
KOTRI
26
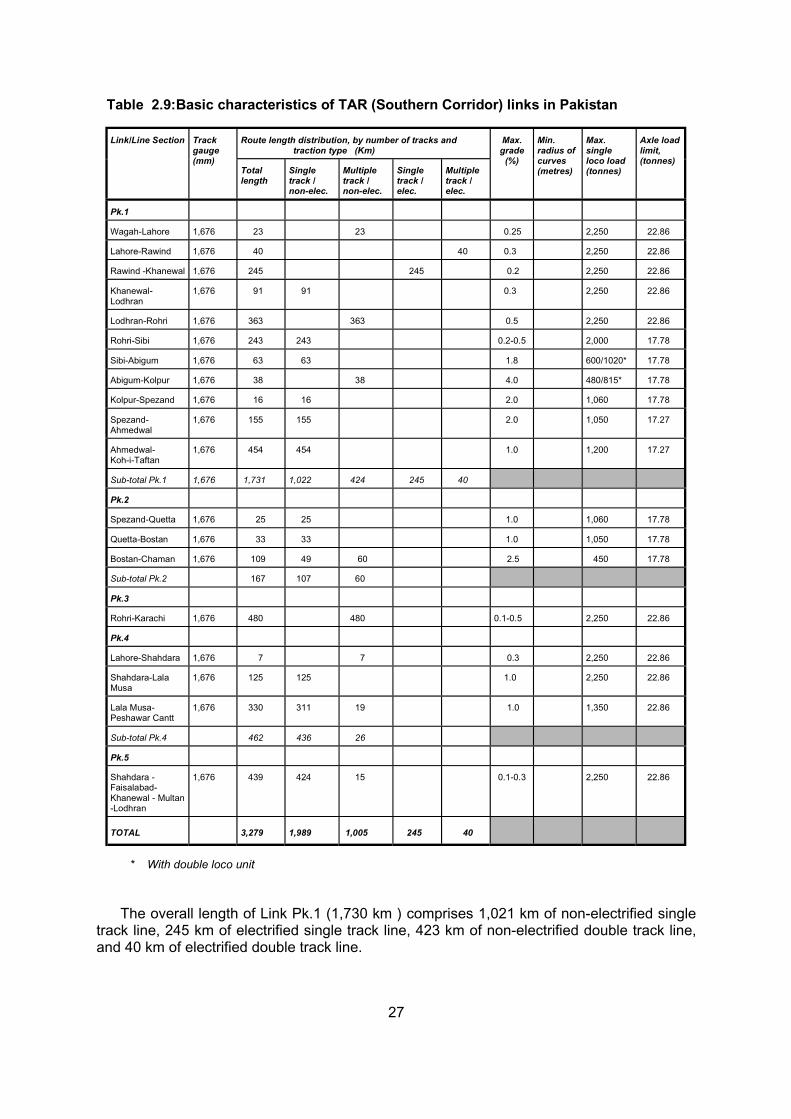
Table 2.9:Basic characteristics of TAR (Southern Corridor) links in Pakistan
Route length distribution, by number of tracks andtraction type (Km)
Link/Line Section Trackgauge(mm)
Totallength
Singletrack / non-elec.
Multipletrack / non-elec.
Singletrack / elec.
Multipletrack /elec.
Max.grade
(%)
Min.radius ofcurves(metres)
Max.singleloco load(tonnes)
Axle loadlimit,(tonnes)
Pk.1
Wagah-Lahore 1,676 23 23 0.25 2,250 22.86
Lahore-Rawind 1,676 40 40 0.3 2,250 22.86
Rawind -Khanewal 1,676 245 245 0.2 2,250 22.86
Khanewal-Lodhran
1,676 91 91 0.3 2,250 22.86
Lodhran-Rohri 1,676 363 363 0.5 2,250 22.86
Rohri-Sibi 1,676 243 243 0.2-0.5 2,000 17.78
Sibi-Abigum 1,676 63 63 1.8 600/1020* 17.78
Abigum-Kolpur 1,676 38 38 4.0 480/815* 17.78
Kolpur-Spezand 1,676 16 16 2.0 1,060 17.78
Spezand-Ahmedwal
1,676 155 155 2.0 1,050 17.27
Ahmedwal-Koh-i-Taftan
1,676 454 454 1.0 1,200 17.27
Sub-total Pk.1 1,676 1,731 1,022 424 245 40
Pk.2
Spezand-Quetta 1,676 25 25 1.0 1,060 17.78
Quetta-Bostan 1,676 33 33 1.0 1,050 17.78
Bostan-Chaman 1,676 109 49 60 2.5 450 17.78
Sub-total Pk.2 167 107 60
Pk.3
Rohri-Karachi 1,676 480 480 0.1-0.5 2,250 22.86
Pk.4
Lahore-Shahdara 1,676 7 7 0.3 2,250 22.86
Shahdara-LalaMusa
1,676 125 125 1.0 2,250 22.86
Lala Musa-Peshawar Cantt
1,676 330 311 19 1.0 1,350 22.86
Sub-total Pk.4 462 436 26
Pk.5
Shahdara -Faisalabad-Khanewal - Multan-Lodhran
1,676 439 424 15 0.1-0.3 2,250 22.86
TOTAL 3,279 1,989 1,005 245 40
* With double loco unit
The overall length of Link Pk.1 (1,730 km ) comprises 1,021 km of non-electrified singletrack line, 245 km of electrified single track line, 423 km of non-electrified double track line,and 40 km of electrified double track line.
27

(ii) Link Pk.2
This link, with a total length of 167 km, has the important regional transport function ofproviding a connection, in combination with Pk.1 and Pk.3, between southern Afghanistanand the ports of Karachi and Qasim. The link starts from the junction station of Spezand,running north to Quetta, the capital of Beluchistan Province and a coal mining centre. From Quetta, the link proceeds through rising terrain (with a maximum gradient of about one per cent) to Gulistan from which point mountainous terrain starts and continues almost up to theend station at Chaman, two km from the border with Afghanistan. Gradients in the final 60 km section between Gulistan and Chaman are as steep as 2.5 per cent and the sectioncontains the longest tunnel on the Pakistan Railway system, with a length of nearly four km.Double track has been provided in this steeply graded section in order to increase line capacity.
(iii) Link Pk.3
This link connects Karachi and Qasim ports with the hinterland of Pakistan and withAfghanistan. It starts at the junction with Link Pk.1 at Rohri, from there running south to theindustrial city of Hyderabad and then southwest to Karachi. For most of its length of 480 km,it passes through flat, cultivated plain in the Indus River valley. For its entire length it is double tracked, but non-electrified.
Both ports, at Karachi and Port Qasim, are rail connected. Karachi Port handlesapproximately 25 million tonnes of cargo annually and Port Qasim (30 km from Karachi Port) about 13 million tonnes annually. Karachi with a population greater than 10 million is the largest city in Pakistan and amongst the largest in Asia.
(iv) Link Pk.4
The primary purpose of this regional link is to provide a connection from the Pakistani capital city of Islamabad and its twin city, Rawalpindi, to the port city of Karachi, as well as to the main international route TAR-S1. In addition, however, this link provides a road/railconnection between the Afghanistani capital city, Kabul, and Karachi/Qasim ports.
The link starts from Lahore, running for 462 km in a northwesterly direction via Rawalpindi to Peshawar, the capital city of Northwest Frontier Province and a key tradingcentre with a dry port. In fact, the line continues for 51 km beyond Peshawar via the KhyberPass through the Hindu Kush mountains to Landi Khotal, but this section suffers from steep gradients necessitating the use of switchbacks, or reversing tracks, as a consequence ofwhich freight trains terminate at Peshawar and Goods in Transit to Afghanistan (GITA) aretransferred to road vehicles for the journey across the border at Torkham (which is 66 km from Peshawar).
The entire length of Pk.4 is non-electrified and single tracked with the exception of shortdouble track sections between Lahore and Shahdara (7 km) and between Chaklala and Golra Sharif (19 km). For most of the distance between Lahore and Peshawar, the link passes through nearly flat terrain. Rising terrain is encountered between Rawalpindi andPeshawar, but gradients are generally no more than one per cent.
In addition to Islamabad and Peshawar, important cities or towns along this link includeShahdara (7 km from Lahore) which is the junction with Link Pk.5 serving Faisalabad andMultan, Chaklala (near Rawalpindi) which is the location of a major marshalling yard and dry port, and Rawalpindi a city of 1.5 million people and an important commercial centre.
28

(v) Link Pk.5
This is a regional link connecting the commercial centres of Faisalabad and Multan withthe key international route TAR-S1, and via Links Pk.1 and Pk.3, with Karachi and Qasim ports. The link starts at the junction with Link Pk.4 at Shahdara and follows a generallynortheast-southwest axis, passing through Faisalabad, Shorkot, and Multan, to Lodhran onLink Pk.1. Its overall length is 439 km, all non-electrified and, with the exception of a 15 km section between Multan and Shershah, all single track. For its entire length it passes through almost flat terrain. Faisalabad, a substantial agricultural and industrial centre, with apopulation of 1.3 million, has its own dry port.
2.3.7 TAR (Southern Corridor) in Sri Lanka
Sri Lanka could be connected to the southern corridor of the Trans-Asian Railwaynetwork in two ways. First, there is a 280 km shipping link between Colombo and the port of Tuticorin in southern India and second there is a 35 km ferry link between the port of Talaimannar in northwestern Sri Lanka and the port of Rameswaram in southern India.4 The first option is considered preferable to the second, since the port of Tuticorin is beingdeveloped to handle container traffic and is connected to the Indian Railways broad gaugesystem, whereas Rameswaram is a small port city with a strong religious significance andconsequently is oriented to handling passenger traffic, with only very limited capacity forcargo transfer. Further, Rameswaram is linked to Chennai (Madras) only by a metre gaugeline which is heavily utilized for local passenger traffic, with little prospect of conversion to broad gauge in future. For the latter reasons, the Madras-Rameswaram line has not beennominated by the Indian Railways as a TAR link.
Nevertheless, both sea transport options have been retained in this study to allow for thepossibility of future traffic transfer between northern Sri Lanka and India.
Two TAR links, designated Sl.1 and Sl.2 with a combined route length of 496 km, havebeen nominated for Sri Lanka - they are illustrated in Map 9 and their basic characteristicsdescribed in Table 2.10. Both links have a track gauge of 1,676 mm.
Link Sl.1 starts from Matara, the terminus of the southern railway on the south coast of Sri Lanka and runs via the old port city and southern administrative centre of Galle to Colombo, for a distance of 159 km. This link is non-electrified and single tracked with theexception of the final 28 km from Panadura to Colombo which is double tracked. For itsentire length, Link Sl.1 follows the coastline through flat coastal terrain.
Link Sl.2 starts from Colombo, running via Ragama, Polgahawela, Anuradhapura andMedawachchiya to Talaimannar Pier, for a distance of 337 km. This link is non-electrifiedand single tracked, with the exception of a 14 km section between Colombo and Ragamawhich is triple tracked and a 58 km section from Ragama to Polgahawela (the junction forthe line to Kandy) which is double tracked. The link encounters rising terrain about 25 km to the southwest of Polgahawela and this continues intermittently through to Anuradhapurafrom which point the line follows flat terrain for the remaining distance to its terminus atTalaimannar Pier. Advice has been received that the present condition of the track beyond Medawachchiya (the junction with the line to Jaffna) is unsuitable to sustain traffic, especiallycontainer traffic, for the TAR,
4 This ferry service which, since its inauguration in 1929, provided a three times weekly connection withIndia is currently not in operation due to the civil war in the north of Sri Lanka.
29

MAP 9: TRANS-ASIAN RAILWAY SOUTHERN CORRIDORNETWORK IN SRI LANKA
GALLE
MATARA
PANADURA
RAGANA
KANDY
MAHO
ANURADHAPURA
POLGAHAWELA
KURUNEGALA
BATTICALOA
TRINCOMALEEMEDAWACHCHIYA
JAFFNA
RA
ME
SW
AR
AM
SHIPPING SERVICE
FERRY SERVICE TO RAMESWARAM(NOT CURRENTLYOPERATIONAL)
TO TUTICORIN
TELAIMANNAR PIER
COLOMBO
GULFOF
MANNAR
INDIA
BAY OF BENGAL
Sl.1
Sl.1
Sl.2
N
LEGENDEXISTING LINK(route of international significance)
FUTURE LINK(route of international significance)
FUTURE LINK(route of subregional significance)
EXISTING LINK(route of subregional significance)
Ports integrated with TAR
TAR link designation
Feet
13,123
6,562
3,281
1,640
656
0
Meters
4,000
2,000
1,000
500
200
0
81 km50 mi
Sl.1
The boundaries and namesshown and the designationsused on this map do not implyof f ic i a l endo rsement oracceptance by the UnitedNations.
30

and that upgrading of this section would have to be contemplated following the cessation ofhostilities in the area.
Table 2.10: Basic characteristics of TAR (Southern Corridor) links in Sri Lanka
Route length distribution, by number of tracks and traction type (Km)
Link/Line Section Trackgauge(mm)
Totallength
Singletrack / non-elec.
Multipletrack / non-elec.
Singletrack / elec.
Multipletrack / elec.
Max.grade
(%)
Min.radius of curves(metres)
Max.singleloco load(tonnes)
Axle loadlimit,(tonnes)
Sl.1
Matara-Colombo 1,676 159 131 28 Flat 16.5
Sl.2
Colombo-Talaimannar Pier
1,676 337 265 72 Flat-rising
16.5
Talaimannar Pier-Rameswaran(ferry link)
35
TOTAL 531 396 100
2.3.8 TAR (Southern Corridor) in Thailand
There are currently no connections between the railway systems of Thailand andMyanmar. The westernmost railhead in Thailand is located at Nam Tok, some 77 km west ofKanchanaburi and 210 km west of Bangkok. Recently, consultants engaged by the Government of Malaysia to evaluate the feasibility of various connections as part of the Singapore-Kunming Rail Link Feasibility Study have undertaken an alignment survey of arail link between Nam Tok in Thailand and Thanbyuzayat in Myanmar, via the border checkpoint at Three Pagoda Pass. No other direct connection between the existing rail systems of Thailand and Malaysia was evaluated by the consultants, although the possibilityof another connection via Ban Bong Tee and Dawei (Tavoy) was raised in discussions of theSpecial Working Group established for this study. In the absence of any evidence that this link would be technically or financially infeasible, it has been considered desirable to includeit as part of the southern corridor network of the Trans-Asian Railway, either in conjunctionwith, or as an alternative to, the link via Three Pagoda Pass.
The two TAR links for Thailand have been designated Th.1a and Th.1b. They areillustrated in Map 10 and their basic characteristics described in Table 2.11. However, they have also been subjected to financial and economic appraisal in Chapter 4.
Both links would start from Nam Tok, but while Link Th.1a would run for 153 km on anorthwesterly bearing to the border checkpoint of Three Pagoda Pass, while Link Th.1bwould run almost due west to the Thailand/Myanmar border at Bongty, a distance of only about 40 km.
31
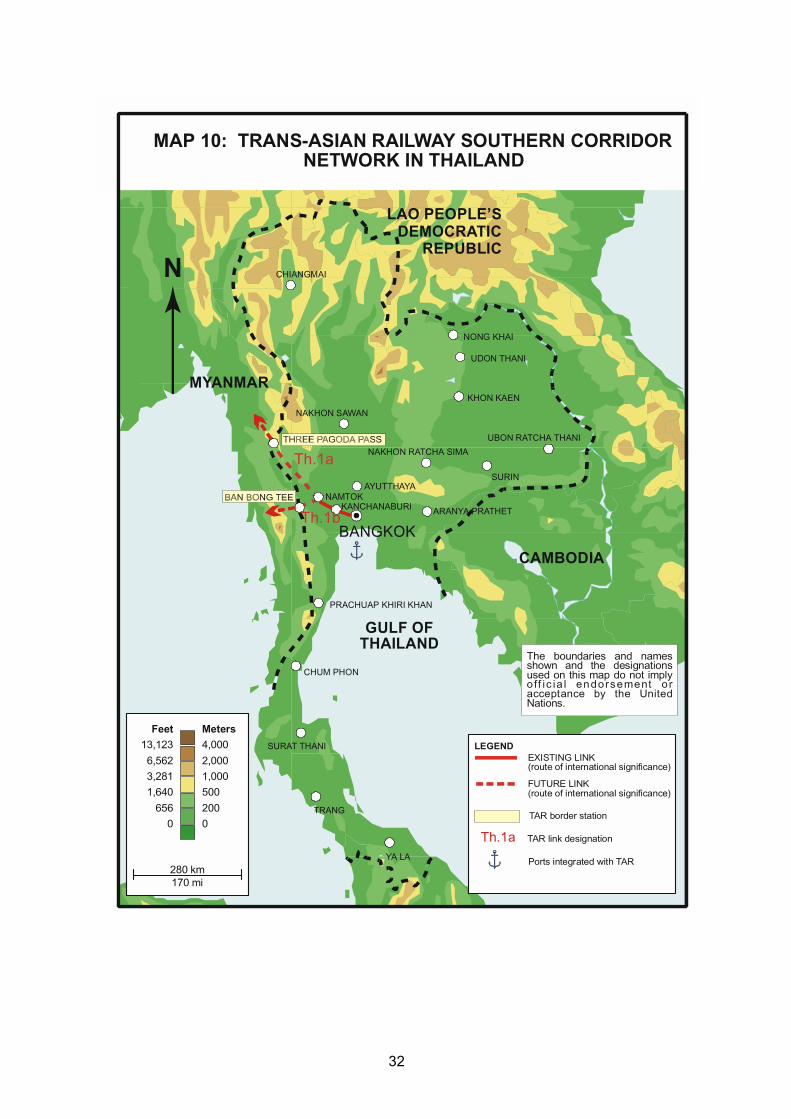
YA LA
TRANG
SURAT THANI
CHUM PHON
PRACHUAP KHIRI KHAN
UBON RATCHA THANI
NAKHON RATCHA SIMA
KANCHANABURI ARANYA PRATHET
SURIN
NAMTOKAYUTTHAYA
NAKHON SAWAN
KHON KAEN
NONG KHAI
UDON THANI
CHIANGMAI
Th.1a
Th.1a
Th.1bBANGKOK
CAMBODIA
GULF OF THAILAND
LAO PEOPLE’SDEMOCRATIC
REPUBLIC
MYANMAR
ANDAMANSEA
N
MAP 10: TRANS-ASIAN RAILWAY SOUTHERN CORRIDOR NETWORK IN THAILAND
Feet13,123
6,562
3,281
1,640
656
0
Meters4,000
2,000
1,000
500
200
0
280 km170 mi
LEGENDEXISTING LINK(route of international significance)
FUTURE LINK(route of international significance)
Ports integrated with TAR
TAR border station
TAR link designationTh.1a
The boundaries and namesshown and the designationsused on this map do not implyoff ic ia l endorsement o racceptance by the UnitedNations.
32

Table 2.11: Basic characteristics of TAR (Southern Corridor) links in Thailand
Route length distribution, by number of tracks and traction type (Km)
Link/Line Section Trackgauge(mm)
Totallength
Singletrack / non-elec.
Multipletrack / non-elec.
Singletrack / elec.
Multipletrack / elec.
Max.grade
(%)
Min.radius of curves(metres)
Max.singleloco load(tonnes)
Axle loadlimit,(tonnes)
Th.1a
Nam Tok - ThreePagoda Pass (missing link)
1,000 153 153 1.0 800* 20.0*
Th.1b
Nam Tok -Bongty 1,000 40 40 1.0 800* 20.0*
TOTAL 193 193
* Assumed
2.3.9 TAR (Southern Corridor) in Turkey
Turkey is significant as the western extremity of the southern corridor of the Trans-AsianRailway between Asia and Europe. It is also significant as the connection between theEuropean and Asian continents.
The Straits of Bosphorus (at the northern end of the Sea of Marmara) and of Dardenelles(at the southern end) provide the dividing line between the European and Asian portions ofTurkey.
Currently, the Strait of Bosphorus is spanned by two highway suspension bridges - theFatih Sultan Mehmet Bridge and the Bosphorus Bridge. The railway networks on either side of the Bosphorus are connected by ferry services with vessels fitted with rail decks.
Five TAR links, designated Tk.1 - Tk.5, have been nominated for Turkey. They areillustrated in Map 11 and Table 2.12. All links within Turkey are of 1,435 mm (standard) gauge.
(i) Link Tk.1
This is the main east-west trunk line which forms international route TAR-S1 withinTurkey. It runs from the checkpoint on the border with the Islamic Republic of Iran at Kapicöy to the border with Bulgaria at Kapikule (opposite Svilengrad in Bulgaria), an overall distance of 2,354 km. Exchange of traffic with the standard gauge railway system of Turkey occurs at the Turkish border station of Kapicöy, opposite Razi in the Islamic Republic of Iran. From Kapiköy, Link Tk.1 proceeds due west through rising terrain (with a maximum gradient of 1.6per cent) to the ferry terminal at Van on the eastern shore of Lake Van. At Van, trains arriving from Kapicöy are dissembled into short rakes for loading onto ferries for the 91 km east-west crossing of Lake Van, which currently takes 4-5 hours. The Turkish Railways have a plan to construct a line around the northern shore of Lake Van which would avoid the needfor the lake crossing, but the funding arrangements for this project have yet to be finalized.
33

I SL
AM
ICR
EP
UB
LIC
OF
IRA
N
Feet
13,123
6,562
3,281
1,640
656
0
Meters
4,000
2,000
1,000
500
200
0
190 km120 mi
LEGENDEXISTING LINK(route of international significance)
FUTURE LINK(route of international significance)
FUTURE LINK(route of subregional significance)
EXISTING LINK(route of subregional significance)
Ports integrated with TAR
TAR border station
TAR link designationLEBANON
SYRIAN ARABREPUBLIC
CYPRUS
ARIFIYE
HAYDARPASA
ESKISEHIR
SINCANKIRIKKALE
KAYSERI
MALATYA
CETINKAYA
BOSTANKAYA
DIVRIGI
SIVASKALIN
SAMSUN
ISKENDERUN
TOPRAKKALEADANA
MERSIN
ERZURUM
MEZRA
KARS
TATVAN VAN
MAP 11: TRANS-ASIAN RAILWAY SOUTHERN CORRIDORNETWORK IN TURKEY
NBULGARIA
MEDITERRANEAN SEA
BLACK SEA
ANKARA
Tk.1
Tk.1
Tk.1
Tk.1
Tk.2
Tk.2ATk.2
Tk.3
Tk.3
Tk.4
Tk.5
ISTANBUL
ISL
AM
ICR
EP
UB
LIC
OF
IRA
NA
RM
EN
IA
GEORGIA
KAPIKULE
DOGUKAPI
KAPIKOY
AKTAS
Lake Van
The boundaries and namesshown and the designationsused on this map do not implyo f f i c i a l end orse me nt o racceptance by the UnitedNations.
(route of international significance)EXISTING LINK (BY FERRY)
34


3. ROUTE CHOICES FOR USERS OF TAR SERVICES
Freight transport decisions within the southern corridor served by the Trans-AsianRailway will be made on the basis of the cost, frequency, guaranteed consignment delivery times and reliability of services provided by competing transport modes. In this corridor, rail=smajor competitors are sea transport for intercontinental and long distance regional freightmovement and road transport for shorter distance regional freight movement. A comparisonof the transport packages on offer to freight shippers within the corridor from alternative transport modes is provided in Chapter 8.
However, for given transport modes, a range of route choices is also available to existing and potential freight shippers. In the case of rail transport between the end points ofthe southern corridor, the range of route choice is particularly wide and will critically influence shipper transport strategies for the corridor. Relative distances are not the sole factorinfluencing these strategies. When rail routes suffer from operational disabilities such as limited track capacity, poor physical alignment and neglected maintenance, distanceadvantages will very often be insufficient to compensate for these disabilities. If it is known,however, that particular rail routes do not suffer from substantial disabilities of this type thena significant distance advantage over potentially competing routes will invariably attract shipper patronage away from the latter. This chapter examines some of the rail route choices available to freight shippers in the TAR southern corridor. This analysis of routechoices has been undertaken from the perspective of existing or potential rail shippers located at the eastern and western extremities of the corridor - i.e. shipping lines and freightforwarders / multimodal transport operators based in Kunming, Bangkok and locations inCentral Asia.
The distance matrix in Table 3.1 has been used as a basis for assessing these route choices.
3.1 Rail route choices, Kunming - Europe and Kunming - Central Asia and Islamic Republic of Iran
From Kunming, rail freight shippers would in future have two main route alternatives for moving their consignments to/from Europe, Central Asia and the northern part of the Islamic Republic of Iran.
The first would essentially involve by-passing the TAR southern corridor and utilizing the existing north-south rail routes within China (via either Chengdu or Chongqing) to link upwith the railway network of Kazakhstan at the border station of Drujba (opposite Alashenkoin China). These routes are illustrated in Map 4. This alternative is currently available toshippers, since all components of the through routes to Europe and the Central Asian Republics are in place and are understood to be of trunk line standard. Apart from having topass through mountainous terrain in Western China, they are not considered to suffer from any significant operational disabilities.
The second would involve utilizing TAR international route TAR-S1, as identified in Chapter 2. Unlike the northerly routes through China, this route is not currently continuous,with physical gaps or Amissing links@ existing in several places.
The comparative distances associated with these route alternatives are given in Table3.2.
38
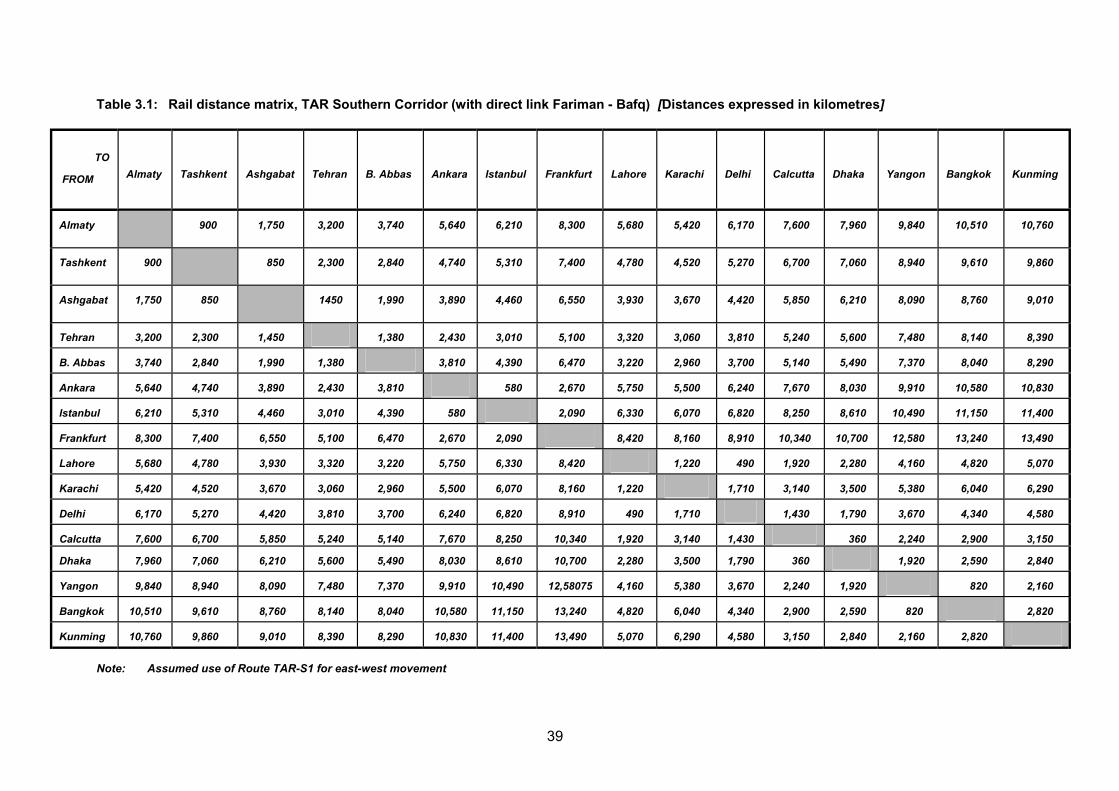
Table 3.1: Rail distance matrix, TAR Southern Corridor (with direct link Fariman - Bafq) [Distances expressed in kilometres]
TO
FROM Almaty Tashkent Ashgabat Tehran B. Abbas Ankara Istanbul Frankfurt Lahore Karachi Delhi Calcutta Dhaka Yangon Bangkok Kunming
Almaty 900 1,750 3,200 3,740 5,640 6,210 8,300 5,680 5,420 6,170 7,600 7,960 9,840 10,510 10,760
Tashkent 900 850 2,300 2,840 4,740 5,310 7,400 4,780 4,520 5,270 6,700 7,060 8,940 9,610 9,860
Ashgabat 1,750 850 1450 1,990 3,890 4,460 6,550 3,930 3,670 4,420 5,850 6,210 8,090 8,760 9,010
Tehran 3,200 2,300 1,450 1,380 2,430 3,010 5,100 3,320 3,060 3,810 5,240 5,600 7,480 8,140 8,390
B. Abbas 3,740 2,840 1,990 1,380 3,810 4,390 6,470 3,220 2,960 3,700 5,140 5,490 7,370 8,040 8,290
Ankara 5,640 4,740 3,890 2,430 3,810 580 2,670 5,750 5,500 6,240 7,670 8,030 9,910 10,580 10,830
Istanbul 6,210 5,310 4,460 3,010 4,390 580 2,090 6,330 6,070 6,820 8,250 8,610 10,490 11,150 11,400
Frankfurt 8,300 7,400 6,550 5,100 6,470 2,670 2,090 8,420 8,160 8,910 10,340 10,700 12,580 13,240 13,490
Lahore 5,680 4,780 3,930 3,320 3,220 5,750 6,330 8,420 1,220 490 1,920 2,280 4,160 4,820 5,070
Karachi 5,420 4,520 3,670 3,060 2,960 5,500 6,070 8,160 1,220 1,710 3,140 3,500 5,380 6,040 6,290
Delhi 6,170 5,270 4,420 3,810 3,700 6,240 6,820 8,910 490 1,710 1,430 1,790 3,670 4,340 4,580
Calcutta 7,600 6,700 5,850 5,240 5,140 7,670 8,250 10,340 1,920 3,140 1,430 360 2,240 2,900 3,150
Dhaka 7,960 7,060 6,210 5,600 5,490 8,030 8,610 10,700 2,280 3,500 1,790 360 1,920 2,590 2,840
Yangon 9,840 8,940 8,090 7,480 7,370 9,910 10,490 12,58075 4,160 5,380 3,670 2,240 1,920 820 2,160
Bangkok 10,510 9,610 8,760 8,140 8,040 10,580 11,150 13,240 4,820 6,040 4,340 2,900 2,590 820 2,820
Kunming 10,760 9,860 9,010 8,390 8,290 10,830 11,400 13,490 5,070 6,290 4,580 3,150 2,840 2,160 2,820
Note: Assumed use of Route TAR-S1 for east-west movement
39

Table 3.2: Distance comparison - alternative routes from Kunming to (i) Europe, (ii) Central Asia, (iii) Islamic Republic of Iran
Origin/Destination Via Rail Distance (Km)
Kunming/Frankfurt Chengdu; Kazakhstan;Russian Federation 11,400
Kunming/Frankfurt Chongqing; Kazakhstan; Russian Federation 11,800
Kunming/Frankfurt Route TAR-S1 13,500
Kunming/Almaty Chengdu 5,500
Kunming/Almaty Route TAR-S1 (via Tehran) 11,600
Kunming/Almaty Route TAR-S1 (via direct link Bafq-Fariman) 10,800
Kunming/Tashkent Chengdu; Kazakhstan 6,400
Kunming/Tashkent Route TAR-S1 (via Tehran) 10,700
Kunming/Tashkent Route TAR-S1 (via direct link Bafq-Fariman) 9,900
Kunming/Ashgabat Chengdu; Kazakhstan; Uzbekistan 7,300
Kunming/Ashgabat Route TAR-S1 (via Tehran) 9,800
Kunming/Ashgabat Route TAR-S1 (via direct link Bafq-Fariman) 9,000
Kunming/Tehran Chengdu; Kazakhstan; Uzbekistan;Turkmenistan
8,700
Kunming/Tehran Route TAR-S1 8,400
For Kunming to Europe rail freight movement, use of the route system via northwesternChina, Kazakhstan, the Russian Federation and Belarus (effectively the TAR NorthernCorridor) would result in overall journeys which would be up to 2,100 km shorter than those via route TAR-S1. Use of the first-mentioned route system could save more than three days in transit time as compared with the TAR southern corridor route alternative, not includingadditional border crossing dwell time resulting from the need (between Kunming and Europe) to cross seven national borders in the case of route TAR-S1, as compared with only three for the routes via Chengdu or Chongqing.1 In addition, it has to be noted that use of TAR-S1, once it is continuous, could involve passing through seven break-of-gauge points,as compared with only two in the case of the routes via Chengdu or Chongqing, Kazakhstan,the Russian Federation and Belarus. It might be concluded therefore that use of the northwestern China/TAR Northern Corridor route system might save more than seven daysin transit time overall as compared with use of TAR-S1 (even then assuming that border dwell times along the latter route could be reduced to 12 hours at each checkpoint, when at present they exceed two days at some).
1 Transit times calculated on basis of average speed (terminal-terminal, but excluding extended stoppingtime en-route) of 40 km per hour in the case of the northwestern China/Central Asia routes and 30 km per hour inthe case of route TAR-S1.
40

Further, it should be noted that realization of a continuous rail connection betweenKunming and Europe via route TAR-S1 would involve new line construction of 1,800 km, themajority of it through severe mountainous terrain.
In the case of freight movement between Kunming and the three major destinations in the Central Asian Republics, route TAR-S1 suffers a substantial distance disadvantage as compared with the route through northwestern China. Use of route TAR-S1 (assuming it is continuous) would involve a distance penalty of 5,300-6,100 km in the case of Kunming-Almaty traffic, 3,500-4,300 km in the case of Kunming-Tashkent traffic and 1,700-2,500 km in the case of Kunming-Ashgabat traffic. In the worst case situation (i.e. traffic betweenKunming and Almaty on route TAR-S1 via Tehran), this distance penalty would translate intomore than six days additional transit time, not including the additional dwell time at border and break-of-gauge stations.
For freight movement between Kunming and the northern part of the Islamic Republic ofIran, taking Tehran as a representative destination, the TAR southern corridor route has aslight distance advantage over the route through northwestern China and the Central AsianRepublics. However, this advantage is likely to be eroded by the slower average speedslikely to be achieved, and by the additional dwell time at border and break-of-gauge stations, within the corridor.
Between Kunming and Tehran, the number of border crossings would be 6 and thenumber of breaks-of-gauge 4 if route TAR-S1 were used, as compared with only four border crossings and two breaks of gauge if the route via northwestern China and Central Asiawere used. If it were assumed that the average dwell time at each border station (inclusive oftime taken for inter-gauge transfer, in addition to customs and railway operational formalities) is about 12 hours, then the likely transit time for a freight train running from Kunming toTehran via route TAR-S1 would be greater than 14 days, as compared with about 11 daysvia northwestern China and Central Asia2.
As the destination for traffic despatched from Kunming moves further south and east along TAR-S1, so the TAR southern corridor route begins to realize an increasing distanceadvantage over the northwestern China/Central Asia route system. While the line ofequidistance3 lies about 150 km east of Tehran (somewhere near Garmsar) , the commercialline of demarcation between the two basic route alternatives (TAR southern corridor vs.northwestern China/Central Asia routes) is likely to lie to the south of Tehran. The practical effects of this are that rail freight customers are most likely to choose to move their consignments from Kunming to Tehran via the northern route system, and theirconsignments from Kunming to destinations to the south of Tehran via the TAR southerncorridor route, once the latter is continuous. This would imply that traffic between Kunmingand locations in Bangladesh, India and Pakistan would also benefit from the use of acontinuous route TAR-S1.
2 These times also assume an average speed via the northeastern China/Central Asia routes of 40 km perhour and via route TAR-S1 of 30 km per hour.
3 This is the point at which the distances associated with the alternative routes would be equal. It is to becontrasted with the commercial line of demarcation which marks the point at which the transit times associatedwith the alternative routes would be equal.
41
3.2 Rail route choices, Kunming to seaports
Located as it is in the central part of southern China, Kunming has several port options for the distribution of its seaborne trade.
The first and most obvious option is that which has been used up until the present time - rail movement via the Chinese Railways east-west trunk routes to ports on the eastern and southern coasts of China (including to Hong Kong). The distances involved are very long - approximately 2,800 km to Shanghai and 2,300 km to Hong Kong, but shippers would benefit by having access to two ports which attract regular calls by mainline ships.
The second option which is also currently available, but hitherto little used, is movementon the existing metre gauge line to the port of Haiphong in Viet Nam. At 855 km, this is by far the shortest port connection available to Kunming based shippers, but it suffers from the main disadvantages that Haiphong is a limited draft river port which is unlikely to be developed for mainline vessel calls and that the design standards and condition of the metre gauge railway line do not permit it to carry trains of economic configuration at commercially acceptable speeds.
A third option which is soon to be available would involve movement to the port ofFangcheng on the south coast of China, via the newly constructed 898 km Kunming-Nanning line, which is scheduled to open prior to the end of 1998. The total rail distancebetween Kunming and Fancheng port is about 1,130 km, and it is estimated that transittimes of the order of 28 hours should be possible on this route. It suffers from a similardisadvantage as the Kunming-Haiphong option in that Fangcheng also is unlikely in future to attract mainline vessel calls.
A fourth option would involve direction of Kunming-sourced trade through the port ofYangon or the new Thilawa Port (near Yangon) in Myanmar. Use of rail for the hinterlandtransport task would require new line construction. Connection of Kunming to ports in theYangon area could be achieved via Ruili and Lashio (i.e. via TAR links Ch.1, Ch.1a, My.2, My.2a, and My.1). This route would have a total length of about 2,160 km, approximately 860 km of which would be new line (or 1,180 km if the Lashio-Mandalay section has to bereconstructed). This is the only option which would make use of TAR southern corridor links.It has the major disadvantage that Yangon is as yet (and is unlikely in future to be) a mainline shipping port.
The fifth and final port connection option for Kunming-sourced trade would be via the port of Laem Chabang in Thailand. Again, there are two route alternatives for such aconnection - via Jinghong (China), Kentung (Myanmar) and Chiang Rai (Thailand), with atotal length of 2,300 km, about 1,270 km of which would need to be constructed, and viaJinghong (China), Boten (Lao PDR) and Nong Khai (Thailand) with a length of 2,310 km, ofwhich about 1,260 km would require construction. Despite the major investments thus farcommitted to the development of deep draft berthing facilities at Laem Chabang, this port has not succeeded in attracting high capacity mainline vessels, and in common with Bangkok Port which it has largely replaced remains dependent on feeder vessel servicesthrough Singapore. This factor, combined with the lack of a significant rail distanceadvantage over ports on the Chinese coast and the need to construct new connectingrailway lines over substantial distances through hostile terrain, would tend to suggest that this might not be an option favoured by Kunming based shippers in future.
42

There are other factors which need to be considered in assessing port connection options, not the least of which is the comparative distance between the alternative ports andmajor destination ports in Europe. The more significant of these factors have beenaddressed in Chapter 8 .
3.3 Rail route choices, Bangkok - Europe and Bangkok - Central Asia and Islamic Republic of Iran
While it is possible that in future Bangkok-based rail shippers may have a choice from about three route options for movement of their consignments to Europe, Central Asia andthe northern part of the Islamic Republic of Iran, none of these options is presently available,i.e. all would involve construction of new rail links on a major scale.
The first of these options would utilize TAR southern corridor route TAR-S1, while theother two would effectively by-pass the TAR southern corridor. The latter options wouldinvolve movement of freight bound for Europe or Central Asia via one of two Thai trunklines.The first runs north from Bangkok to Denchai (located about 530 km along the existingBangkok-Chiang Mai line), and from Denchai to Kunming via an as yet to be constructed line through Chiang Rai (Thailand), Kentung (Myanmar) and Jinghong (China). The second runs northeast from Bangkok to Nong Khai (located about 620 km from Bangkok on the Mekong River) and from there to Kunming via an as yet to be constructed line through Vientiane andBoten (Lao People=s Democratic Republic) and Jinghong (China). Both options would follow a common route alignment from Jinghong to Kunming and then on to Europe or Central Asiavia the trunk routes through northwestern China, described in Section 3.1.
For Bangkok-based shippers to be able to benefit from use of the TAR southern corridorroutes, approximately 1,230 km of new railway lines would have to be constructed in order tobridge the gaps in the network. A similar length of new line construction would be required in the case of the other two route alternatives (1,270 km via Chiang Rai and 1,260 km via Nong Khai). However, the number of border crossings and breaks-of-gauge would besignificantly fewer in the case of the latter two alternatives - five border crossings and three breaks-of-gauge between Bangkok and Brest (Belarus), as compared with seven border crossings and five breaks-of-gauge between Bangkok and Kapikule (Turkey).
The comparative distances associated with these route alternatives are given in Table3.3.
From this table, it can be observed that distances involved in rail movement fromBangkok to Europe (with Frankfurt as a representative destination) are little different asbetween route TAR-S1 and the alternative routes via northwestern China and the TAR Northern Corridor. In fact, route TAR-S1 is likely to have a 300-400 km distance advantageover the alternatives, but given the presence of a greater number of border crossings andbreak-of-gauge locations within the TAR southern corridor, it is unlikely that this distanceadvantage would translate into a real commercial advantage.
For movements between Bangkok and Central Asia, a rather different picture emerges. In this case, the routes via northwestern China would have an advantage for movements to Kazakhstan and Uzbekistan, but for movements to Turkmenistan (with Ashgabat as arepresentative destination), the TAR routes would begin to enjoy a distance advantage. Infact, the line of equidistance would pass through Ashgabat. However, the presence of a
43

greater number of border crossings and breaks-of-gauge within the TAR southern corridor is likely move the line of commercial demarcation somewhat to the south of Ashgabat.
For movements from Bangkok as far as the northern part of the Islamic Republic of Iran(with Tehran as a representative destination), the TAR southern corridor route is likely tohave a distinct distance and commercial (i.e. transit time) advantage.
Table 3.3: Distance comparison - alternative routes from Bangkok to (i) Europe, (ii) Central Asia, (iii) Islamic Republic of Iran
Origin/Destination Via Rail Distance(Km)
Bangkok/Frankfurt Chiang Rai; Chengdu; Kazakhstan;Russian Federation 13,600
Bangkok/Frankfurt Nong Khai; Chengdu; Kazakhstan; Russian Federation 13,500
Bangkok/Frankfurt Routes TAR-S2 and TAR-S1 13,200
Bangkok/Almaty Chiang Rai; Chengdu 7,700
Bangkok/Almaty Nong Khai; Chengdu 7,600
Bangkok/Almaty Routes TAR-S2 and TAR-S1 (via Tehran) 11,300
Bangkok/Almaty Routes TAR-S2 and TAR-S1 (via direct link Bafq-Fariman)
10,500
Bangkok/Tashkent Chiang Rai;Chengdu; Kazakhstan 8,600
Bangkok/Tashkent Nong Khai;Chengdu;Kazakhstan 8,500
Bangkok/Tashkent Routes TAR-S2 and TAR-S1 (via Tehran) 10,400
Bangkok/Tashkent Routes TAR-S2 and TAR-S1 (via direct link Bafq-Fariman)
9,600
Bangkok/Ashgabat Chiang Rai;Chengdu; Kazakhstan; Uzbekistan 9,500
Bangkok/Ashgabat Nong Khai;Chengdu;Kazakhstan;Uzbekistan 9,400
Bangkok/Ashgabat Routes TAR-S2 and TAR-S1 (via Tehran) 9,600
Bangkok//Ashgabat Routes TAR-S2 and TAR-S1 (via direct link Bafq-Fariman)
8,800
Bangkok/Tehran Chiang Rai; Chengdu;Kazakhstan; Uzbekistan;Turkmenistan
10,900
Bangkok/Tehran Nong Khai;Chengdu;Kazakhstan;Uzbekistan;Turkmenistan
10,800
Bangkok/Tehran Routes TAR-S2 and TAR-S1 8,100
44

3.4 General observations concerning route choice
As observed earlier, transport mode and route choices will invariably be made withreference to price and service packages offered by competing transport operators.
Competitive factors influencing use of the TAR southern corridor, which include tariffsand transit times, are discussed in Chapter 8. Notwithstanding these factors, it is obviousthat rail shippers at the extremities of the TAR southern corridor also face choices from among the alternative rail routes on offer, including routes which by-pass this corridor.
In particular, the foregoing analysis has established that in the case of Kunming andBangkok-based shippers, the TAR southern corridor is unlikely to provide a competitive means of moving cargo consignments to Europe or to a majority of destinations in Central Asia, when there are other non-TAR route alternatives available which will provide shorter transit times and which do not suffer from a multiplicity of national frontiers and differenttrack gauges.
Such a conclusion would tend to suggest that the TAR southern corridor might beadvantaged to serve trade within that part of the corridor bounded on the west by theeastern part of Turkey and on the east by Bangladesh and northeastern India, with thepossibility that trade between Kunming, Bangkok and Yangon to most locations in SouthAsia and the Islamic Republic of Iran could also be efficiently served by the TAR southerncorridor. On the basis that much of the trade within this part of the corridor is sourced in thehinterland (i.e. at some considerable distance from seaports) and is destined for other hinterland locations, the TAR southern corridor is likely to have the strong advantage of providing direct connections between these trade focal points. Whether this provides a real competitive advantage over the alternative combined shipping/land transport services is anissue which is addressed in Chapter 8.
45

4. CLOSING THE GAPS IN THE NETWORK
Gaps, or Amissing links@ (where there is currently an absence of physical linkagesbetween the railway networks of neighbouring countries or an absence of continuous railway links within the countries themselves) exist at seven main points in the Southern Corridor network. The length of some of these gaps depends upon the actual routes selected, but the situation may be broadly summarized as follows:
! Between Thailand and Myanmar, there is a gap of some 260 km;
! Between China (Yunnan Province) and Myanmar, there is a gap estimated at 860km;
! Between Myanmar and India, a gap of about 300 km exists;
! Between the new Jamuna River Bridge and Joydebpur in Bangladesh, there is a gapof 99 km;
! Between Kerman and Zahedan in the southeast of the Islamic Republic of Iran, thegap is 545 km;
! Between the railheads on the eastern and western shores of Lake Van in Turkey,there is a gap of 91 km which is currently bridged by specialized rail ferries; and
! Between Haydarpasa Station in Anatolian Turkey and Sirkeci Station in EuropeanTurkey there is a gap of 4.4 km across Bosphorus Strait, which is also currentlybridged by specialized rail ferries.
This list does not include a gap of about 790 km between Bafq and Fariman in theIslamic Republic of Iran, for which a detour through Tehran is currently available.
These gaps are depicted in the overall Corridor map (Map 2) and in the maps of the individual country networks (Maps 3-11), but with the exception of the gaps in Turkey, maybe seen in considerably more detail in the maps included in this chapter (Maps 12-16).
Map 12 provides an overview of the connection between the missing links in China,Myanmar, India and Bangladesh, and the remainder of the TAR southern corridor network, as identified by the participating countries, while Maps 13-16 show the possible routes ofindividual missing links.
While construction of the link between Kerman and Zahedan is currently underway, thereappears to be little prospect that construction of the links at the eastern end of the corridor(with the exception of the Jamuna Bridge link which is also underway) will proceed in thenear future, given the severity of the terrain through which they will have to pass, the consequent high order of magnitude of their construction cost, and (at least in the short term) the limited traffic generating potential of the routes themselves. It is acknowledged thatin the past major infrastructure projects have been justified on other grounds, such as their vital contribution to regional economic development, to trade enhancement or to nationalsecurity, but whether or not a major infrastructure project proceeds will depend increasinglyon whether potential investors perceive that they will receive an adequate return from their investment in the project. In the case of new railway line construction projects, ademonstration of traffic generating potential will be an essential element in any plan to secure investor confidence in the project.
46

Lekhapani
Kalay
Kalay
Lumding
Silc
har
Jirib
am
Gangaw
Lashio
Pakokku
Chaung-U
Tamu Mu-se
Ruili
Houqiao
Shahbazpur
DarsanaGede
To Atari,viaSitarampur
To Daliand Kunming
To Yangon
To Attari,viaPatna
Dohazari
Calcutta
Haldia
Shiliguri
Guwuhati
LEGEND
(route of subregional significance)
TAR link designation
(route of international significance)
Border station
Mah
isas
an
K
In.5a
In.5a
CHINA
Ch.1a
My.2a
My.2
My.3
My.1
My.3a
In.5bBn.1
Bn.2
Bn.2a
Bn.1
In.1
My.1
PangsawPass
MAP 12: MISSING LINKS IN RELATION TO EXISTING TAR NETWORKIN NORTHERN MYANMAR, BANGLADESH
AND NORTHEASTERN INDIA
(route of subregional significance)
(route of international significance)FUTURE LINK
EXISTING LINK
EXISTING LINK
FUTURE LINK
In.5a
INDIA
The boundaries and names shown and thedesignations used on this map do not imply officialendorsement or acceptance by the UnitedNations.
47

It is therefore important that all feasible options for construction of the identified missing links in the TAR network be rigorously and comprehensively evaluated. With this objective in mind, the present report is intended to contribute in terms of identifying the feasible routeoptions, the broadly indicative level of construction cost and the physical level of traffic which would be needed in order to justify investment in construction of the links.
Accordingly, this chapter addresses the technical standards assumed to apply to theconstruction of missing links, the basis for estimating the capital costs of these links, and the assessment of individual missing links in terms of their physical characteristics, possiblecapital cost and breakeven or threshold traffic requirement.
4.1 Assumed technical standards
The technical standards to apply to construction of missing links must clearly be compatiblewith the requirements of the traffic likely to use these links. While international containertransportation has been adopted as one of the primary objectives for development of the TAR network (see Chapter 1), it is highly likely that the network will have to satisfy othertransportation objectives and hence should embody standards which are also compatiblewith these. However, this will be a matter for each participating railway to decide, on the basis of the type of traffic on offer. It is sufficient to state here that the standards adopted fornew line construction should be the minimum standards compatible with the cost effectiverail movement of containers. Cost effective is here interpreted to mean the movement of containers in block trainloads of at least 30 bogie flat wagons.1 Such trains are assumed torequire locomotives with a power rating of at least 2400 - 3000 HP and an axle loading of atleast 15 tonnes for metre gauge track and 20 tonnes for standard or broad gauge track. In practice, it is likely that there will be significant capital cost advantages in also constructingnew metre gauge lines to carry 20 tonne axle loads.
With the addition of a requirement that all new lines should be designed to a structureand loading gauge compatible with transportation of high cube containers and with appropriate adjustments to allow for differences due to track gauge, the standardsrecommended in the feasibility study of the Singapore to Kunming railway link, sponsored by the Government of Malaysia, were used as a basis for developing standards for constructionof all missing links in the TAR network.2 These standards, which are summarized in Table4.1, indicate some convergence in the technical standards now being adopted for track ofdifferent gauge.
4.2 Assumed unit costs of missing link construction
The financial analysis of missing link construction, as described in this chapter, is based onindicative per kilometre construction costs provided by China and India, for line constructionto 1435 mm and 1676 mm standards respectively, through mountainous terrain, by Thailandfor line construction to 1000 mm standards through hilly (or rolling) terrain and by the Islamic Republic of Iran for line construction to 1435 mm standards through relatively flat terrain.These costs are inclusive of the costs of: formation construction; structures (bridges, viaducts, tunnels and station buildings); track laying; and signalling system installation.
1 The justification for container trains of this size is provided in Chapter 7.
2 Malaysia, Ministry of Transport (1988), Interim Report on Feasibilityof Singapore to Kunming Rail Link.
48

Table 4.1: Assumed technical standards for new TAR links
Outline Gauge Sufficient to allow transportation of 9ft 6ins high containers on standard height flat wagons through all structures at normalspeed
Speed Target: Passenger trains, 120 km/hourFreight trains, 80 km/hourAllowance for possibility of future200 km/hour passenger speeds
Radius ofCurvature
Target: Straight
Minimum
Rolling: 800 metres
Mountainous: 150 metres (for metre gauge)450-600 metres (for standard and broad gauge)
MaximumGradients
Rolling: 1.00 %
Mountainous: 1.20% - 1.25%
TrackStructure
Rail section: UIC 54 (or heavier, if used byparticipating railways)
Sleepers: Prestressed concrete
Ballast depth: 250 mm
Axle Load 20 tonnes
Line construction through mountainous terrain implies a need for extensive cuttings andembankments, as well as for major tunnelling and bridgeworks. For construction through hilly terrain, comparatively minor formation works (but sometimes major bridgeworks) would be needed, while construction through flat terrain would require only sufficient formation andbridge works to lift the line above the level of flood plains, etc.
With these qualifications in mind, the unit costs used as a basis for estimating the overallcosts of constructing missing links in the TAR network were as shown in Table 4.2.
4.3 Method of estimating breakeven or threshold traffic volumes
The capital costs of missing link construction estimated on the basis of the unit costs identified in Section 4.2 above were assessed against the physical volumes of freight traffic needed to justify these investments. For each link, these volume estimates have been expressed in million tonnes per annum, and may be referred to as breakeven or threshold tonnages.
49

Table 4.2: Assumed unit capital costs of new line construction
Source of costestimate(system and track gauge)
Terrain Type ConstructionCost Estimate(US$ million Per Kilometre)
Based on (name of Project)
Applied to (name of missing link)
ChineseRailways,1435 mm
Predominantlymountainous
3.27 Proposed new line Xiaguan-Ruili,(Yunnan Provinceof China)
Proposed new 630 kmline Xiaguan-Ruili,(Yunnan Province of China)
IndianRailways,1676 mm
Predominantlymountainous
2.25 Proposed new line in Mizoram state
(i) Proposed new 180 km line Tamu (State of Myanmar)- Jiribam(Manipur State of India)
(ii) Proposed new 230 km line Mu-se - Lashio,( Shan State of Myanmar) *
State Railway of Thailand, 1000mm
Predominantlyhilly
1.75 New line, Klong Sip Khao - Kaeng Khoi Junction,constructioncompleted 1995
(i) Proposed new 263 km line Nam Tok(Thailand) - Thambyuzayat(Myanmar), via ThreePagoda Pass
(ii) Proposed alternative150 km line Nam Tok (Thailand) - Dawei (Myanmar), via Ban Bong Tee
(ii) Proposed new 135 km line Kalay -Tamu (both in SagaingState of Myanmar)
Iranian IslamicRepublicRailways,1435
Predominantlyflat
1.20 New 545 km line under constructionbetween Kerman and Zahedan
New 545 km line underconstruction betweenKerman and Zahedan
* Per km construction costs supplied by Myanma Railways of US$ 360,000 per km for flat terrain, US$ 440,000for medium terrain and US$ 580,000 for mountainous terrain make no allowance for construction of bridges or tunnels, and hence are likely to understate construction costs for missing links. For construction throughmountainous terrain in Myanmar, indicative costs from India rather than from China were used to allow for lowerlabour costs in Myanmar.
In order to arrive at the estimates of breakeven or threshold tonnages it was initiallyassumed that the related investments would have to be recovered over 50 years and providea Financial Internal Rate of Return (FIRR) of at least 12 per cent per annum.
In the case of FIRR calculations, the actual rates of return for each investment wouldresult from positive cash flows in the form of the financial contribution, or revenue less long run marginal cost, from the freight traffic moved on the relevant link. To establish thiscontribution figure, it was first necessary to estimate the long run marginal costs which might
50

result from freight traffic haulage on the relevant link.2 Container traffic was used as thebasis for estimation of these costs. For traffic on rail routes within Thailand and Myanmar, estimates were made with the assistance of the ESCAP Point-to-Point Railway Traffic Costing Model, Traincost. (The model run for Thai container traffic is shown as an examplein Annex 1). For traffic on rail routes within China, India and the Islamic Republic of Iran, costdata from other relevant sources were used.
The resulting cost estimates were deducted from estimated revenue per tonne-kilometreto arrive at the estimated rate of financial contribution for the traffic. Finally, the breakeventonne-kilometre figure was calculated by dividing the present annual value of the estimatedinvestment in new line construction by the estimated financial contribution per tonne-kilometre, and this was converted to a breakeven tonnage figure through division by thelength in kilometres of the relevant link.
It should be noted that the use of container traffic as the basis for contribution analysis is likely to understate threshold tonnages if the majority of traffic to be moved on the links isbulk traffic, since bulk traffic will invariably attract a lower tariff, but could incur a higher cost given that there is usually no backloading for wagons conveying bulk commodities.
4.4 Assessment of individual missing links
4.4.1 Links between Thailand and Myanmar
At the second meeting of the Special Working Group for the Singapore-Kunming Rail Link Feasibility Study held in Kuala Lumpur in September 1997, several route alternatives were nominated for consideration, among them route options for railway connections between Thailand and Myanmar.
At this meeting, the State Railway of Thailand (SRT) indicated that during 1998 it wouldbe undertaking its own feasibility studies of four connecting routes between Thailand and Myanmar, viz: via Mae Sai, Mae Sod, Three Pagoda Pass, and Bongty (south of ThreePagoda Pass. Of these routes, the one via Mae Sai is intended to provide a connectionbetween Thailand and China, through the territory of Myanmar and is therefore not relevantto the issue of providing links between Thailand and Myanmar on what should basically be an east-west (not a north-south) alignment.
At the same meeting, Myanmar indicated that it would prefer the route via Three PagodaPass over that via Mae Sod, since the terrain within Myanmar opposite Mae Sod is very hilly, but undertook to study the alternative route via Ban Bong Tee.
When the Interim Report was released in April 1998, it was obvious that the study hadconsidered only one route alternative in detail - that via Three Pagoda Pass. For thepurposes of the present study, however, it is considered that there are two alternative routes which are broadly acceptable to both Thailand and Myanmar, those via Three Pagoda Pass and via Ban Bong Tee, and that, in the circumstances where neither alternative has yetbeen rejected on technical or financial grounds, both alternatives should be subjected todetailed evaluation.
2 Long Run Marginal Costs are costs which will vary only in the long term, i.e. generally during periods of longer than 12 months. In addition to operating costs, such as fuel and train crewing costs, and infrastructure andlocomotive/rolling stock maintenance costs, long run marginal costs will include any capital cost increments, such as locomotive or rolling stock acquisition costs, needed to support additions to output. The long run marginalcosts estimated in this study include the capital costs of locomotives and wagons required to move freight trafficon the new TAR links.
51

(i) Link descriptions
(a) Via Three Pagoda Pass
The alignment of the route alternative via Three Pagoda Pass, designated Th.1a inThailand and My.1a in Myanmar, would follow, in part, the alignment of the old Kanchanaburi- Thambyuzayat railway constructed during the Second World War under the direction of the Japanese Army. It follows the old railway alignment for part only of its total length, becausein many places the old alignment is submerged beneath the Khao Laem Dam which was constructed in the 1970's. The route alignments for Th.1a and My.1a are shown in Map 13.
For the section between Nam Tok and Three Pagoda Pass, the new alignment has beensurveyed in detail by engineering consultants engaged for the Singapore-Kunming Rail Link Feasibility Study. It starts at the westernmost railhead on the Thai system at Nam Tok, 210 km by rail from Bangkok, and proceeds in a northwesterly direction running parallel to Highway 323 all the way to the border at Three Pagoda Pass, which would be located at 153km on the new line.
The line would pass through moderately hilly terrain all the way from Nam Tok (elevation:+ 180 metres above mean sea level) to Three Pagoda Pass (elevation: + 220 metres abovemean sea level). The steepest gradients would be concentrated between Km 71 and ThreePagoda Pass, but in no case would the gradients exceed the one per cent target (see Assumed Technical Standards, above).
Between Nam Tok and Three Pagoda Pass, the line would need to cross three rivers,the Huai Yai (at Km 7.5), the Kwae Noi (at Km 77.8) and the Pracam Mai (at Km 98.5) - forwhich three bridges would be required, one of two 50 metre spans and two of three 50 metre spans, giving a total length of 400 metres.
Apart from bridges, other structures required on this section are high embankments,mainly where the line would run beside reservoirs. No tunnelling would be required on this section.
The predominant land use in the countryside through which the line would pass isagriculture. With the exception of Nam Tok and Sangkhla Buri (at Km 135), there are nosizeable towns along the route, and the area between Sangkhla Buri and Three PagodaPass is very sparsely populated.
Unless extractive industry is allowed to develop, there would appear to be almost nolocally generated freight demand along the entire route between Nam Tok and Three Pagoda Pass.
The section within Myanmar, between Three Pagoda Pass and Thambyuzayat has atotal length of 109.6 km. For all but 14.6 km of this length, the proposed railway alignmentruns parallel to the existing road linking Thailand with Myanmar. It generally follows the old Second World War route and could utilize a total of 12 of the old station sites.
The terrain through which the line would pass may be generally described as Arolling@,with the steepest gradients concentrated within the first 30 km from Three Pagoda Pass,where the line would be required to descend through river valleys.
52

Dawei(Tavoy)
New line sectionunder construction
MAP 13: MISSING LINKS BETWEEN THAILAND AND MYANMAR IN THE TAR SOUTHERN CORRIDORTo Yangon
and Mandalay
To Bangkok
Ban BongTee
Three Pagoda PassLEGEND
EXISTING LINK(route of international significance)FUTURE LINK(route of international significance)
FUTURE LINK(route of subregional significance)
EXISTING LINK(route of subregional significance)
Ports integrated with TAR
TAR border station
TAR link designation Th.1a
The boundaries and namesshown and the designations usedon this map do not imply officialendorsement or acceptance bythe United Nations.
53

There would be four major river crossings, requiring 550 metres of bridge construction,the longest bridge having 4 spans each of 50 metres. Some deep cuttings would berequired, as would some high retaining structures in river valleys.
The consultants were unable to carry out a detailed alignment survey of this section, andwere thus unable to comment on land use. It is likely, however, that land use in the parts ofKayin and Mon States through which the line would pass is predominantly agricultural.
(b) Via Ban Bong Tee
While not considered in the interim report of the consultants engaged in theSingapore-Kunming Rail Link Feasibility Study, a railway route linking Nam Tok in Thailandwith Dawei (Tavoy) in Myanmar nevertheless represents a viable alternative which shouldbe fully evaluated for inclusion in the TAR network. Two major developments supporting this observation are:
! The participation of the Petroleum Authority of Thailand (PTT) and its joint venturepartners in exploration for and extraction of natural gas in the Gulf of Moktama(Mataban), the construction by the PTT of a gas pipeline from Tavoy to Kanchanaburi,and the development of a deep sea port near Tavoy as a support base for the gasextraction industry. (The last mentioned development might ultimately lead to the growthof downstream industries which could provide substantial base load traffic volumes for the proposed rail link).
! Impending completion (during 1998) of construction by the Myanma Railways of a 161 km extension of the existing Mawlamyaing (Moulmein) - Ye line to Tavoy.
It has been assumed, but has yet to be confirmed, that this second alternative route would also start at Nam Tok, running almost due west to the Thai/Myanmar border at Ban Bong Tee, thence to Dawei - a total distance estimated at 150 km. The section of this route within Thailand has been designated Th.1b and that within Myanmar My.1b.
For much of the route there would be opportunities for the alignment to follow rivervalleys (having primarily an east-west orientation), thereby avoiding the need to penetratethe coastal mountain range, which in places is more than 1,500 metres high.
Between Nam Tok and Bongty, there appear to be no towns of any significant size andbetween Bongty and Tavoy, there would appear to be three small towns, none of which are likely to contain populations of significant size. There is the probability of three or four river crossings including a crossing of the Kwae Noi River and one of its tributaries.
(c) Common access route to Yangon
Whether the TAR connecting route between Thailand and Myanmar will pass throughBan Bong Tee or Three Pagoda Pass, it will follow the alignment of the existing railway northof Thanbyuzayat.
A major bottleneck presently exists between Mawlamyang (Moulmein) and Motamawhich are separated by the Thanlwin (Salween) River. At this point, the river is approximately 4 km wide, and in the absence of a bridge, rail traffic must be transferredbetween the two railheads by ferry - involving long delays in train transits.
54
It is understood that the Government of Myanmar has plans to construct a combined rail and road bridge across the Thanlwin, thereby providing direct rail access between

Mawlanyaing and Yangon, but no information is yet available as to the likely location of this bridge, its cost, and the timing of its construction.
(ii) Capital cost estimates
(a) Links Th.1a/My.1a (via Three Pagoda Pass)
Since this link would pass through what might be described as Amoderately hilly@ orArolling@ terrain, a typical unit cost of US$ 1.75 million per kilometre (refer section 2.2 above) was used for the purposes of calculating its indicative capital cost. This cost, reflectingconstruction of new , fully signalled, single track line (without the need for tunnelling), wascalculated at US$ 268 million, on the Thai side and US$ 192 million on the Myanmar side of the border.
(b) Links Th.1b/My.1b (via Ban Bong Tee)
This link would also pass through what might be described as Amoderately hilly@ orArolling@ terrain, and in this case application of a typical unit cost of US$ 1.75 million per kilometre would result in an estimate of US$ 61 million on the Thai side and US$ 201 millionon the Myanmar side of the border.
(iii) Threshold tonnage estimates
The basis and calculations of threshold tonnage estimates according to FIRR principlesis detailed in Annexes 2 and 3. Traffic costings were based on Thai unit costs and for thepurposes of this analysis, unit train operating costs in Myanmar were assumed to be 50 per cent of the rates applicable in Thailand.
(a) Links Th.1a/My.1a (via Three Pagoda Pass)
Financial assessment resulted in threshold tonnage estimates of 7.3 million tonnes per annum on the Thai side and 7.1 million tonnes per annum on the Myanmar side of the border. The slight difference between these estimates is explained by the lower unitoperating costs assumed to apply in the case of Myanmar, because the same unit tariff was assumed to apply both sides of the border.
It must be noted that these tonnages are almost as great as the total annual freighttonnage currently moved on the Thai railway system, and significantly greater than the totalfreight tonnage moved on the Myanmar railway system.
(b) Links Th.1b/My.1b (via Ban Bong Tee)
Since the same unit tariffs and costs were assumed to apply in the case of this link as for the link via Three Pagoda Pass, the same threshold tonnage estimates also apply in this case.
(c) Conclusions on financial breakeven levels
Based purely on a financial assessment of the traffic volume required to justify investment in the construction of missing links, preference would have to be given to theroute alternative through Ban Bong Tee. Potentially, it has a significantly lower investmentcost than the alternative through Three Pagoda Pass (US$ 262 million as compared with
55
US$ 460 million). Similarly, it has a higher probability of achieving the tonnage levelrequired to justify its investment.
4.4.2 Links between China and Myanmar
While a number of different route alternatives for the rail connection of China and Indiahave been evaluated by the railway authorities of China, only one has been evaluated in thisstudy. This is a new line of 858 km between Dali in Yunnan Province of China and the existing railhead at Lashio in Myanmar, via the official border checkpoints at Ruili (China)and Mu-se (Myanmar). This line was also considered in the Interim Report of the Singapore-Kunming Rail Link Feasibility Study.
It is understood that construction by the Chinese Railways of a new standard gauge linebetween Kunming and Dali has either been completed or is nearing completion. A decision about the continuation of this line to the Myanmar border will therefore be imminent.
It is likely that any line constructed from Dali to the Myanmar border will be constructedin standard gauge and similarly that any line constructed from one of the railheads inMyanmar to the border with China will be constructed in metre gauge. This brings with it theproblems of inter-gauge transfers occurring at the border, and the delays and additional costthat this implies. Some general comments have been made about the advantages and disadvantages of the different methods available for transferring freight between gauges in Chapter 7, but except to recognize that the need for such transfers can add greatly to thecosts of rail transportation, this issue is not addressed further in this chapter.
(i) Link descriptions
Within China, the new line has been designated as Link Ch.1a and within Myanmar it has been designated as Link My.2a. These links are depicted in Map 14. Much of the alignment analysis done for these links as part of the Singapore-Kunming Rail Link Feasibility study was based on earlier alignment surveys completed by Ministry of Railwaysofficials.
Link Ch.1a would start from the new Chinese station of Xiaguan (about 15 km south ofDali) and would follow a generally southwesterly alignment for 626 km up to the border checkpoint at Ruili. The terrain through which the line would pass is extremely mountainous,with peaks in places as high as 3,000 metres. The mountain ranges through which the line would be required to pass are the Gaoligong and Qingshuilang ranges in the north and the Saobie and Wuliang ranges in the south. The mountainous topography, coupled with the need to restrict the maximum gradient to 1.25 per cent, made it necessary to survey a routewhich follows river valleys to the maximum extent possible. Thus, the alignment selected by the consultants is long and tortuous, as indicated by the fact that the direct distance betweenDali (elevation 900 metres AMSL) and Ruili (1,900 metres AMSL) is only 300 km.
Owing to the lack of suitable base data, the Interim Report could provide no commenton the geology and seismology of the region, its hydrology, the number and type ofstructures required, and the land use characteristics of the region. These issues are to be covered in a later report.
56
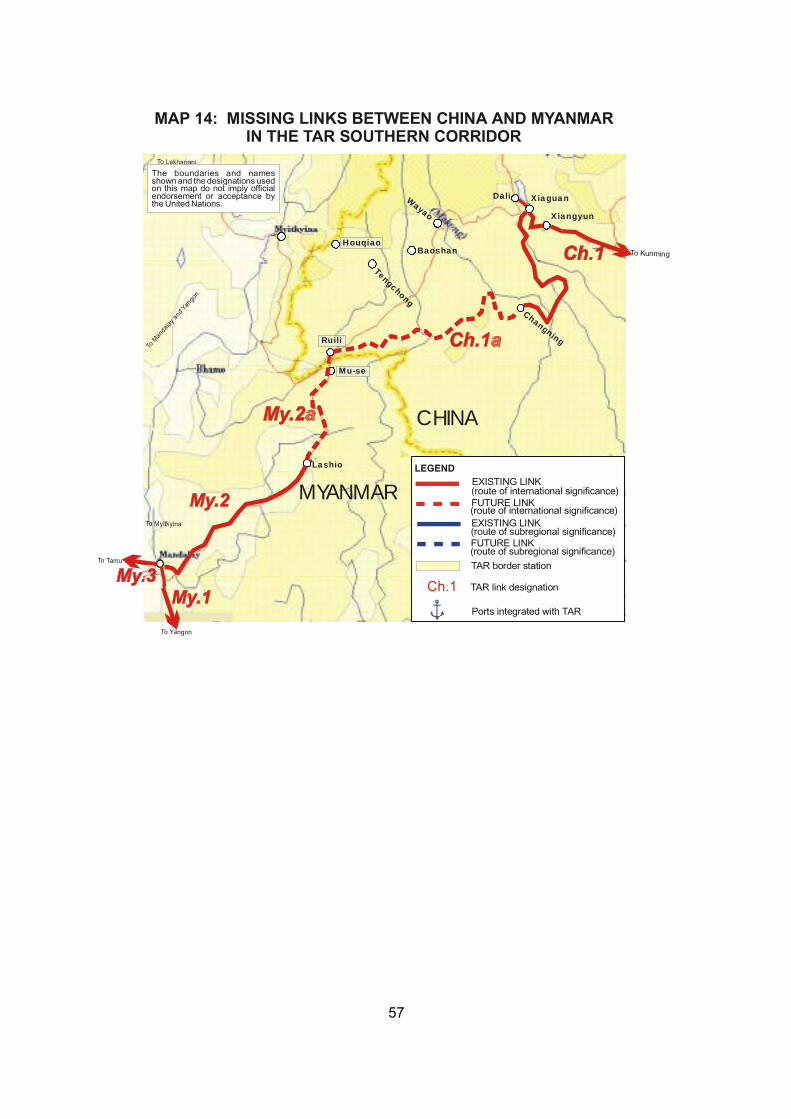
Baoshan
Tengchong
Lashio
DaliWayao
Houqiao
Xiaguan
Xiangyun
Changning
To Kunming
ToM
anda
layand
Yang
on
To Myitkyina
To Lekhapani,India
To Yangon
To Tamu
CHINA
MYANMAR
MAP 14: MISSING LINKS BETWEEN CHINA AND MYANMARIN THE TAR SOUTHERN CORRIDOR
Houqiao
Ruili
Mu-se
LEGENDEXISTING LINK(route of international significance)FUTURE LINK(route of international significance)
FUTURE LINK(route of subregional significance)
EXISTING LINK(route of subregional significance)
Ports integrated with TAR
TAR border station
TAR link designationCh.1
The boundaries and namesshown and the designations usedon this map do not imply officialendorsement or acceptance by the United Nations.
57

However, it appears that only two towns of any significant size (Changning andJuichang) lie on the proposed alignment of this link. It is also likely that there is extractive and forest based industry in the region which might in future generate traffic for the rail route.
From Mu-se, Link My.2a would run south approximately 230 km to the existingnortheastern railhead in Myanma at Lashio. In fact the direct distance between Mu-se andLashio is only about 120 km, but the fact that the link would have to pass through theGaoligong Range with a maximum elevation of 2,000 metres, coupled with the requirementto that the maximum gradient should not exceed 1.25 per cent, implies that this link wouldalso have to follow a tortuous course, as does the highway which it would follow for much of the distance. The alignment investigated by the Malaysian consultants also took into account the need to serve the townships of Hsienwi and Kutkai, which are the only significantconcentrations of population between Mu-se and Lashio.
Also a factor taken into account by the consultants was the need to minimize the construction of major structures, such as bridges, tunnels and viaducts, and henceconstruction costs along the proposed route alignment. Nevertheless, the need for fourmajor bridges with a total length of 340 metres, a 200 metre long viaduct and a single tunnelof 600 metre length was identified.
The country through which the link would pass is generally uninhabited and economicactivity is restricted to agriculture and road stone quarrying activity.
(ii) Capital cost estimates
Link Ch.1a would pass through steeply graded terrain and the unit construction cost onthe Chinese side of the border has been estimated by the Yunnan Railway GeneralCorporation as US$ 3.27 million per kilometre. This translates into an overall capital cost for construction of Link Ch.1a, comprising 626 km of track of US$ 2.047 billion.
Terrain conditions on the other side of the border also appear to be difficult, but no specific cost estimates for Link My.2a were available and it was therefore necessary to useunit costs which would reflect the lower cost of labour in Myanmar, as compared with China.It was considered that unit rates for new line construction through mountainous terrain inIndia might more closely reflect the level of construction cost in Myanmar. Accordingly, a rate of US$ 2.24 million per track kilometre was used, giving an overall construction costestimate for Link My.2a (232 track km) of US$ 759 million.
(iii) Threshold tonnage estimates
The basis and calculations for estimation of threshold tonnages according to FIRR principles are detailed in Annexes 2 and 3. Estimates of long run marginal costs for Myanmar were derived from runs of the Traincost model (assuming that unit operating costs in Myanmar are about 50 per cent of the corresponding Thai costs). Cost estimates forChina were based on information provided in A A Brief Description of the Guanton-DaliRailway, Yunnan PRC@ (1994). The revenue rate applying to movement of containers alongthe missing links on both sides of the border was assumed to be that indicated in theCountry Report for China of about US$ 0.36 per TEU-km.
Financial assessment resulted in threshold tonnage estimates of 17.4 million tonnes perannum on the Chinese side and 14.0 million tonnes per annum on the Myanmar side of theborder.
58

4.4.3 Links between Myanmar and India
The potential rail link of some 320 km between Kalay in Sagaing State of Myanmar and Jiribam in Manipur State of India, via the official border post of Tamu in Myanmar, formed the basis of the evaluation.
At the time of writing it is understood that only the first section of this link (a 135 km section between Kalay and Tamu) has been subjected to detailed alignment survey.
(i) Link description
This link would form part of the main international route TAR-S1. Within Myanmar, it has been designated Link My.3a and within India, Link In.5b, both of which are depicted in Map15.
Link My.3a would start from the station of Kalay on the recently completed line toGangaw and would follow a northerly alignment for about 135 km up to the border checkpoint at Tamu. (Tamu has been designated by the Government of Myanmar as theonly official border checkpoint with India).
It has been assumed (but has yet to be confirmed) that alignment of this link would followthe valleys of the Myittha and Khampat Rivers (both tributaries of the Chindwinn River),thereby avoiding the steeper gradients which would be associated with the range of small mountains through which those rivers pass.
Link In.5a would start from Tamu, possibly following Highway 39 in a northwesterly direction through Imphal, the capital of Manipur State, and from there following Highway 53in a westerly direction to Jiribam which is the existing railhead on the Indian northeasternmetre gauge network. From Jiribam the existing metre gauge line provides a directconnection with Bangladesh at the Indian border station of Mahisasan (opposite Shahbazpurin Bangladesh), passing through the significant historical city of Silchar en route. The distance from Tamu to Mahisasan is about 340 km, of which the missing section comprisesabout 180 km, nearly all of it requiring construction through mountainous terrain, with several peaks of 2,000 metres or more.
It has been assumed that Link My.3a would be constructed in the metre gauge and LinkIn.5b in the broad gauge, thereby creating a break-of-gauge at the border.
(ii) Capital cost estimates
Link My.3a would pass through flat to undulating river valley country for most of its lengthof 135 km. It was assumed that its unit construction cost would be US$ 1.75 million per kilometre, giving an overall capital cost estimate of US$ 236 million.
The missing portion of Link In.5b (180 km) would have to be constructed through quitemountainous terrain, implying a unit construction cost of about US$ 2.25 million per kilometre and overall capital cost of US$ 405 million.
59

Kalay
Jiri
bam
Tamu
Silchar
Mahisasan
To Dhaka, Gedeand Attari
To Lumding and Lekhapani
To Mandalay, Lashio and Dali
MAP 15: MISSING LINKS BETWEEN INDIA AND MYANMARIN THE TAR SOUTHERN CORRIDOR
LEGENDEXISTING LINK(route of international significance)FUTURE LINK(route of international significance)
FUTURE LINK(route of subregional significance)
EXISTING LINK(route of subregional significance)
Ports integrated with TAR
TAR border station
TAR link designationIn.5a
The boundaries and namesshown and the designations usedon this map do not imply officialendorsement or acceptance bythe United Nations.
60

(iii) Threshold tonnage estimates
The basis and calculations of threshold tonnage estimates according to FIRR principlesare detailed in Annexes 2 and 3. An estimate of the long run marginal cost for Myanmar was derived from runs of the Traincost model (assuming that unit operating costs in Myanmar are about 50 per cent of the corresponding Thai costs). The corresponding estimate for India was derived from the per wagon-km unit cost quoted in the Annual Report and Accounts ofthe Indian Railways 1994-95. The revenue rate assumed for container movement on both sides of the border was that reported in the Country Report for India of about US$ 0.40 per TEU-km.
Financial assessment resulted in threshold tonnage estimates of 8.7 million tonnes perannum on the Myanmar side and 9.9 million tonnes per annum on the Indian side of theborder.
The lower order of tonnage required in the case of Myanmar could be attributed to thelower unit operating cost likely to apply in Myanmar. It should be noted that these estimatesdo not include the cost of a break-of-gauge bridging facilities which might have to beprovided at Tamu.
4.4.4 Missing link within the Islamic Republic of Iran
A new rail link with a track gauge of 1435 mm is currently under construction betweenKerman and Zahedan in the Islamic Republic of Iran - a distance of 545 km. This new link will form part of TAR Link Ir.1 and of the transcontinental route TAR-S1. At the time of writing, formation and bridge works had been completed on about 100 km, but the projectwas encountering funding difficulties amid doubts that it would be able to generate a sufficient volume of traffic to pay back its investment cost.
(i) Link description
This link, which is depicted in Map 16 will traverse a mostly flat strip of desert terrainbordered on either side by a low mountain range extending through the central part of the Islamic Republic of Iran.
Initially, only 15 stations will be built along the line, in order to service the four pairs of trains per day expected to run in the early years of operation. This number will be increased progressively to 28. The link will serve two important commercial and cultural centresbetween Kerman and Zahedan. These are Bam and Fahraj, located respectively 232 km and 275 km southeast of Kerman. Bam is of historical significance and a base of support for local agricultural industries. Fahraj is the focus of new manufacturing industry development,a large automobile factory having recently located there to produce auto body panels forpossible future export to the CIS countries.
While the alignment of the new link is practically flat throughout most of its length, it willcross flood plains and numerous small water courses requiring extensive construction of bridges and culverts of varying length. Throughout the line, gradients will be limited to 1.5 per cent and curves to a radius of 500 metres. A 20 tonne axle load will apply and single locomotives of medium power will have a trailing load haulage capability of 2,000 tonnes throughout the line.
61

Bam Fahraj MirjavehMirjaveh
PAKISTAN
AFGHANISTAN
ISLAMIC REPUBLIC
OF IRAN
MirjavehKoh-i-Taftan
To Bafq,Tehranand Razi
To Spezand,,Lahoreand Karachi
MAP 16: TAR MISSING LINK IN THE ISLAMIC REPUBLIC OF IRAN
The boundaries and namesshown and the designations usedon this map do not imply officialendorsement or acceptance bythe United Nations.
62

Upon completion of this line temporary transhipment facilities will be established atZahedan, until the existing 92 km broad gauge line to the border with Pakistan can beupgraded and converted to standard gauge. Ultimately, the break-of-gauge will be located atthe border.
(ii) Capital cost estimates
The unit construction cost of the new line has been estimated by officials of the Islamic Iranian Republic Railways at about US$ 1.2 million per kilometre.4 Thus, the overall construction cost of the line is estimated at US$ 654 million.
(iii) Threshold tonnage estimates
The basis and calculations of threshold tonnage estimates according to FIRR principles are detailed in Annexes 2 and 3. Very rough estimates of the long run marginal cost of trainoperations on the new line were derived from cost data contained in the documentAOperations Report, 1986-1995@, published by the Islamic Iranian Republic Railways. Therevenue rate applying on this line was assumed to equate to the present rate for container movement between Sarakhs and Bandar Abbas (2540 km) of about US$ 0.24 per TEU-km.
Financial assessment resulted in a threshold tonnage estimate for this new line of 9.2 million tonnes per annum. This estimate has to be viewed in relation to traffic projectionsprepared by the Islamic Iranian Republic Railways which suggest that during the initial 10-12year period of operation the line will carry three pairs of freight trains and one pair of passenger trains daily and an annual freight volume of two million tonnes, increasing after year 12 to 12 freight train pairs and two passenger trains daily and an annual freight volumeof eight million tonnes.
4.5 Summarized capital cost and threshold tonnage estimates
Estimates of the capital costs of constructing the missing links identified in the preceding sections, in relation to estimates of the annual freight tonnages required to offset thesecosts, have been summarized in Table 4.3. In the next chapter, a comparison is madebetween the threshold tonnage requirement and the projected tonnage for each missing link.
Table 4.3: Summary of new line construction costs vs threshold freight tonnages
Missing link Estimated constructioncost
(US$ million)
Estimated threshold freighttonnage requirement
( million tonnes per annum)
Dali-Ruili (China) 2,047 17.4
Ruili/Mu-se - Lashio (Myanmar) 759 14.0
Nam Tok - Three Pagoda Pass (Thailand) 268 (1) 7.3
Three Pagoda Pass - Thanbyuzayat (Myanmar) 192 (2) 7.1
Kalay-Tamu (Myanmar) 236 8.7
Tamu-Jiribam (India) 405 9.9
Kerman-Zahedan (Islamic Republic of Iran) 654 9.2
TOTAL 4,561
(1) US$ 61 million for Nam Tok-Bong Tee (2) US$ 201 million for Bong Tee-Dawei.
4 Personal communication during ESCAP mission to Tehran in May 1998.
63

5. TRAFFIC DEMAND
This study has a primary focus on the potential for international movement of containers within the corridor. However, it has to be recognized that the development of the component links of the TAR network will serve other traffic needs of significance to individual participatingcountries. In some cases, these needs can be expected to dominate the future traffic task on nominated TAR links.
Traffic demand for the TAR Southern Corridor network can be expected in three main forms, i.e.: existing, diverted and generated demand. All are dependent in varying degrees on thebenefits perceived by existing and potential rail customers to be offered by rail services in the corridor. (The benefits required to be offered by rail in order to attract traffic to the TAR networkhave been identified in Chapter 8).
Existing demand reflects the current usage of services on TAR links by freight customers.This demand may be expected to grow in line with national GDP growth indicators and/or withforeign trade growth indicators.
Diverted demand results from the diversion of traffic to the TAR from other transport modes serving the TAR Southern Corridor. An example of diverted traffic demand potential might be found in the traffic which currently moves between hinterland locations within the corridor via a combination of land and sea transport services, but which could in future move directly from origin to destination by rail. This represents potentially divertible traffic, since it incurs distance,time (and probably cost) penalties through having to be moved by a circuitous route. The level ofdiverted traffic will depend mainly on the net benefits perceived by potential freight customers to be offered by the TAR over its competitors, but its continued growth will depend on wider economic and trade growth influences.
Generated demand is demand which is stimulated by the development of transportinfrastructure. In the case of the TAR network it might arise from the development of industry inareas not previously served by rail or at least not previously accessible by a viable rail service, but which would be provided with such connections as a consequence of TAR network development. The possible development of industry in the northeastern states of India as adirect consequence of the construction of missing links and gauge conversion of the existingmetre gauge system could generate additional traffic for the TAR network. While the multiplierimpacts of railway infrastructure developments have been subjected to detailed study in the West, almost no study of these impacts has been undertaken in Asia. As a result, conventional cost/benefit analysis of railway development projects is devoid of any measurement of these effects, even when they are likely to contribute substantially to the justification of a project.Measurement of the generated traffic demand for the TAR would require a major econometric study of economic linkages between TAR network development and potential resource and industry development in the corridor under study. Thus, any comment on generated traffic demands in the present report will necessarily be restricted to speculating on the possible impacts of resource extraction and manufacturing industry growth in the corridor.
Each of the three demand categories described above may be sub-divided into: inter-regional, intra-regional and intra-country traffic.
64
Inter-regional, or through international traffic, is traffic moving between origins anddestinations in different regions. An example might be containerizable light manufactures fromYunnan Province to destinations beyond Turkey. It may be assumed that the majority of this type of traffic currently moves by sea to or from ports on the Chinese coast or ports within theIslamic Republic of Iran or the countries of South Asia. The potential for this traffic to divert tothe TAR in future depends largely on the construction of the missing links in the TAR network.However, as was observed in the analysis of route options in Chapter 3, the probability of traffic originating in Yunnan Province of China or in Thailand eventually diverting to the TAR must be rated as fairly low.
Intra-regional traffic is traffic with both an origin and a destination within the ESCAP region.Perhaps the best example of this type of traffic is that which currently moves via sea-cum-landtransport between origins and destinations in the hinterland of countries within the corridor (see Adiverted traffic@, above). Arguably, traffic of this type represents the most promising opportunity for the TAR network - provided that the traffic origin and destination are both served by existingTAR links.
Finally, Intra-Country Traffic is defined as traffic moving from one part of a country toanother, but which uses the identified TAR links for at least part of the journey. An example might be bagged fertilizer (potentially transportable in containers) moving from the Port of Karachi for distribution throughout northeastern Pakistan. Road transport is likely to have adominant share of Intra-Country Traffic in all countries participating in this study.
The following sections assess the traffic potential for the TAR Southern Corridor networkwithin the various traffic demand categories.
5.1 Existing traffic demand
Container traffic moves in significant volumes on existing links within the corridor in five ofthe eight participating countries. These countries are: Bangladesh, India, Pakistan, the Islamic Republic of Iran and Turkey. However, only in the case of Turkey does this traffic cross a land border.
Since most of this traffic is port oriented, much of it can also be regarded as potentially divertible (inter and intra-regional) traffic.
5.1.1 Bangladesh
The Bangladesh Railway has operated dedicated container trains between Dhaka and Chittagong since August 1991. Currently, one pair of container trains is operated per day on TAR Link Bn.2. During 1996/97 considerable effort and funds were committed, as part of a railway restructuring project sponsored by the Asian Development Bank to improving therunning performance of this service. However, despite progressive and substantial improvements in train running times and reliability, Bangladesh Railways has failed to increaseits share of the traffic in containers and container cargoes between Dhaka and Chittagong, asmay be observed in Table 5.1.
It is a matter of concern that in spite of the substantial investment in container handlingfacilities at the Inland Container Depot at Dhaka and at the rail container terminal at Chittagong,some 85 per cent of the container cargo volume moved in both directions between Chittagongand Dhaka is transported in small rigid trucks of limited payload capacity. There are several reasons for this, not the least significant of which are port tariffs which favour container
65

discharge and loading within the boundaries of the port, port operating practices which result inroad operators being given priority in the allocation of container and cargo handling equipment,and flexible tariff responses by road operators who are able to undercut rail tariffs in order to secure backloading in the non-dominant (i.e. Dhaka-Chittagong) traffic direction.
Table 5.1: Trend in rail container feeder volume and share, Dhaka-Chittagong-Dhaka
Year Total containervolume in Dhaka-Chittagongcorridor(TEU)*
Percentagechange
Rail-hauledcontainer volume in Dhaka-Chittagongcorridor(TEU)
Percentagechange
Rail-hauledshare of totalvolume (%)
1992/93 105,341 13,744 13.0
1993/94 122,471 16.3 15,010 9.2 12.2
1994/95 159,020 29.8 21,757 45.0 13.7
1995/96 175,607 10.4 25,436 16.9 14.5
1996/97 203,231 15.7 29,953 17.8 14.7
* This takes into account both the containers transported by rail and the deconsolidated container cargoes transportedby road.
A serious consequence of these factors is that they contribute to increased congestion in aport which already suffers severe congestion of its berth back-up areas owing to its limited ship loading and discharge capacity. In the absence of any improvement in this situation, it is difficultto project a growth of more than seven per cent per annum in rail hauled container volume over the forecast time-frame to 2017.
Projection of growth at seven per cent per annum would result in volumes of 59,000 TEU in 2007 and 116,000 TEU in 2017. Effectively, this would mean that only a second pair of trains per day1 would need to be added by 2007 and a third pair by 2017. However, if container volume originating in or destined for other South Asian and Central Asian countries can in future be moved directly by rail, the need to increase the daily number of container train pairs operating between Dhaka and Chittagong might be avoided completely.
5.1.2 India
Currently, all rail hauled international container traffic in India is port oriented - no containers are as yet rail hauled across borders.
Forecasts of international container traffic on TAR links in India were derived fromprojections presented in the Country Report for India. These projections assume:
$ Increasing containerisation of non-bulk trade commodities with leads of 300 km or greater;
$ Rail and road shares of the international container haulage business stabilizing at about 80 per cent and 20 per cent respectively; and
1 Assuming continuation of the present train configuration of 25 forty foot flat cars with an overall TEU capacityof 50.
66
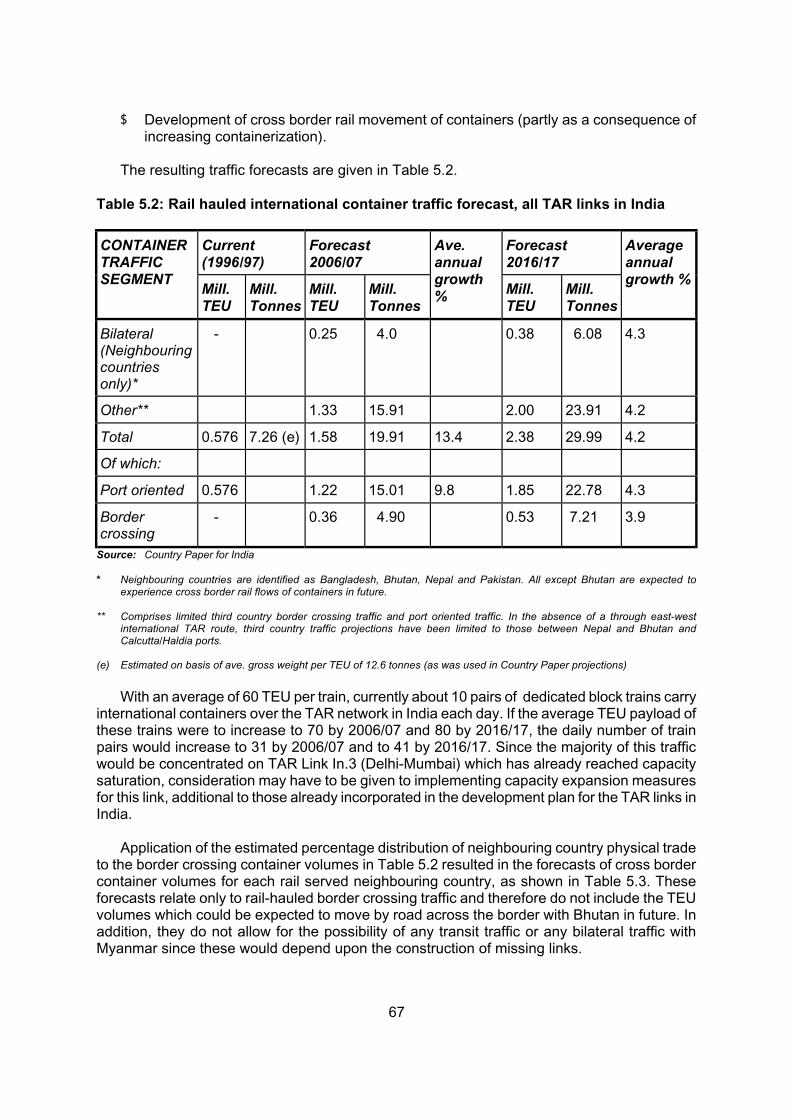
$ Development of cross border rail movement of containers (partly as a consequence of increasing containerization).
The resulting traffic forecasts are given in Table 5.2.
Table 5.2: Rail hauled international container traffic forecast, all TAR links in India
Current(1996/97)
Forecast2006/07
Forecast2016/17
CONTAINERTRAFFICSEGMENT
Mill.TEU
Mill.Tonnes
Mill.TEU
Mill.Tonnes
Ave.annualgrowth% Mill.
TEUMill.Tonnes
Averageannualgrowth %
Bilateral(Neighbouringcountriesonly)*
- 0.25 4.0 0.38 6.08 4.3
Other** 1.33 15.91 2.00 23.91 4.2
Total 0.576 7.26 (e) 1.58 19.91 13.4 2.38 29.99 4.2
Of which:
Port oriented 0.576 1.22 15.01 9.8 1.85 22.78 4.3
Bordercrossing
- 0.36 4.90 0.53 7.21 3.9
Source: Country Paper for India
* Neighbouring countries are identified as Bangladesh, Bhutan, Nepal and Pakistan. All except Bhutan are expected to experience cross border rail flows of containers in future.
** Comprises limited third country border crossing traffic and port oriented traffic. In the absence of a through east-west international TAR route, third country traffic projections have been limited to those between Nepal and Bhutan and Calcutta/Haldia ports.
(e) Estimated on basis of ave. gross weight per TEU of 12.6 tonnes (as was used in Country Paper projections)
With an average of 60 TEU per train, currently about 10 pairs of dedicated block trains carryinternational containers over the TAR network in India each day. If the average TEU payload of these trains were to increase to 70 by 2006/07 and 80 by 2016/17, the daily number of trainpairs would increase to 31 by 2006/07 and to 41 by 2016/17. Since the majority of this traffic would be concentrated on TAR Link In.3 (Delhi-Mumbai) which has already reached capacity saturation, consideration may have to be given to implementing capacity expansion measures for this link, additional to those already incorporated in the development plan for the TAR links in India.
Application of the estimated percentage distribution of neighbouring country physical trade to the border crossing container volumes in Table 5.2 resulted in the forecasts of cross border container volumes for each rail served neighbouring country, as shown in Table 5.3. Theseforecasts relate only to rail-hauled border crossing traffic and therefore do not include the TEUvolumes which could be expected to move by road across the border with Bhutan in future. In addition, they do not allow for the possibility of any transit traffic or any bilateral traffic with Myanmar since these would depend upon the construction of missing links.
67

Table 5.3: Forecast of rail hauled container traffic across India=s borders
Border betweenIndia and:
TAR links Initial year 2000/01TEU volume
2006/07 forecastTEU volume
2016/17 forecastTEU volume
Bangladesh In.1/Bn.1;In.5b/Bn.1
22,500 150,000 225,000
Nepal In.4/new 5 km link in Nepal
30,000 60,000 80,000
Pakistan In.1/Pk.1 50,000 in 2002/03 150,000 225,000
Using the same payload assumptions as were used in the calculation of train numbers forthe entire TAR network in India, the daily number of train pairs crossing each border may be calculated as follows:
2006/07 2016/17Bangladesh 5 6 Nepal 1 2 Pakistan 3 4
The additional number of trains indicated on each border crossing link is not of sufficient magnitude as to impose line capacity pressures on these links, although it is likely thatincreases in the border terminal capacities of neighbouring countries will have to becontemplated in order to ensure that the forecast number of trains can be accommodated.
5.1.3 Pakistan
Currently, no containers are road or rail hauled across Pakistan=s land borders, and all rail container haulage in Pakistan is port oriented. Rail movement of containers occurs between the seaport container terminals of Karachi and Qasim and seven dry port facilities (container handling terminals with full customs clearance services) in the hinterland at Lahore, Multan, Rawalpindi, Peshawar, Quetta, Sialkot and Faisalabad, all but the last two being operated by the Pakistan Railways.
In recent years, there has been a declining trend in the haulage of containers between theports and the hinterland dry ports, as is reflected in the trend in loaded container throughputs atLahore Dry Port shown in Table 5.4
Table 5.4: Loaded container throughputs, Lahore Dry Port
Imports Export TEU Total Loaded TEUYear
TEU volume % change TEU volume % change TEU volume % change
1993/94 19,169 10,881 30,050
1994/95 10,682 -45.3 8,895 -18.3 19,541 -35.0
1995/96 11,201 4.9 10,474 17.8 21,675 10.9
1996/97 9,467 -15.5 7,945 -24.2 17,412 -19.7
Source: Country Report for Pakistan
68

Lahore Dry Port handles between 90 and 95 per cent of all containers handled at the seven inland dry ports, so that the trend in its throughput is a good guide to the overall throughputtrend. To a large extent its declining throughput is a reflection of a slowdown in container imports through the ports of Karachi. In 1996/97, for example, the total volume of containerimports through Karachi and Qasim ports (460,670 TEU) declined by 16.5 per cent from theprevious year=s total - not greatly different from the decline of 15.5 per cent experienced in theLahore Dry Port=s throughput of import containers.
While the trend in the volume of containers handled at the Lahore Dry Port is also a goodguide to the trend in the volume of container haulage by rail to and from the hinterland, it must be noted that the railway transports only 20-22 per cent of all imported containerized cargo moving into the hinterland from the Karachi ports. As is the case in Bangladesh, the majority ofimport containers arriving in Karachi and Qasim ports appear to be unloaded within the port boundaries and their contents moved by road to consignees in the hinterland. Within recent years, rail=s competitive position in container haulage has been further eroded as a result of thelicensing of 16 private road carriers for the transportation of bonded cargo from Karachi todestinations in the hinterland.
In the base year of 1996/97, rail moved approximately 18,000 TEU between Karachi and thedry ports in the hinterland. More than 90 per cent of this volume moved to and from the Lahore Dry Port, via TAR Link Pk.1. With an average payload of 60 TEU per dedicated container train,this was scarcely equivalent to one train per day. Clearly, at its present level of operation, container transportation is not posing a line capacity problem on any of the relevant TAR links.
Freight traffic forecasts dissected by commodity/traffic segment were not made available for Pakistan. However, for the system as a whole, freight traffic forecasts based on conservative and optimistic growth assumptions were prepared in connection with the 9th Five Year Plan (1998-2003). The optimistic forecast represents an extreme case in that total freight traffic wasexpected to grow, by reason only of substantial investments to be committed to system development, from its 1996/97 achieved level of 4.607 billion tonne-km to 12.0 billion tonne-kmby 2003/04, growing at a rate averaging 17.3 per cent per annum. Alternatively, in the case ofthe pessimistic forecast, freight traffic was actually expected to decline by an average of four percent per annum to reach 4.1 billion tonne-km by 2003/04, under an assumption of diminishinginvestment in real terms.
Even if rail hauled container traffic could sustain growth at the optimistic rate of more than 17 per cent per annum (which is highly doubtful), the total haulage volume in 2006/07 (88,800 TEU) would require the operation of only two pairs of dedicated container trains per day. If growth continued at this rate until 2016/17 (even more unlikely), total container haulage volumewould reach 438,000 TEU per annum and daily container train operation would reach 10 pairsof trains per day. Only then would traffic growth impose pressures on line capacity on someTAR links.
A more realistic growth scenario for existing rail hauled container traffic might be a growthrate averaging six per cent per annum over the 20 year forecast time frame. This would compare with a GDP growth for Pakistan averaging 4.3 per cent per annum between 1994/95 and 1996/97. Achievement of a six per cent growth rate would result in rail hauled container volumes of 32,200 TEU by 2006/07 and 57,700 TEU by 2016/17. These volumes would require the operation of no more than one and two pairs of dedicated container trains per day respectively, scarcely imposing line capacity problems on any of the relevant TAR links.
69
Nevertheless, such a traffic growth outcome would depend on the continuation of improvements introduced to rail container operations in recent years. These have included:

$ Special reduced rates for empty container repositioning to service exports from Lahore and Faisalabad Dry Ports;
$ Special box rates for movement of containers from Port Qasim to dry ports in thehinterland;
$ Operational improvements to reduce waiting time of wagons prior to discharge/loading in Lahore Dry Port;
$ Operational improvements to reduce running times of dedicated container trains between Karachi and Lahore from 60 hours to 48 hours; and
$ Fixed timetable operation of dedicated container trains on two days of the week (Saturdays and Thursdays).
5.1.4 Islamic Republic of Iran
The only containers currently moved by rail across the borders of the Islamic Republic ofIran are those moved in transit between the Central Asian Republics and the ports of BandarAbbas and Bandar Imam Khomeini (but principally the former). Although it was reported by the Turkish Railways that significant volumes of cotton are moving by rail from Central Asia (via theborder stations of Razi/Kapiköy) for shipment from the Mediterranean ports of Mersin or Ískenderun, this traffic is understood to be moved in covered vans.
From data provided in the Country Report for the Islamic Republic of Iran, supplemented by road traffic data obtained during the ESCAP mission to Tehran in May 1998, it was estimated that the total volume freight traffic crossing the Sarakhs border by rail and road in 1997 was 786,000 tonnes, of which 550,000 tonnes was rail hauled.2 Of this latter volume, 446,000 tonneswas transit traffic.
Since no details of the container traffic component of this border crossing traffic were made available, it was necessary to estimate the volumes of border crossing container traffic on the basis of data provided by the Ports and Shipping Organization (PSO) of the Islamic Republic ofIran. PSO data indicated a total transit cargo volume through the ports of Imam Khomeini,Shahid Rajaee and Shahid Bahonar in 1997 of 1,116,000 tonnes. This represented 3.8 per cent of the total cargo throughput of those ports in the same year. Accordingly, it was estimated that 4% of the total container volume reported for all ports in the Islamic Republic of Iran in 1997 of316,384 TEU would represent transit cargo and that all of the resulting transit container volumewould pass through Sarakhs. This gave an estimate of 12,700 TEU passing through Sarakhs by rail and road in 1997, 70 per cent of which, or 8,900 TEU, was assumed to be rail hauled. Usingan average gross load per TEU of 12 tonnes, this TEU volume would translate into 106,800tonnes, representing 24 per cent of the total rail borne transit traffic volume in 1997. Theestimate of rail hauled transit container volume thus appears not to be unreasonable in relation to the overall rail hauled transit traffic.
2 Details of the calculation of these volumes appear in Table 10.2 of Chapter 10 of this report.
70

Given that future volumes of rail borne transit container traffic will depend not only on the trend in economic and trade indicators, but also on the rate at which existing transit freightvolumes can be containerized, a growth rate averaging nine per cent per annum over theforecast time frame might not appear unreasonable. This growth rate would produce a rail bornetransit container volume through Sarakhs of 21,000 TEU by 2006/07 and of 50,000 TEU by 2016/17. Given that container wagons are generally assembled into trains of 40 bogie wagons each west of Bafq, it is unlikely that container volumes on offer would be sufficient to justifyoperation of dedicated container trains until near the end of the forecast period in 2016/17. Eventhen, the required number of daily train pairs is unlikely to exceed one, which would not impose pressures on line capacity on any of the TAR links between Sarakhs and Bandar Abbas.
The other two main border crossings open to rail, at Mirjaveh/Koh-i-Taftan on the border withPakistan and at Razi/Kapiköy on the border with Turkey, do not carry container traffic at present.In fact, the Mirjaveh border processes less than 30,000 tonnes of traffic per annum, most of itcomprising commodities, such as sulphur and bitumen, which are unsuited to movement incontainers. Approximately 270,000 tonnes per annum of freight traffic moves across the Razi border by rail of which 200,000 tonnes is estimated to be transit traffic from Central Asia.3 As much as half of this volume might comprise cotton moved from Uzbekistan and Turkmenistan to the port of Mersin for shipping to Europe. All of this cotton volume is potentially containerizable and at an average payload per TEU of about 15 tonnes could yield an annual container volumeof 6,700 TEU in each direction. If this volume grew at a rate averaging nine per cent per year, it would reach 15,900 TEU by 2006/07 and 37,600 TEU by 2016/17. These volumes would be of too small a magnitude to add significantly to existing daily train density on TAR link Ir.1.
5.1.5 Turkey
Railway border crossing traffic through Kapiköy is identified in Sub-section 5.1.4 above. Atthe other major border open to rail - Kapikule on the border between Turkey and Bulgaria - some 200,000 tonnes and 14,000 TEU of container traffic is processed annually. According to the Turkish State Railways, this traffic has been experiencing rapid growth mainly as a result of the success of block train pricing. When visited during the course of the ESCAP mission toAnkara in March 1998, officials of the Turkish State Railways indicated an expectation that thistraffic would grow by 30 per cent in 1998. The strong growth prospects for the traffic wereboosted by the inauguration of scheduled container carrying liner trains between Europe andTurkey.
Among the major rail container services being operated from Europe are those of:
$ Acombi (an Austrian Railways affiliate), with scheduled container block trains running two times per week from Vienna to Halkali (location of an Inland Container Depot 27 km west of Istanbul); and
$ Intercontainer/Interfrigo, with scheduled container block trains running three times perweek from Shopron on the Austo-Hungarian border to Halkali.
Europe to Turkey traffic mostly comprises chemicals and auto parts and in the reversedirection manganese is the major commodity carried in containers. A major trade in textilesbetween Turkey and Europe has been lost to trucking owing to the acquisition by road hauliers
3 Source: Turkish State Railways.
71

of high cube vehicles and as a result to their enhanced ability to offer efficient door-to-door services.
If it is assumed that rail borne container volume across the Kapikule border reached 18,200TEU in 1998, it might not be unrealistic to expect growth throughout the 20 year forecast periodat a rate of about 11 per cent per annum. This would result in TEU volumes of 46,600 by 2006/07 and 132,300 by 2016/17. If it is assumed that container liner trains carry 90 TEU onaverage (30 wagons x 3 TEU each), then daily train density would increase to one in eachdirection from 2006/07 and to two in each direction from 2016/17. This would not affect linecapacity significantly, but might well require expansion of container terminal handling capacity.
5.2 Diverted traffic demand
Arguably the most promising and practical traffic opportunity for the TAR Southern corridor ispresented by the diversion to rail of intra-regional container traffic currently transported between origin and destination by a combination of land and sea modes. Most diverted traffic could makeuse of the TAR links which are currently in place, provided that existing border crossingobstacles to the smooth passage of this traffic could be removed. (Please see Chapter 10 for a discussion of the issues associated with improvement of border crossing procedures).
Diverted traffic might be presented in two forms:
$ International container traffic with an origin and a destination located within that part of the TAR Southern Corridor already served by continuous rail routes. This traffic results from the transportation needs of manufacturing industries and other trade sources whichare located mainly in the hinterland of the countries within the corridor. At present these needs are being satisfied by combined rail (or road) and sea transport, but would bebetter served in future by direct rail transport, with associated savings in time and cost to shippers. Overall, diversion of this traffic would result in a longer rail transport distance,with additional railway systems participating in the haul, but total trip distances would reduce substantially. In the case of some railway systems (e.g. that of India), traffic diversion will relieve capacity shortages on major trunk lines providing railwayconnections to the ports.
$ International container traffic which could be diverted from alternative transport modesonly after construction of missing links in the TAR network. This is basically traffic bound for or sourced in Yunnan Province of China, Thailand and Myanmar which wouldoriginate or be destined for locations in other countries within the TAR Southern Corridor. Examples of origin/destination pairs which would fall within this classification are: Kunming/Yangon, Kunming/Dhaka, Bangkok/Yangon, Bangkok/Dhaka, Yangon/Dhaka, etc. Not included within this classification are origins/destinations withinEurope and the northern portion of Central Asia, which as was observed in Chapter 3are better served to/from Kunming and Bangkok by alternative (i.e. non TAR) railwayroutes. The majority of divertible traffic within this category is at present transported byroad, although it is possible that a not insignificant volume moves by combined land and sea transport to/from Kunming.
Measurement of opportunities for traffic diversion were frustrated by a lack of adequate data, especially of port data on an origin/destination basis which would reveal container and other trade volumes moving between ports within the TAR corridor. What little data were availablewere used to identify divertible traffic by country, as exposed hereafter.
72

5.2.1 China
Within the TAR Southern Corridor, the major trade flow to and from China is between Yunnan Province and Myanmar. A 1994 study by the Asian Development Bank identified tradeflows in 1993 from Yunnan Province to Myanmar amounting to 700,000 tonnes per year andtrade flows in the reverse direction (Myanmar-Yunnan) of 420,000 tonnes per year.4 These volumes are substantially larger than the estimate of 568,000 tonnes derived from data on the number of border crossing vehicles supplied by the Border Trade Department of Myanmar, but itis likely that they include unrecorded trade which is likely to have been omitted from the secondsource.5 Alternatively, the Border Trade Department figures may simply reflect a recent declinein trade volume as a consequence of the Asian economic slump.
If the ADB figures are accepted as a base, then 246,000 tonnes or slightly more than onethird of the estimated volume of trade moving from Yunnan Province of China to Myanmarcomprises rice and other agricultural products which might be considered suitable for containerization (the remainder of the identified trade being in petroleum products andconstruction machinery neither of which might be suited to movement in containers). If an average payload of 15 tonnes per TEU were used, the total container volume moving in this trade would be about 16,400 TEU, or about 32,800 TEU for a two way flow.
There is another trade flow from Yunnan Province which is currently moved through ports onthe Chinese coast. The container element of this trade was estimated at 6,400 TEU per annum for the 1994 calendar year.6 However, it was not possible to dissect this volume by direction orto establish what proportion, if any, might be directed to other countries in the TAR SouthernCorridor.
It is possible that rail could in future capture all of the container trade moving between Yunnan Province and Myanmar, but it would be necessary first to construct the missing link of about 860 km between Dali and Lashio. If this project were to proceed, it is unlikely that a continuous rail connection between Kunming and Yangon would be available until towards theend of the forecast time frame, i.e. 2016/17. By that time, the container volume on offer might have grown to about 158,200 TEU (assuming three per cent per annum growth for the first four years, 11 per cent per annum growth for the next six years and eight per cent per annum growth for the second ten years of the forecast time frame). With an average of 66 TEU 7 per train, this volume would only be equivalent to about three pairs of trains per day.
4 ADB (1994), First Interim Report: Compilation of a Database ARegional Technical Assistance on Promoting Subregional Cooperation among Cambodia, China, the Lao People=s Democratic Republic, Myanmar, Thailand andViet Nam@.
5 For the three official border crossings between Myanmar and China, the total number of border crossing vehicles between April 1997 and January 1998 was recorded as 76,258. Using an average payload of 6.2 tonnes per vehicle (the payload which is typical for Indian vehicles operating in mountainous territory) and expanding the result to represent a complete year, a figure of 568,000 tonnes is derived.
6 ESCAP (1996), Trans-Asian Railway Route Requirements: Develoment of the Trans-Asian Railway in the Indochina and ASEAN Subregion, Vol.3, page 27.
7 Payload for container trains as indicated in the Country Report for China.
73

5.2.2 Thailand
Trade volume moving from Thailand to Myanmar in 1993 was estimated at 159,000 tonnes,of which 150,000 tonnes was believed to be comprised mostly of manufactured goods.8 In theother direction (Myanmar to Thailand), trade volume was estimated at 279,000 tonnes, with agricultural products (66,000 tonnes) and forestry products (121,500 tonnes) comprising two thirds of the total.
Trade in both directions between Thailand and Myanmar currently moves by sea (i.e.shipping services between Bangkok/Laem Chabang and Yangon), road transport across the principal land border at Mae Sot/Myawaddy and by short-sea service between Ranong and Kawthaung, in southern Thailand and Myanmar respectively. It is not known what proportion of this trade (if any) is currently containerized, but since the trade is not part of the global maritimetrade flows, it is unlikely that it would be containerized. The major opportunity for containerization of this trade might then be presented by the flow of manufactured goods from Thailand to Myanmar, estimated to amount to 150,000 tonnes in 1993. Assuming an averagepayload of 15 tonnes per TEU, this volume would be equivalent to 10,000 TEU per annum one way or 20,000 TEU for a two way flow.
In addition to the two way flow of trade between Thailand and Myanmar, trade flows between Thailand and countries within the TAR Southern Corridor, to the west of Myanmar, would also represent long term potential traffic for the TAR. Unfortunately, it was not possible to obtain data on the current volumes involved, all of which are likely to be moved by sea transport.
Preliminary forecasts of traffic likely to move on the rail links planned between Thailand andMyanmar were prepared as part of the feasibility study on the Kunming-Singapore Rail Link9,but at the time of writing the status and reliability of these forecasts were uncertain.Consequently, these forecasts were not used in the present study.
As would be the case with potentially divertible traffic to/from Yunnan Province of China, thediversion to rail of traffic to and from Thailand would depend on the completion of the relevantmissing link (Nam Tok - Thanbyuzayat) and this also could not be expected to occur before theend of the forecast time frame, i.e. around 2016/17. If base trade volumes equivalent to about20,000 TEU per annum are accepted as potential traffic to and from Thailand which might bediverted to the TAR and if traffic growth could be expected at the rate of three per cent perannum for the first four years, eleven per cent per annum for the next six years and eight percent per annum for the second ten years of the forecast time frame, the total of such trafficmight be expected to reach 90,900 TEU by 2016/17. Assuming a payload for container trains averaging 60 TEU, approximately two pairs of trains per day would be needed to transport thistraffic.
8 ADB (1994), First Interim Report: Compilation of a Database ARegional Technical Assistance on Promoting Subregional Cooperation among Cambodia, China, the Lao People=s Democratic Republic, Myanmar, Thailand andViet Nam@.
9 Malaysia, Ministry of Transport (1998), Interim Report on Feasibility of Singapore to Kunming Rail Link, Kuala Lumpur.
74

5.2.3 Myanmar
Myanmar=s current level of trade with Yunnan Province of China and with Thailand was identified in the preceding sections. In addition, there are small volumes of trade with India and with Bangladesh which cross established borders at Tamu (Myanmar)/Mori (India) and Maungdaw (Myanmar)/Teknaf (Bangladesh) and which might represent potential traffic for the TAR upon construction of the missing link between Kalay (Myanmar) and Jiribam (India). These volumes were estimated on the basis of information supplied by the Border Trade Department of the Government of Myanmar as 28,000 tonnes per annum for bi-directional Myanmar-India trade and 12,000 tonnes per annum for bi-directional Myanmar-Bangladesh trade respectively.
The trade with India, which moves across the border by truck, is believed to comprise exports of mainly pulse crop and forest products and imports of construction materials. Possiblyhalf of this traffic could be diverted to rail upon completion of the TAR link towards the end of the forecast period in 2016/17. If it is comprised mainly of agricultural products, a payload of 15tonnes per TEU might be assumed, resulting in an equivalent TEU volume of only about 900 or1800 in both directions. If this traffic were to grow at three per cent per annum for the first fouryears, at eleven per cent per annum for the next six years and at eight per cent per annum for the second ten years of the forecast time frame, it would reach a volume of about 8,200 TEU by2016/17. This volume would be insufficient to justify operation of a pair of trains per day or evenone pair every 3-4 days.
Trade between Myanmar and Bangladesh currently moves in small boats across the inletseparating Maungdaw from Teknaf. Since this is considered to be mostly local border trade, it is unlikely to represent potential traffic for the TAR network in future and has therefore been excluded from the traffic forecasts for this study.
There is the possibility that additional trade currently moving by combined rail/road/ IWT and sea transport between Myanmar and neighbouring countries within the TAR Southern Corridor might also be diverted to rail following construction of the missing link between Kalay andJiribam. However, owing to the non-availability of data, it was not possible to estimate themagnitude of this trade.
5.2.4 Bangladesh
Apart from the diversion of trade currently moving by combined road or rail and sea transportbetween Bangladesh and its neighbouring countries in the TAR Southern Corridor, the TARlinks in Bangladesh might also have the potential to divert traffic moving between the sevennortheastern states of India and the seaports via the narrow corridor (or Achicken=s neck@)between Nepal and Bangladesh, as well as traffic moving between the northeastern states and the rest of India via the same corridor. It may be argued that there could be compelling time andcost advantages in future for moving foreign trade volumes to and from northeastern India via the Port of Chittagong rather than via the ports of Calcutta or Haldia. These advantages might arise from the fact that the distance from Lumding in northern Assam State to Chittagong Port islittle more than 600 km by rail as compared with approximately 1,400 km to Calcutta. However,their realization might depend upon the ultimate re-gauging of the metre gauge rail system innortheastern India and in eastern Bangladesh, as well as enhancement of the capacity andefficiency of Chittagong port which currently would not be capable of servicing trade to or from northeastern India.
75
Data received from the Port of Chittagong Authority were unfortunately not sufficientlydetailed to permit an estimate to be made of the volume of container trade which might in futurebe diverted to direct rail services on the TAR network. It is believed that cotton traffic from Central Asia might represent the most significant opportunity for such diversion.
In the case of the potential for diversion of traffic moving into and out of the northeasternstates of India, data contained in a recent study suggest that the volume of such traffic carried by rail and river transport during the 12 month period to the end of March 1995 amounted to 6.2 million tonnes inbound and 3.1 million tonnes outbound.10 Of the inbound tonnage, nearly 80 per cent (4.99 million tonnes) consisted of coal, coke and cement - all presumably moved inspecialized bulk wagons or vessels - and less than two per cent (99,300 tonnes) consisted ofagricultural products which might be amenable to containerization. Of the outbound tonnage, nearly 60 per cent (1.87 million tonnes) consisted of teak and other forestry products and only51, 091 consisted of commodities, such as oil seeds, sugar and tea, which might be suited tomovement in containers. This trade might therefore produce a two way container flow amountingto about 13,000 TEU per annum, but it was not possible to determine the split of this volume byrail and river, or indeed to estimate what proportion would be port directed (as compared withrest of India directed).
Although not explicitly stated, it appears that the potential for diversion of traffic to/from northeastern India via Bangladesh may have influenced a strong growth forecast for border crossing container traffic in the Country Report for India (see sub-section 5.1.2 above). Using information presented in this report, a forecast of container volume crossing the border with Bangladesh was derived as follows: 244,000 TEU and 5 daily train pairs by 2006/07 and 364,000 TEU and 6 daily train pairs by 2016/17. It is presumed that these volumes would mostlymove across the Darsana/Gede border, but what proportion would also move across theShahbazpur/Mahisasan border could not be forecast on the basis of the available information.
5.2.5 India
The traffic forecasts contained in the Country Report for India and addressed in sub-section 5.1.2 above include at least some allowance for traffic diversion possibilities. They also includean allowance for the potential to divert trade with other countries within the TAR SouthernCorridor from combined land and sea transport to direct rail transport. Insufficient port baseddata was available as a basis for making such a forecast.
5.2.6 Pakistan
Rail currently handles nearly 100 per cent of the traffic crossing the land border betweenIndia and Pakistan through the one designated border checkpoint at Attari/Wagah. Thereforethere is little potential to attract increased border crossing traffic from road. For the same reasons given in sub-section 5.2.5, it was also not possible to forecast the volume of trade with
10 Statistics from the Directorate General of Commercial Intelligence and Statistics, Government of India, reported in R. Sobhan (1998), Pilot Study on Impact of Improving International Transit Links and Facilitation Measures in Bangladesh, India, Myanmar, Thailand, and Yunnan Province of China (Draft Report), ESCAP.
76

other countries in the corridor which it might be possible to divert from combined land and seatransport to direct rail transport.
5.2.7 Islamic Republic of Iran
In the Islamic Republic of Iran, the major opportunity for traffic diversion would be presentedby trade which currently moves between Central Asia and other countries in the corridor via the port complexes at Bandar Abbas and Bandar Imam Khomeini. In sub-section 5.1.4 above, it was estimated that the rail hauled container volume associated with this trade amounted to about 9,000 TEU and that this volume might reach 21,000 TEU by 2006/07 and 50,000 by 2016/17. It was not possible to determine what proportion of this volume originates or is destined forEuropean, as distinct from other Asian, countries. However, a 50/50 split of this traffic betweenEurope and Asia, could mean that volumes of 10,000 TEU and 25,000 TEU could cross the border between the Islamic Republic of Iran and Pakistan by rail in 2006/07 and 2016/17respectively.
5.3 Generated traffic demand
The closing of gaps in the TAR network through the construction of missing links between China and Myanmar, Myanmar and India and within the Islamic Republic of Iran, as well asthrough the re-gauging of the existing metre gauge rail system in northeastern India, might beexpected to lead to the creation of new industries in the areas through which these new linkswould pass and so generate new demand for rail services. It might reasonably be expected that this generated traffic demand would be concentrated within the seven northeastern states of India, where arguably, the poor state and coverage of transport infrastructure has been a brake on development. Four of these states, i.e. Meghalaya, Manipur, Tripura and Mizoram, are especially rich in natural resources (minerals and forestry) and together with the predominantly agricultural state of Assam might be expected to benefit from the unlocking of the area=sresources as a result of having high quality rail access to Myanmar, Bangladesh and (through Bangladesh) to the rest of India.
Measurement of the economic linkages and traffic generation potential of rail network expansion and upgrading would require a major specialized study which was certainly beyond the scope of the present study. However, while no measurement of the generated traffic benefits of TAR network development was possible for this report, it is conceivable that generated traffic demand could add significantly to the volume of traffic on offer for future movement on the TARnetwork and might therefore be critical in providing an acceptable rate of return for the capitalworks associated with such a development programme.
5.4 Summarized forecasts of border crossing traffic
The forecasts of rail hauled container traffic across the national borders of the TAR SouthernCorridor, as developed in the preceding sections, are summarized in Table 5.5.
5.5 Traffic forecasts in relation to missing link construction
In Chapter 4, the threshold traffic levels needed to justify investment in the construction ofmissing links in the TAR Southern Corridor network were identified. The high order ofconstruction cost influenced by the severity of the terrain through which most of these links would have to pass resulted in annual threshold tonnages of a high order of magnitude.
77

Table 5.5: Summarized forecasts of rail hauled border crossing container traffic
Year
Current (1996/97) 2006/07 2016/17
Border between:
TEU p.a. Daily train pairs
TEU p.a. Daily train pairs
TEU p.a. Daily train pairs
China/Myanmar - - - - 158,200 3
Thailand/Myanmar 90,900 2
Myanmar/India
Bangladesh/India (Darsana/Gede) - - 150,000 2.9 225,000 3.9
India/Nepal - - 60,000 1.2 80,000 1.4
India/Pakistan - - 150,000 2.9 225,000 3.9
Pakistan/Islamic Republic of Iran - - 10,000 - 25,000 -
Islamic Republic of Iran/Turmenistan 9,000 (e) - 21,000 - 50,000 1
Islamic Republic of Iran/Turkey - - 16,000 - 38,000 -
Turkey/Bulgaria 14,000 - 47,000 - 132,000 2
Table 5.6 provides a comparison of the forecast border crossing traffic tonnages (for allmodes) with the estimated threshold tonnage requirements for each missing link.
The forecast data appearing in the last two columns of Table 5.6 relate to the total tonnage carried across borders by all modes. These forecasts were derived by applying the growth factors set out in the preceding sections to the estimated current border crossing volumes.
Table 5.6: Traffic forecasts in relation to threshold tonnage requirement, missing links
Forecast border crossing freighttonnage, all modes (million tonnes p.a.) by:
Missing link Estimated thresholdtonnage requirement( million tonnes per annum)
2006/07 2016/17
Dali-Ruili (China) 17.4 2.4 5.1
Ruili/Mu-se - Lashio (Myanmar) 14.0 2.4 5.1
Nam Tok - Three Pagoda Pass (Thailand) 7.3 0.9 2.0
Three Pagoda Pass - Thanbyuzayat (Myanmar) 7.1 0.9 2.0
Kalay-Tamu (Myanmar) 8.7 0.06 0.1
Tamu-Jiribam (India) 9.9 0.06 0.1
Kerman-Zahedan (Islamic Republic of Iran) 9.2 0.3 0.6
The table indicates that in no case would the threshold tonnage requirement be met by theforecast traffic on offer, even in the unlikely event that rail would secure 100 per cent of this traffic. However, it has to be noted that these forecasts do not allow for generated traffic demand, as described above. It is likely that the justification of all of the listed missing link
78
construction projects would depend heavily on identification of an adequate level of generated traffic demand.
5.6 General observations concerning traffic demand forecasts
This attempt at estimating the traffic potential of the TAR Southern Corridor network was frustrated by an almost complete absence of basic data on rail and shipping traffic between given origin and destination pairs. Even in the case of traffics for which it could be expected thatcomprehensive data records would be maintained, such as the flows of transit containers acrossthe border between Turkmenistan and Iran, the data did not appear to be available.
Nowhere was the absence of data more apparent than in the case of port to port containerflows within the subregion. Certainly, the administrations of many ports in the subregionexperience difficulty in identifying the ultimate destinations of containers when the majority oftheir containers are shipped via transhipment ports and even when this is not the case adestination in the hinterland of the receiving country may not always be disclosed on documentation available to port authorities. However, given the apparent advantage for the TAR to divert container traffic from the port system, it is essential that the relevant railway authoritiesattempt to measure the potential volume available from such traffic diversion, as a suitable basisfor forecasting.
Further, if in future it is planned to undertake forecasts of generated traffic demand as part of studies of the economic linkages of TAR (or any other transport) infrastructure development projects, the ability to establish base levels of traffic between given origins and destinations will be vital.
79

6. TECHNICAL REQUIREMENTS
A primary requirement of the Trans-Asian Railway network is that it should in future permit rail conveyance of shipping containers of all types and sizes either currently used or likely to be used in international trade, at speeds which are competitive with those of alternative transport modes.
The practical implications of this requirement are that:
(i) The limiting dimensions of structures throughout this network should be sufficient to allow unrestricted passage of wagons conveying the highest and widest containers used in international trade - i.e. the structure gauge adopted for the network should provide adequate clearance for such containers carried at normal running speeds ;
(ii) The maximum allowable axle loads throughout this network should be sufficient to allow conveyance of such containers in trainloads of economic size and configuration. In practice, this would mean that axle loads would need to be sufficient for the conveyance on a single wagon of the equivalent of two (and in some cases three) twenty foot containers loaded up to or near theirmaximum payload or for the operation of locomotives of adequate power rating1;
(iii) The maximum allowable line speeds throughout the network must be consistent with the realization of commercial speeds which are competitive with those of alternative transportmodes (bearing in mind that maximum line speed is only one of the factors influencing commercial speed, other important ones being operational and border crossing stopping times, signalling system performance, infrastructure condition, and motive power and rolling stockcondition and performance).
This chapter provides a detailed assessment of these technical requirements in the light of the primary function of the TAR as identified above and of the extent to which they are met on theconstituent networks of the railway organizations participating in the TAR Southern Corridor project.It draws upon inputs provided in the Country Reports, in addition to information provided in the ESCAP preliminary study report.
6.1 Load and structure dimensions
6.1.1 Standards and requirements
The high-cube container with dimensions 40ft (length) x 8ft (width) x 9ft 6ins (height) is thelargest container which is currently carried by railways of the region. However, as may be observedfrom Table 6.1, super high cube containers of 45-53ft (length) x 8ft 6ins (width) x 9ft 6ins (height) are being used in increasing numbers and should provide for the railways of the region the constraintswhich must be satisfied by the design of future container wagons and the dimensions of structures throughout the TAR network. These structures, such as tunnels and through truss bridges, must besufficiently wide and high to provide adequate clearance for super high cube containers loaded on conventional container wagons (with a typical height of 1.1 metres above the rails) to pass at normalspeed.
1 In the majority of cases, it is likely to be the axle loading of locomotives, rather than that of the container wagons,which will provide the overall axle load constraint for the system.
80

To allow for vertical and lateral movement of wagons due to track irregularities or vehicledynamics on curved track sections, a clearance of about 40 cm between the outside dimensions of wagons and their loading and the inside dimensions of structures typically has to be allowed.
The use of low profile wagons (i.e. wagons with wheels of small diameter or with dropped centresections) can sometimes be used to overcome structure constraints without the need to expand the inside dimensions of structures at often prohibitive cost.
Table 6.1: Dimensions and maximum weights of most commonly used ISO and non-ISOcontainers
External height External width External length Freightcontainerdesignation ft in mm ft in mm ft in mm
Maximumgross weight(tonnes)
ISO
1A 8 0 2,438 8 0 2,438 40 0 12,192 30
1AA 8 6 2,591 8 0 2,438 40 0 12,192 30
1B 8 0 2,438 8 0 2,438 30 0 9,125 25
1BB 8 6 2,591 8 0 2,438 30 0 9,125 25
1C 8 0 2,438 8 0 2,438 20 0 6,058 24
1CC 8 6 2,591 8 0 2,438 20 0 6,058 24
1D 8 0 2,438 8 0 2,438 10 0 2,991 10
Non-ISO
(1) 9 6 2,896 8 0 2,435 48 0 14,630 35
(1) 9 6 2,896 8 0 2,435 45 0 13,716 35
(1) 9 6 2,896 8 0 2,435 40 0 12,192 35
(1) 9 6 2,896 8 0 2,435 20 0 6,058 35
(2) 9 6 2,896 8 6 2,591 53 0 16,150 35
(2) 9 6 2,896 8 6 2,591 48 0 14,630 35
(2) 9 6 2,896 8 6 2,591 45 0 13,716 35
(1) = High Cube Container; (2) = Super High Cube Container
Source: ESCAP, 1991: AStudy on the Cost Benefit and Problems Following the Introduction of High Cube Containers in Developing Countries of the ESCAP Region@
6.1.2 Conformity of individual railway systems with TAR structure profile standards
This section reviews the extent to which the existing railway networks conform with the load andstructure dimensional standards described above and identifies specific instances where conformitymight present a problem.
(i) Bangladesh
81
Throughout the broad gauge system in Bangladesh, there are no restrictions imposed on theconveyance of containers of any size when loaded on flat wagons of standard height (1010 mm).The only such restriction existing on the metre gauge system is to be found at one bridge (the Karnafully Bridge) in the Chittagong-Dohazari section of TAR Link Bn.2a. This restriction can be removed by modifying the portal frame of the bridge to accept containers of up to 9ft 6in in height and 8ft 6in in width loaded on standard flat wagons. Figure 6.1 illustrates the structure dimensions applying throughout the Bangladesh rail system.
(ii) China
The dimensional standards adopted throughout China for the design of railway structures in allnew construction work are understood to be sufficient to accommodate high cube containers carried on flat wagons of conventional height. The Country Report for China has also indicated that theroutes nominated by China for inclusion in the TAR Southern Corridor network would be capable of transporting containers of Amaximum width and height@ on a Astandard flat [email protected]
The standard applied by the Chinese Railways is illustrated by the structure gauge diagram in Figure 6.2.
(iii) India
While the Country Report for India has indicated that all nominated TAR links in India conformwith the structure and vehicle gauge standards specified for the TAR network, this observationapplies only to the nominated broad gauge links. The metre gauge links, which are confined to the Northeastern States, do not conform with these standards.
Restrictions applying to the dimensions of vehicles (and their loads, as applicable) throughout the Indian Railways network are as follows - again it is assumed that these restrictions apply in respectonly of the broad gauge network:
Maximum width 3,250 mm (10ft 8ins)Maximum height above rail level at track centre 4,140 mm (13ft 7ins) Maximum height above rail level 3,530 mm (11 ft 7ins)
While both high cube and super high cube containers would infringe this vehicle gauge if carriedon standard height (1,000 mm) wagons, they are classified as Aover dimensional consignments@ and are permitted to move, but at a maximum speed of 75 km per hour.
The structure and vehicle gauges applicable to lines with a track gauge of 1,676 mm in India areillustrated in Figure 6.3.
(iv) Islamic Republic of Iran
A diagram illustrating the structure and vehicle gauge applicable to all 1,435 mm lines in theIslamic Republic of Iran is given in Figure 6.4. This diagram indicates that super high cube containers would certainly, and that high cube containers would probably, infringe the structuregauge, if carried on standard flat wagons, while ISO containers of 8ft 6in height would infringe the vehicle gauge of the network. However, the latter may be carried since there would be greater than40 cm clearance between the outside dimensions of the wagon with its container load and the inside dimensions of structures.
2 Xu Tao: AReport on Trans-Asia Railway Corridor in China Territory@, August 1998.
82

On the railway system of the Islamic Republic of Iran, the most critical structure limitations are tobe found between Tehran and Tabriz, where mountainous terrain has required extensive tunnelling. It is understood that there are six tunnels in the section Km 427.6 - Km 497.25 (distances measuredfrom Tehran), ranging in length from 537 to 1,726 metres.
(v) Myanmar
Myanmar has the most restrictive outline gauge of all the participating railway systems. Thestandard applicable to lines constructed more than ten years ago is as illustrated in Figure 6.5. The dimensions of structures on the Myanma Railways system are generally incompatible even with themovement of standard ISO containers (of no more than 8ft in height) if conveyed on standard heightflat wagons. The Myanma Railways have attempted to overcome this difficulty with the use of dropped centre section, or well type, wagons imported from China. A major limitation of these vehicles, however, is that they may only carry a single 20ft container in the well section. In the longer term, the Myanma Railways have a programme to enlarge the dimensions of critical structures (particularly of through truss bridges) on trunk lines, such as Yangon-Mandalay, which are expectedto have an important container carrying role.
It is also understood that more generous structure dimensions have been designed into new line construction projects, of which there have been many over the past ten years, but no details of these new design standards have been made available.
(vi) Pakistan
Structure dimensions impose restrictions on the movement of super high cube containers at only two locations on the TAR links nominated by Pakistan. They are as follows:
$ On Link Pk.1, a tunnel at Km 263, between Spezand and Sibi provides clearance of only 29cm between the inner tunnel wall and the top corners of super high cube containers loaded on wagons of 1200 mm height. In this case, the vehicle gauge infringement is 5.1 cm.
$ On Link Pk.4, a tunnel at Km 1608, between High Attock City and Peshawar, restricts the clearance available for super high cube containers loaded on wagons of 1200 mm height to 36.8 cm. In this case, the vehicle gauge infringement is 6.3 cm.
These restrictions are illustrated by the cross-sectional diagrams in Figure 6.6. It should be notedthat these diagrams represent an extreme case in that the use of 1200 mm high wagons has beenassumed, when in fact the floor height of the standard BKF container flat wagons in use in Pakistan is only 1105 mm. Use of lower profile wagons would in both cases allow passage of high profile containers with only minimal speed restrictions. However, a preliminary estimate of the cost of widening the restricting tunnel on Link Pk.1 is US$ 130 million, with a work time frame estimated at 12 months3.
(vii) Sri Lanka
The vehicle and structure gauge standards currently in force throughout the railway network ofSri Lanka are depicted in Figure 6.7. They restrict the size of containers carried on the network tothose with a width of 8 ft 6in and a height of no more than 8 ft. Extensive structure modifications
3 Pakistan Country Report
83

would be required on the TAR links nominated by Sri Lanka to permit them to accommodate containers with heights of 8 ft 6in and 9 ft 6in.
(viii) Thailand
It is likely that the two TAR links being proposed as possible alternative connections with Myanmar (Th.1a or Th.1b) would be designed to accommodate super high cube containers. However, it is likely that there will be some structures (especially through truss bridges) which wouldrestrict passage of such containers on the existing line between Nam Tok and Bangkok.
(ix) Turkey
The loading gauge diagram supplied by the Turkish State Railways (Figure 6.8) indicates that containers of 9ft 6in height when loaded on Turkish flat wagons of 1200 mm height would infringethe loading gauge and further that the clearance between the upper corners of the container and the inside dimensions of structures would only be about 10 cm. This difficulty could be overcome by adopting a new lower profile wagon, since super high cube containers could pass with sufficientclearance through structures if loaded on wagons of 1010 mm height. The diagram also indicatesthat there would be no restriction on the passage of containers of 8ft 6in height even if loaded on wagons of 1200 mm height, since such containers would not infringe the loading gauge.
(x) Summary - conformity with TAR structure profile requirements
In summary, the extent to which the participating railway systems conform with TAR requirements on structure profiles is given in Table 6.2.
Table 6.2: Conformity with structure profile requirements
Will TAR links accept?….
Bangladesh China India IslamicRepublic
of Iran
Myanmar Pakistan SriLanka
Thailand Turkey
8 ft high ISO Yes Yes Yes Yes No Yes Yes Yes Yes
8 ft 6 in high ISO Yes Yes Yes2 Yes No Yes No Yes Yes
9 ft 6 in high non-ISO
Yes1 Yes Yes2 No No Yes No Yes No3
1 With modification of the structure of a single bridge on Link Bn.2a 2 Likely to apply only to broad gauge links 3 Could be accommodated with use of lower profile wagons
6.2 Axle load
6.2.1 Standards and requirements
The key determinant of axle load requirements for the TAR network is unlikely to be themaximum load bearing on track through the axles of a container wagon, but rather the maximum axle loading of locomotives used for freight haulage. While lightweight, high horsepower diesel
84

locomotives have recently been developed for service on metre gauge lines, the trend is to heavier units as the power rating increases.4
Based on broad and standard gauge service requirements, the maximum gross weight (emptyweight plus the weight of fuel) of 3,000-3,500 HP locomotives is typically around 112-115 tonnes andwith a Co-Co wheel configuration (6 axles), the maximum load bearing through axles is approximately 19 tonnes. This would apply to diesel-electric locomotives, since electric locomotives(not having the heavy diesel power plants and generators of the diesel electric locomotives) areusually much lighter. The maximum axle loading of metre gauge locomotives is usually much lighter,typically not more than 15 tonnes.
By comparison, the maximum axle load likely to be imposed through the axles of container wagons can be calculated, using as a basis, the largest container carrying wagons employed on the metre gauge and standard/broad gauge systems.
Excluding the Astate-of-the-art@ lightweight container flat wagons now being introduced in India,the container flat wagons most commonly used on the broad gauge networks of both India and Pakistan have a length of 45 ft (13.7 metres), a tare weight of 20-21.5 tonnes and a payload capacityof about 48 tonnes, giving a maximum gross weight of 68-69.5 tonnes and an axle load of 17-17.37 tonnes.
On the standard gauge network of the Islamic Republic of Iran, container flat wagons of 20 metrelength, with fittings to carry up to three ISO 20 ft containers (albeit at restricted weights of 18 tonneseach5) are in use. These have a tare weight of 25 tonnes and a maximum payload of 55 tonnes,giving a gross weight of 80 tonnes and an axle load of 20 tonnes.
Recent purchases of container wagons by the State Railway of Thailand for service on its metre gauge system have been concentrated on wagons with a 15 tonne axle load, which hitherto has been the maximum permissible axle load on the system. The most recently introduced wagons havea length of 14.2 metres (sufficient to carry containers of up to 45 ft in length), a tare weight 16.5tonnes and a maximum payload of 43.5 tonnes. The axle loading of the heaviest locomotives in useon the Thai system is also 15 tonnes. It should be noted, however, that the future introduction by metre gauge systems of container wagons able to carry up to three ISO 20 ft containers is notinconceivable. Indeed, a three slot container wagon has already been developed for the 1067 mm gauge system of the Queensland Railways in Australia. If such were the case, then track and structures should be designed for a maximum axle loading of about 19-20 tonnes.
It is worthy of note that while a maximum axle load of 15 tonnes appears to have been the standard for some of the metre gauge railways of the region, there is evidence that these railways are now opting for a heavier axle load standard. For example, KTMB, the Malaysian Railway has aprogramme to progressively upgrade the maximum axle load on its mainlines to 20 tonnes and the State Railway of Thailand has recently embarked on a major track and bridge rehabilitation project which will also result in a 20 tonne axle load being applied on all major lines in Thailand. The benefits to be gained from such an upgrade are increased tonnage throughput capacity andreduced operating cost per gross tonne km, resulting in increased financial contribution.
4 One development in locomotive design which has worked against the increase in gross weight as power increases is the incorporation of computer wheel slip control, as a means of improving adhesion without additional weight penalty.
5 In practice, there is very little demand for transportation of containers at or near their maximum gross weights. In thecase of 20ft ISO containers, even containers loaded with dense commodities rarely weigh in at more than 18 tonnes.
85

There are compelling arguments in favour of adopting one axle load standard for those parts ofthe TAR network for which interchangeability of rolling stock, and possibly of locomotives, between railway systems is a practical option. This will generally apply to the standard and broad components of the network. It is evident that a 20 tonne axle load will satisfy the needs of international container traffic likely to use these components of the TAR network, in terms of accommodating the highestloads likely to bear on track through the axles of container wagons or of the high horsepower locomotives needed to haul container trains of economic configuration. While it may be argued that axle loadings of this magnitude might never be imposed on metre gauge track and structures, it has been assumed that the other benefits accruing to metre gauge operators will be sufficient to justifytheir adoption of a 20 tonne axle load in the longer term. However, from the perspective of meeting the heaviest axle loads likely to be imposed by locomotives and rolling stock, it would be sufficient if the metre gauge components of the TAR network could be designed in future to accommodate axle loadings of up to 15 tonnes.
6.2.2 Conformity of individual railway systems with TAR axle load standards
(i) Bangladesh
Axle load limits currently applying within Bangladesh are 22.5 tonnes on the broad gauge systemand 13 tonnes on the metre gauge system.
(ii) China
For existing trunk lines in China, maximum permissible axle loads are understood to range between 21.5 and 23 tonnes, suggesting compatibility with a TAR minimum 20 tonne requirement. It is likely that the same axle load standards will be applied to all new line construction being undertaken by the Chinese Railways.
(iii) India
The axle load limitations in force throughout the TAR links nominated by India are currently 20.32tonnes on broad gauge track and 12.70 tonnes on metre gauge track. The Indian Railways has longterm plans for the upgrading of its broad gauge trunk lines to permit axle loading of up to 22.1 tonnes.
Only the one metre gauge link among these nominated links (In.5b) does not conform with a TAR20 tonne requirement. However, the Indian Railways has long term plans to convert all remaining metre gauge lines to broad gauge and since this effectively involves complete reconstruction of the formation and trackwork, these lines also will conform with broad gauge standards in future.
(iv) Islamic Republic of Iran
The maximum permissible axle loading on all nominated TAR links in the Islamic Republic of Iranis 20-22.5 tonnes.
(v) Myanmar
A maximum axle load of only 12.5 tonnes is applied on the existing main lines from Yangon to Myitkyina and to Moulmein. However, it is understood that new line construction projects in Myanmarare being designed to a maximum axle load of 15 tonnes.
(vi) Pakistan
86

The axle load limits currently in force on the TAR links nominated by Pakistan are given in Table6.3
Table 6.3: Axle loads in Pakistan
TAR Link From/To Maximumpermissible axle load (tonnes)
Pk.1 Koh-i-Taftan/SpezandSpezand/SukkurSukkur/Wagah
17.2717.7822.86
Pk.2 Spezand/Chaman 17.78
Pk.3 Rohri/Karachi 22.86
Pk.4 Lahore /Peshawar 22.86
Pk.5 Shahdara/Sangla Hill Sangla Hill/Khanewal
22.86
In general, the light axle load sections are concentrated to the west of Spezand where therailway traverses arid mountainous terrain. However, even these sections pose no restriction on themovement of containers loaded on conventional 2 TEU wagons, since in Pakistan these wagons have a maximum axle loading of 16.25 tonnes. The major disability associated with light axle loadson these sections is that they require the use of light locomotives and the double heading of trains for a greater distance than would be the case if heavier locomotives could be used.
(vii) Sri Lanka
An axle load limit of 16.5 tonnes currently applies throughout the Sri Lanka railway network, hence axle load poses no impediment to the movement of containers on conventional 2 TEU wagons.
(viii) Thailand
As observed earlier, the maximum axle load currently in force throughout the Thai railwaynetwork is 15 tonnes, but the standard adopted for all new construction is 20 tonnes and this is also the standard applying to the rehabilitation of the existing main lines.
87
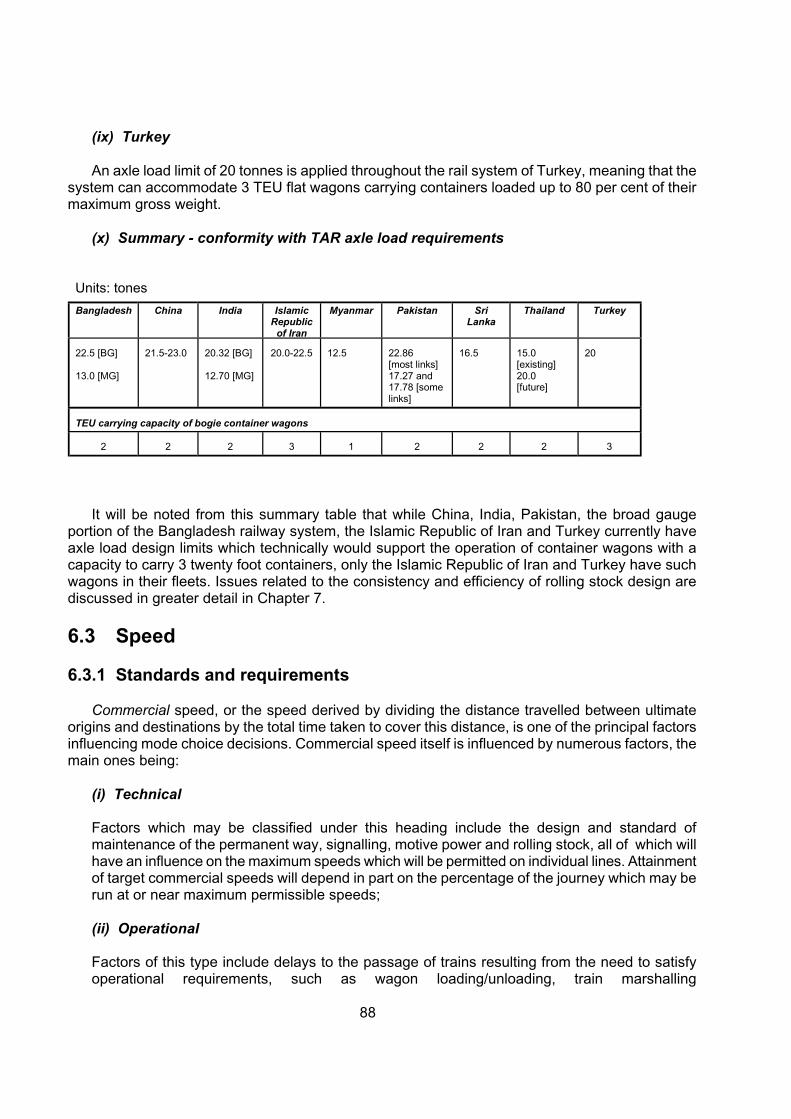
(ix) Turkey
An axle load limit of 20 tonnes is applied throughout the rail system of Turkey, meaning that thesystem can accommodate 3 TEU flat wagons carrying containers loaded up to 80 per cent of their maximum gross weight.
(x) Summary - conformity with TAR axle load requirements
Units: tones
Bangladesh China India IslamicRepublic
of Iran
Myanmar Pakistan SriLanka
Thailand Turkey
22.5 [BG]
13.0 [MG]
21.5-23.0 20.32 [BG]
12.70 [MG]
20.0-22.5 12.5 22.86[most links]17.27 and 17.78 [somelinks]
16.5 15.0[existing]20.0[future]
20
TEU carrying capacity of bogie container wagons
2 2 2 3 1 2 2 2 3
It will be noted from this summary table that while China, India, Pakistan, the broad gauge portion of the Bangladesh railway system, the Islamic Republic of Iran and Turkey currently have axle load design limits which technically would support the operation of container wagons with acapacity to carry 3 twenty foot containers, only the Islamic Republic of Iran and Turkey have such wagons in their fleets. Issues related to the consistency and efficiency of rolling stock design arediscussed in greater detail in Chapter 7.
6.3 Speed
6.3.1 Standards and requirements
Commercial speed, or the speed derived by dividing the distance travelled between ultimateorigins and destinations by the total time taken to cover this distance, is one of the principal factorsinfluencing mode choice decisions. Commercial speed itself is influenced by numerous factors, the main ones being:
(i) Technical
Factors which may be classified under this heading include the design and standard of maintenance of the permanent way, signalling, motive power and rolling stock, all of which will have an influence on the maximum speeds which will be permitted on individual lines. Attainmentof target commercial speeds will depend in part on the percentage of the journey which may berun at or near maximum permissible speeds;
(ii) Operational
88
Factors of this type include delays to the passage of trains resulting from the need to satisfyoperational requirements, such as wagon loading/unloading, train marshalling

(assembly/disassembly), brake and other safety checks, wagon number taking, locomotivefuelling and servicing, bogie exchange or other forms of inter-gauge transfer of rolling stock;
(iii) Institutional
Delays to trains at national borders resulting from completion of customs and border securityformalities are examples of the effect of institutional influences on train commercial speeds.
In establishing technical standards for the TAR network, due regard should be given to the first ofthese factors - i.e. a desirable maximum speed for freight trains which will be compatible with the attainment of a commercial speed competitive with alternative transport modes.
In Chapter 8 of this report, it will be established that commercial speeds for international freight trains operating in this TAR corridor should be at least 20 km per hour in order to provide transittimes which are competitive with the principal alternative transport modes - in this case mainly shipping. Typically, commercial speeds in the corridor represent about 50 per cent of the averagerunning speeds, which in turn represent about 55-60 per cent of the maximum permissible speed.6
Therefore, to ensure attainment of a target commercial speed of 20 km/hour, a maximum permissiblespeed for freight trains of at least 70 km/hour should apply throughout the TAR network.
When combined with the requirement for a 20 tonne axle load, this would imply the need for arobust track design, with a ballast bed depth below the sleepers of at least 250 mm and with rails of at least 54 kgs/metre laid on prestressed monoblock concrete sleepers, secured by elastic fastenings. Additionally, the locomotives and freight rolling stock employed on the network must havethe capability to run up to the specified maximum speeds, and for sustained operation at or near these maximum speeds. It should be noted that the improved track design standards needed to lift maximum speeds will result in an improvement of overall track quality, thereby allowing the removalof sectional speed restrictions imposed for safety reasons on account of poor track condition. Removal of such speed restrictions will allow an increase in average running speeds and hence incommercial speeds.
6.3.2 Conformity of individual railway systems with TAR speed standards
Not all of the participating railway systems currently comply with the maximum permissible speedrequirement of 70 km/hour.
In China, the maximum allowable speed for container transportation by rail is quoted at 80km/hour. It is claimed that this will also be the maximum speed applying to the new line from Xiaguanto Ruili.7
In India, all nominated TAR links with the exception of In.4 (Raxaul-Sitarampur), In.5a(Mughalsarai-Lekhapani) and In.5b (Mahisasan-Jiribam) are already capable of delivering freight train commercial speeds of about 30 km/hour, suggesting that their maximum allowable speeds aregreater than 70 km/hour. Links In.1-In.3 are in fact trunk lines laid for the most part in heavy (at least50 kg/metre) rail and pre-stressed concrete sleepers. It is likely also that airbraked vehicles whichare not subject to the stringent speed restrictions normally imposed on vacuum braked vehicles
6 Essentially, the difference between commercial and average running speeds is that the former include an allowancefor stationary time for loading/unloading freight, for carrying out operational checks, transhipment at break-of-gauge stationsor train servicing and for completing border crossing formalities. Average running speeds include no allowance for stopping time unless trains stop in the middle of block sections due to mechanical failure.
7 China Country Paper, page 5.
89

would run on these lines. While Links In.4 and In.5a have recently been converted from metre to broad gauge and consequently now benefit from robust track standards, it is likely that they continue to carry a high proportion of vacuum braked stock, allowing them to deliver commercial speeds of less than 20 km/hour. Link In.5b remains metre gauge throughout and consequently delivers commercial speeds of only 12.5-21 km/hour.
In the Islamic Republic of Iran, the Country Report quotes a commercial speed of 30 km per hour for all existing sections of Link Ir.1 (from Mirjaveh to Razi), except the section Tehran to Qom for which the commercial speed is only 25 km/hour.8 Higher commercial speeds are anticipated for thenew lines to be constructed between Kerman and Zahedan and between Bafq and Fariman.
In Myanmar, the speeds of freight trains are heavily restricted on all existing TAR links as a consequence of poor track and bridge condition. For example, between Yangon and Mandalay onnominated TAR link My.1, the maximum speed of freight trains is restricted to 32 km per hour onsome sections and to 48 km per hour on others and the transit time for freight trains on the 620 kmlink is quoted at 36 hours, giving a commercial speed of only 17 km per hour.9 Between Yangon and Moktama (271 km), also on TAR link My.1, the maximum speed for freight trains has been quoted as 32 km per hour and the commercial speed, although not quoted, is likely to be of the order of only 14-17 km per hour. On the line section south of the Thanlwin (Salween) River between Mawlamyaingand Ye, the maximum speed for freight trains has been quoted as 24 km per hour, suggesting thatcommercial speeds on this section could be as low as 12-14 km per hour. Clearly, operation at suchlow speed levels would be inconsistent with the future provision of an efficient and competitive railcontainer service. The light and poorly maintained track and weak bridges on these lines explainsmuch of these operational restrictions. Even on the Yangon - Mandalay trunk line, the weight of rail used has been quoted as only 37 kg per metre and on the Mawlamyang-Ye section in the southern part of the network even lighter (30 kg per metre) rail is in use, while severely load and speed restricted through truss steel bridges abound on all parts of the network..
In Pakistan, freight train speeds are limited mainly by the design of rolling stock. For bogie stock, vacuum brakes and plain bearings are in predominant use and vehicles of this type are limited to only 55 km/hour. Re-equipment of bogie wagons with roller bearings and airbrakes will allow them to run in freight trains with a maximum load of 2,250 tonnes at 95 km/hour, but the conversion cost isestimated at US$ 9,000 per wagon.
In Sri Lanka, 50 km per hour is the maximum speed currently authorized for container carrying trains. Track rehabilitation, including replacement of 88 lb rails with heavier rails on the main lines, will be necessary in order to increase this speed to 80 km per hour.
In Thailand, the maximum speed for freight trains on all main lines is 70 km per hour, although on minor branch lines, such as Kanchanaburi - Nam Tok which would form part of TAR link Th.1, significantly lower speed limits are likely to apply. The track rehabilitation project now underway inThailand is expected to result in an increase in maximum freight train speeds from 70 to 80 km perhour.
8 Country Report for the Islamic Republic of Iran, September 1998. It should be noted however that elsewhere in this report a commercial speed of only 15.1 km per hour is indicated (7 days transit for 2540 km between Sarakhs and Bandar Abbas for Aexpress trains@ - see page 31), suggesting that the speeds of 25-30 km per hour do not allow sufficiently for stopping time.
9 ESCAP (1996), Trans-Asian Railway Route Requirements: Development of the Trans-Asian Railway in the Indo-China and ASEAN Subregion, Volume 3, page 52.
90

In Turkey, the maximum freight train speed on all nominated TAR links is reported as 65 km per hour. It should be noted that this limit is applied on a system which is laid predominantly in 46-49 kg per metre rail on timber sleepers and which can accept maximum axle loads of 20 tonnes. The corresponding commercial speeds vary from a low of 20.2 km per hour on Link Tk.1 (Kapicöy to Kapikule, with an overall length of 2,354 km and stopping time of 59.7 hours out of a total transit timeof 116.25 hours) to a high of 23.7 km per hour on Link Tk.4 (Toprakkale to Mersin).
In summary, maximum freight train speeds of less than 70 km per hour apply throughout amajority of existing links comprising the main transcontinental route TAR-S, implying that this route cannot yet offer a commercial speed, end to end, of at least 20 km per hour. A combination ofinadequate track and rolling stock standards and condition explains this sub-optimal performance.Considerable investment in track and rolling stock rehabilitation/ improvement is likely to be required in order to bring speeds up to required levels.
91
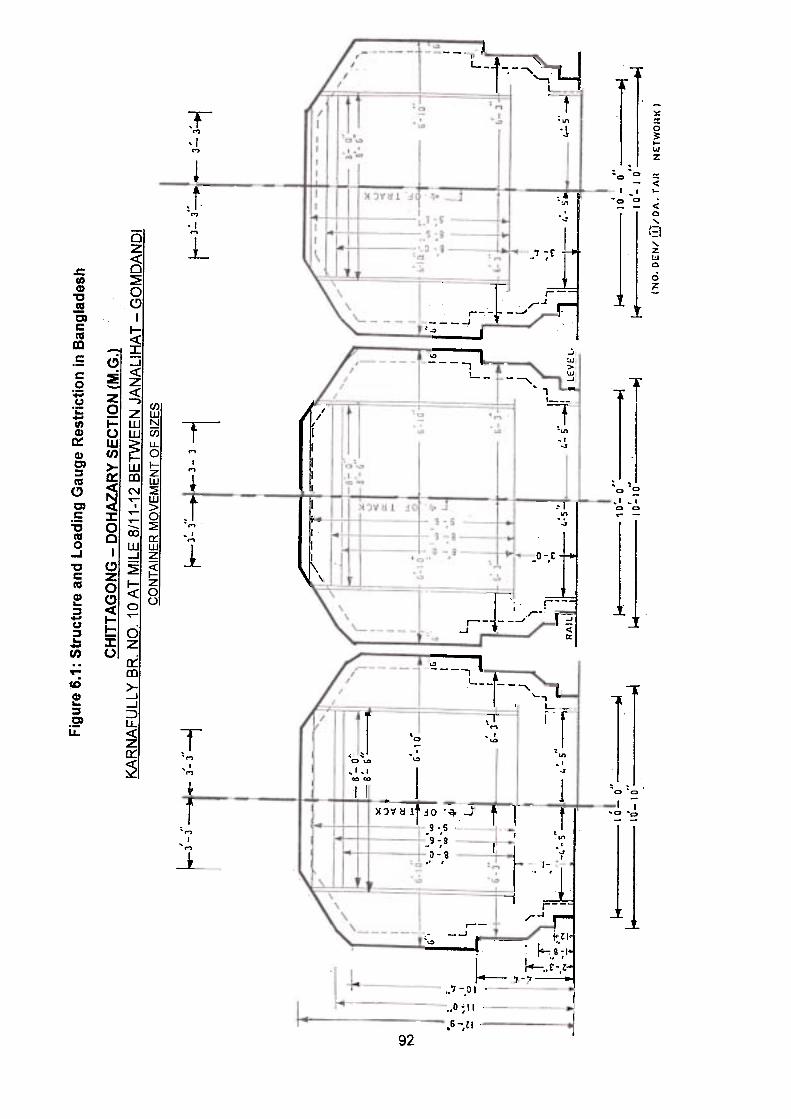


7. OPERATIONAL REQUIREMENTS
Since the attraction of container traffic to the TAR network depends in large measure onrail being able to deliver a cost effective and reliable service as compared with its competitors in the corridor, it is essential that any operational impediments to realization ofthese goals be removed.
In this context five factors are important:
(i) Compatibility in terms of the type and design of rolling stock employed by neighbouring railway systems in international traffic would ensure rolling stockinter-operability when no break-of-gauge is involved. Ideally, systems shouldcooperate in the design of exchangeable rolling stock to ensure that only themost efficient designs (i.e. those which maximize payload to tare ratios or minimize gross to net ratios, and are capable of running nearly at passenger speeds) are adopted;
(ii) Compatibility of train assembly and load scheduling practices between neighbouringrailway systems will be essential in order to avoid the necessity of having to re-adjust train loads at borders. The desirability of operating fixed formation unittrains across borders, where track gauge continuity permits, should berecognized and acted upon by the responsible systems;
(iii) The presence of adequate route capacity on existing links in the TAR corridor will beessential if the corridor is to meet its objective of providing a cost effective and competitive means for the international transportation of containers; and
(iv) Breaks-of-gauge while not posing a problem currently, are likely to become aproblem in the future when lines of differing track gauge are connected within the territory of one country, Bangladesh, and at two borders, China/Myanmar andIslamic Republic of Iran/Pakistan. Possible re-gauging of the existing metregauge network in northeastern India would create two additional breaks-of-gauge at borders - between India and Myanmar and between Bangladesh and India(northeast). Provision of modern, high speed container transhipment equipment at all break-of-gauge points will be essential to minimize delays.
The success of rail in being able to capture additional container traffic for the TARnetwork will depend heavily on there being adequate capacity for handling containers at rail served terminals in the hinterland and at the major sea ports.
7.1 Compatible and efficient rolling stock design
Table 7.1 indicates that the container rolling stock employed by the railway systemswithin the corridor varies widely in terms of its design characteristics and efficiency. The table does not present details for rolling stock operated by the Myanma Railways or by therailways of the Central Asian Republics, although it is recognized, particularly in the case ofthe latter, that the rolling stock of these countries also present problems of compatibility.
100

Table 7.1: Comparison of container wagons in service within TAR Southern Corridor
CountryContainerwagoncharacteristic Bangladesh1 China India2 Islamic
Republicof Iran
Pakistan SriLanka
Thailand Turkey
Width betweenwheels (mm)
1000 1435 1676 1435 1676 1676 1000 1435
Length over headstocks(mm)
12464e 13427 13716e 20000e 13716 15392e 14200 20000e
Height (mm) 900 1149 1009 1240 1105 1219 1010 1240
No. of TEU 2 2 2 3 2.25* 2.25* 2.25* 3
Braking system Vacuum Air Vacuum/Air Air MostlyVacuum
Vacuum Air/Vac Air
Gross weight(tonnes)
53.75 81.28 80.0 65.0 60 60 80.0
Net weight(tonnes)
40.75 62.78 55.0 43.5 40 43.5 55.0
Gross/NetRatio
1.32 1.29 1.45 1.49 1.50 1.38 1.45
Design speed (km/hr)
75 75/10075 (vac. break)100 (air break)
100 100
1 The Bangladesh Railways currently owns no broad gauge container wagons. Consequently the data given inthis table relate to the latest metre gauge wagons in service on the Dhaka-Chittagong rail container feederservice.
2 The data presented in this column relate to the new skeletal container flat wagons being introduced on theIndian Railways system. These wagons are substantially more efficient than the shorter but heavier wagons theyreplace, with a gross/net ratio of 1.29 as compared with 1.34 for the older wagons.
e = estimate, where no data have been supplied by railway systems.* indicates an assumption, in the absence of any information supplied, that the wagon will be fitted withtwistlocks allowing it to carry 45 ft containers.
Rolling stock compatibility is not essential where discontinuities of track gauge exist,simply because in such situations there will be no requirement to exchange rolling stock, but rather to exchange the loading conveyed on that rolling stock. However, imbalances between the container loading capacity of wagons either side of the break-of-gauge pointcan result in one system having to employ more wagons to transport a given quantity of containers than the other.
101

Where gauge continuity permits the exchange of wagons between neighbouringsystems, rolling stock compatibility becomes a critical issue. Table 7.1 shows that, whilethere is rolling stock compatibility between the two contiguous standard gauge (1435 mm) systems in the corridor - the Islamic Republic of Iran and Turkey - the same is not true forthe neighbouring broad gauge systems of India and Pakistan. Neither would it be true for the neighbouring broad gauge systems of India and Bangladesh if the latter were to operate broad gauge container wagons, since the majority of Bangladesh Railway rolling stock isequipped with vacuum brakes, as compared with Indian rolling stock, a growing proportion ofwhich is now airbraked. In fact, the major source of incompatibility between the rolling stockof neighbouring systems is often the type of braking system employed. Vacuum brakes arenot nearly as efficient as air brakes and impose quite stringent speed restrictions on rollingstock (see, for example, restrictions applying to vacuum braked stock in Pakistan in Section6.3.2 of Chapter 6).
Other sources of critical difference between the rolling stock of neighbouring systems arethe coupling systems in use and the height of wagon floors above the rail. Although only incomplete details are available, it is understood that a variety of wagon coupling systemsare in use throughout the countries of the corridor - varying from old fashioned hook type couplings to modern automatic or knuckle couplings. As was observed in Chapter 6, higher profile wagons often infringe structure gauges when loaded with high or super high cubecontainers. The fact that the container wagons employed in the Islamic Republic of Iran andin Turkey are high (more than 1200 mm above the rails) explains why containers with aheight greater than 8 ft 6 in cannot be accommodated throughout most of their networks.
In terms of container carrying capacity, rolling stock differences between neighbouring railway systems sharing the same track gauge can also create problems, in the sense thatuse of wagons with limited container loading capacity will require longer and heavier trains tobe run on through schedules than might be the case if wagons of higher container loadingcapacity are used. This can sometimes lead to operational difficulties when train lengths exceed the available length of crossing tracks on single line sections or of terminal arrivaltracks, or when train gross trailing loads exceed the hauling capability of single locomotives,necessitating Alocomotive banking@ or a doubling up of motive power assigned to trains.
There is a consistency of wagon container carrying capacity and loading efficiencybetween the Islamic Republic of Iran and Turkey. Between India and Pakistan, while wagoncontainer carrying capacity is consistent, the loading efficiency of wagons used in Pakistan is less than that of Indian wagons.
The benefits of a 3 TEU carrying wagon do not appear to have been recognized in thecountries of South Asia with a common 1,676 mm track gauge or in China, with a 1,435 mm gauge, although these benefits have long been long recognized in the Islamic Republic ofIran and in Turkey which share a 1,435 mm gauge.
A 3 TEU wagon of approximately 65 ft length offers considerably more operationalflexibility than does a 45 foot container wagon, for example. This is because it can carry: three 20 ft containers; or a single 45 ft, 48 ft or 53 ft container;or a single 40 ft and a single20 ft container. A 45ft wagon, on the other hand, has capacity to carry only: a single 45 ft or40 ft container; or two 20 ft containers. The disadvantage associated with the 3 TEU wagon is that it will impose an axle load of nearly 25 tonnes if it is to carry three 20 ft containers at afull gross weight each of 24 tonnes, but this is scarcely a disadvantage when it is recognizedthat only very rarely do 20 ft containers (even when loaded with dense commodities) exceedan overall mass of 18 tonnes (i.e. 2.5 tonne tare plus 15.5 tonne load).
Additionally, since fewer 3 TEU wagons will be required to convey a given quantity of containers, the railway will also realize savings from the reduced length and mass of trains
102

made up with such wagons rather than with 2 TEU wagons. For example, a train comprising20 three TEU wagons will be needed to carry 60 Twenty Foot containers, giving a overall train length of about 419 metres and a overall gross load of about 1,700 tonnes. By contrast,if 2 TEU wagons are used, ten more wagons will be needed to carry the same number of containers, giving an overall train length of about 430 metres and an overall gross load ofabout 1,825 tonnes. In fact the tonnage difference in this comparison will be increased if it is necessary to add one more locomotive to the train in the second case (overall train lengthwill increase to 449 metres and gross load to about 1,925 tonnes).
7.2 Compatibility of train assembly and load scheduling practices
The efficiency of international train operations in the corridor will in large part depend upon there being reasonable consistency in the operating practices of neighbouring railway systems. For example, in situations where there is continuity of track gauge but no consistency in the length of trains operated either side of the border, transit delay and cost penalties will result from the necessity to re-marshall or adjust loading at the border. The twomain influences on train lengths are the hauling capacities of locomotives and the availablelength of crossing/passing, station and terminal sidings. While it may not be possible toachieve compatibility in the former, due mainly to topographical differences between the neighbouring route networks, it should be possible to achieve some degree of compatibilitywith the latter.
The problems associated with differing train lengths can be overcome by specifyingstandard train configurations based on unit or block train operation of international containerservices. Unit trains are trains comprising a fixed number of wagons of a single type,operating between a single origin and destination, with intermediate stops only for traincrossing purposes or for operational reasons such as crew or locomotive exchange. Block trains are similar, except that they may comprise more than one type of wagon, but nevertheless operate to fixed formation, single origin/destination principles. In containerhaulage service, both types of trains should comprise wagons which may be run at or near passenger train speeds to avoid being held in crossing sidings for faster opposing orpassing passenger trains. The main advantages of such trains are that by avoiding marshalling yards and intermediate stops for loading/ unloading both transit times andoperating costs can be very low.
At least four of the railway systems within the corridor (Bangladesh, India, Pakistan andThailand) currently operate unit or block container trains between hinterlandorigins/destinations and the seaports, but none has so far had experience in the operation of such trains across its borders1. The configurations of these trains also varies widely, from the45 bogie wagon (90 TEU) trains now being introduced on broad gauge trunk routes in India to 30 bogie wagon (60 TEU) trains in Pakistan and Thailand and the 25 bogie wagon (50TEU) trains operating on the metre gauge between Dhaka and Chittagong in Bangladesh.
The main principle guiding decisions about train lengths is that wagons should be addedup until the point at which either the maximum length for crossing/passing purposes, or the maximum trailing tonnage for single locomotives (of types in predominant use), is reached.The reasoning behind this principle is that long run marginal costs (i.e. operating costs plus
1 At the time of writing, however, the railways of Thailand and Malaysia are working on implementing aweekly container service between Port Klang (Malaysia) and Bangkok.
103

wagon and locomotive amortization) will decline with increasing train size up until the point atwhich another locomotive must be added.
The experience of Thailand in scheduling loads for its Laem Chabang - Lard Krabangcontainer feeder service is instructive. Initially services were operated with 2,400 HP diesel electric locomotives having a hauling capacity for the route of 1200 tonnes and the maximumtrain length for crossing purposes is about 700 metres (as determined by the length of theshortest crossing loop between Laem Chabang and Lard Krabang). The equivalent number of container wagons (each with a gross weight of 40.5 tonnes and a length of 14.4 metres) meeting these criteria was 30. When the State Railway of Thailand acquired locomotiveswith a power rating of 2900 HP, the hauling capacity increased to 1800 tonnes, theequivalent of 44 bogie wagons, but the resulting train length at about 650 metres was still within the maximum length for crossing purposes.
Other operational factors which could impair the efficiency of cross border services arediffering procedures for the inspection and servicing of locomotives and rolling stock, as well as differing standards of train crew proficiency and training. To a large extent thesedeficiencies can be eliminated through the application of effective joint working agreements between adjoining railway systems, such as the agreement in force between Thailand and Malaysia since 1954. These agreements should embody standardized inspection, servicingand staff training/qualification procedures for application by the neighbouring railway systems.
7.3 Adequacy of route capacity
Inadequate route capacity on existing links could pose a significant operational barrier if the TAR network is to generate significant volumes of international container traffic. Route capacity is here defined as the maximum number of trains which can pass through the capacity limiting section of a given line within any 24 hour period. For single line sections this is established from the time taken by the slowest train through the longest section betweencrossing loops, while for multiple line sections it is established from the time taken by the speed of the slowest train through the longest signalling block, supplemented by theminimum signalling headway (time interval) between trains.
A survey of the situation within each participating country, however, suggests thatserious route capacity problems on nominated TAR links are pervasive only in the case of Turkey. For the other countries, in the relatively few cases where route capacity shortages do exist, they can be overcome by alternative routing of trains or by minor investment in theremoval of bottlenecks.
7.3.1 Bangladesh
Only three sections on the nominated TAR links in Bangladesh even come close to capacity saturation. They are: the 115 km section on Link Bn.3 between Santahar andParbatipur where the daily number of trains represents 80 per cent of the measured capacity of the line; the 65 km section on Link Bn.1 from Tongi to Bhairab Bazar where about 82 percent of capacity is used; and the 80 km (approximate) section on Link Bn.2, betweenAkhaura and Laksam, where the daily number of trains stands at 81 per cent of measuredcapacity.
Poor track and rolling stock condition explains much of the capacity limitation on thesesections, but it is possible that the development plans already committed for these sections will help to overcome these problems. The first mentioned section, Santahar to Parbatipur, is in the process of being upgraded as part of the programme to convert the line from Jamtoil
104

to Parbatipur to dual gauge. The latter two sections form part of the Dhaka to Chittagong main line which has been proposed for duplication and conversion to broad gauge followingcompletion of the dual gauge Jamtoil to Joydebpur section under construction as part of the Jamuna River Bridge rail link. This work also will involve substantial track upgrading betweenDhaka and Chittagong which should result in significant speed increases and an overall expansion of route capacity.
7.3.2 India
Three of the identified TAR links on Indian Railways, i.e. In.1, In.2 and In.3 have very high capacity utilization. However, unlike most other participating railway systems, the Indian Railways has the option of diverting traffic to alternative, nearly parallel routes when capacity problems arise on TAR links. Indian Railways top level management are confident that anysignificant route capacity shortages can be resolved in this way, and further that projectedincreases in the number of container trains operated on the nominated TAR links can be accommodated without substantial investments in capacity relieving measures.2
For the remainder of the links nominated by India, route capacity shortages are encountered on only one, In.4 (Raxaul-Sitarampur), which is important for the transportationof export and import traffic between Nepal and the ports of Calcutta and Haldia. On this link,however, only two sections are becoming critically short of capacity - a 22 km sectionbetween Kiul and Rampur Dumra and a 13 km section between Hathidha and Barauni wherethe line crosses the Ganges River.3 In these sections, the daily number of trains respectively represents 93 per cent and 84 per cent of measured route capacity. There arelikely to be limited opportunities for the Indian Railways to divert traffic around these sections, especially the bottleneck section over the Ganges River, so that capacity relievingmeasures may well have to be contemplated for these sections in the light of projectedtransit traffic to and from Nepal.
7.3.3 Islamic Republic of Iran
Insufficient data were made available on the capacity and capacity utilization of TAR links nominated for the Islamic Republic of Iran. However, it is known that investment funds are currently being committed to track duplication of the trunk lines between Tehran and Fariman and between Tehran and Qom, forming TAR link Ir.4 and part of TAR link Ir.1respectively, suggesting that route capacity on these links may have been inadequate, interms of coping either with the current or the projected traffic task (daily number of trains).
7.3.4 Myanmar
The route capacities of all existing main lines in Myanmar are severely restricted as a consequence of the speed penalties imposed by poor track and bridge condition. However,with the exception only of one line (Yangon-Mandalay), current train density is not at a levelwhich could cause capacity shortages in the near future. As observed in Section 6.3.2 ofChapter 6, the maximum freight train speed on the Yangon-Mandalay main line forming part of TAR link My.1 ranges between 32 and 48 km and on the Yangon-Moktama andMaylamyaing-Ye lines, also forming part of TAR link My.1, it is 32 and 24 km per hour respectively. The corresponding estimates of route capacity in maximum daily number of trains, both freight and passenger, existing train density in actual daily number of trains, both
2 Discussion with the Chairman of the Railway Board on 20 April 1998, during the ESCAP mission to India.
3 Country Report for India, Annexure Table 4.1.
105

freight and passenger, and capacity utilization in per cent are as follows: Yangon-Mandalay 36 and 26 trains, i.e. 72 per cent of capacity; Yangon-Moktama 24 and 10 trains, i.e. 42 per cent of capacity; and Mawlamyaing-Ye 26 and 4 trains, i.e. 15 per cent of capacity.4 Only the Yangon-Mandalay line comes close to capacity saturation and even then this would notoccur within the time frame of this analysis unless traffic were to increase by a minimum oftwo per cent per annum, in which case train density would reach capacity by 2015. Aprogramme to strengthen track and bridges as well as to re-gauge structures as recommended in the 1996 study by ESCAP of the Development of the Trans-Asian Railway in the Indo-china and ASEAN sub-region would also have the effect of increasing speed limits and hence of increasing route capacity throughout the network.
7.3.5 Pakistan
Potentially the most serious shortage of route capacity occurs on TAR link Pk.1, withinthe 245 km electrified single track section between Raiwind and Khanewal, where currently 19 trains per day run against an estimated maximum daily number of 20. This section iscritical in the sense that it forms part of both the main TAR-S1 east-west trunk route and the main feeder route for container traffic from and to the ports of Karachi and Qasim. The factorcontributing most to the restriction of capacity within this section is the 55 km per hour speed limitation on freight trains comprising vacuum-braked, plain bearing-equipped wagons.Removal of this restriction will cost an estimated US$ 9,000 per wagon but will allow anestimated additional 8 trains per day to run in the section.5
Other nominated TAR links facing capacity shortages are Links Pk.3 (Rohri-Karachi) andPk.4 (Lahore-Peshawar), where the daily number of trains currently absorbs 79 and 94 per cent of measured route capacity, respectively. Conversion of rolling stock to air brakes androller bearings would also increase route capacity on these links, as would the reopening ofclosed crossing stations on the latter link where long block sections currently imposeexcessive block occupation times. In fact, station closures recently enforced as an economymeasure in the prelude to restructuring and privatization of the Pakistan Railways may well worsen the financial performance of the railway if, as is suggested in the case of TAR link Pk.4, they restrict capacity to operate potentially profitable trains.
7.3.6 Sri Lanka
While no specific details were provided, it is understood that route capacity shortages do not present a problem on the Sri Lanka network, with the possible exception of those sections of Links Sl.1 and Sl.2 which are heavily utilized for Commuter traffic within suburban Colombo and the 60 km section of Sl.1 between the junction stations ofPolgahawela (line to Kandy) and Maho (line to Trincomalee and Batticaloa) on Link Sl.2.6
The Commuter network extends from Panadura (28 km south of Colombo) to Polgahawela(72 km north of Colombo) and, although it is multiple tracked, nevertheless provides an intensive service during the morning and evening peak hours, with little to no possibility of being utilized for freight service during the daylight hours.
4 ESCAP (1996), Trans-Asian Railway Route Requirements: Development of the Trans-Asian Railway inIndo-China and ASEAN Subregion, Volume 3, Annex 2, page 5.
5 Country Report for Pakistan, pages 38-40.
6 Country Report for Sri Lanka, page 4.
106
Beyond the multiple-tracked suburban network, route capacity is limited by the runningtimes through single track block sections. These times have been quoted as 20-30 minutesand would restrict capacity to only 34-50 trains per day.
7.3.7 Thailand
Access to the TAR Southern Corridor from Thailand would be provided by the existing210 km line from Bangkok to Nam Tok. The first 80 km of this line, between Bangkok andNong Pladuk Junction, also forms part of the southern trunk line linking Thailand with Malaysia. All but about 8 km of this line is of single track configuration and as it is intensivelyused both by commuter and long distance trains, it is rapidly approaching capacity saturation. Beyond Nong Pladuk Junction, the line is relatively underutilized, carrying amaximum of only 8 trains per day. The ESCAP study of TAR network development in theIndo-China and ASEAN Subregion (1996) indicated that the Bangkok-Nong Pladuk section carried 56 trains per day against a measured capacity of 72, suggesting capacity utilizationof about 78 per cent.7 If train numbers were to grow at a rate averaging two per cent perannum, this section would be short of capacity by 2011.
The urgency of capacity expansion measures for the southern trunk line has beenrecognized by the Government of Thailand which has approved in principle a track doublingprogramme covering a heavily trafficked 28 km section of this line from Talingchan Junctionto Nakhon Pathom. This programme, coupled with the likely rehabilitation of an 18 kmsection from Bang Sue Junction to Talingchan Junction under the State Railway ofThailand=s track rehabilitation programme, should resolve capacity problems betweenBangkok and Nong Pladuk Junction well into the future.
7.3.8 Turkey
Of the five principal TAR links nominated for Turkey, only Tk.2 (Kars-Cetinkaya) appears to have sufficient route capacity to accomodate any significant growth in internationalcontainer traffic, yet it is unlikely that even this section will have sufficient capacity if thefreight traffic projections for the new Kars-Tbilisi line (eight million tonnes per annum) are realized.
On Link Tk.1, forming part of the intercontinental route TAR-S1, only sections east ofMalatya and west of Ankara up to Haydarpasa appear to have adequate route capacity.These sections appear to have a route capacity utilization of less than 70 per cent. Capacityshortages between Malatya and Ankara, where the line passes through difficult mountainousterrain, are particularly serious with existing traffic exceeding capacity on at least two sections - 311 km between Kayseri and Irmak and 80 km between Cetinkaya and Bostankaya. The operation of commuter services on Link Tk.1 to the east of Ankara and tothe west of Sirkeci (Istanbul) place additional pressures on the capacities of these sections,albeit that they are track duplicated sections. The capacity of Link Tk.1 is further restricted by the bottlenecks at Lake Van and the Bhosphorus Strait, both of which require ferry crossings, taking five hours and 45 minutes respectively, as well as additional trainmarshalling activity, amounting to two hours on each side of each crossing.
Traffic on Links Tk.3 (Malatya-Iskenderun) and Tk.4 (Toprakkale-Mersin) has already reached capacity saturation with daily train numbers on both links representing about 93 per cent of route capacity.
7 ESCAP (1996), Trans-Asian Railway Route Requirements: Development of the Trans-Asian Railway inIndo-China and ASEAN Subregion, Volume 2, Annex 2, page 2.
107

On Link Tk.5 (Cetinkaya-Samsun), not one section has a capacity utilization of less than92 per cent. The tortuous alignment of this link through rugged terrain and resulting low speeds appears to be the main factor contributing to this situation.
7.4 Overcoming break-of-gauge problems
Currently freight traffic is transferred between differing track gauges at only four locations on the TAR network - at Sarakhs on TAR Link Ir.3, between the 1520 mm gauge of the Central Asian railways and the 1435 mm gauge of the Iranian Islamic Republic railways; at Parbatipur and Santahar on TAR Link Bn.3 in Bangladesh, between the 1,000 mm and1,676 mm gauges; and at New Bongalgaon on Link In.5a in northeastern India, again between the 1,000 mm and 1,676 mm gauges. It is likely that since the recent broad gaugingof the remainder of Link In.5a up to Lekhapani, the transfer point has been relocated furthereast from New Bongalgaon, perhaps to Lumding, where the connection is now made with the northeastern metre gauge system.
In the case of the Sarakhs border station, transfer is effected by means of bogieexchange, while at the other three locations it is effected by manual labour. For the break-of-gauge stations where manual transfer methods are employed, overall wagon detention timestypically average between 24 and 36 hours.8 Although no specific data were provided in respect of the Sarakhs bogie exchange, an information booklet issued by the Iranian Islamic Republic Railways (IIRR) indicates that Aabout 200 bogies can be changed in 24 hours based on two working [email protected] If this is interpreted as 100 wagons processed in 24 hours,then to exchange the typical container block train of 23 wagons would take about 5.5 hours. On the assumption that bogie exchange can be done concurrently with border formalities,then the typical border dwell time for a container train might be of the order of eight hours,including an allowance for operational activities such as coupler, brake and wheel testing.
When through TAR routes become a reality, it is likely that up to five breaks-of-gauge will be encountered on the main intercontinental route TAR-S1 between Kunming and Kapikule.Clearly with existing transfer techniques requiring up to 24 hours to transfer one train, theloss of five days due to transfer of freight and/or vehicles between gauges could erode any competitive advantage which rail might otherwise have had for freight movement within the corridor, emphasizing the need for adoption of fast and cost-effective transfer methods. It is by no means certain that bogie exchange provides the speediest and most cost effectivealternative for transfer of container traffic.
The 1996 ESCAP study of railway break-of-gauge problems and solutions suggests amodern container transhipment terminal equipped with two reachstackers would have the capability of transferring two trainloads of containers, representing 80 wagons and 160containers, in two shifts each of eight hours (equivalent to five wagons per hour). This wouldbe slightly faster than the Sarakhs bogie exchange, but the capital cost of such a terminal atabout US$ four million would be only two thirds the cost of an automated bogie exchange,while its operating cost is likely to be significantly less than half that of a bogie exchange.One major difficulty associated with a bogie exchange is the logistical problem andassociated cost of maintaining an adequate inventory of bogies especially when there is alarge imbalance in the directional flows of wagons. Another difficulty which is likely to
8 ESCAP (1996), The Railway Break-of-Gauge Problem and Possible Solutions in the ESCAP Region.
9 IIRR (1996), Golden Route.
108
preclude bogie exchange as the preferred method at a majority of the break-of-gauge points along route TAR-S1 is that it is still not technically possible to exchange wagons between the metre and standard or broad gauges. Wagons designed for operation on disparate gauges such as these are structurally quite different from one another and therefore incompatible for bogie exchange purposes.
7.5 Adequacy of container handling capacity in ports and hinterland
The container transport capability of the TAR network depends crucially on linkages withcontainer handling and distribution systems in ports and in the hinterland areas served bythese ports. These handling and distribution systems must be sufficiently comprehensive in terms of their coverage of container trade generating industries and locations and sufficientlywell equipped to allow rapid loading and discharge of container carrying rail vehicles.
Railway involvement in container transportation throughout the TAR Southern Corridor is still in its infancy. While a majority of the railway systems within the corridor are now involved in such transportation, their services are oriented to the feeder transportation of containers toand from the ports. To support this traffic, some systems have established inland containerhandling facilities which could equally serve container cross border traffic. In seeking to reorient their container haulage services from port to direct international transportation, therailway systems of the region will need to ensure that the container handling and distributionfacilities either in place or planned will be adequate in terms of their location, capacity and equipment in order to support the cross border transportation task. The status of thesefacilities in each of the participating countries with an involvement in rail transportation ofcontainers is addressed below.
7.5.1 Bangladesh
(i) Port capacity
The great majority of containers arriving in or leaving Bangladesh do so via the Port of Chittagong, although a second major port at Mongla in the west of Bangladesh also handlescontainers and is better located than Chittagong to transfer container trade to/from Nepal. Chittagong retains its importance as a potential gateway for container trade to/from the seven northeastern states of India, in addition to its present role of handling the majority of container trade from/to origins and destinations in Bangladesh. However, it is limited in theseroles by poor equipment availability and poor manpower productivity, as well as bycommercial, operational and administrative practices which favour inefficient handling andtransportation of containers.
Despite these limitations, the growth in container throughput at Chittagong Port in recentyears has been robust, as is shown in Table 7.2.
However, the future container growth potential at Chittagong Port is seriously restricted by a combination of factors, of which the main ones are:
109
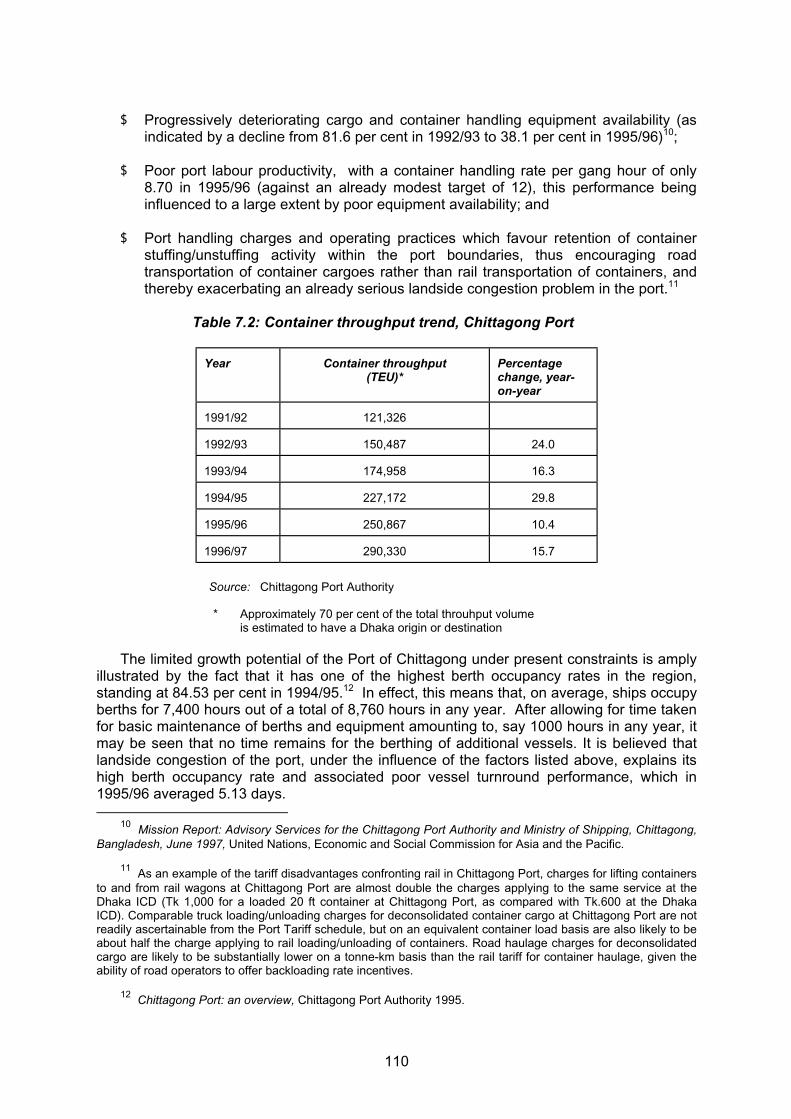
$ Progressively deteriorating cargo and container handling equipment availability (asindicated by a decline from 81.6 per cent in 1992/93 to 38.1 per cent in 1995/96)10;
$ Poor port labour productivity, with a container handling rate per gang hour of only 8.70 in 1995/96 (against an already modest target of 12), this performance beinginfluenced to a large extent by poor equipment availability; and
$ Port handling charges and operating practices which favour retention of container stuffing/unstuffing activity within the port boundaries, thus encouraging roadtransportation of container cargoes rather than rail transportation of containers, andthereby exacerbating an already serious landside congestion problem in the port.11
Table 7.2: Container throughput trend, Chittagong Port
Year Container throughput(TEU)*
Percentagechange, year-on-year
1991/92 121,326
1992/93 150,487 24.0
1993/94 174,958 16.3
1994/95 227,172 29.8
1995/96 250,867 10.4
1996/97 290,330 15.7
Source: Chittagong Port Authority
* Approximately 70 per cent of the total throuhput volumeis estimated to have a Dhaka origin or destination
The limited growth potential of the Port of Chittagong under present constraints is amplyillustrated by the fact that it has one of the highest berth occupancy rates in the region,standing at 84.53 per cent in 1994/95.12 In effect, this means that, on average, ships occupyberths for 7,400 hours out of a total of 8,760 hours in any year. After allowing for time takenfor basic maintenance of berths and equipment amounting to, say 1000 hours in any year, itmay be seen that no time remains for the berthing of additional vessels. It is believed that landside congestion of the port, under the influence of the factors listed above, explains itshigh berth occupancy rate and associated poor vessel turnround performance, which in 1995/96 averaged 5.13 days.
10 Mission Report: Advisory Services for the Chittagong Port Authority and Ministry of Shipping, Chittagong,Bangladesh, June 1997, United Nations, Economic and Social Commission for Asia and the Pacific.
11 As an example of the tariff disadvantages confronting rail in Chittagong Port, charges for lifting containersto and from rail wagons at Chittagong Port are almost double the charges applying to the same service at theDhaka ICD (Tk 1,000 for a loaded 20 ft container at Chittagong Port, as compared with Tk.600 at the DhakaICD). Comparable truck loading/unloading charges for deconsolidated container cargo at Chittagong Port are not readily ascertainable from the Port Tariff schedule, but on an equivalent container load basis are also likely to beabout half the charge applying to rail loading/unloading of containers. Road haulage charges for deconsolidatedcargo are likely to be substantially lower on a tonne-km basis than the rail tariff for container haulage, given theability of road operators to offer backloading rate incentives.
12 Chittagong Port: an overview, Chittagong Port Authority 1995.
110

Various solutions to the Chittagong Port capacity problem are being investigated,including the construction of a new, privately owned and operated container terminal with acapacity to handle up to 220,000 TEU per year and the contracting out of handling servicesat the existing terminal to the private sector. The Bangladesh Government has yet to give its approval to any of these possible solutions.
Chittagong Port is connected to the hinterland by road, rail and inland waterways. Theshares of these modes in the movement of dry cargo from the port in 1994/95 were quoted in a recent ESCAP document as 72 per cent, 10 per cent and 18 per cent respectively13.
Containers are moved by rail between Chittagong Port and an ICD in Dhaka in dedicateddaily trains, but as observed in Chapter 5, rail has only a 14 per cent share of the total container trade moving to and from Dhaka. In common with a majority of ports throughoutthe region, the rail loading and unloading tracks at Chittagong are located well away from the container berths and their associated stacking areas, necessitating long transfer moves withtruck hauled chassis or other port handling equipment.
(ii) Inland container handling capacity
An Inland Container Depot (ICD) was established at Dhaka in April 1987 under the jointownership of the Bangladesh Railway and the Chittagong Port Authority, but with all container handling operations under the control of the Chittagong Port Authority. Initially, all rail movement of containers to and from the ICD was achieved by means of regular mixed freight trains, but since August 1991 dedicated container block trains have operated betweenDhaka and Chittagong, rarely at a frequency greater than one per day in each direction.
The Dhaka ICD has a storage capacity for only 1,000 TEU at any one time. Its annualthroughput capacity has been quoted at only 25,000 TEU per year (which would be equivalent to only 25 stock turns or an average dwell time per container of 14.6 days), but clearly as indicated in Chapter 5 it has already surpassed this volume, suggesting thatimproved container turnarounds are possible. At the present throughput volume (about29,000 TEU per year), the average container dwell time is 12.6 days, still excessive by present day international standards. It should be noted that if container dwell time could be reduced to seven days, the ICD would have a capability of handling about 52,000 TEU per year, which is more than one and three quarters times its current throughput.
The present items of handling equipment at the ICD (one heavy duty forklift/toplifter, two medium lift forklifts and one empty handling forklift) are not stretched at the present throughput level, but one impediment to improved operational efficiency at the ICD lies in itsproximity to the main Dhaka passenger station and the need to shunt rakes of container wagons across tracks used for suburban rail service. In common with a majority of the rail served container terminals in the region, the Dhaka ICD was not designed to receive anddespatch full length container carrying trains. Present plans call for the construction of a newterminal at a location which will not be exposed to conflicts with suburban traffic.
The only other inland customs clearing facility in operation in Bangladesh with potential to handle containers is a road served dry port located at Benapole, located on thesouthwestern border with India, some 35 km southwest of the City of Jessore and about 130km from Mongla Port. This facility was acquired by the Mongla Port Authority in 1984 and has been developed to facilitate import-export trade with India, none of which is at present
13 Advisory Services for the Chittagong Port Authority and Ministry of Shipping, ESCAP, June 1997.
111

containerized. In future, it might also have a significant role processing third country transit trade with Nepal, but would need to be equipped with specialized container lifting equipmentfor this purpose. The fact that Mongla Port is not as yet rail connected might also limit the container handling potential of the Benapole dry port.
No other rail served ICD facilities have reached the advanced planning stages in Bangladesh, but an ICD to be served by inland waterway transport (IWT) is planned for construction at Narayanganj, about 20 km southeast of Dhaka. The Japanese OverseasEconomic Cooperation Fund which will be providing soft loans for this project has already completed a feasibility study and commencement of construction work is imminent.
The establishment of an additional inland container handling facility in the northeasternpart of Bangladesh or over the border in India may well be justified if Chittagong is in futureto have a trade distribution role for the seven northeastern states of India. Currently, the only ICD located in the northeastern states of India is at Amingaon near Guwahati (see sub-section 2.5.2 b).
7.5.2 India
(i) Port capacity
The TAR links nominated for India serve the following container handling ports: Calcutta,Haldia, Chennai (Madras), Tuticorin, Mumbai (Bombay) and Jawaharlal Nehru Port.
The container throughput trends for these ports are given in Table 7.3.
Table 7.3: Container throughputs, TAR-connected ports in India
Port
Calcutta Haldia Chennai Tuticorin Mumbai J.N.Port Total, 6ports
Total,major ports
Year
TEU(=000)
TEU(=000)
TEU (=000)
TEU(=000)
TEU(=000)
TEU (=000)
TEU (=000)
TEU(=000)
1991/92 58 9 106 28 280 112 593 683
1992/93 74 7 127 35 315 145 703 799
1993/94 96 6 162 48 428 177 917 1,052
1994/95 112 6 200 57 487 244 1,106 1,257
1995/96 121 4 227 69 518 339 1,278 1,449
1996/97 133 9 256 89 583 423 1,493 1,698
1997/98 141 29 293 102 601 504 1,670 1,892
1998/99 132 28 283 100 509 663 1,715 1,924
Av. annual rateof growth (%)
12.4 17.6 159.1 19.9 8.9 28.9 16.4 15.95
Source: Indian Ports Association, per Country Report for India.
Collectively, these ports handle more than 85 per cent of the total port containerthroughput of India. As may be observed from Table 7.3, the growth in their containerthroughtput over the past five years has been spectacular, albeit that they were starting from a low base. In particular, Jahawarlal Nehru Port (in the Mumbai area) and Tuticorin Port (the
112

transfer port for container movement to/from Sri Lanka) have consistently experiencedcontainer traffic growth of greater than 25 per cent per annum over the past 5 years.
In 1995/96, the proportion of ICD contributed volume in the overall port containerthroughput ranged from lows of 0 and 0.3 per cent in Tuticorin and Calcutta respectively, to a high of 76.3 per cent in Haldia Port.14 It is understood that the Indian Railways areconcentrating their container movement on Haldia rather than Calcutta, given the severe berth and landside congestion, as well as the difficult rail access, of the latter port. Haldia, atthe estuary of the Hooghly River, is located about 105 km downstream of Calcutta and consequently can receive larger vessels than can the latter port. Rail access to Haldia is easy as compared with Calcutta where trains must pass through densely populated urbanareas in order to reach the port. The fact that the ICD network contributes less than one percent of Calcutta=s total container volume perhaps suggests that an excessive proportion ofthis volume is stuffed and unstuffed within the port boundaries, thereby adding to thecongestion of the port. Another contributing factor is the current necessity to examine all Nepal-bound cargo at the Port of Calcutta. This will undergo a major change once theBirganj ICD is opened in Nepal, thus facilitating the through movement of containers fromBirganj to Calcutta without having to detain the containers at Calcutta Port for customs inspection and cargo handling operations.
To a lesser extent, Chennai and Mumbai ports, with only 10 per cent and 14 per cent respectively of their total container volume being stuffed or unstuffed in ICD=s, also facesevere congestion problems. However, capacity-related congestion problems in the ports ofCalcutta and Mumbai is no longer an issue as containers can be diverted to the other portsserving these cities, i.e. Haldia Port and Jawaharlal Nehru Port respectively. In the case of Chennai, the Port Trust is implementing a plan to relocate container handling to a satellite port at Ennore.
Data relating to ship turnround performance and container handling productivity for thesix TAR connected ports also demonstrate the presence of substantial limitations oncontainer handling capacity in a majority of these ports. In 1996/97, average container vessel turnrounds stood at: 5.87 days in Calcutta Port, 1.54 days in Haldia Port, 4.33 days in Chennai Port, 3.13 days in Tuticorin Port, 6.76 days in Mumbai Port and 3.74 days in J.N.Port.15 While this performance was poor in all ports with the possible exception of HaldiaPort, in the case of both Calcutta and Mumbai ports it has deteriorated to levels which are clearly incompatible with sustained container throughput growth. The corresponding datarelating to container handling productivity reveal that Calcutta and Mumbai ports with only 4.4 and 8.4 containers per gross crane working hour respectively in 1995/96 again have thepoorest performance of any of the major Indian ports.16 It is likely that these figures reflect ahigh rate of equipment failure or non-availability, since Calcutta reported an availability rate for container tractors of only 53 per cent in the same year. They reinforce the observation that both ports are unlikely to be able to sustain high rates of container traffic growth without a substantial reform of work practices (including off-port relocation of container stuffing/unstuffing activity), reinvestment in handling equipment, or both.
(ii) Inland container handling capacity
14 India, Ministry of Surface Transport, Basic Port Statistics of India, 1996/97.
15 India, Ministry of Surface Transport, Basic Port Statistics of India, 1996/97.
16 A Agross crane working hour@ includes any time within the crane working hours during which a crane is idle for whatever reason.
113
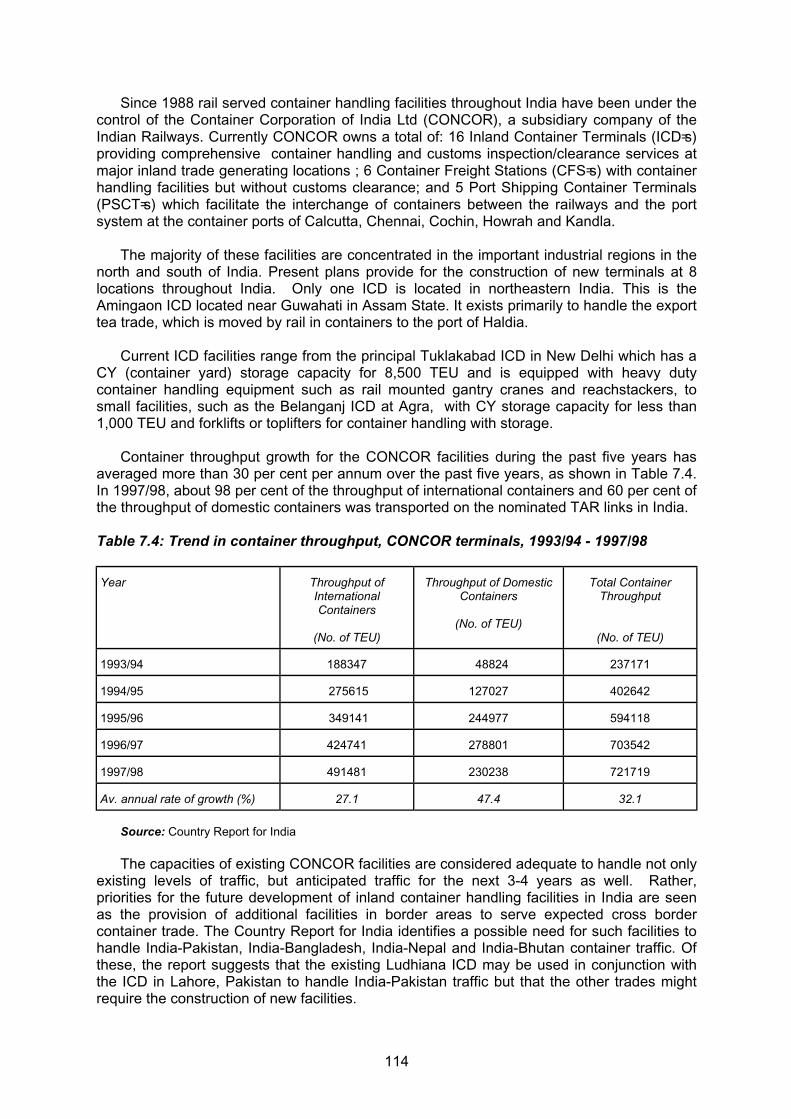
Since 1988 rail served container handling facilities throughout India have been under thecontrol of the Container Corporation of India Ltd (CONCOR), a subsidiary company of theIndian Railways. Currently CONCOR owns a total of: 16 Inland Container Terminals (ICD=s)providing comprehensive container handling and customs inspection/clearance services at major inland trade generating locations ; 6 Container Freight Stations (CFS=s) with container handling facilities but without customs clearance; and 5 Port Shipping Container Terminals (PSCT=s) which facilitate the interchange of containers between the railways and the port system at the container ports of Calcutta, Chennai, Cochin, Howrah and Kandla.
The majority of these facilities are concentrated in the important industrial regions in the north and south of India. Present plans provide for the construction of new terminals at 8 locations throughout India. Only one ICD is located in northeastern India. This is theAmingaon ICD located near Guwahati in Assam State. It exists primarily to handle the exporttea trade, which is moved by rail in containers to the port of Haldia.
Current ICD facilities range from the principal Tuklakabad ICD in New Delhi which has a CY (container yard) storage capacity for 8,500 TEU and is equipped with heavy dutycontainer handling equipment such as rail mounted gantry cranes and reachstackers, to small facilities, such as the Belanganj ICD at Agra, with CY storage capacity for less than1,000 TEU and forklifts or toplifters for container handling with storage.
Container throughput growth for the CONCOR facilities during the past five years hasaveraged more than 30 per cent per annum over the past five years, as shown in Table 7.4. In 1997/98, about 98 per cent of the throughput of international containers and 60 per cent ofthe throughput of domestic containers was transported on the nominated TAR links in India.
Table 7.4: Trend in container throughput, CONCOR terminals, 1993/94 - 1997/98
Year Throughput of InternationalContainers
(No. of TEU)
Throughput of DomesticContainers
(No. of TEU)
Total ContainerThroughput
(No. of TEU)
1993/94 188347 48824 237171
1994/95 275615 127027 402642
1995/96 349141 244977 594118
1996/97 424741 278801 703542
1997/98 491481 230238 721719
Av. annual rate of growth (%) 27.1 47.4 32.1
Source: Country Report for India
The capacities of existing CONCOR facilities are considered adequate to handle not onlyexisting levels of traffic, but anticipated traffic for the next 3-4 years as well. Rather,priorities for the future development of inland container handling facilities in India are seen as the provision of additional facilities in border areas to serve expected cross bordercontainer trade. The Country Report for India identifies a possible need for such facilities to handle India-Pakistan, India-Bangladesh, India-Nepal and India-Bhutan container traffic. Ofthese, the report suggests that the existing Ludhiana ICD may be used in conjunction withthe ICD in Lahore, Pakistan to handle India-Pakistan traffic but that the other trades mightrequire the construction of new facilities.
114


8. COMMERCIAL REQUIREMENTS
There is no guarantee that the mere availability of a through railway route to Europe willautomatically encourage freight shippers based in Kunming or elsewhere throughout the TAR southern corridor to use this route. In making decisions about route and mode choices, shippers will always be guided by their perceptions of the relative cost, standard and reliability of servicesoffered by alternative modes and operators.
For container shippers, the following service attributes are considered to be important inarriving at decisions about mode and route choice:
(i) Overall costs paid by shippers inclusive of transportation, handling and repositioning costs of containers taking into account the shipping logistics;
(ii) Transit time, representing the time interval between despatch of a consignment from a shipper=s premises and its arrival at the consignee=s premises;
(iii) Consignment security, or the extent to which consignments will be secure from damage or pilferage enroute, since this could affect an operator=s insurance coverand hence the overall transportation cost;
(iv) Reliability of service - specifically the extent to which an operator or mode can consistently meet promised delivery times for the shipper=s consignments;
(v) Comprehensiveness of service provided by operators, in terms of the extent to whicha single operator will arrange and accept responsibility for all components of the transportation/handling chain between ultimate origin and destination; and
(vi) Availability of real time information on the location of a freight consignment or container at any point in its journey between origin and ultimate destination.
These six attributes can be thought of as comprising the Aservice package@ offered by individual operators, which depending upon its perceived quality can either make or break atransport operator=s ability to win and/or retain business. Not all categories of shippers will ratethese attributes in the same order of priority or even in the order of priority as suggested above. For shippers of relatively high value commodities, reliability rather than cost may be the most
important selection criterion, since reliable service may allow their customers (the consignees)to reduce the inventory level needed to safeguard against unreliable delivery of consignments.For shippers of low value commodities, on the other hand, cost is likely to be the most importantcriterion, since excessive transportation costs could impair their competitiveness on international markets. Whatever the nature of a shipper=s business, however, mode or operator selection will invariably depend upon the trade-off made by shippers among the four attributes.
This chapter addresses the requirements for railway Aservice packages@ which would have to be offered (and delivered) in order to attract international container business to the TAR. Thethree elements which most influence rail=s competitiveness are: transit time, reliability and cost and these are addressed accordingly. However, it has to be acknowledged that rail may neverexpect to be competitive on some routes, while on others it has a reasonable expectation ofbeing able to offer service of competitive quality in future. An example of the former is perhaps the long haul movement of containers between Asia and Europe, while an example of the latteris movement between the Asian countries of the corridor. Nevertheless, this chapter contains a
120

comparison of the service packages offered by rail and its competitors in the case of both typesof routes.
8.1 Transit times
The transit times which could potentially be offered by rail, as compared with thoseestimated to be provided by rail=s main competitor, shipping, were assessed in respect of onelong haul route - for container movement between Dhaka and Frankfurt - and for several container routes between origins in Central Asia and destinations in the hinterland of countries within the corridor.
(i) Relative transit times, Dhaka - Frankfurt
The preliminary study report (ESCAP 1996) contains estimates of sea transit times for consignments of containers to Frankfurt from six origins in South Asia, among them the port of Chittagong in Bangladesh. The estimate for the latter origin has been amended in this study toinclude transit time for the hinterland journey between Dhaka and Chittagong, as well as to make a more realistic time allowance for transhipment in Colombo port. The amended estimateis given in Table 8.1.
Table 8.1: Estimate of sea transit time for container movement,Dhaka-Frankfurt (15,400 Km)
Trip component Mode Transit/dwell time (days)
Remarks
Dhaka-Chittagong Rail 1 Includes allowance for local delivery to rail terminal in Dhaka
Ship loading in Chittagong 2
Chittagong-Colombo Feeder ship 6
Transhipment in Colombo 3
Colombo-Rotterdam Mainline ship 18-20 Includes allowance for en-route port calls
Transhipment in Rotterdam 1
Rotterdam-Frankfurt Road truck 1 Door-to-door delivery in Frankfurt
Total 32-34
Notes: (1) Sea transit and port dwell times derived from data supplied by various shipping lines, as reported in ESCAP APreliminary Study on Development of Trans-Asian Railway in the Southern Corridor of Asia-Europe Routes@, 1996.
(2) Rail transit and dwell times derived from Country Reports and from ESCAP ALand Transport Corridors Between Asia and Europe@ 1997.
The data relating to commercial speeds as supplied by participating railway systems were used in conjunction with information on border dwell times to estimate the possible all-rail transit time between Dhaka and Frankfurt.
121

Table 8.2: Estimated all-rail transit time for container movement, Dhaka-Frankfurt
Trip component Distance(km)
EstimatedCommercialspeed(km/hr)
Transittime
(hours)
Borderdwell time
(hours)
Dwell time at break-of-gaugepoints (hours)
Total(days)
Dhaka-Darsana 278 20 14 72 24 4.5
Darsana-Attari 1,975 30 65 72 Not Applicable 5.7
Attari-Koh-i-Taftan 1,731 20 (1) 87 24 Not Applicable 4.6
Koh-i-Taftan-Razi 2,573 15.1 (2) 170 24 24 (3) 9.1
Razi-Kapikule 2,354 20.2 (4) 116 12 Not Applicable 5.3
Kapikule-Frankfurt 2,239 50 45 48 (5) Not Applicable 3.9
Total 11,150 22.4 497 252 48 33 (6)
Notes: (1) Based on average of reported commercial speeds for container trains, Karachi-Lahore and Karachi-Peshawar of 20.3 km/hour and 17.5-21.0 km/hour respectively (Country Report of Pakistan).
(2) Based on reported transit time Sarakhs-Bandar Abbas of 7 days (Country Report of Islamic Republic of Iran).
(3) Future break-of-gauge will be at Koh-i-Taftan. Prior to this, road transfer occurs at Zahedan for transport between Zahedan and Kerman railheads. The figure of 24 hours allows for this road transfer.
(4) Derived. Transit time of 116.25 hours reported during ESCAP mission to Turkey, March 1998. Thisincludes allowance for ferry crossings of Lake Van and Bosphorus Strait.
(5) Estimated number of borders at which delays imposed: 4 (Bulgaria, Roumania, Hungary and Austria) with estimated average delay at each: 12 hours.
(6) It must be noted that the 33-day transit time indicated reflects an ideal scenario with block-trains travelling the whole length of the corridor with no problem of onward connections. However, onemay expect that traffic will pick up at a different pace in different countries resulting in a more contrasted situation with containers being shed at one ICD where no load is to be picked up withthe consequence that the remaining load may have to wait for onward connections. In such a case, the transit time could be lengthened by another 4 to 6 days.
It may be concluded that, under present operating and administrative conditions, the TARsouthern corridor would at best offer a transit time for Dhaka-Frankfurt container traffic equal to that estimated to be provided currently by sea transport. This is despite the more than 4,000 km distance advantage enjoyed by rail.
Overall, the commercial speed for the route (including allowance for operational stoppingtimes, but not including allowance for border or break-of-gauge delays) is estimated at only 22km per hour. If the commercial speed could be lifted to 30 km per hour, i.e. approximately the speed applying in India, through operational improvements (such as reductions in the numberand duration of stops for operational purposes), the overall transit time for the route could be cutby 5.5 days. The wide gaps between the commercial speeds and the average running speeds (see Chapter 6) in most of the above listed countries can only be explained by operational delays, such as stopping for brake and wheel examination, train crew and/or locomotive exchange, etc.
Further, the border crossing delays between Bangladesh and India, and between India and
122

Pakistan would certainly appear to be excessive in relation to the need for adequate inspections in order to safeguard customs revenue and satisfy security requirements. If these could bereduced from three to one day on average, there would be an additional saving of 4 days in the overall transit time for the route. Coupled with the operational savings mentioned above, thesesavings could cut container transit times by rail to 25 days, as compared with 33 days under present conditions for sea transport. Only then could rail be said to offer transit times at acompetitive level with those of shipping.
(ii) Relative transit times, intermediate routes
In reality, rail=s competitive advantage in the southern corridor is focused on a number of intermediate routes. These are routes which have both a hinterland origin and a hinterland destination, are currently served by a combination of shipping and rail or road, and which could in future be served directly by rail. Examples of these routes are: Ashgabat-Dhaka; Ashgabat-Delhi and Ashgabat-Lahore. Ashgabat-Kuala Lumpur and Ashgabat-Bangkok could be added to the list, except that they do not currently have a rail transportation option. All are significant for the transportation of cotton from the source of supply in Central Asia to the garment manufacturing industry in South and Southeast Asia.
The estimated combined sea and land and rail only transit times for container traffic on thefirst three of the above listed routes are given in Tables 8.3 and 8.4, respectively.
The foregoing tables suggest that even with current commercial speeds lower than those of sea transport and with excessive border dwell times at two locations, rail can still offer asignificant transit time advantage over existing container shipping services on Central Asia to South Asia routes. This advantage ranges from 6 days in the case of Ashgabat-Dhaka traffic to 10 days in the case of Ashgabat-Lahore traffic, and is influenced by the significantly shorter direct rail distances as compared with combined shipping/rail distances, as well as by the lengthy dwell times for containers in South Asian ports. It is worth noting that the comparative advantage of rail could be increased to 10 days in the case of Ashgabat-Dhaka traffic and to 9days in the case of Ashgabat-Delhi traffic, if the excessive time required to complete borderformalities at both Wagah/Attari and Gede/Darsana could be reduced to a level more consistent with times reported at the other two borders (Koh-i-Taftan/Mirjaveh and Sarakhs). With the completion of the new direct rail connection between Bafq and Fariman in the Islamic Republicof Iran, the transit times for both the sea transport and the all-rail options could be expected to reduce by about 3.5 days. This would result from a saving of about 800 km in the trip distance and from the possibility that with fewer stops on the new line, the commercial speed might beexpected to increase to about 20 km per hour from the estimated current speed of only 15 km per hour. Thus, for the all-rail option, the transit time between Ashgabat and Lahore might be as little as 10.5 days in future.
123
A question now surely arises as to why, given the potential transit time advantage in despatching containers by rail over an international route network which is already in existence, direct rail services on the identified routes could not have already materialized. The answer to this question possibly lies in the variability of commercial speeds and border dwell times, butalmost certainly in the absence of a competitive international rail tariff and a purposeful commercial strategy targeted at diverting container and other profitable traffic from what isessentially a cumbersome and inefficient combined sea/land transport service. It is not,however, sufficient to suggest that such a commercial strategy could be implemented, unsupported by other initiatives - for example to improve relations at the government- to- government level. Undeniably, improved relations between India and Pakistan will provide thekey for unlocking normal commercial forces which will produce a substantial flow of trafficacross their mutual land border, and allow third parties to benefit in the process.

Table 8.3: Estimate of sea transit time for container movement, intermediate routes
Route Trip component Distance(Km)
Mode Transit/dwelltime (days)
Ashgabat-Dhaka Ashgabat-Bandar Abbas ( via Tehran) 2801 Rail/road 8
Dwell time at Sarakhs border 1
Ship loading in Bandar Abbas 2
Bandar Abbas-Jebel Ali 267 Feeder ship 0.4
Transhipment at Jebel Ali 1
Jebel Ali-Colombo 3105 Mainline ship 4.4
Transhipment at Colombo 2
Colombo-Chittagong 2200 Feeder ship 3.1
Dwell time in Chittagong Port 7
Rail loading and transport to Dhaka 321 Rail 1
Total 8694 30
Ashgabat-Delhi Ashgabat-Bandar Abbas (via Tehran) 2801 Rail/road 8
Dwell time at Sarakhs border 1
Ship loading in Bandar Abbas 2
Bandar Abbas-Jebel Ali 267 Feeder ship 0.4
Transhipment at Jebel Ali 1
Jebel Ali-Mumbai 2179 Mainline ship 4.5-7.5
Dwell time in Mumbai port 3
Rail loading and transport to Delhi 1319 Rail 2.5
Total 6566 22-25
Ashgabat-Lahore Ashgabat-Bandar Abbas (via Tehran) 2801 Rail/road 8
Dwell time at Sarakhs border 1
Ship loading in Bandar Abbas 2
Bandar Abbas-Jebel Ali 267 Feeder ship 0.4
Transhipment at Jebel Ali 1
Jebel Ali-Karachi 1253 Mainline ship 1.8
Dwell time in Karachi port 7
Rail loading and transport to Lahore 1220 Rail 3
Total 5541 24
Notes: (1) Speed of 16 knots (29.6 km/hr) assumed for all sea voyages, verified with shipping agents, Bandar Abbas.
(2) At Sarakhs border, customs formalities and gauge transfer together assumed to require 24 hours.
124
(3) Higher sea transit time Jebel Ali-Bombay (7.5 days) assumes voyage via Karachi including dwell time 3 days.
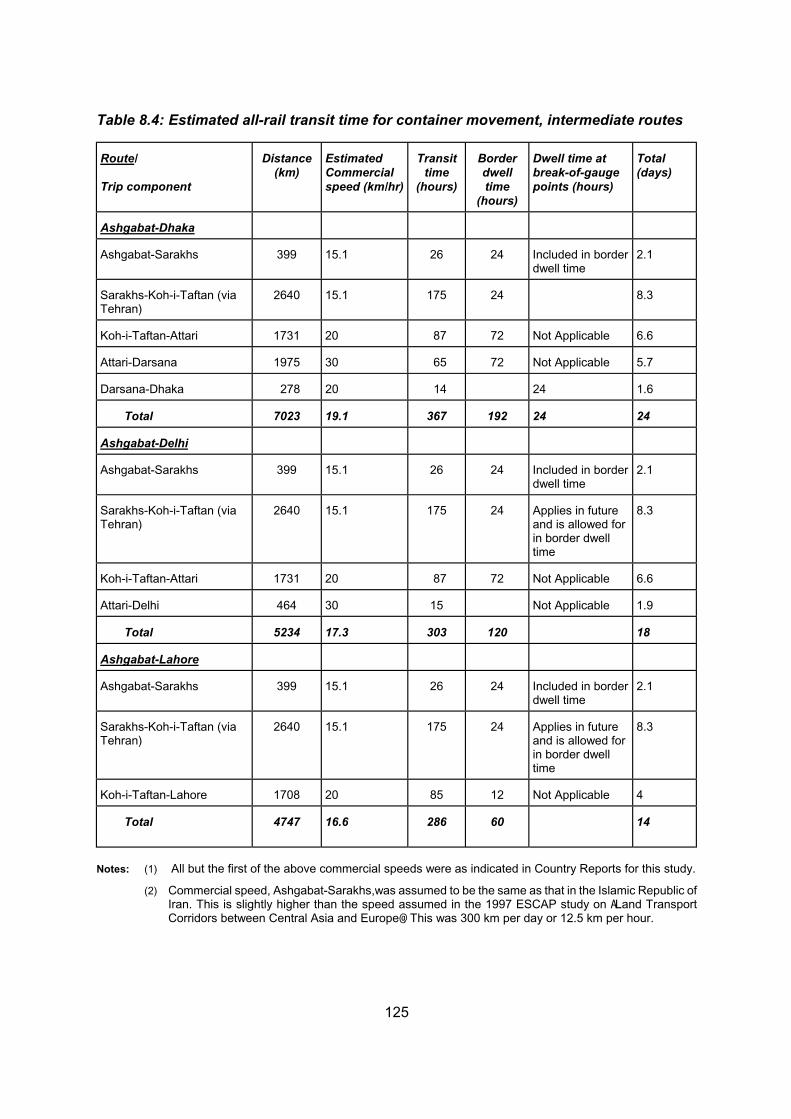
Table 8.4: Estimated all-rail transit time for container movement, intermediate routes
Route/
Trip component
Distance(km)
EstimatedCommercialspeed (km/hr)
Transittime
(hours)
Borderdwelltime
(hours)
Dwell time at break-of-gaugepoints (hours)
Total(days)
Ashgabat-Dhaka
Ashgabat-Sarakhs 399 15.1 26 24 Included in border dwell time
2.1
Sarakhs-Koh-i-Taftan (via Tehran)
2640 15.1 175 24 8.3
Koh-i-Taftan-Attari 1731 20 87 72 Not Applicable 6.6
Attari-Darsana 1975 30 65 72 Not Applicable 5.7
Darsana-Dhaka 278 20 14 24 1.6
Total 7023 19.1 367 192 24 24
Ashgabat-Delhi
Ashgabat-Sarakhs 399 15.1 26 24 Included in border dwell time
2.1
Sarakhs-Koh-i-Taftan (via Tehran)
2640 15.1 175 24 Applies in future and is allowed for in border dwelltime
8.3
Koh-i-Taftan-Attari 1731 20 87 72 Not Applicable 6.6
Attari-Delhi 464 30 15 Not Applicable 1.9
Total 5234 17.3 303 120 18
Ashgabat-Lahore
Ashgabat-Sarakhs 399 15.1 26 24 Included in border dwell time
2.1
Sarakhs-Koh-i-Taftan (via Tehran)
2640 15.1 175 24 Applies in future and is allowed for in border dwelltime
8.3
Koh-i-Taftan-Lahore 1708 20 85 12 Not Applicable 4
Total 4747 16.6 286 60 14
Notes: (1) All but the first of the above commercial speeds were as indicated in Country Reports for this study.
(2) Commercial speed, Ashgabat-Sarakhs,was assumed to be the same as that in the Islamic Republic of Iran. This is slightly higher than the speed assumed in the 1997 ESCAP study on ALand TransportCorridors between Central Asia and Europe@. This was 300 km per day or 12.5 km per hour.
125
8.2 Tariffs
8.2.1 Tariff setting principles
One of the difficulties inherent in attempting a comparison of international sea and rail transport tariffs is that more often than not through international rail tariffs are not in existence,or if they are, they are not set with reference to the structure and level of the tariffs of competingmodes. Among the participating railways in the Southern Corridor, only China, the IslamicRepublic of Iran, Turkey, and to a very limited extent Thailand, have had any experience ofoperating within international rail tariff setting mechanisms. Whatever the deficiencies of the SGMS and COTIF tariff setting mechanisms within which three of these four railways operate,they at least provide a tariff structure which applies throughout the entire journey of aconsignment and which is transparent and capable of being understood by rail customers.
Within the Southern Corridor, rail hauled containers currently cross only two borders - thosebetween the Islamic Republic of Iran and Turkmenistan, and between Turkey and Bulgaria.
Transit container traffic from origins in Central Asia to the port complex at Bandar Abbas movesunder SGMS tariff setting rules, while container traffic between origins/destinations in Turkeyand Western Europe moves under the Europe-Asia Tariff Agreement (TEA). The latteragreement is administered by the B-PO Tariff Union (or Tariff Union of Balkan and Near East Countries), to which the railway systems of Bulgaria, Greece, the Islamic Republic of Iran,Macedonia, Roumania, Serbia, the Syrian Arab Republic and Turkey are parties.
While bilateral container traffic could move between the Islamic Republic of Iran and Turkey under this agreement, in fact no rail-hauled containers currently cross the Razi/Kapikoy border.A particular problem has recently arisen for the movement of transit wagons from Central Asiathrough Turkish territory, since Turkey is not a member of the SGMS tariff setting convention,neither are the Central Asian countries members of the COTIF convention or B-PO Tariff Union. At the time of writing, this matter was being resolved through discussions between the Turkishand Central Asian railway authorities, but it is understood that this problem has prevented theapplication of through international tariffs to the movement of transit wagons from Central Asia through Turkey and points west. This problem is compounded by the fact that some wagons owned by railway systems of the Central Asian Republics infringe the Turkish loading gaugeand can be transported only as far as Lake Van, where their contents are either discharged intoTurkish wagons or transferred to road.
Container wagons do not yet move across the borders of the Islamic Republic ofIran/Pakistan, Pakistan/India, India/Bangladesh (west), or Bangladesh (east)/India, although there are no insurmountable technical problems which would prevent such movements. Thesmall volumes of freight traffic which do presently move across these borders are moved mostly in four wheel (2 axle) boxcars. One of the factors working against container wagon movements across these borders is the lack of an appropriate through tariff setting agreement between thevarious countries. Current tariffs applied to traffic between these countries are additive, in the sense that the tariff of the traffic originating system is applied up to the border with the receiving system, while the tariff of the receiving system is applied from the border to the ultimate destination. Typically, shippers pay the freight charge at the point of despatch for movement oftheir consignments to the border and consignees or their agents pay, either at the border station or the ultimate destination, the receiving system charge for movement of consignments from the border.
The net effect of additive tariffs is that railway customers, overall, will have to pay muchhigher tonne-kilometre charges than they might if a distance tapering tariff were applied from
126

origin to destination.1 This is because the per tonne kilometre rate applied by each system willtaper only over the shorter distance run by wagons on its territory. As an example, the following hypothetical charges might apply to the movement of a freight consignment from New Delhi(India) to Peshawar (Pakistan), a distance of 949 km 2:
Section Distance(Km)
Hypothetical charge per net tonne-km
(US$ equiv.)
Charge payable for one tonne
(US$ equiv.)(1) Delhi-Attari/Wagah 464 0.012 5.568(2) Attari/Wagah-Peshawar 485 0.012 5.820(3) Sum of (1) and (2) 949 11.388 (4) Delhi-Peshawar 949 0.007 6.643
In this example, item (3) represents the outcome when the tariff is additive and item (4)represents the outcome when a single through tariff is applied, on the assumption that a similar type of tariff structure would be applied either side of the India/Pakistan border. The exampledemonstrates very clearly that in the case of the additive tariff system, freight customers wouldpay almost double the charge they would pay if a single through tariff were applied.
The essential points which must be made about tariff setting principles in this context arethat:
(i) The attraction of greater volumes of international freight traffic to the TAR networkwill depend critically upon the application of a single through tariff between origin and destination;
(ii) This will imply that the neighbouring railway systems not only agree to the unification of their respective tariff structures, but also that they put into place a mechanism for the equitable distribution of revenue among themselves, in accordance with an appropriate, and preferably uncomplicated, formula (such as, for example, a distribution based on their respective shares of the total haul distance);
(iii) Unified tariff rates must be established at a level which will be attractive to customers who are presently using alternative transport modes. In other words, the participatingrailway systems will have to abandon cost plus pricing of their services in favour of customer oriented pricing focused on marketplace realities.
With these principles as a background, it is useful to establish competitive benchmarks forrailway tariffs in the Southern Corridor by comparing the current level of railway charges with those of rail=s principal competitors, i.e. shipping and road transport for longer and shorter haulroutes respectively.
1 A distance tapering tariff is one in which the rate per tonne-km falls in proportion to increasing distance. It is based on the theory that each charge has both a fixed (terminal related) and variable (haulage related) component. As distance increases, the invariant component is spread over a greater number of kilometres and so its unit rate (per tonne-km) declines proportionately. Such a tariff structure is commonly applied by most railway organizations to theirfreight customers.
2 This hypothetical example was based on the container tariff structure currently applying within Pakistan. It demonstrates a possible outcome if a similar tariff structure could be applied both sides of the border.
127

8.2.2 Tariff benchmarks
The tariff levels with which rail would have to compete in order to attract traffic to the TAR Southern Corridor network were assessed in respect of container movement on one long haulroute, i.e. Dhaka to Frankfurt and on one intermediate route, i.e. Ashgabat to Lahore.
(i) Benchmark container transport charges, Dhaka - Frankfurt
Charges applying to the handling and transport of containers by sea between Dhaka andFrankfurt were obtained from a representative sample of shipping agents based in Chittagong.These are shown in Table 8.5.
Table 8.5: Estimate of sea handling and transport charges for container movement,Dhaka-Frankfurt
Trip component Distance Charge for loaded20 ft container (US$)
Rate per TEU-km(US$)
Loading to rail in Dhaka 13
Rail linehaul to Chittagong 321 65 0.202
Loading to ship in Chittagong 88
Ship movement to Rotterdam (via Colombo)
14635 1132 0.077
Transhipment in Colombo 193
Transhipment in Rotterdam 130
Road delivery, Rotterdam-Frankfurt 400 500 1.25
Total 15400 2121 0.138
These estimates demonstrate that in order to attract new container haulage business on the route between Dhaka and Frankfurt, rail would have to offer an all-up charge which is significantly less than US$ 2,121 per TEU. Allowing for the shorter rail distance involved, thiswould be equivalent to US$ 0.190 per TEU-km.
Given that the cheapest unit rates for the longest rail hauls of containers within the TAR Southern Corridor are currently no lower than US$ 0.181 per TEU-km, or US$ 0.228 per TEU-km with the addition of terminal and local delivery charges3, it is difficult to envisage that rail canbe competitive in the Asia-Europe container trade.
This is confirmed by a recent European Commission study which quoted an all-up charge forsea transport, handling and local transport of 20 ft containers from Essen to Bangkok of justUS$ 1,671 (for a 17,400 km haul, equivalent to US$ 0.096 per TEU-km) and by recent media reports that westbound rates between Bangkok and destinations in Europe were now as low as
3 Haulage charge for 20ft loaded container between Tuklakabad ICD and Chennai (Madras) Port - 2,143 km. If, as is suggested in the Country Report for India, terminal charges of about US$ 48 per TEU per terminal and local delivery charges of about US$ 0.086 per TEU-km for, say, 30 km have to be added to the haulage charge, then the all-up charge for a container haul of 2,143 would be of the order of the order of US$ 0.23 per TEU-km.
128

US$ 1,725-1,825 per TEU (US$ 0099-0.105 per TEU km).4 Even if the westbound ratesincrease as envisaged by an average of US$ 200 per TEU from 01 January 1999, the resultingper TEU-km rate of US$ 0.110-0.116 would still pose a formidable challenge for rail, especiallywhen rail is unlikely to enjoy a transit time advantage on these routes. In this case rail, whichwould have a haul distance via routes TAR-S3 and TAR-S1 of about 13,000 km, would have tooffer an all-up charge of something less than US$ 0.148 -0.156 per TEU-km, in order to compensate for the lack of a transit time advantage.
(ii) Benchmark container transport charges, intermediate routes
Sea freight rates for container movement between Bandar Abbas and a selection of ports in South, Southeast and East Asia were provided on request by a representative group of shipping agents based in Bandar Abbas. However, of the South Asian ports, only a rate for BandarAbbas-Karachi was provided. This was US$ 370 per loaded 20 ft container, including charges applying to container transhipment in Jebel Ali Port, Dubai. This rate was used to assess the all-up shipping handling and transport charge, providing the benchmark for charges which wouldhave to be offered for all-rail movement of a loaded 20 ft container on the route between Ashgabat and Lahore. This benchmark is about US$ 1,550 as may be observed from Table 8.6. When apportioned over the shorter rail distance between Ashgabat and Lahore of 4,747 km, thiswould be equivalent to US$ 0.327 per TEU-km.
4 European Commission, DG VII (Transport) (1997), Comparative Study of Surface Transport Routes betweenEurope and Asia and Bangkok Post, Business Section, Cargo space shortage puts exports at risk, Monday, October 26, 1998.
129

Table 8.6: Estimate of sea handling and transport charges for container movement,Ashgabat-Lahore
Trip component Distance(Km)
Charge for loaded20 ft container
(US$)
Rate per TEU-km
(US$)
Loading to rail, Ashgabat 50 (1)
Rail linehaul, Ashgabat-Bandar Abbas 2801 684 (2) 0.244
Bogie exchange, Sarakhs border 50 (1)
Ship loading in Bandar Abbas 60
Ship movement, Bandar Abbas-Karachi 1520 370 0.243
Ship discharge and loading to rail, Karachi Port 50 (1)
Rail linehaul, Karachi-Johore 1219 281 (3) 0.231
Total 5540 1545 0.279
Notes: (1) Handling charges in rail and port terminals estimated as per ESCAP :ALand Transport Corridors between Central Asia and Europe, 1997, with the exception of those for Bandar Abbas which represent actual charges as provided by the Port and Shipping Organization of the Islamic Republic of Iran and Lahore, which are negligible and have been excluded.
(2) Per TEU rail linehaul charge provided by the Iranian Islamic Republic Railways for Sarakhs-Bandar Abbas was extended to Ashgabat.
(3) Rail linehaul charge, Karachi-Lahore was derived from Country Report for Pakistan.
Although sea freight components of charges for container movement between Ashgabat and Dhaka and Ashgabat and Delhi were not available, it is believed that they would be of the order of US$ 525 and US$ 400 per TEU, respectively. The estimated container shipping charge ofUS$ 525 for movement between Bandar Abbas and Chittagong is based on the quoted chargefor Bangkok bound containers, since like shipping moves to Bangkok, shipping moves toChittagong from Bandar Abbas would involve two lots of transhipment (one at Jebel Ali and another at Colombo), but since Chittagong has a smaller base container volume it is likely to besubject to higher unit freight rates than is Bangkok.
Benchmark charges were accordingly estimated for these two routes and are given in Tables 8.7 and 8.8.
130

Table 8.7: Estimate of sea handling and transport charges for container movement,Ashgabat-Dhaka
Trip component Distance(Km)
Charge for loaded20 ft container
(US$)
Rate per TEU-km
(US$)
Loading to rail, Ashgabat 50 50 (1)
Rail linehaul, Ashgabat-Bandar Abbas 2801 684 0.244
Bogie exchange, Sarakhs border 50 (1)
Ship loading in Bandar Abbas 60
Ship movement, Bandar Abbas-Chittagong 5572 525 0.094
Ship discharge and loading to rail, Chittagong Port 88 (1)
Rail linehaul, Chittagong-Dhaka 321 130 (2) 0.374
Off-loading from rail, Dhaka 13 (1)
Total 8694 1600 0.184
Notes: (1) Source: ESCAP (1997) except charges for Bandar Abbas and Dhaka which are actuals
(2) Source: Bangladesh Railways
Table 8.8 : Estimate of sea handling and transport charges for container movement,Ashgabat-Delhi
Trip component Distance(Km)
Charge for loaded20 ft container
(US$)
Rate per TEU-km
(US$)
Loading to rail, Ashgabat 50 (1)
Rail linehaul, Ashgabat-Bandar Abbas 2801 684 0.244
Bogie exchange, Sarakhs border 50 (1)
Ship loading in Bandar Abbas 60
Ship movement, Bandar Abbas-Mumbai 2446 400 0.164
Ship discharge and loading to rail, Mumbai 50 (1)
Rail linehaul, Mumbai-Delhi 1319 273 (2) 0.207
Off-loading from rail, Delhi 48 (2)
Total 6566 1615 0.246
(1) Source: ESCAP (1997) except charges for Bandar Abbas which are actuals
(2) Source: Country Report for India
The estimates given in Tables 8.6-8.8 suggest that, unlike all-rail container movementbetween Asia and Europe, all-rail container movement on intermediate routes between CentralAsia and South Asia does have some possibility of being competitively priced (as compared withshipping). This is so because the rail charges required to match the shipping charges are: US$ 0.325 per TEU-km for Ashgabat-Lahore, US$ 0.228 for Ashgabat-Dhaka and US$ 0.309 forAshgabat-Delhi; all within easy reach of current tariff structures, provided a through internationaltariff on a tapering scale from origin to destination can be devised and offered.
131

9. DEVELOPMENT PLANS
Most of the railway systems participating in this study have established development plans for their networks and for their locomotive and rolling stock fleets. Since many of the projectsidentified in these development plans have implications for the on-going development and operational enhancement of the Southern Corridor of the Trans-Asian Railway, they have beenoutlined in this chapter. Any development requirements over and above those addressed in the country programmes and identified in the foregoing analysis have also been included in thecountry by country outlines in this chapter.
9.1 TAR network development in the participating countries
9.1.1 Bangladesh
Significant projects of the Bangladesh Railways, either underway or planned for commencement in the near future, include:
(a) On TAR Links Bn.1 and Bn.3, construction or reconstruction of the Bangabandhu (Jamuna River) Bridge connecting lines. The principal component of this project is theconstruction of a new dual gauge line of 99 km length between Joydebpur and Jamtoil toconnect the east and west zones of the Bangladesh Railway network across the recentlycompleted Jamuna River Bridge. Construction of this new line which is estimated to costUS$ 151.2 million (US$ 1.53 million per km) commenced in 1997 and is scheduled for completion in 2001. The two other components of this project involve conversion by 2001of existing broad gauge (1676 mm) lines between Jamtoil and Ishurdi (66 km) and between Ishurdi and Parbatipur (174 km) to dual gauge, at an estimated cost of US$ 93.3 million.
(b) On TAR Links Bn.1 and Bn.2, rehabilitation of track and bridges between Darsana and Ishurdi and between Dhaka and Chittagong. This project, costing US$ 131.7 million, commenced in 1995 and is scheduled for completion in 2000. It involves track and bridge renewal with the objective of maintaining current speed and axle load standards. Included in this work is the partial rehabilitation of the longest railway bridge in Bangladesh - theHardinge Bridge across the River Ganges at Paksey.
(c) On TAR Link Bn.2, signalling system rehabilitation, replacement and modernization. Thisis a proposed system-wide project to upgrade signalling and interlocking equipment at 30stations, of which 16 stations are located on the Dhaka-Chittagong line. It has anestimated cost of US$ 14.3 million and is under feasibility study for funding by theGovernment of Germany. Its objective is to increase line capacity and enhance safety.
(d) On TAR Link Bn.2, construction of double track from Tongi to Bhairab Bazar. This project is also under feasibility study for funding by the Government of Germany. It was conceived as a project to double track the Tongi-Bhairab Bazar section (65 km) in metre gauge for a cost estimated at US$ 43.18, but is now likely to be revised to allow for conversion of the existing metre gauge line to dual gauge and the construction of an additional line in broad gauge between Joydebpur and Akhaura (110 km).
132

(e) System-wide procurement of locomotives and wagons. As part of a programme to procure 47 new locomotives for an estimated cost of US$ 121 million, 12 metre gauge locomotives have already been acquired, tenders are being finalized for procurement for an additional 19 locomotives, and the Government of Germany has promised financial assistance for purchase of 6 broad gauge locomotives. Also underway is a project to rehabilitate 56 broad gauge and 156 metre gauge locomotives at an estimated cost of US$ 28 millionand to acquire 100 new container wagons at an estimated cost of US$ 3.85 million.
Projects which will be subjected to detail appraisal for commencement in the medium-longer term include the following:
(f) On TAR Link Bn.2, conversion of second metre gauge track Ashuganj-Akhaura and Chinki Astana-Chittagong to broad gauge, and construction of second track in broad gauge, Akhaura-Chinki Astana. This project, which is estimated to cost US$ 192 million, would connect Chittagong to the broad gauge system, in addition to expanding line capacity onBangladesh=s busiest line. It will be subjected to feasibility study under an ADB Technical Assistance Programme during 1999.
(g) On TAR Link Bn.2a, track and signalling improvements, Chittagong-Dohazari and construction of new metre gauge line from Dohazari-Gunghum (border with Myanmar).Track and bridge reconstruction and strengthening, as well as signalling systemimprovement, will be required on the existing light branch line between Chittagong and Dohazari (47 km), at an estimated cost of US$ 16 million. Construction of the proposednew 145 km line between Dohazari and Gundhum is estimated to cost US$ 130 million(approximately US$ 900,000 per kilometre). Although the Country Report for Bangladesh states that the new line will be constructed in the metre gauge, the proposed connection of Chittagong to the broad gauge system (see above) would seem to emphasize the desirability of also constructing the new line in broad gauge.
(h) Various system-wide locomotive and rolling stock procurement and upgrading proposals.These proposals include procurement of up to 76 new locomotives (US$ 150.3 million),refurbishment of 60 metre gauge locomotives (US$ 76.0 million), conversion of 10,000wagons from plain to roller bearings (US$ 2.9 million), and conversion of wagons to airbrakes and automatic couplers (US$ 4.4 million).
(i) Procurement of new container wagons to support traffic growth on TAR network. Another100 container wagons will be added to the existing fleet of 166 by 2000 in order to satisfy transport demand on the Dhaka-Chittagong feeder service until 2010 (see item Ae@ above). It has been determined that an additional 27-56 metre wagons will be required to support traffic growth on this line up until 2017. In addition, it has been estimated that support of international container services on the TAR network may require procurementof about 75 broad gauge container wagons between 2001 and 2017 (14 in 2001/02, 30 in2004/05, and 31 between 2010 and 2017). At a unit cost of US$ 60,000 for a metre gaugewagon and US$ 80,000 for a broad gauge wagon, the wagon procurement programmebeyond 2000 could cost up to US$ 9.4 million.
(j) Provision of break of gauge container transhipment facility. The proposed eastward extension of the broad gauge system will require the provision of modern container transhipment facilities at the main new break-of-gauge station. Possible locations for this transhipment facility have been suggested at Ishurdi, Joydebpur, Tongi, Dhaka (or in the longer term) Chittagong. The construction cost for a container transhipment facility wasestimated at US$ 5.0 million.
133

9.1.2 China
Investment by the Government of China in the development of the Trans-Asian Railway on its territory has so far been concentrated on the construction of the new 213 km line linking Guangtong (about 100 km west of Kunming) with the city of Dali in western Yunnan Province. This line, which will form part of TAR Link Ch.1 and of the main intercontinental route TAR-S1, is understood to be nearing completion. A 1994 estimate of its construction cost was 2 billion yuan(approximately US$ 242 million), but the final cost is likely to be substantially in excess of this estimate.1
9.1.3 India
Indian Railways development programmes affecting nominated TAR links are of two types, the first involving initiatives at the system-wide level and the second involving initiatives which have a specific focus on individual TAR links.
At the system-wide level, the railway is committed to a programme of upgrading thecarrying capacity of both its rolling stock and its routes. The first is being achieved by adoptingmore efficient wagon designs which optimize payload in relation to tare weight, while the secondis being achieved through progressive upgrading of main line track to accept an increase in maximum permissible axle loads, from 20.32 tonnes at present to 22.1 tonnes in future, therebyallowing the use of higher horsepower locomotives and increased train trailing loads . Theseinitiatives can be expected to augment capacity on several trunk routes which have already reached saturation. Routes expected to benefit most from these programmes are the trunk routes of the so-called AGolden Quadrilateral@, linking New Delhi, Calcutta, Chennai (Madras) and Mumbai (Bombay). These correspond with TAR links In.1, In.2 and In.3.
At the level of individual TAR links, through its AUnigauge@ programme, the Indian Railways has succeeded in reducing the pressure on its saturated trunk lines by converting parallel metregauge lines to broad gauge, allowing them to be used as alternative routes for the former.Additionally, the conversion of metre gauge TAR links to broad gauge provides them withgreater capacity owing to the higher speed and axle load limits applying to broad gauge track.Since the AUnigauge@ project began in 1992, some 7,000 km of metre gauge trackage has been converted to broad gauge, including more than 700 km on TAR Link In.5a (from Guwahati toLekhapani) and approximately 140 km on TAR Link In.4 (Muzaffarpur to Raxaul). The capitalworks budget of the Indian Railways allows for the gauge conversion of 198 km of metre gaugemain line between Lumding and Silchar on TAR Link In.5b, at an estimated cost equivalent to US$ 155 million (approximately US$ 783,000 per km).2 It is expected that this project willcommence within the next two years.
Also at the level of individual TAR links, the on-going programme for electrification of high density routes and for the construction of additional container handling facilities may also be expected to have a significant impact on capacity enhancement within the nominated TARnetwork in India.
Other projects being undertaken to increase route capacity on the nominated TAR links include:
1 Yunnan Railway General Corporation: A Brief Introduction of the Guanton-Dali Railway, Yunnan PRC - Specialized Data for Raising Capital, December 1994.
2 Based on information provided by the Indian Railways Board during the ESCAP mission to India in April 1998.
134

(a) On TAR Link In.1, additional line construction and signalling improvements. The provision of a third running track between Sonnagar and Mulghalsarai (124 km), Manpur and Gaya (169 km), and Kanpur and Panki (about 160 km) are examples of capacity expansion projects already underway on this link, as is installation of automatic signalling betweenGhaziabad and Aligarh (106 km).
(b) On TAR Link In.2, provision of automatic signaling and new line construction. Installationof automatic signalling, underway between Arakkonam and Jolarpettai (204 km) willprovide relief for the heavily congested Madras - Erode section at the southern end of thislink.
(c) On TAR Link In.3, construction of new crossing/passing loops and extension of existing loops. This involves additional loop construction between Virar and Vadodara and loop extension at Piplod, in order to augment capacity on the Ratlam and Vadaodara section of this busy Delhi-Mumbai trunk line, on which train density currently represents about 131%of measured capacity.
In addition, the Indian Railways has longer term plans for the construction of new broadgauge lines in the northeast, between Diphan and Imphal and between Kumarghat and Argartala (119 km). These lines will link the capital cities of Manipur and Tripura states, respectively, to the Indian rail network and, on completion of the gauge conversion of the existing northeast metre gauges system, can be expected to feed traffic into the TAR network.The construction cost of the Kumarghat-Agatala line, excluding the cost of bridges and tunnels,is estimated at the equivalent of US$ 138 million (or about US$ 1.16 million per km). This project is targeted for commencement in 2002.3
Not included in current plans are capacity expansion works on Link In.2, between Bina and Itarsi (230 km) and between Vardha and Kazipet (366 km), both sections having reached greater than 100 per cent capacity saturation and perhaps requiring attention in the near future.
In addition, there may be some justification for investigating possible capacity relief measures for two critical sections of Link In.4, where the use of alternative routes may not be a practical possibility. Within one of these sections, the link crosses the River Ganges nearBarauni.
9.1.4 Islamic Republic of Iran
The Iranian Islamic Republic Railways have a programme of track duplication underway onTAR Link Ir.4 between Fariman and Tehran (a distance of 890 km) and on TAR Link Ir.1 between Tehran and Qom (a distance of about 100 km), in order to augment capacity on theseapparently congested lines. It is understood that the Tehran-Qom project either has been completed or is nearing completion, and that duplication on approximately 400 km of the Fariman-Tehran line has now been completed. No indication of the capital cost of these projects was provided.
3 Indian Railways Board (1998).
135
Another major development project now underway on the nominated TAR network in the Islamic Republic of Iran is the construction of a new standard gauge line within Link Ir.1 to closethe 545 km gap between Kerman and Zahedan in the southeastern region of the country. This project, which is described in detail in Chapter 4 of this report, is estimated to costapproximately US$ 1.2 million per km to construct, giving an overall cost of about US$ 654 million.4 At the time of writing, formation and bridge works had been completed on about 100km of the new line, construction of which commenced in 1996 and (subject to the availability offunds) is scheduled for completion during 2000/01.
Funding limitations have so far delayed a start on a second major new line constructionproject, involving the building of a direct north-south connection between Fariman and Bafq, with a length of about 790 km. No cost estimates were provided for this project but, as is the casewith the Kerman-Zahedan project, it depends wholly on government funding, although part of the funding is being provided from fuel tax revenues and from a levy on rail freight customers. When complete, the new Fariman-Bafq line will cut the distance and trip time from Central Asia to Bandar Abbas by 800 km and 3.5 days respectively.
9.1.5 Myanmar
TAR development priorities for Myanmar are likely to be focussed on:
(a) Expansion of structure dimensions and strengthening of track on Link My.1 (betweenYangon and Mandalay and Yangon and Moktama), in order to satisfy TAR structure gauge and axle load standards. Estimated cost: US$ 41 million.5
(b) Crossing loop construction and signalling system improvement between Thazi and Mandalay on Link My.1, in order to provide sufficient line capacity for increased container movement. Estimated cost: US$ 21 million.6
(c) Locomotive and rolling stock purchases to support projected growth in container traffic onnominated TAR links in Myanmar. Estimated cost: US$ 11 million.7
(d) Reconstruction of the entire Mandalay-Lashio line section (313 km) on Link My.2b in order to correct poor track alignment and to meet TAR track design standards for the conveyance of containers. Estimated cost: US$ 704 million.8
(e) Construction of a new line of 135 km length between Kalay and Tamu on Link My.3a, tocomplete a link to the border with India. Estimated cost: US$ 236 million.9
4 Information provided by the Iranian Islamic Republic of Iran Railways during ESCAP mission to Tehran, May1998.
5 ESCAP (1996), op cit, Volume 3, page 74.
6 ESCAP (1996), op cit, Volume 3, page 88.
7 ESCAP (1996), op cit, Volume 3, pages 92-94.
8 It is estimated that the cost of reconstructing this line would not be significantly different from that associated with new line construction, bearing in mind that complete realignment on a new formation would be required. In line with the per km cost of new line construction in Chapter 4, a cost of US$ 2.25 million was used to estimate the cost of reconstructing this line.
9 See Chapter 4.
136

In summary, total funding of the order US$ 1.01 billion would be required to satisfy TAR development requirements in Myanmar up until the year 2017.
9.1.6 Pakistan
The current system development programme of the Pakistan Railways includes a numberof projects which affect the nominated TAR links in Pakistan. Details of these projects are as follows:
(a) Track and track component renewals, in order to maintain existing speed and axle load standards. During 1997/98 complete track renewal was in progress on a total of 34 km onLinks Pk.1, Pk.2 and Pk.3. Within the same period, sleeper renewal was in progress on a total of 35 km on Links Pk.1 and Pk.3 and rail renewal was in progress on a total of 58 km on Links Pk.1 and Pk.5. Costs were not provided.
(b) Locomotive procurement. Procurement of 30 new 3,000 HP diesel electric locomotives was in progress during 1997/98. The haulage capacity of these locomotives for single unitoperation is 2,200 tonnes at 75 km per hour. In addition, 101 locomotives were beingupgraded to permit single unit haulage of 2,000 tonnes at 65 km per hour or dual unit haulage of 2,000 tonnes at 85 km per hour, and approximately US$ 17 million was expended on procurement and rehabilitation of traction motors.
(c) Wagon upgrading, in order to increase operating speeds and expand line capacity. Thisproject includes: air brake conversion of 550 oil tanker wagons to permit operation in trainloads of 2,250 tonnes (up from 2,000 tonnes) at a speed of 70 km per hour (up from 55 kmper hour), costing US$ 10.53 million; and, re-equipment of 8,000 freight wagons with roller bearings at an estimated cost of US$ 155.98 million.
(d) Signalling improvement. Improvements to signalling systems in progress in 1997/98 included: track circuiting of a total of 94 stations on Links Pk.1, Pk.3 and Pk.4 with the aimof enhancing safety of through train operation and an estimated cost of US$ 1.8 million;provision of tokenless block working between Lodhran and Khanewal on Link Pk.1 and between Khanewal and Faisalabad on Link Pk.5, with a cost of US$ 0.8 million; provisionof colour light signalling between Raiwind and Lahore on Link Pk.1, at a cost of US$ 2.0million; and installation of improved signalling between Port Qasim and Mating on LinkPk.3 and between Shahdara and Shorkot on Link Pk.5, at a cost of 2.1 million.
Future development works programmed for the 9th five year railway development plan include:
(e) Further track rehabilitation. Track renewals on a total of 28 km on Links Pk.1, Pk.3 and Pk.5 will be undertaken in 1998/99, at an estimated cost of US$ 0.94 million. Majorrehabilitation works are to be undertaken during 1998-2003 on several major sections onLinks Pk.1, Pk.3, Pk.4 and Pk.5, at an estimated cost of US$ 144.23 million.
(f) Track duplication. An amount of US$ 36.54 million has been allocated for track duplication of 121 route km between Lodhran and Khanewal (via Multan) on Link Pk.5. In addition,US$ 15.39 million has been allocated for duplication of 44 route km between Sangla Hill and Faisalabad on Link Pk.5.
137
(g) Track upgrading between Spezand and Koh-i-Taftan on Link Pk.1. As part of a Memorandum of Understanding of 15 September 1991 between the Governments of Pakistan and the Islamic Republic of Iran, the Pakistan Railways will undertake major upgrading work within the tenure of the 9th plan, involving reconstruction of the worst

sections of track, replacement of dips with proper bridges and reballasting, with the aim of lifting operating speeds from 40 km per hour to 65 km per hour. The estimated cost of thisproject is US$ 34.62 million. The Memorandum of Understanding requires the Governmentof the Islamic Republic of Iran to execute similar improvements to the Mirjaveh - Zahedan section.
(h) Bridge rehabilitation. Life expired bridges within the Karachi-Peshawar corridor (TAR Links Pk.1, Pk.3 and Pk.4 will be rehabilitated at a cost of US$ 3.06 million.
(i) Telecommunications systems upgrading. This project involves extension of microwave communications links to the Lahore-Khanewal and Rawalpindi-Peshawar sections of Links Pk.1 and Pk.4 respectively. The estimated cost of the project is US$ 11.54.
(j) Further signalling works. Two projects with a combined cost of US$ 1.69 million will beundertaken, to replace kerosene lit with electrically lit signals and to rehabilitatemechanical signalling on various parts of the system, including the Lodhran-Raiwaind, Shahdura-Lalamusa and Sangh Hill-Khanewal sections on Links Pk.1, Pk.4 and Pk.5, respectively.
(k) Upgrading of terminals. A sum of US$ 2 million has been allocated for upgrading various station and terminal facilities throughout the entire system.
(l) Electrification of Khanewal-Samsatta section. The 286 km long Lahore-Khanewal electrification on TAR link Pk.1, completed in 1968/69, will be extended by 119 km to Samasutta, at an estimated cost of US$ 40 million.
(m) Further procurement and replacement of locomotives. An additional 176 locomotives will be required within the tenure of the 9th plan to accommodate projected increases in the system-wide traffic task, at a cost of about US$ 387 million (US$ 2.2 million per locomotive. In addition, the 29 electric locomotives in service since 1969 will need to bereplaced, at an estimated cost of US$ 102 million and the 36 diesel electric locomotives of3000 HP in service for the past 28 years will need to be rehabilitated, at an estimated costof US$ 70 million.
(n) Wagon fleet upgrading. Three projects will be commenced, with the aim of achieving a significant upgrading of the freight wagon fleet. Priority will be given to the air brakeconversion of an additional 534 oil tanker wagons and to the conversion of an additional5,850 wagons of various types to roller bearings. Further, as 83 per cent of the existingfleet consists of low payload capacity 4 wheel wagons, the Pakistan Railways plans tointroduce 700 new bogie wagons of efficient design, at an estimated cost of US$ 75.38million.
(o) RECO Emergency Investment Plan. In preparation for the first open track access contracts with private Rail Equipment Companies (RECO=s) for the movement of petroleum products from Karachi into the hinterland, it is proposed to undertake further track renewal, signalling improvement and yard capacity expansion on Links Pk.1, Pk.3 and part of Pk.4, at an estimated cost of US$ 58.4 million. These improvements are expected to benefit these TAR links, by reducing the need for imposition of temporaryspeed restrictions owing to poor track and bridge condition.
9.1.7 Sri Lanka
Future developmental works are expected to be concentrated on the restoration of the 106 km long line section from Medawachchiya to Talaimannar Pier on TAR Link Sl.2. This section
138

was completely destroyed during the period of insurgency in northern Sri Lanka. In addition, provision of container transhipment facilities at Talaimannar will be necessary. The estimated total cost of these works is US$ 40 million. A continuation of the insurgency problems will in all probability prevent a start on the necessary works before 2000.
9.1.8 Thailand
It is likely that substantial rehabilitation will be required on the Kanchanaburi-Nam Toksection of Link Th.1, in order to strengthen the track for freight operations. This section contains several timber trestle bridges, which are unlikely to be able to withstand the track loadings under sustained freight operation. However, no estimate of the likely nature, scale and cost of thenecessary rehabilitation works has yet been undertaken.
The current forward works plan of the State Railway of Thailand allows for track duplication on the 28 km section between Talingchan Junction and Nakhon Pathom on TAR Link Th.1, with the objective of relieving traffic congestion on this section which is also heavily used for Bangkok rail commuter services and for long distance rail services on the main South trunk line.The estimated cost of this project is approximately US$ 74 million (US$ 2.6 million per kilometre). The proposed rehabilitation of 18 km of main line track between Bang Sue andTalingchan as part of a system-wide Track Rehabilitation programme being financed by the Japanese Government is also expected to contribute significantly to the expansion of linecapacity on Link Th.1. This latter project involves replacement of life expired 70 lb rail laid ontimber sleepers with new 100 lb rail laid on concrete sleepers, together with formation improvements and ballast augmentation and is estimated to cost approximately US$ 20.2 million(or US$ 1.1 million per km).
9.1.9 Turkey
Several large system modernization projects are planned for implementation within thenear future by the Turkish State Railways. Most of these projects can be expected to have amajor impact on the future development and operational enhancement of the TAR network in Turkey. Projects of significance to the TAR network (listed in the priority order in which theyappear in the Turkish plans) include:
(a) New line construction between Kars and Aktas. This new line of 92 km length forms themajor part of a 124 km rail connection between Kars, located on TAR Link Tk.2, and the Georgian capital of Tbilisi. Connection of the railway networks of these two countries will facilitate railway transportation between Europe, the Caucusus, and the countries of Central Asia, by the shortest route. The proposal is for construction of an electrified , single track railway through mountainous terrain to the border with Georgia at Aktas. Thecost of the Turkish portion of this project has been estimated at US$ 400 million (or US$4.3 million per km). Tenders for the project closed in April 1998 and the bids are nowunder evaluation. Construction time has been estimated at 4 years and it is expected that the project would commence during 1999.
(b) Electrification, re-signalling and rehabilitation of the 578 km long Kars-Dívrí í railway line. This project has been proposed in parallel with the Kars-Aktas project, to provide matchingcapacity on the remainder of TAR Link Tk.2 to accommodate the 8 million tonnes perannum of transit freight traffic forecast to be generated by the latter. Completion of thisproject is expected to result in a 50% increase in line capacity on this section. Theestimated cost of the project is US$ 160 million (or approximately US$ 277,000 per km) and construction time has also been estimated at four years.
139
(c) Construction of Balli ih-Yozgat-Yildizelí railway line. This electrified line of 306 km length would provide a shortcut alternative to the existing 488 km Ankara-Kayserí-Sivas section

on TAR Link Tk.1 and eliminate what is at present a major bottleneck on the primary transcontinental route to Europe. The construction cost of the new line has been estimated at US$ 950 million (or US$ 3.10 million per km).
(d) Rehabilitation of the 567 km Ankara-Istanbul line. This project has been proposed primarily to halve the running times of passenger trains between Ankara and Gebze by realigning the sections containing the sharpest curves in order to accommodate maximum passenger speeds of 200 km per hour. The project should also permit an increase infreight train speeds (and hence in line capacity) on what is a busy section of TAR LinkTk.1. Its construction has been estimated at US$ 237 million (or US$ 418,000 per km).
(e) Construction of the Bosphorus Strait tunnel crossing. The 4.5 km ferry crossing of Bosphorus Strait between Haydarpasa Station on the Anatolian side and Sirkeci Station on the European side undoubtedly creates delays which are disproportionate to its length, given that two hours are required to marshal and re-marshal trains either side of the strait.A tunnel crossing of the strait has been mooted for many years, but the scale of the works and associated costs has been considered prohibitive by successive governments. Thelatest cost estimate for a twin track tunnel and associated above ground connecting lines of 13.3 km length is US$ 766 million (or US$ 57.6 million per kilometre). At the time ofwriting, the project was under study for syndicated funding by the private sector.
(f) Construction of the Lake Van northern by-pass line. With the proposed Bosphorus Tunnel, completion of a new line of 237 km length around the northern side of Lake Van would provide a continuous TAR rail route within Turkey (along Link Tk.1). The current ferry crossing of Lake Van typically imposes delays to through trains of up to 9 hours (5 hours for the ferry trip and 2 hours at either side of the lake for trainassembly/disassembly). When the number of rail vehicles arriving at the ferry terminals exceeds 80 (the number which can be accommodated on the ferry deck), goods are sent by road. The cost of this project has been estimated at US$ 500 million (or US$ 2.1 millionper km) and the time needed for construction has been estimated at 5 years.
Not included in the existing development plans of the Turkish Railways are projects designed to relieve capacity shortages on Link Tk.1 between Malatya and Bostankaya (where capacity utilization currently stands at 94-103 per cent), on Links Tk.3 and Tk.4 (where capacityutilization is also now about 94-103 per cent) and on Link Tk.5 where the current train density absorbs about 93 per cent of capacity.
(g) Construction of a 419-km long new line from Cetinkaya to Iskenderun. This project for which a feasibility study is currently in progress aims to overcome the capacity problems onthe existing Divrigi-Iskenderun electrified line. The project would have beneficial effects on the capacity of Links Tk.1, Tk.3 and Tk.4.
(h) Electrification and Signalling Project on the Mersin-Adana-Toprakkale section. In addition to the above-mentioned new line, capacity on Link Tk.4 will also benefit by this projectwhich has already been included in the investment plans of the Turkish State Railways for which a feasibility study is in progress.
(i) Development of intermodal operations. With a view to accompanying the recent growth in container throughputs in Turkish ports, especially Haydarpasa and Mersin which are bothlocated on TAR corridors, the Turkish State Railways has developed plans to increase thenumber of rail-carried containers from the ports to hinterland places in the country as wellas to destinations in Central Asia. The plans include the development of several InlandContainer Terminals, especially in Ankara and Kayseri, both on Link Tk.1.
140

(j) Operational Management Information System (OMIS). In order to reduce operating costsand offer better real-time information to customers, the Turkish State Railways is developing the OMIS project aimed at tracking train movements via a computerized systemincluding components for train-scheduling and rolling-stock maintenance.
141

10. TRANSPORT FACILITATION ISSUES
This chapter reviews the arrangements currently in place and required in future in order to minimize delays and to facilitate a smoother flow of international rail traffic across nationalborders within the southern corridor of the Trans-Asian Railway.
It is a valid observation, frequently made, that an absence of adequate and harmonizedadministrative arrangements governing the passage of traffic across borders has sometimes frustrated the efforts of some railway organizations of the region to develop international container traffic despite their often heavy investments in handling equipment and servicingfacilities at borders.
The three main types of delay which can interfere with the smooth flow of border crossing railway traffic are:
$ Delays due to customs and security control procedures;$ Delays due to the necessity to tranship freight and containers or to exchange wagon
bogies at border beak-of-gauge stations; and$ Delays due to railway operational procedures, such as train inspection, brake testing,
checking of wagons and their equipment, recording of wagon and consignment details,etc;
The delay to trains at borders can often be much greater than en-route operational delays,and unless the relevant arrangements between neighbouring countries and railway systems can contribute to the minimization, rather than to the prolongation, of these delays, there is littlehope that railways can offer the transit time performance which freight, and especially container, customers require before directing their business to rail.
Administrative rules governing border crossing traffic can operate at three different levels.At the top level, neighbouring countries can be signatories to multilateral agreements andinternational conventions which guarantee observance of standard procedures for customs clearance and movement of freight consignments across borders. At the middle level, theseprocedures can be embodied in bilateral agreements between neighbouring governments. Finally, at the level of individual railway organizations, there can be arrangements betweenneighbouring railways for their joint operation of border stations and associated facilities, for the exchange of rolling stock, and for the sharing of costs, revenues and liabilities associated withborder crossing rail vehicles and freight consignments. It is essential that neighbouring countriesoperate at each of these levels and further that agreements concluded at each level work tosupport the operation of agreements concluded at every other level.
10.1 Current status of administrative arrangements for border crossing rail traffic within the countries of the TAR Southern Corridor
Within the TAR southern corridor freight vehicles currently cross 10 borders, not includingthe border between Turkey and Bulgaria. Six of these borders (India/Bangladesh, Bangladesh/India, India/Pakistan, Pakistan/Islamic Republic of Iran, Turkmenistan/Islamic Republic of Iran, and Islamic Republic of Iran/Turkey) are open for railway traffic. Owing topolitical factors and to the failure of the relevant governments to agree on satisfactory administrative procedures, none of these borders is realizing anything like its full railway traffic
142

potential. This is a situation which can and must change if the TAR network is to become aneffective conduit for intra and inter-regional trade.
The current status of agreements governing transport operations across each of theseborders is reviewed below.
10.1.1 International transit agreements and conventions
Since 1992, ESCAP has had an active role in demonstrating the benefits of accession by thecountries of the region to seven international transit conventions. The main vehicle for ESCAP=srole is Resolution 48/11 of the 48th Commission Session held in Beijing in April 1992. The seven international conventions covered by Resolution 48/11 are listed in Table 10.1, which also indicates the status of each country with respect to accession.
Of the seven conventions, two are of relevance to rail transit. These are the CustomsConvention on Containers (1972) and the International Convention on the Harmonization of Frontier Control of Goods (1982). Both of these conventions are of great potential benefit tosignatory nations, since they codify rules for rapid customs inspection of containers at landborders. The principal feature of these rules is that they confine border customs formalities to a quick inspection of container seals and of documentation (only for the purpose of establishingthat they are intact and complete). If adopted and put into effect by the countries of the region,they are likely to result in a marked reduction in border crossing delays and dwell time, which can only serve to benefit rail freight customers.
Of the countries within the TAR Southern Corridor, only China has so far been a party to the relevant conventions, and then only to one - the Customs Convention on Containers.
Related to the issue of international transit conventions and agreements are the workshops on land transport facilitation being conducted by ESCAP at the subregional and national level. Flowing from these workshops is a key resolution for the participating countries to establishNational Transport Facilitation Committees, on which the railway, highways, customs, andborder control agencies as well as the major trade/shipping associations of the country arerepresented. The primary objective of these committees will be to liaise with governments concerning any desired legislative changes in relation to land transport facilitation.
10.1.2 International rail transit agreements
Many countries in Europe and some in Asia (for example, the Islamic Republic of Iran) are parties to the Convention Concerning the International Transport of Goods by Rail (COTIF), Berne 1980, which replaces the traditional national customs document with the International Consignment Note (CIM) established under COTIF. However, the member countries of the Organization for Railways Cooperation (OSShD), including such countries as China, the Democratic People=s Republic of Korea, Kazakhstan, Mongolia, the Russian Federation and Viet Nam, have developed and are using the system known as the Agreement on International Railway Freight Communications (SGMS) for the same purpose.
A draft ECE convention on international customs transit procedures for the carriage of goods by rail has been developed and is being finalized in consultation with OSShD and otherinterested organizations in order to harmonize the approach to customs requirements. Once the convention is finalized, Asian countries should consider becoming a party to it.
143
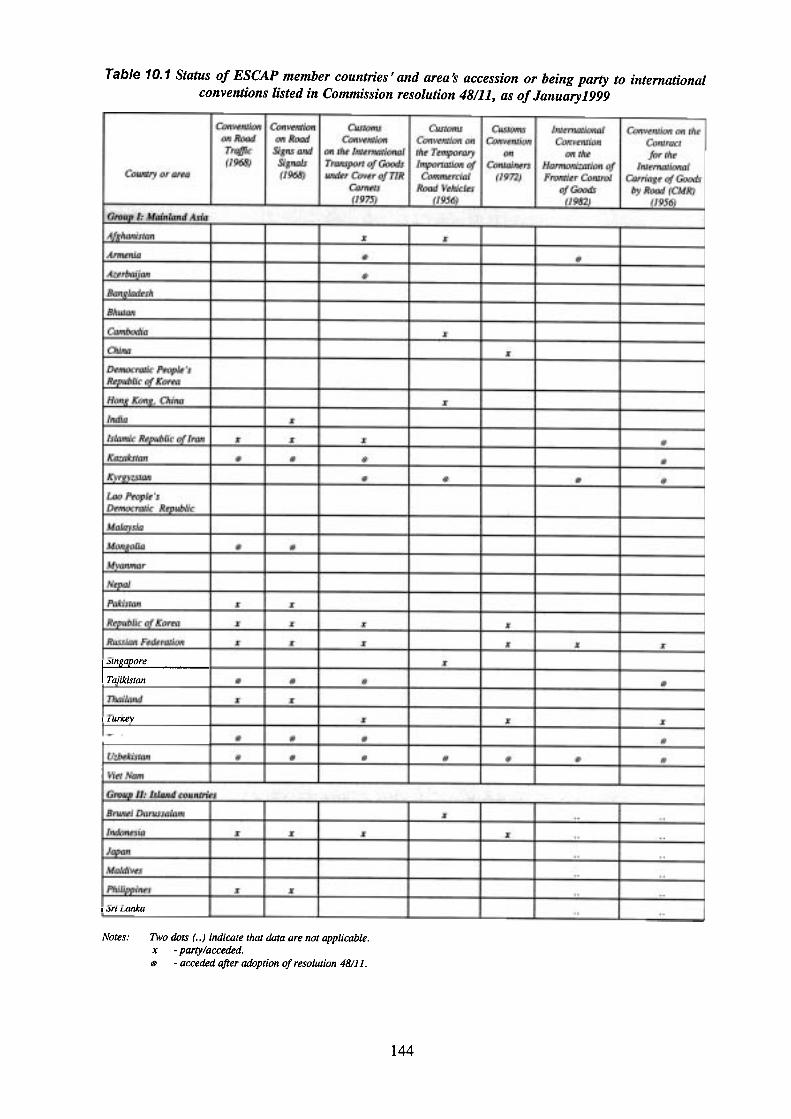


Table 10.3: Border trade agreements between Myanmar and neighbouringcountries
Border between Approved bordercheckpoint (s)
Border TradeAgreementconcluded (date)
Applicabletransportmodes
Estimated bordercrossing freightvolume, 1997/98(tonnes) 1
Myanmar/China Mu-se, RuiliBhamo, JayhokKyukok,Wandingzhen
}} August 1994}
RoadRoad, IWTRoad
}} 568,000}
Myanmar/Thailand Tachilek, Mae Sai Myawaddy, Mae SotKawthaung, Ranong
}} March 1996}
RoadRoadIWT
}} 80,000 }
Myanmar/India Tamu, Mori January 1994 Road 28,000
Myanmar/Bangladesh Maungdaw, Teknaf May 1994 IWT 12,000
Source: Border Trade Department, Myanmar
Notes: 1. Estimates of border crossing freight volumes were based on data supplied in respect ofthe number of loaded road vehicles and boats crossing the indicated borders. For the purposes of conversion, average payloads of 6.2 tonnes per loaded road vehicle and 20tonnes per loaded boat were assumed.
10.2 Resolving the deficiencies of current border crossing procedures
It has become apparent that the operation of some of the bilateral border agreements listed in Table 10.2 far from encouraging increased flows of goods and vehicles across national borders, actually works against increased efficiency inthe application of border controls and as a result discourages increased border crossing traffic. It is more likely to be the case that the problem lies in the manner in which the agreements are interpreted and applied than in any deficiencies in theagreements themselves. In some cases, it is also true that discord at the political level almost renders inoperable the bilateral agreements between neighbouringcountries. In such cases, it would be unrealistic to expect any substantialimprovement in border processes until there was first a marked improvement ingovernment to government relations.
Nevertheless, there are a number of serious impediments to increasedutilization of the existing TAR links for international freight (and especiallycontainer) traffic which must be addressed in the context of the need to improveboth the content and application of bilateral rail agreements. These impedimentsare described in the following sub-sections.
10.2.1 Excessive border crossing delays
Excessive border dwell times have been reported in respect of some of the national borders within the TAR Southern Corridor.
149

For example, the average wagon cycle time between Lahore (Pakistan) and Amritsar (India), only 61 km apart, is as much as 5-6 days when the rail traffic interchange rules inforce between these two countries allow only 30 hours free time at Attari and Lahore forunloading and customs inspection. Thus, a wagon crossing this border is detained onaverage for between 2-3 days, when strict observance of the rules would suggest that it should be detained for no longer than one and a quarter days. Such a border crossing performance is clearly incompatible with an objective of increasing the volume of border crossing trade between the two countries. The inadequacy of terminal capacity at Lahore is among the reasons which have been advanced for this poor performance, but it is probablethat it may also be explained by factors internal to the bilateral agreement, such as the specified level of wagon detention charges applicable when the number of wagons of onesystem on the territory of the other is imbalanced (see Section 10.2.2 for further details).
Excessive border dwell times have also been reported in respect of theIndia/Bangladesh border at Gede/Darsana, with the average being of the order of two days.By contrast, between the Islamic Republic of Iran and Turkey which also share a commontrack gauge, the average border dwell time is reported as only two hours! It is perhapsinstructive to identify the factors which have been responsible for the Islamic Republic ofIran and Turkey reaching agreement on border inspection procedures which minimize thedetention of wagons engaged in bilateral or transit trade.
10.2.2 Operational inefficiencies
In some cases, bilateral agreements embody rules which could lead to operational inefficiencies. An example of such a rule is the requirement in the India-Pakistan bilateralrail interchange agreement for both sides to achieve a Azero balance@ in their exchange of wagons at the end of each ten day accounting period. In practice, this means that the number of wagons of each system on the territory of the other should be exactly equal at the end of each accounting period, even when there is directional imbalance in the freight tonnages moving between the two countries. Failure to meet the zero balance requirementwill involve the system with a surplus of foreign wagons on its territory making hirepayments to the other system, and if the surplus exceeds a specified maximum number,these hire charges will be payable at penalty rates 10 per cent above normal rates.However, depending upon the level of these charges, it may pay one of the railway systemsto detain wagons owned by the other system and to pay punitive hire charges on them until it has accumulated sufficient loading to be able to despatch them loaded to the owningsystem. This could result in significantly longer wagon cycle times, poorer wagon utilizationand customer alienation. Alternatively, if wagon hire charges are set at too high a level, thesystem with a surplus of foreign wagons on its territory will have a strong incentive to return those wagons, whether empty or loaded, immediately to the owning system, possiblyleading to increased empty haulage and reduced wagon earnings.
Another example of operational inefficiencies happens in the cross-border exchange ofwagons between India and Bangladesh with lengthy detention of Indian wagons on the Bangladeshi side of the border.
10.2.3 Tariff setting inefficiencies
150
A majority of the bilateral rail agreements in force within the TAR Southern Corridor specify that each rail system shall apply its own tariff rates up to the border with theneighbouring country. This results in the application of an additive, non-competitive tariff toa consignment=s journey from origin to ultimate destination, when competing transport

operators (especially road operators) have total flexibility to price their traffic over the entirejourney between origin and destination in accordance with prevailing market conditions.Invariably these competitors will apply a sliding scale tariff with unit rates reducing proportionately to increasing distance over the entire journey. By comparison, since separate rail tariffs will be applied on each participating system=s own territory, rail unitcharges will be permitted to reduce over much shorter distances and for the completejourney will be considerably higher than those of rail=s competitors.
10.2.4 Railway adoption of EDI systems
The adoption of systems for the interchange of customs and trade documentation and data by electronic means (EDI) is one area where the railway organizations lag behind their competitors, particularly ship operators. The ability for consignees and customs authoritiesat borders to have access to vital customs and trade documentation and consignmentstatus/location data well in advance of the arrival of consignments at borders or at ultimate destinations can only serve to reduce delays in the transportation chain, particularly if theEDI systems adopted are linked to wagon tracking systems of the type developed by UNCTAD and now being implemented in Bangladesh.
151