Embed Size (px)
Citation preview

Trajectories Simplification Method for Location-Based Social Networking Services
Presenter: Yu Zheng
on behalf of Yukun Cheng, Kai Jiang, Xing Xie
Microsoft Research Asia
March 16, 2009

Background
2
GPS devices enable us to record our location history with GPS trajectories
Location-based social networking services using web mapsBikely, GeoLife,
Sharing life experiences with GPS trajectories
Many GPS trajectories are too dense to be displayedCost lots of hardware resource.
Make an application very slow
IE browser could crash
It is not necessary to show so many details to users
Motivation
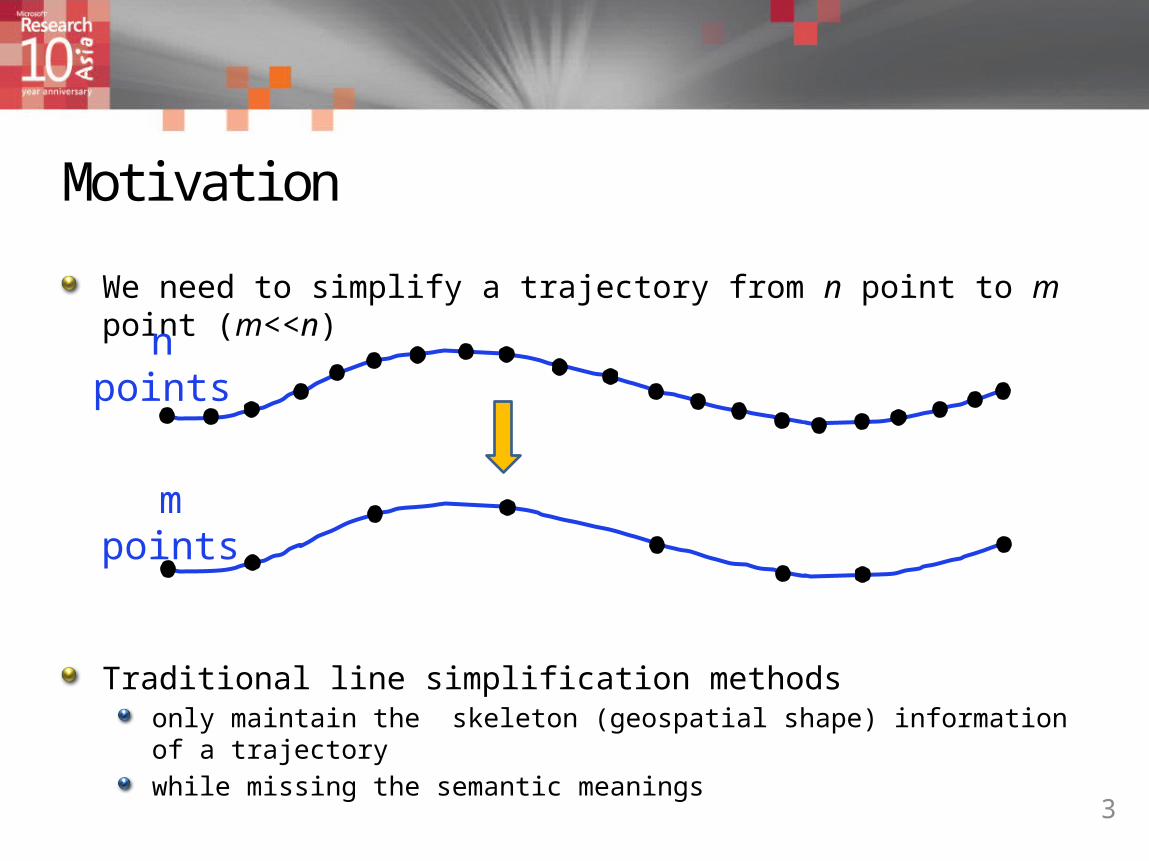
We need to simplify a trajectory from n point to m point (m<<n)
Traditional line simplification methodsonly maintain the skeleton (geospatial shape) information of a trajectory while missing the semantic meanings
3
n points
m points

4
c) overallb) walking detail 1a) walking detail 2
• A travel route consists of 10,000+ points• contains one driving segment and one walking segment

5
b) walking detail 1 c) overalla) walking detail 2 d) driving
A result returned by the DP algorithm
a) walking detail 2 c) overallb) walking detail 1 d) driving
A result returned by our method

Our Goal
TS algorithm: Simplify a trajectory with N points to a m-point oneWhile maintain not only the skeleton informationBut also the semantic meanings for trajectory sharing
6
Framework of TS
Partition a trajectory into some segmentsAssign the headcount of points to each segmentRank the points in a segment according to some factorsRetrieve the high-rank points from each segment and formulate a simplified a trajectory
7

Preliminaries
Distance between a point and its nearest neighbors
Heading direction of a point
Heading change of a point
8
p2.hp3.h
p2
p3.Θp1 p4 p5
d1
d2
a)
p3
p2
p3.Θp1 p4 p5
b)
p3
p2.Θ
p4.Θ
𝑝𝑖.𝑑= 𝐷𝑖𝑠𝑡𝑎𝑛𝑐𝑒ሺ𝑝𝑖−1,𝑝𝑖ሻ+ 𝐷𝑖𝑠𝑡𝑎𝑛𝑐𝑒(𝑝𝑖,𝑝𝑖+1)
𝜃 = 𝑝𝑖.ℎ− 𝑝𝑖−1.ℎ
𝜃 = 𝑝𝑖.ℎ− 𝑝𝑖−1.ℎ

1. Trajectory Segmentation
See our WWW2008 publication for details
9
WalkBus
Certain Segment
Denotes a non-walk Point: P.V>Vt or P.a>atDenotes a possible walk point: P.V<Vt and P.a<at
(b)
(c)
Backward ForwardCar
(a)
Certain Segment3 Uncertain Segments
Car

2. Assign Points to a Segment
The weight of a segment depends on The length of a segment
The average heading change
10
𝑆.𝑑 = 𝐷𝑖𝑠𝑡𝑎𝑛𝑐𝑒(𝑝𝑘,𝑝𝑘−1)𝑗𝑘=𝑖+1
𝑆.𝛼= ( |𝑝𝑘.𝑗𝑘=𝑖 𝜃|) / (𝑗− 𝑖 + 1)
𝑆.𝑤= 𝑆.𝑑∗ 𝑆.𝛼
,
3. Ranking Points in a Segment
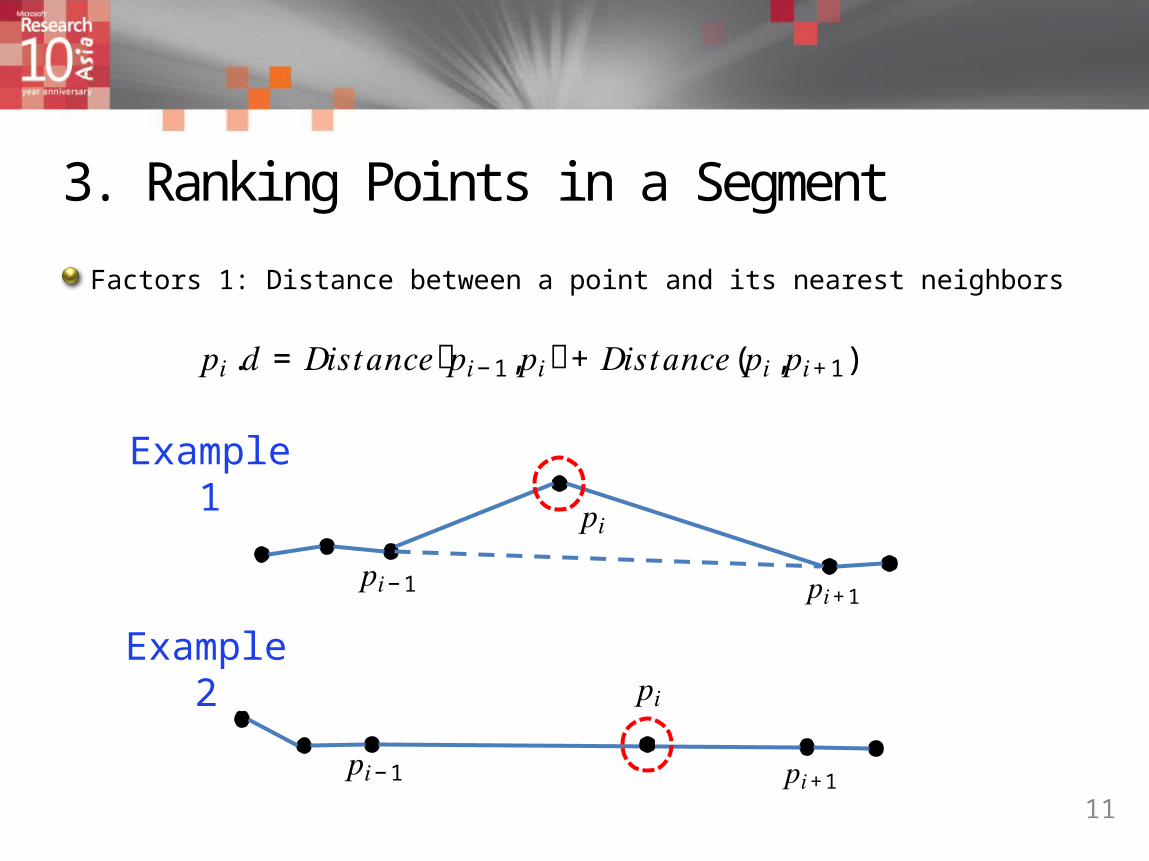
Factors 1: Distance between a point and its nearest neighbors
11
𝑝𝑖.𝑑= 𝐷𝑖𝑠𝑡𝑎𝑛𝑐𝑒ሺ𝑝𝑖−1,𝑝𝑖ሻ+ 𝐷𝑖𝑠𝑡𝑎𝑛𝑐𝑒(𝑝𝑖,𝑝𝑖+1)
Example 1
𝑝𝑖−1
𝑝𝑖−1
𝑝𝑖+1
Example 2
𝑝𝑖−1
𝑝𝑖−1
𝑝𝑖+1
3. Ranking Points in a Segment
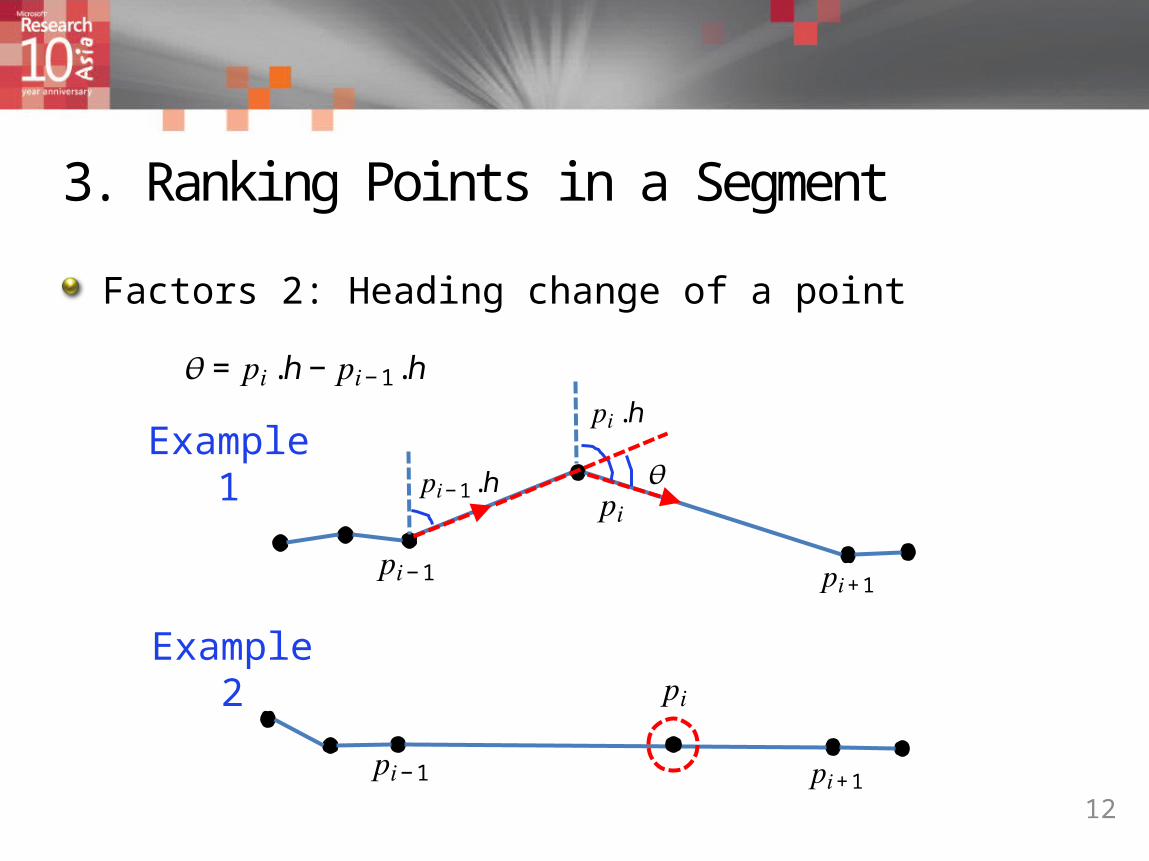
Factors 2: Heading change of a point
12
𝜃 = 𝑝𝑖.ℎ− 𝑝𝑖−1.ℎ
Example 1
𝑝𝑖−1
𝑝𝑖−1
𝑝𝑖+1
𝜃 = 𝑝𝑖.ℎ− 𝑝𝑖−1.ℎ
𝜃 = 𝑝𝑖.ℎ− 𝑝𝑖−1.ℎ
𝜃 = 𝑝𝑖.ℎ− 𝑝𝑖−1.ℎ
Example 2
𝑝𝑖−1
𝑝𝑖−1
𝑝𝑖+1

3. Ranking Points in a Segment
Factors 3: Accumulated Heading Change
13
𝑝𝑖.𝛽 = 𝑝𝑘.𝜃𝑖+𝜏𝑘=𝑖−𝜏

Factors Determine the Weigth of a Point
Distance between a point and its nearest neighbors
Heading change of a point
Accumulated Heading Change
14
p2.hp3.h
p2
p3.Θp1 p4 p5
d1
d2
a)
p3
p2
p3.Θp1 p4 p5
b)
p3
p2.Θ
p4.Θ
𝑝𝑖.𝑑= 𝐷𝑖𝑠𝑡𝑎𝑛𝑐𝑒ሺ𝑝𝑖−1,𝑝𝑖ሻ+ 𝐷𝑖𝑠𝑡𝑎𝑛𝑐𝑒(𝑝𝑖,𝑝𝑖+1)
𝜃 = 𝑝𝑖.ℎ− 𝑝𝑖−1.ℎ
𝑝𝑖.𝛽 = 𝑝𝑘.𝜃𝑖+𝜏𝑘=𝑖−𝜏
𝑝.𝑤= 𝑝.𝑑∗(ȁ"𝑝.𝜃ȁ"+ ȁ"𝑝.𝛽ȁ")
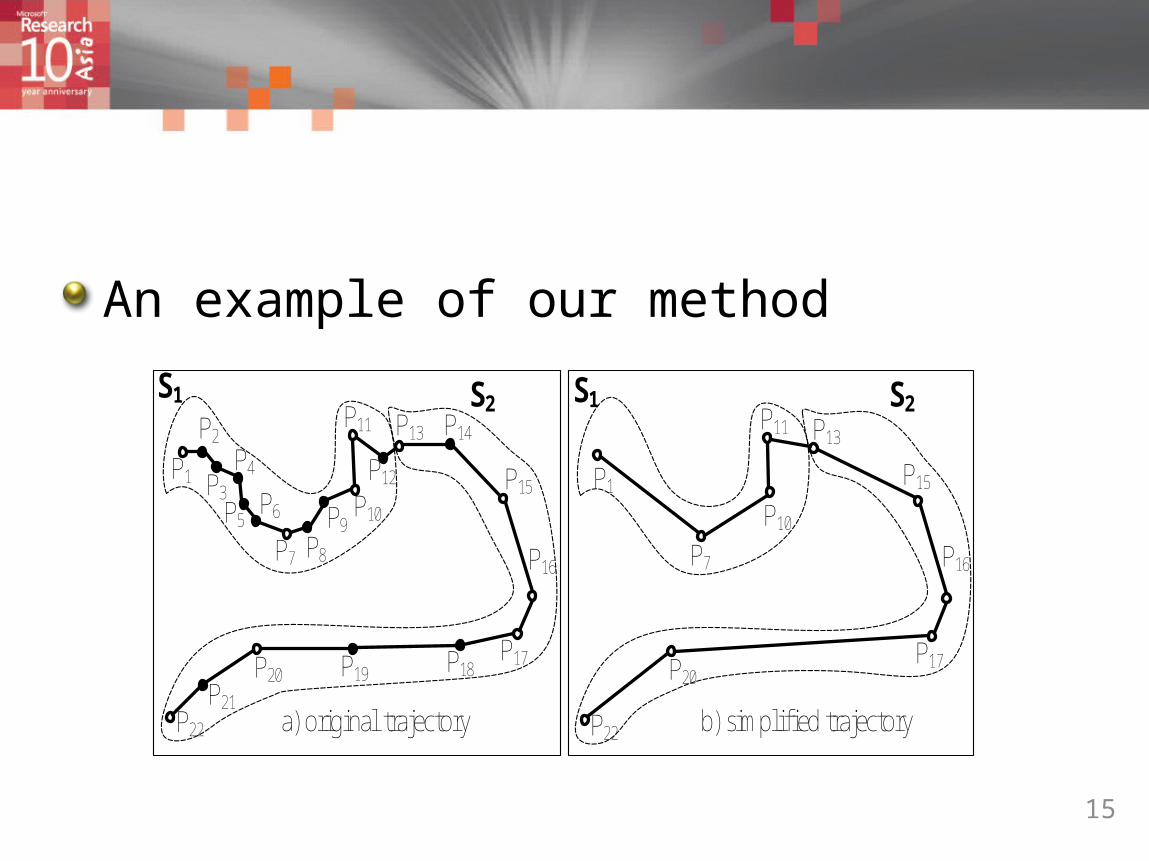
An example of our method
15
S1 S2
P1
P2
P3
P4
P5
P7
P6
P8
P9P10
P11
P12
P13 P14
P15
P16
P17P19 P18P20P21
P22
S1 S2
P1
P7
P10
P11 P13
P15
P16
P17P20
P22a) original trajectory b) simplified trajectory

Experiments
GPS trajectory data335 travel routes generated by 65 usersThe distance of each trajectory is over 5kmOn average each trajectory
has 2,100+ points, a distance of 63 km and a 4-hour time span
16

Evaluation on EffectivenessAverage normalized perpendicular:
Calculate the perpendicular distance of each point to the simplified resultsCompute the root mean square value of these perpendicular distance
17
a f
ec
bPerpendicular distance from point c to line ab
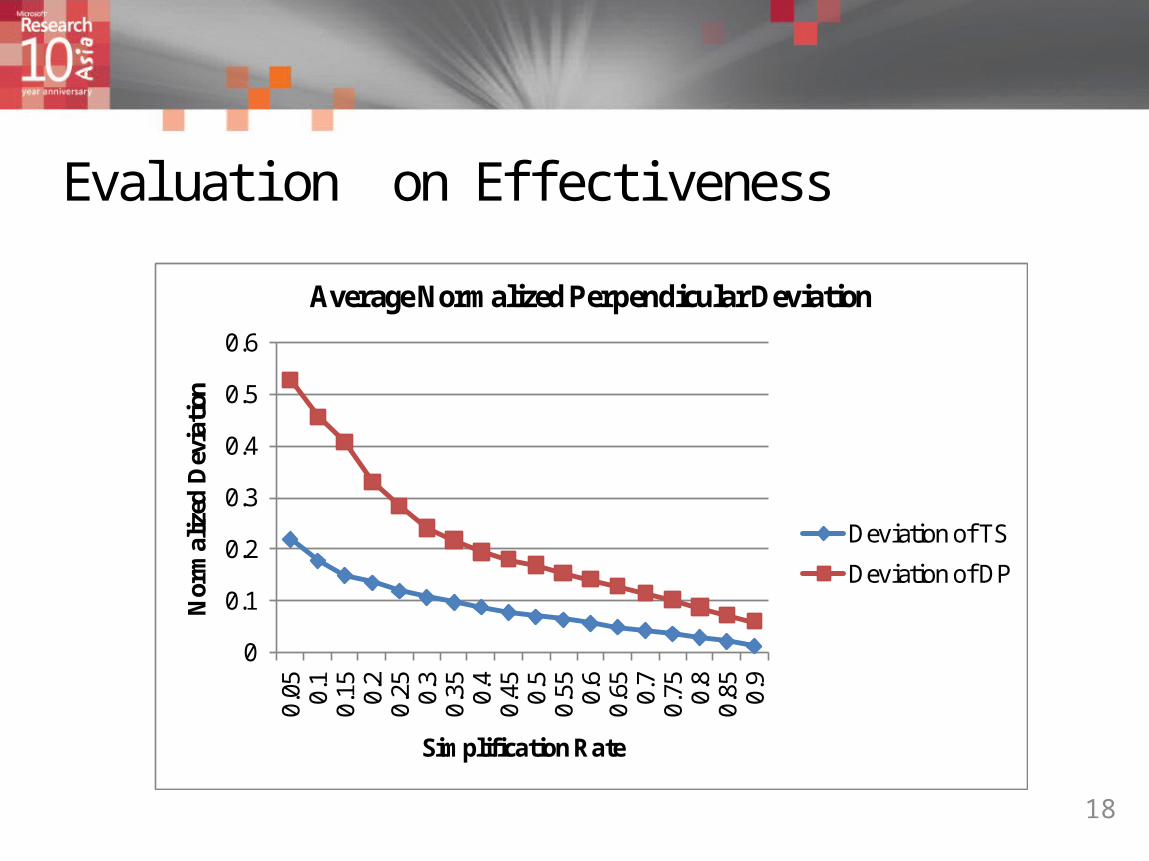
Evaluation on Effectiveness
18
0
0.1
0.2
0.3
0.4
0.5
0.6
0.05 0.
10.
15 0.2
0.25 0.
30.
35 0.4
0.45 0.
50.
55 0.6
0.65 0.
70.
75 0.8
0.85 0.
9
Nor
mal
ized
Dev
iati
on
Simplification Rate
Average Normalized Perpendicular Deviation
Deviation of TS
Deviation of DP

Evaluation on Effectiveness
19
0
0.2
0.4
0.6
0.8
1
1.2
0.05 0.
10.
15 0.2
0.25 0.
30.
35 0.4
0.45 0.
50.
55 0.6
0.65 0.
70.
75 0.8
0.85 0.
9
Cor
rect
Rat
e
Simplification Rate
Correct Rate for TS and DP
Correct rate of TS
Correct rate of DP
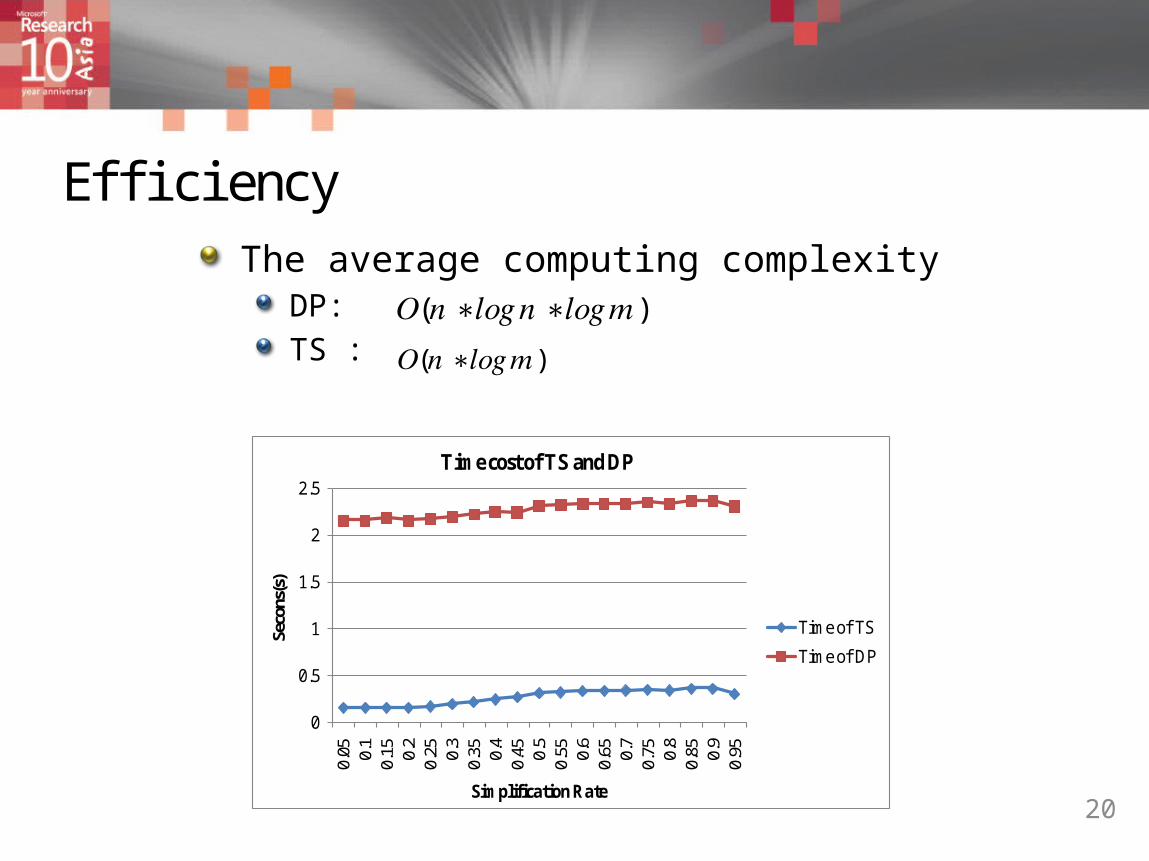
EfficiencyThe average computing complexity
DP:TS :
20
0
0.5
1
1.5
2
2.5
0.05 0.
10.
15 0.2
0.25 0.
30.
35 0.4
0.45 0.
50.
55 0.6
0.65 0.
70.
75 0.8
0.85 0.
90.
95
Seco
ns(s
)
Simplification Rate
Time cost of TS and DP
Time of TS
Time of DP
𝑂(𝑛∗𝑙𝑜𝑔𝑛∗𝑙𝑜𝑔𝑚) 𝑂(𝑛∗𝑙𝑜𝑔𝑚)
Conclusion & Future work
ConclusionTS care not only the skeleton information but also the semantic meanings of travel (user behaviors)TS is more effective than DP in simplifying travel routesTS is also more efficient than DP
Future workDynamic simplification:
display the top k points in present viewCost lots of online computation
21