Embed Size (px)
Citation preview

Training Manual for Capacity Building of Assam Forest Department on Carbon Stock Assessment of Forests
Prepared for Assam Forest Department
Implemented by: On Behalf of:

Training Manual for Capacity Building of Assam Forest Department on Carbon Stock Assessment of Forests
Prepared for Assam Forest Department
Training Manual for Capacity Building of Assam Forest Dept. on Carbon Stock Assessment of Forests 2
Published by
Deutsche Gesellschaft für Internationale Zusammenarbeit (GIZ) GmbH
Registered Offices: Bonn and Eschborn, Germany
GIZ India A-2/18, Safdarjung Enclave, New Delhi 110029 India T: +91-11-49495353 E: [email protected] I: http://www.giz.de
Responsible
Dr. Ashish Chaturvedi, Project Director (GIZ) E: [email protected]
Project Team Members
GIZ Dr Ashish Chaturvedi, Mr Kundan Burnwal
TERI Mr Anirudh Sharma, Ms Aparna Tyagi, Mr B.S. Negi, Dr J.V. Sharma, Mr Kapil Kumar, Mr Krishna Kumar, Mr Nishant Jain, Ms Priyanka Tiwari, Dr Syed Arif Wali, Dr Yogesh Gokhale
Consultant Dr P.K. Joshi
For More Information, Contact:
The Energy & Resources Institute Darbari Seth Block, IHC Complex, Lodhi Road New Delhi 110003 India Tel: +91-11-24682100 / 24682111 Fax: +91-11-24682144 / 24682145 E-mail: [email protected] Web: www.teriin.org
Deutsche Gesellschaft fur Internationale Zusammenarbeit (GIZ) GmbH India A 2/18, Safdarjung Enclave, New Delhi 110029 India E-mail: [email protected] Tel: +91-11-49495353 Fax: +91-11-49495391 Web: www.giz.de
Cover Photographs
TERI
Project Partners
(April 2019)
Disclaimer All information/data contained herein is obtained from authentic sources believed to be accurate and reliable. Reasonable skill, care and diligence have been exercised in manual preparation. It is prepared solely for Deutsche Gesellschaft für Internationale Zusammenarbeit (GIZ) GmbH and its knowledge partners, and should not be used, circulated, quoted, or otherwise referred to for any other purpose, nor included or referred to in whole or in part in any document, without prior written consent.
Training Manual for Capacity Building of Assam Forest Dept. on Carbon Stock Assessment of Forests 3
Table of Contents
Acronyms & Abbreviations ........................................................................................................... 7
Units of Measurement ................................................................................................................... 8
Purpose of the Manual .................................................................................................................. 9
Chapter 1. Introduction .............................................................................................................. 10 Forests of Assam ....................................................................................................................... 10 Status of Growing Stock and Carbon Stock .............................................................................. 12
Chapter 2. Forest Carbon Assessment ......................................................................................... 13 Importance ............................................................................................................................... 13 Eligible Carbon Pools ............................................................................................................... 13 Process of Forest Carbon Assessment ........................................................................................ 14
Chapter 3. Geospatial Tools for Mapping of Project Boundary for Carbon Assessment ............. 16 Remote Sensing ........................................................................................................................ 16 Remote Sensing Process ............................................................................................................ 17 Resolutions in Remote Sensing ................................................................................................. 18 Geographical Information System (GIS) ................................................................................... 18 Global Position System (GPS) .................................................................................................. 19 Mapping of Project Boundary ................................................................................................... 20 Ground Truthing ...................................................................................................................... 22
Chapter 4. Sampling Plan ........................................................................................................... 23 Stratification ............................................................................................................................. 23 Shape and Size of Sample Plots ................................................................................................. 24 Sample Plot Allocations ............................................................................................................ 25 Estimating number of sample plots ........................................................................................... 25
Chapter 5. Field Measurements ................................................................................................... 28 Equipment and Materials Used for Field Measurement ........................................................... 28 Laying Out of Permanent Sample Plots .................................................................................... 29 Measurement of Above Ground Biomass .................................................................................. 30 Measurement of tree diameter or girth and height .................................................................... 30 Measurement of tree height ...................................................................................................... 32 Estimation of Below Ground Biomass ...................................................................................... 35 Measurement of Bamboo .......................................................................................................... 35 Clump forming bamboo ........................................................................................................... 35

Training Manual for Capacity Building of Assam Forest Dept. on Carbon Stock Assessment of Forests 4
Non-clump forming bamboo .................................................................................................... 36 Measurement of Dead Wood .................................................................................................... 37 Measurement of Litter .............................................................................................................. 37 Measurement of Soil Organic Carbon ....................................................................................... 38
Chapter 6. Data Analysis ............................................................................................................. 39 Above Ground Biomass ............................................................................................................ 39 Below Ground Biomass ............................................................................................................ 39 Dead Wood .............................................................................................................................. 40 Litter ......................................................................................................................................... 40 Soil Organic Carbon ................................................................................................................. 40 Total Carbon Stock Density ..................................................................................................... 41
Bibliography ............................................................................................................................... 42
Glossary ...................................................................................................................................... 44
Annexure I. Allometric Volume Equations and Wood Density of Dominant Tree Species in Assam ...................................................................................................................................... 46
Annexure II. Steps for Delineation of Project Boundaries .......................................................... 54
Annexure III. Formats for Data Collection .................................................................................. 57
Annexure IV. Applications of Biomass Assessment & Steps to Prepare a Project Design Document ................................................................................................................................... 61
Compliance Market & Voluntary Carbon Market .................................................................... 61 Application of Biomass Assessment ........................................................................................... 61 Steps involved for Project Document Design preparation ......................................................... 61

Training Manual for Capacity Building of Assam Forest Dept. on Carbon Stock Assessment of Forests 5
List of Tables Table 1.1 Forest Classification ....................................................................................................... 10
Table 1.2 Protected Areas of Assam ............................................................................................... 11
Table 1.3 Status of Growing Stock in Assam ................................................................................. 12
Table 1.4 Status of Carbon Stock in different pools of carbon pools in Assam ............................... 12
Table 2.1 Different Pools of Carbon ............................................................................................. 14
Table 3.1 Brief History of Remote Sensing .................................................................................... 16
Table 4.1 Stratification based on Canopy cover ............................................................................. 24
Table 5.1 List of instruments and materials to be used during forest carbon measurement ............ 28
Training Manual for Capacity Building of Assam Forest Dept. on Carbon Stock Assessment of Forests 6
List of Figures Figure 1.1 Forest Map Of Assam ................................................................................................... 10
Figure 1.2 Forest Cover Of Assam ................................................................................................. 11
Figure 1.3 Carbon Stock Of Assam For The Year 2017 ................................................................. 12
Figure 2.1 Five Pools Of Carbon ................................................................................................... 14
Figure 3.1 Remote Sensing Process ................................................................................................ 17
Figure 3.2 Arrangement Of Spatial Data In Gis Environment ....................................................... 18
Figure 3.3 A Typical Gps Satellite Constellation ........................................................................... 19
Figure 3.4 A Google Earth Image .................................................................................................. 20
Figure 3.5 Path Shown On The Screen ......................................................................................... 21
Figure 3.6 Delineated Boundary Shown On The Google Earth ..................................................... 22
Figure 4.1 Permanent Square Plot ................................................................................................. 25
Figure 4.2 Calculation Of Standard Deviation .............................................................................. 26
Figure 5.3 Referencing Centre Of Plot .......................................................................................... 30
Figure 5.5 Measurement Of Tree Dbh In Different Situations ...................................................... 31
Figure 5.6 Measurement Of Tree Height Using Stick Method ...................................................... 32
Figure 5.8 Using Altimeter On A Reasonably Level Ground ......................................................... 34
Figure 5.9 Using Altimetre On A Sloping Ground When The Base Of The Trunk Is Below Eye Level ....................................................................................................................................... 34
Figure 5.10 Using Altimetre On A Sloping Ground When The Base Of The Trunk Is Above Eye Level ....................................................................................................................................... 35
Figure 5.11 Sample Plot For Clump Forming Bamboo ................................................................. 36
Figure 5.12 Sample Plot For Non-Clump Forming Bamboo ......................................................... 36

Training Manual for Capacity Building of Assam Forest Dept. on Carbon Stock Assessment of Forests 7
Acronyms & Abbreviations
AGB Above Ground Biomass BA Basal Area BEF Biomass Expansion Factor BGB Below Ground Biomass CAD Computer Aided Design CO2 Carbon dioxide
DBH Diameter at breast height DEM Digital Elevation Model DF Dense Forest DW Dead Wood DWG Drawing DXF Drawing Exchange Format EB Executive Board ESRI Environmental Systems Research Institute FCC False Colour Composite FSI Forest Survey of India GBH Girth at Breast Height GCP Ground Control Point GIS Geographical Information System GPG Good Practices Guidelines HCA Host Country Approval ICIMOD International Centre for Integrated Mountain Development IPCC Intergovernmental Panel on Climate Change IRS Indian Remote Sensing (Satellite) ISRO Indian Space Research Organization KML Keyhole Mark-up language KMZ Keyhole Mark-up language zipped LISS Linear Imaging and Self-scanning Sensor L Litter LULUCF Land-use, land-use change and forestry MDF Moderately Dense Forest MoEFCC Ministry of Environment, Forest and Climate Change NCDMA National Clean Development Mechanism Authority
Training Manual for Capacity Building of Assam Forest Dept. on Carbon Stock Assessment of Forests 8
NDC Nationally Determined Contribution NDVI Normalized Difference Vegetation Index NF Non-Forest NRSC National Remote Sensing Centre NWPC National Working Plan Code OF Open Forest PA Protected Area PDD Project Design Document PRA Participatory Rural Appraisal QA Quality Assurance QC Quality Control REDD Reduced Emissions from Degradation and Deforestation SFD State Forest Department SOC Soil Organic Carbon SOI Survey of India tCER Temporary Certified Emission Reductions TM Thematic Mapper TOF Trees Outside Forests TIFF Tagged Image Format File UNFCCC United Nation Framework Convention on Climate Change VCS Voluntary Carbon Standard VDF Very Dense Forest Vol. Volume WD Wood Density WP Working Plan
Units of Measurement ha - Hectare
Sq km - Square kilometre
m - Metre
t - Tonne (Metric)
tCO2e - Tonne Carbon dioxide equivalent
Training Manual for Capacity Building of Assam Forest Dept. on Carbon Stock Assessment of Forests 9
Purpose of the Manual
Carbon sequestration by forests has attracted much interest as a mitigation approach, as it has been considered a relatively inexpensive means of addressing climate change. This manual is intended to serve as a guide for conducting measurements of 5 pools of carbon for estimation of carbon stocks as per the ‘Good Practises Guidance’ (GPG) developed by Inter-governmental Panel on Climate Change (IPCC).
The present manual aims to assist the State Forest Department in meeting the requirements in respect of forest carbon inventory methods that would in turn assess the contribution of forests in sequestration of atmospheric carbon. This will serve multiple purposes as it will help not only the State but will be useful at national level for analysing role of forests towards India’s Nationally Determined Contributions (NDCs). Forest department can evaluate quality of their forest and accordingly they can take further actions for improvement of forest cover and contribute to achieving the Forest related NDC target of 2.5 to 3 billion tons of CO2 by 2030. It will also help to understand and develop projects under various carbon forestry schemes such as Afforestation/ Reforestation Clean Development Mechanism (A/R CDM), Voluntary Carbon Market, and Reducing Emissions from Deforestation and Degradation in developing countries (REDD+). Carbon stock assessment can be applied for obtaining carbon finance from Compliance and Voluntary carbon markets. The forest area having less than 15% canopy cover are eligible for A/R CDM, which is implemented through plantation activities while areas having more than 15% canopy cover are eligible for REDD+, which is implemented through conservation practices.
The National Working Plan Code is considered to be the main instrument of forest planning and preparation of Working Plans. There is mandatory requirement to have one chapter for five pools of carbon stock. The frontline staff of Forest Department lacks adequate knowledge regarding measurement of five pools of carbon stock of the forests. Therefore, it is very important that the senior officials and the frontline staff of each state's forest department should receive effective and well-structured capacity building trainings on the latest skills and techniques related to biomass and carbon stock assessment. Thus, carbon stock assessment should be added as a chapter in the next revised National Working Plan Code.
GIZ in collaboration with Ministry of Environment, Forest and Climate Change, Government of India is implementing an Indo-German bilateral project ‘Development and Management of NAMAs (Nationally Appropriate Mitigation Actions) in India with a focus on Forestry and Waste Sector. As a part of this project, GIZ and TERI in collaboration with Assam Forest Department, are piloting the Forest NAMA concept in the State of Assam. This project aims to reduce forest degradation in Assam by addressing the supply and demand side of fuelwood management. Unsustainable fuelwood extraction is the foremost unplanned driver of forest degradation in the country. The Project also aims to develop capacities of the AFD on carbon stock assessment of forests.
Considering the above factors, The Energy and Resources Institute (TERI) and GIZ has developed a training manual for building capacity of Assam Forest Department on carbon stock assessment of forests.
Training Manual for Capacity Building of Assam Forest Dept. on Carbon Stock Assessment of Forests 10
Chapter 1. Introduction
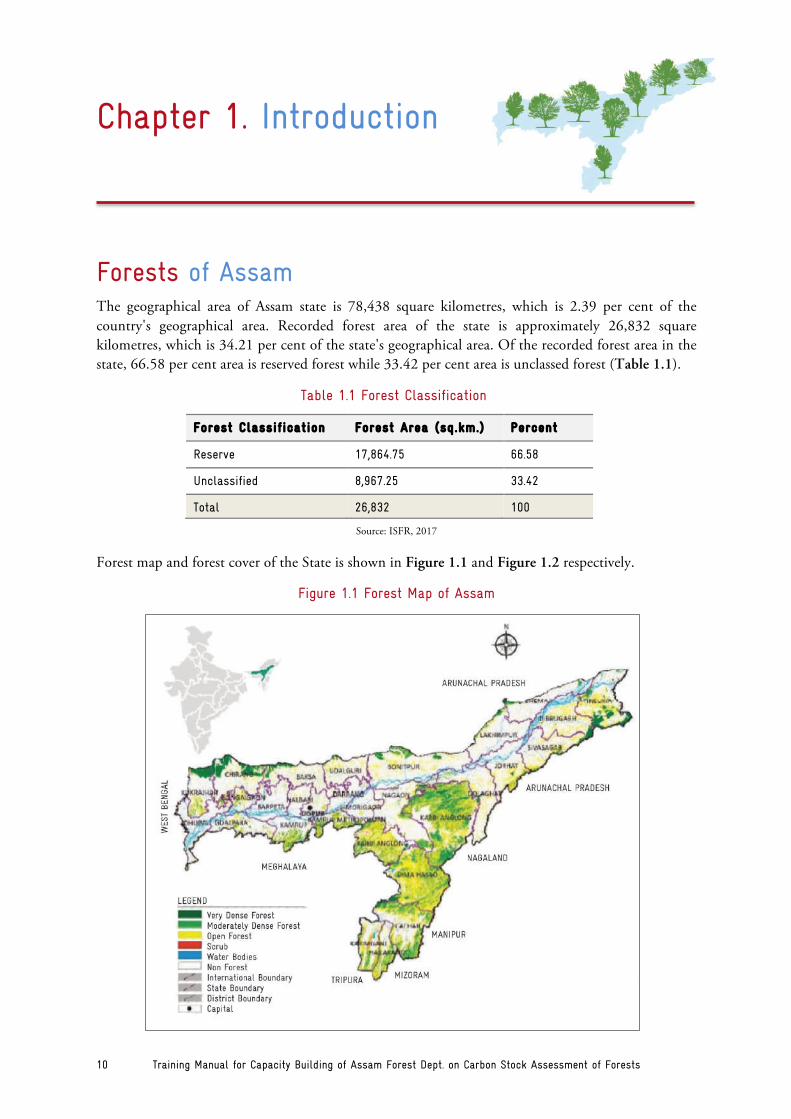
Forests of Assam The geographical area of Assam state is 78,438 square kilometres, which is 2.39 per cent of the country's geographical area. Recorded forest area of the state is approximately 26,832 square kilometres, which is 34.21 per cent of the state's geographical area. Of the recorded forest area in the state, 66.58 per cent area is reserved forest while 33.42 per cent area is unclassed forest (Table 1.1).
Table 1.1 Forest Classification
Forest Classif ication Forest Area (sq.km.) Percent
Reserve 17,864.75 66.58
Unclassified 8,967.25 33.42
Total 26,832 100
Source: ISFR, 2017
Forest map and forest cover of the State is shown in Figure 1.1 and Figure 1.2 respectively.
Figure 1.1 Forest Map of Assam

Training Manual for Capacity Building of Assam Forest Dept. on Carbon Stock Assessment of Forests 11
10%
36%54%VDF
MDF
OF
Figure 1.2 Forest Cover of Assam
Assam state extends from 89042’ E to 960 02’ E longitude and 2408’ N to 280 2’ N latitude. The state comprises of two valleys namely Brahmaputra valley and Barak valley. Brahmaputra and Barak river system are the two major river systems in the state. Both river systems cause frequent floods. About 39.58% of the total land area in Assam is flood prone1.
The average annual rainfall in the state varies from 1,500 mm to 3,750 mm with average annual temperature ranging from 5 degree Celsius to 32 degree Celsius.
As per Champion and Seth classification, Assam has 18 forest types belonging to five forest type groups viz. Tropical Wet Evergreen, Tropical Semi Evergreen, Tropical Moist Deciduous, Tropical Dry Deciduous and Sub Tropical Pine Forests.
The State has twenty seven districts, among which 19 are tribal and 3 are hill districts. As per the 2011 census, Assam has a population of 31.21 million accounting to 2.58 per cent of India’s population.
The details of the protected area network of Assam are shown in Table 1.2 below:
Table 1.2 Protected Areas of Assam
Wildlife Protected Areas Number Remarks
National Park 5 Dibru-Saikhowa, Kaziranga, Manas, Nameri, Rajiv Gandhi Orang National Park
Tiger Reserve 3 Manas, Nameri, Kaziranga
Wildlife Sanctuary 20 Including 3 proposed
Elephant Reserve 5 Sonitpur, Dihing-Patkai, Kaziranga-Karbi Anglong, Dhansiri-Lumding and Chirang-Ripu
Biosphere Reserve 2 Dibru Saikhowa, Manas
Source: Assam Forest Department2
1 https://assam.gov.in/web/department-of-water-resource/river-system-of-assam 2 https://forest.assam.gov.in/information-services/reserve-forests
Training Manual for Capacity Building of Assam Forest Dept. on Carbon Stock Assessment of Forests 12
27%
6%
1%
3%
63%
Percentage wise carbon stock in five pools of carbon
AboveGroundBiomass
BelowGroundBiomass
Deadwood
LiBer
SoilOrganicCarbon
Status of Growing Stock and Carbon Stock Growing stock is considered as an important indicator of forest health and productivity. It is the measure of the substance of its tree wealth and includes distribution of stems in different class, volume, biomass, carbon stock, etc. both within and outside forest area and is required for strategic planning of the forestry sector at various levels. It is estimated through forest inventory under which both qualitative and quantitative parameters are recorded to know overall health of the growing forests. Assessment of growing stock is an essential and integral component for local level management of forest resources. Value of growing stock in forests and trees outside forests in Assam for the year 2017 is presented in the Table 1.3.
Table 1.3 Status of Growing Stock in Assam
Year Geographical area (sq. km.)
RFA (sq.km.) Growing Stock (mill ion cum) Total (mill ion cum)
In Forest In TOF
2017 78438 26832 133.128 30.195 163.323
Source: ISFR, 2017
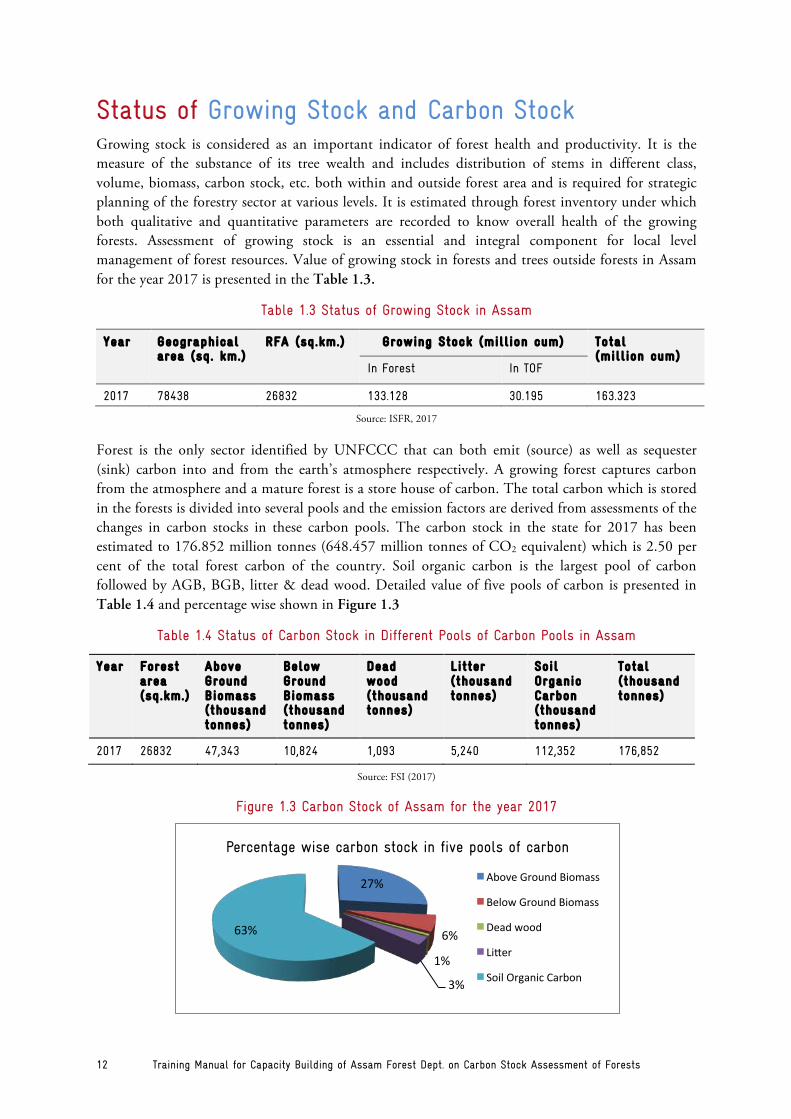
Forest is the only sector identified by UNFCCC that can both emit (source) as well as sequester (sink) carbon into and from the earth’s atmosphere respectively. A growing forest captures carbon from the atmosphere and a mature forest is a store house of carbon. The total carbon which is stored in the forests is divided into several pools and the emission factors are derived from assessments of the changes in carbon stocks in these carbon pools. The carbon stock in the state for 2017 has been estimated to 176.852 million tonnes (648.457 million tonnes of CO2 equivalent) which is 2.50 per cent of the total forest carbon of the country. Soil organic carbon is the largest pool of carbon followed by AGB, BGB, litter & dead wood. Detailed value of five pools of carbon is presented in Table 1.4 and percentage wise shown in Figure 1.3
Table 1.4 Status of Carbon Stock in Different Pools of Carbon Pools in Assam
Year Forest area (sq.km.)
Above Ground Biomass (thousand tonnes)
Below Ground Biomass (thousand tonnes)
Dead wood (thousand tonnes)
Litter (thousand tonnes)
Soil Organic Carbon (thousand tonnes)
Total (thousand tonnes)
2017 26832 47,343 10,824 1,093 5,240 112,352 176,852
Source: FSI (2017)
Figure 1.3 Carbon Stock of Assam for the year 2017

Training Manual for Capacity Building of Assam Forest Dept. on Carbon Stock Assessment of Forests 13
Chapter 2. Forest Carbon Assessment
Importance Forests and climate change are intimately intertwined. Forests regulate the climate, rain, groundwater and soil of the Earth. Forests are both sources and sinks of carbon. A growing forest captures carbon from the atmosphere and a mature forest is a store house of carbon. The world’s forests and forest soils currently store more than one trillion tons of carbon – twice the amount found floating free in the atmosphere. According to Global Forest Resource Assessment Report, 2010 of FAO (FAO, 2010), the total forest carbon stock of the world is 652 Giga tonnes (161.8 t/ha). Out of this the forest biomass contains 289 Giga tonnes (71.6 t/ha); the dead organic matter contains 72 Giga tonnes (17.8 t/ha); and forest soil organic carbon contains 293 Giga tonnes (72.3 t/ha) of carbon.
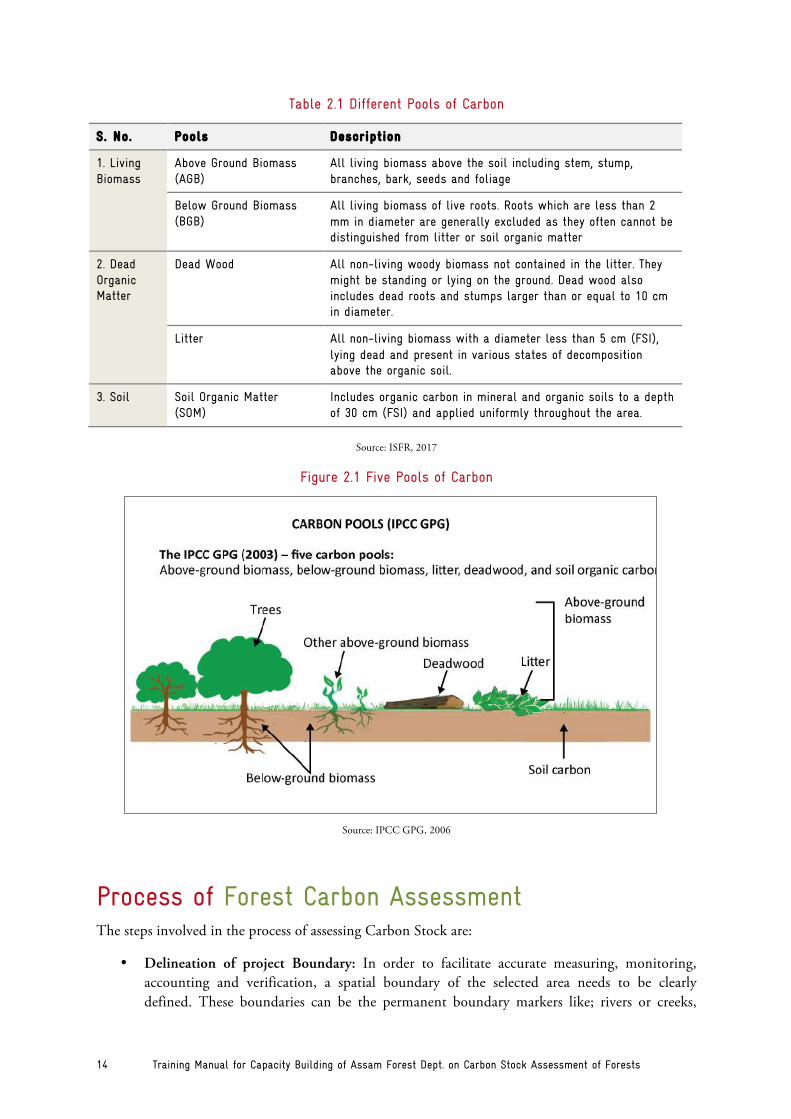
Eligible Carbon Pools In forest ecosystem, enormous carbon is stored which is classified in five pools as given by Intergovernmental Panel on Climate Change’s (IPCC) Good Practice Guidance or Land Use, Land-Use Change and Forestry (GPG-LULUCF)3. Major eligible carbon pools from the forest areas are Above Ground Biomass (AGB), Below Ground Biomass (BGB), Dead wood (DW), Litter (L) and Soil Organic Carbon (SOC). Generally, the carbon pools which require less efforts, time and resources in estimating the carbon are selected. A pool should be measured if it is large or if it is likely to be affected by land use. Small pools or those unlikely to be affected by land use may be excluded.
Though all these five carbon pools are not necessarily required in every project, but in the present carbon inventory study we have selected all these five major carbon pools from the selected project sites for estimating the overall carbon in each project site. AGB and BGB are the living biomass of trees. AGB mainly includes biomass of tree bole and branches, BGB includes biomass from roots of the tree, DW includes biomass from fallen twigs and branches, litter includes non-living biomass including the semi decomposed leaf material and fine roots and SOC includes the carbon present in the soil of each pilot project site. Field measurement data will be collected based on an appropriate sampling strategy and statistical sampling design. A combination of systematic and stratified random sampling will be adopted for data collection in each project site (FSI, 2011).
3 https://www.ipcc-nggip.iges.or.jp/public/gpglulucf/gpglulucf.html
Training Manual for Capacity Building of Assam Forest Dept. on Carbon Stock Assessment of Forests 14
Table 2.1 Different Pools of Carbon
S. No. Pools Description
1. Living Biomass
Above Ground Biomass (AGB)
All living biomass above the soil including stem, stump, branches, bark, seeds and foliage
Below Ground Biomass (BGB)
All living biomass of live roots. Roots which are less than 2 mm in diameter are generally excluded as they often cannot be distinguished from litter or soil organic matter
2. Dead Organic Matter
Dead Wood All non-living woody biomass not contained in the litter. They might be standing or lying on the ground. Dead wood also includes dead roots and stumps larger than or equal to 10 cm in diameter.
Litter All non-living biomass with a diameter less than 5 cm (FSI), lying dead and present in various states of decomposition above the organic soil.
3. Soil Soil Organic Matter (SOM)
Includes organic carbon in mineral and organic soils to a depth of 30 cm (FSI) and applied uniformly throughout the area.
Source: ISFR, 2017
Figure 2.1 Five Pools of Carbon
Source: IPCC GPG, 2006
Process of Forest Carbon Assessment The steps involved in the process of assessing Carbon Stock are:
• Delineation of project Boundary: In order to facilitate accurate measuring, monitoring, accounting and verification, a spatial boundary of the selected area needs to be clearly defined. These boundaries can be the permanent boundary markers like; rivers or creeks,
Training Manual for Capacity Building of Assam Forest Dept. on Carbon Stock Assessment of Forests 15
mountain ridges etc. Identifying and delineating the project boundaries can be done through remote sensing and other geo-spatial tools. For example, satellite images from optical or radar sensor systems; aerial photographs; Global Positioning System (GPS); topographic maps; and land records. If the high resolution satellite images are not available, GPS Tracking is the most accurate and efficient alternative method for boundary delineation although the process is time consuming.
• Stratification, Mapping and Sampling Design: For the purpose of stratification of the project area, collection of basic information such as land use, land cover, data on vegetation and data on topography is collected and a base map is prepared. Base map gives the details of the project area by indicating the different land use categories and it is mostly built with the help of high resolution satellite imagery. A preliminary visit is organised within the study area in order to improve the accuracy and precision of the representation. The various strata and sub-strata are identified with the help of expert knowledge from the local foresters. The project area can be stratified into approximately homogenous units on the basis of various parameters like-Forest type, Dominant tree species, stocking density of the trees, Age of trees, Aspect and position of the hill slopes, altitude, physical boundary, Site quality etc. Sampling is important in order to measure only a small sample fraction of the total population because it is difficult to measure every tree within a forest.
• Pilot Inventory: In order to estimate the variance of the carbon stock in each forest stratum and to provide a basis for calculating the number of permanent sample plots, a preliminary inventory needs to be completed. It is generally done by laying down 10 to 15 square/ circular plots randomly in each forest block within the project boundary.
• Capacity building: It has been recognized that one of the factors causing destruction of the forests is the arbitrary use of forest resources by the poor village communities, living in or on the fringes of forests, which depend on those resources to make a living. It is therefore vital to promote awareness regarding the importance of forest management among the local village residents while planning for forest conservation, and to provide assistance to improve the livelihoods of the poor and their effective use of forest resources in a sustainable manner. To that purpose, it is critical that the frontline staff of each state's forest department, which implements the project and is in daily contact with local village communities, receives effective and well-structured trainings on the latest skills and techniques covering various aspects of the forestry sector, including forest management methods based on a new innovative approach.
• Identification of Carbon pools: The relevant five pools of carbon viz. above ground biomass, below ground biomass, litter, dead wood and soil organic carbon are to be identified to carry out the process of carbon assessment.
• Field measurements in the permanent plots: Field measurement and data collection needs to be done for all the five pools of carbon in the permanent sample plots. The detailed procedure for field measurement and data collection is explained in Chapter 5.
• Data Analysis: After data collection for all the five carbon pools is complete, data analysis is yet another major task to be accomplished. Analysis of all the carbon pools is explained in Chapter 6.

Training Manual for Capacity Building of Assam Forest Dept. on Carbon Stock Assessment of Forests 16
Chapter 3. Geospatial Tools for Mapping of Project Boundary for Carbon Assessment
Remote Sensing Remote sensing is an art, science and profession of acquisition of information about an object, process or phenomena without making physical contact with that object, process or phenomena. In much simpler words remote sensing is ‘gathering of information about something by observing it from a distance’. To this we use satellites to gather data, images or photographs etc., as to study the earth and other bodies of the solar system.
In the context of current training manual, the term remote sensing generally refers to the use of satellite or aircraft based sensor technologies to deter and classify land use related objects on the Earth surface, including forests, open area, agriculture, built-up and other usages.
Table 3.1 Brief History of Remote Sensing
1826 The invention of photography
1850’s Photography from balloons
1873 Theory of electromagnetic energy by J. C. Maxwell
1909 Photography from airplanes
1910’s World War I: aerial reconnaissance
1920’s Development and applications of aerial photography and photogrammetry
1930’s Development of radar in Germany, USA, and UK
1940’s World War II : application of Infrared and microwave regions
1950’s Military Research and Development
1960’s The satellite era: Space race between USA and USSR The first meteorological satellite (TIROS-1) The first use of term “remote sensing” Skylab remote sensing observations from the space
1972 Launch of the first earth resource satellite (Landsat-1)
1970’s Rapid advances in digital image processing
1980’s Landsat-4: new generation of Landsat sensors India demonstrated Bhaskara and Bhaskara-2 satellites
1986 Launch of French earth observation satellite (SPOT-1)
1988 India launched IRS-1A
1990’s Development of hyper-spectral sensors Launch of earth resource satellites by national space Agencies and commercial companies
Training Manual for Capacity Building of Assam Forest Dept. on Carbon Stock Assessment of Forests 17
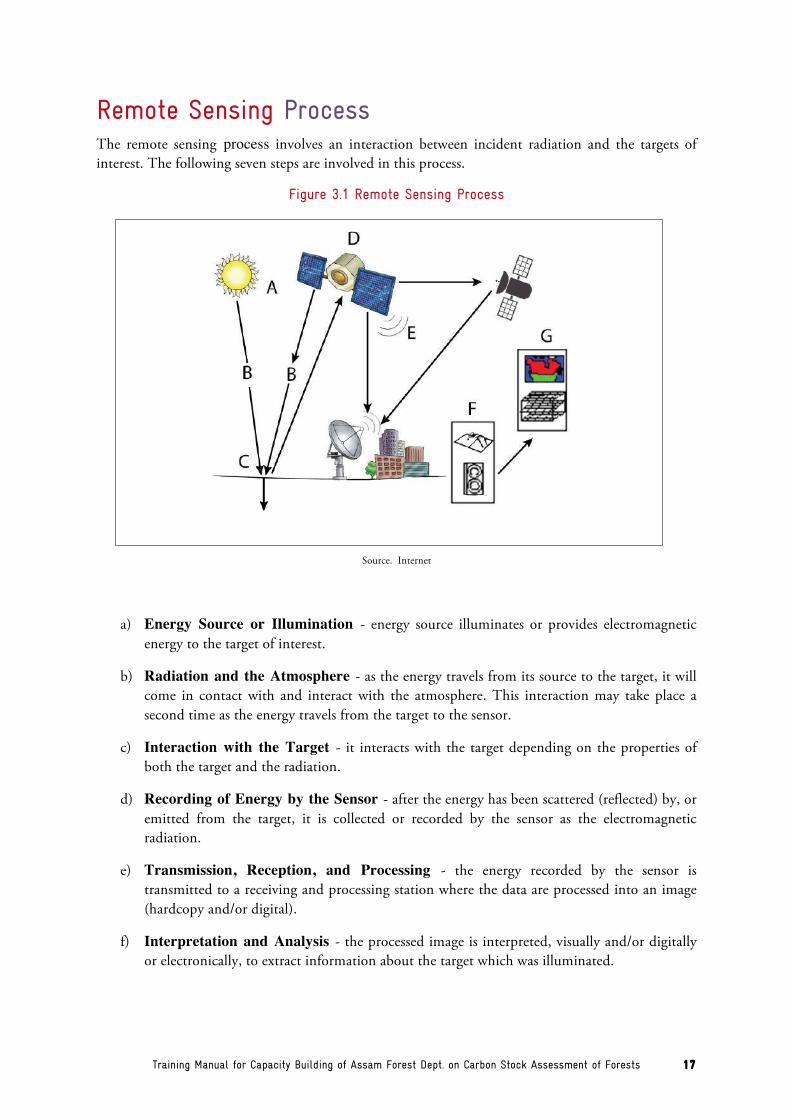
Remote Sensing Process The remote sensing process involves an interaction between incident radiation and the targets of interest. The following seven steps are involved in this process.
Figure 3.1 Remote Sensing Process
Source. Internet
a) Energy Source or Illumination - energy source illuminates or provides electromagnetic energy to the target of interest.
b) Radiation and the Atmosphere - as the energy travels from its source to the target, it will come in contact with and interact with the atmosphere. This interaction may take place a second time as the energy travels from the target to the sensor.
c) Interaction with the Target - it interacts with the target depending on the properties of both the target and the radiation.
d) Recording of Energy by the Sensor - after the energy has been scattered (reflected) by, or emitted from the target, it is collected or recorded by the sensor as the electromagnetic radiation.
e) Transmission, Reception, and Processing - the energy recorded by the sensor is transmitted to a receiving and processing station where the data are processed into an image (hardcopy and/or digital).
f) Interpretation and Analysis - the processed image is interpreted, visually and/or digitally or electronically, to extract information about the target which was illuminated.

Training Manual for Capacity Building of Assam Forest Dept. on Carbon Stock Assessment of Forests 18
g) Application - we apply the information extracted from the imagery about the target in order to better understand it, reveal some new information, or assist in solving a particular problem.
Resolutions in Remote Sensing 1. Spatial resolution of the sensor refers to the size of the smallest possible feature that can be
detected (1 m, 30 m, 1 km).
2. Spectral resolution of the sensor is its ability to collect information in number and fine wavelength intervals (blue, green, red, near-infrared, thermal).
3. Radiometric resolution of the sensor describes its ability to discriminate very slight differences in energy (8 bits, 12 bits).
4. Temporal resolution of the sensor is its ability to collect information of the same area at different periods of time (1 day, 15 days, 1 month)
Geographical Information System (GIS) GIS is a system designed to capture, store, manipulate, analyse, manage and present spatial or geographic data. It is also described as an information system that integrates, stores, edits, analyses, shares and displays geographic information. This data is represented as spatial (map format) and tabular (table format) and both are interconnected. Thus, using GIS you can digitally represent geographic objects with variety of shapes (point, line and polygon) and layers showing the characteristics/attributes of land surface feature.
Figure 3.2 Arrangement of Spatial Data in GIS Environment
Source. Internet
Training Manual for Capacity Building of Assam Forest Dept. on Carbon Stock Assessment of Forests 19
The spatial data in GIS can be represented as vector (point, line and polygon) and raster (pixel, row and column) data model. In the raster model, the world as a surface is divided into a regular grid of cells, arranged into rows and columns. All cells (or pixels) must be of the same size and each cell has a value (characteristics/attributes of land surface feature). These are stored in PG, TIF, GEOTIF, etc. formats. In the vector model, the work as a surface is represented using the features (point, line and polygon) and each feature has a value (characteristics/attributes of land surface feature). These are stored in Shape file, personal geodatabase (Access), file geodatabase (ESRI), CAD (DXF and DWG) or KML/KMZ files (from Google Earth).
Thus, the GIS system works using maps, data, analysis and applications which are defined below:
• Maps: Maps are geographic data represented as layers. • Data: GIS integrates many different kinds of data layers using spatial location. Most data has
a geographic component. GIS data includes imagery, features, and basemaps linked to spreadsheets and tables.
• Analysis: Analysis component helps you to evaluate suitability, capability estimate and predict, interpret and understand and provide new perspectives to decision making.
• Applications: The applications are focused to thematic areas.
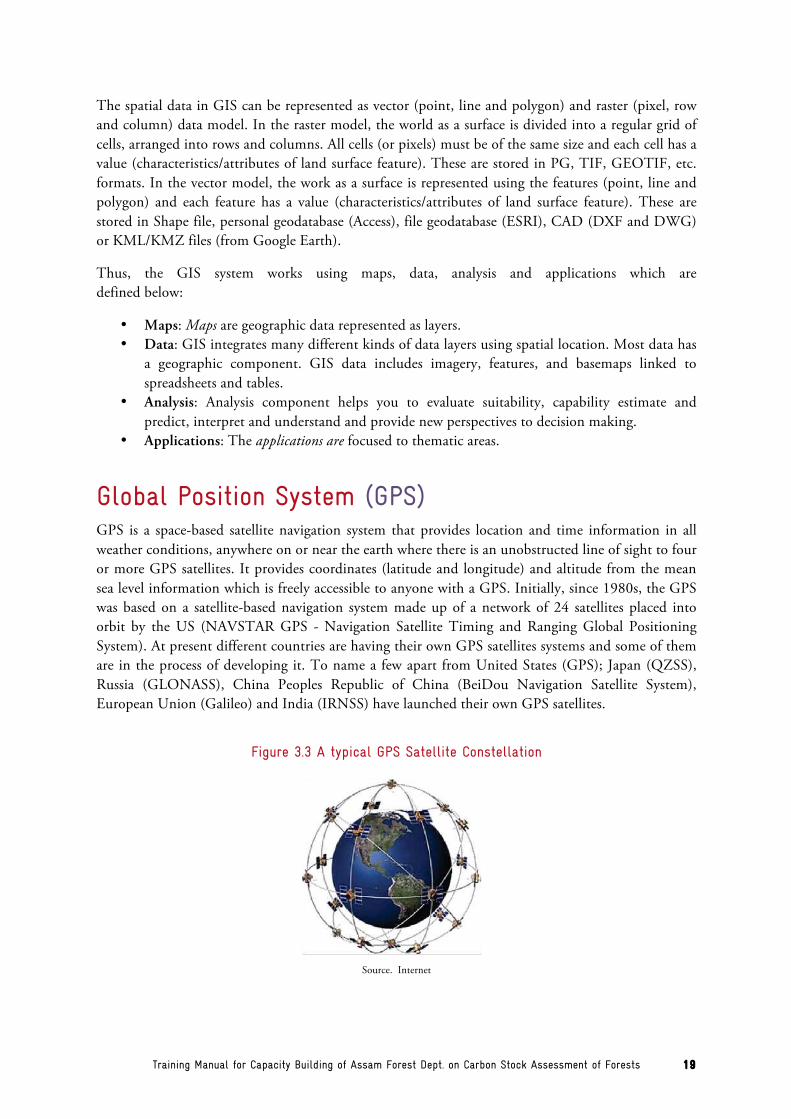
Global Position System (GPS) GPS is a space-based satellite navigation system that provides location and time information in all weather conditions, anywhere on or near the earth where there is an unobstructed line of sight to four or more GPS satellites. It provides coordinates (latitude and longitude) and altitude from the mean sea level information which is freely accessible to anyone with a GPS. Initially, since 1980s, the GPS was based on a satellite-based navigation system made up of a network of 24 satellites placed into orbit by the US (NAVSTAR GPS - Navigation Satellite Timing and Ranging Global Positioning System). At present different countries are having their own GPS satellites systems and some of them are in the process of developing it. To name a few apart from United States (GPS); Japan (QZSS), Russia (GLONASS), China Peoples Republic of China (BeiDou Navigation Satellite System), European Union (Galileo) and India (IRNSS) have launched their own GPS satellites.
Figure 3.3 A typical GPS Satellite Constellation
Source. Internet
Training Manual for Capacity Building of Assam Forest Dept. on Carbon Stock Assessment of Forests 20
The GPS comprises of three segments – Space segment (of GPS space vehicle, 24 satellites), Control segment (five system tracking stations distributed across the world, with Colorado Springs as master control segment) and User segment (people using GPS receivers). The GPS system is very handy instrument which is used for calculation of a position using the distance measurement by satellites, obtain satellite position, perform triangulation, adjust local clock bias and provide actual position of the location where GPS receiver is being used. Thus, it can help in measuring distance, speed and time.
Mapping of Project Boundary The project boundary is delineated using different kind of geospatial (remote sensing, GIS and GPS) tools. The maps must include official name of locations and other details like adjoining ownership, major landmarks (road, water bodies or natural marks). If possible it should have north arrow and coordinates for important locations (including mile stones).
1. To map the project boundary, the best and most effective way is usage of topographic sheets and maps available with the State Forest Department having details on divisional boundary, range and compartment details with the quality of forests.
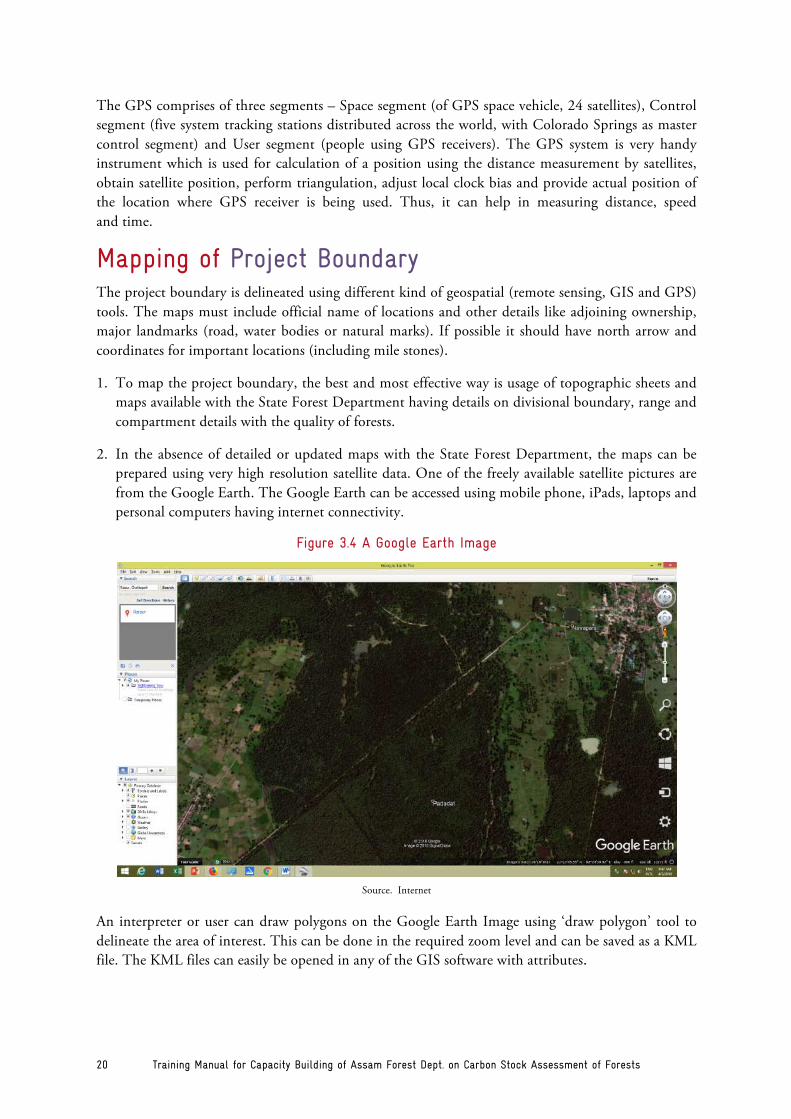
2. In the absence of detailed or updated maps with the State Forest Department, the maps can be prepared using very high resolution satellite data. One of the freely available satellite pictures are from the Google Earth. The Google Earth can be accessed using mobile phone, iPads, laptops and personal computers having internet connectivity.
Figure 3.4 A Google Earth Image
Source. Internet
An interpreter or user can draw polygons on the Google Earth Image using ‘draw polygon’ tool to delineate the area of interest. This can be done in the required zoom level and can be saved as a KML file. The KML files can easily be opened in any of the GIS software with attributes.
Training Manual for Capacity Building of Assam Forest Dept. on Carbon Stock Assessment of Forests 21
1. In the similar ways any of the satellite data (IRS LISS III/LISS IV, Landsat data or very high resolution WorldView-3) can be used to delineate the boundary as a hardcopy map or digital map using GIS software.
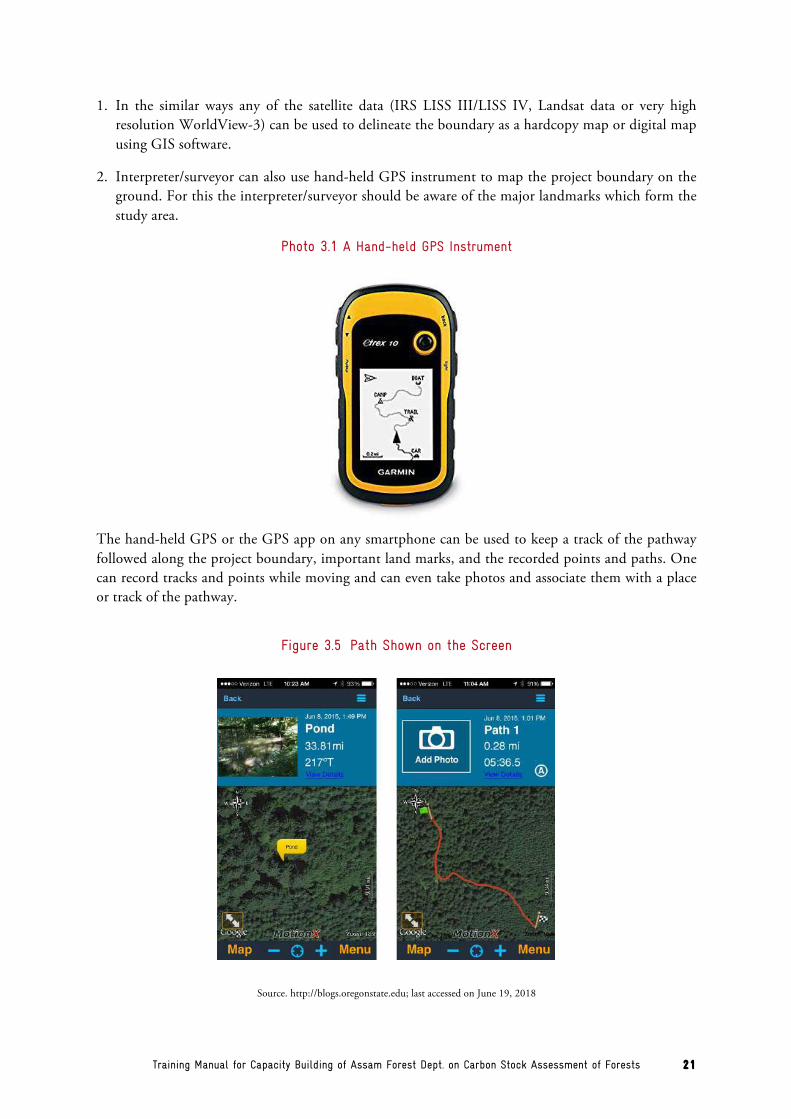
2. Interpreter/surveyor can also use hand-held GPS instrument to map the project boundary on the ground. For this the interpreter/surveyor should be aware of the major landmarks which form the study area.
Photo 3.1 A Hand-held GPS Instrument
The hand-held GPS or the GPS app on any smartphone can be used to keep a track of the pathway followed along the project boundary, important land marks, and the recorded points and paths. One can record tracks and points while moving and can even take photos and associate them with a place or track of the pathway.
Figure 3.5 Path Shown on the Screen
Source. http://blogs.oregonstate.edu; last accessed on June 19, 2018

Training Manual for Capacity Building of Assam Forest Dept. on Carbon Stock Assessment of Forests 22
Finally the developed boundary can be saved as a KML file which can be used in any GIS environment including Google Earth.
Figure 3.6 Delineated Boundary Shown on the Google Earth
Source. http://blogs.oregonstate.edu; last accessed on June 19, 2018
Ground Truthing In remote sensing, ‘ground truthing’ refers to information collected on the field. This is a process of carrying the on-field satellite photographs and matching it with the ground realities so as to collect the required information from the field. It allows image data to be related to the real features and objects on the ground. The collection of ground truth data enables processing of satellite data such as calibration, pre-processing, interpretation, information extraction, analysis and accuracy assessment. Ground truthing is usually done on the site using hand-held GPS instrument, topographic or other maps, local people and specific instruments through which data has to be collected from the field. While collecting any kind of the data or recording any observation, the coordinates are collected using hand-held GPS instruments and field photographs are taken of the surrounding area, preferably from the four directions.
Ground truthing is essential for map making exercises using information from the satellite data (using supervised classification techniques) and also assessing the errors in interpretation of the satellite data. It is must that ground truth data be collected for any satellite data processing and interpretation. However, the degree of ground truth to be collected may vary depending on the knowledge/experience of interpreter on the field and availability of such information or data from the secondary sources.
Photo 3.2 Ground Truthing
Training Manual for Capacity Building of Assam Forest Dept. on Carbon Stock Assessment of Forests 23
Chapter 4. Sampling Plan
Stratification Stratification gains precision by dividing a heterogeneous population into relatively homogeneous sub-population based on certain stratification variables. Once the project area has been delineated, it is essential to collect basic information on features such as land use and land cover as well as data on the vegetation and topography. Data for the project area (e.g. watershed area) can be geo-referenced and traced onto a base map. A base map specifies the details of the project area by indicating the different land-use categories (forest, water bodies, open land, agricultural land, and so forth) and is developed with high-resolution satellite images preferably. Strata are areas distinctly different from each other in forest types, density, and species; and as such they will have different amounts of carbon stored. To make strata as homogeneous as possible, a forest within the project area is divided into different layers or blocks. Remote-sensing software (like ERDAS Imagine) is used for land-cover classification and forest stratification. A preliminary field visit is organized within the entire study area to improve the accuracy and precision of the representation. Strata and sub-strata are identified using the expert knowledge of local foresters. The entire project area can be stratified into approximately homogeneous units on the basis of the following parameters.
• Forest types - Tropical forest, tropical evergreen forest, subtropical deciduous hill forest, temperate forest etc. are regarded as forest types.
• Dominant tree species - Sites containing dominant tree species are regarded as one stratum types.
• Stocking density of trees - Within a dominant type, sites are separated further if they differ substantially in stocking density. Remote-sensing analysis is used to identify forest areas which differ in tree density. ‘Sparse’ and ‘dense’ can, for example, be major types of forests.
• Age of trees - Sites with distinct age classes are stratified further, as carbon sequestration differs markedly with the age of the stand.
• Aspect and position of hill slopes - Within a dominant forest type, sites differing in aspect and position on a hill slope are stratified further because the rate of carbon sequestration varies in relation to these factors. For example, a stand on the south aspect would have far greater productivity than one on the north aspect.
• Altitude - Forest blocks are selected within altitudinal ranges from above mean sea level as vegetation types differ according to altitudinal variation. It is sensible to design elevation strata that represent forests within a 300-500 m range in altitude.
• Physical boundary - The boundary of the forest block is determined on the basis of easily visualized boundaries (i.e., rivers, roads, ridges, etc.).

Training Manual for Capacity Building of Assam Forest Dept. on Carbon Stock Assessment of Forests 24
• Site quality - Site quality tells us how much timber a forest can potentially produce. The productivity of forest land is defined in terms of the maximum amount of volume that the land can produce over a given amount of time. Site quality is measured as an index related to this timber productivity.
Since, carbon stored in the vegetation largely depends upon canopy density and forest type, these two are majorly considered as stratification variables. Stratification based on Canopy cover is presented in Table 4.1.
Table 4.1 Stratification Based on Canopy Cover
S. No. Forest crown cover Strata
1. 1 – 10 % Open Shrub land
2. 11 – 40 % Degraded Forest
3. 41 – 70 % Moderately Dense Forest
4. 71 – 100 % Very Dense Forest
Photo 4.1 Stratification Based on Canopy Cover
Shape and Size of Sample Plots The shape and size of the sample plots is a trade-off between accuracy, precision, time, and cost for measurement. In general, sample plots should be either permanent or temporary. Permanent sample plots are statistically more efficient in estimating changes in forest carbon stocks. Similarly, sample plots can either be of a fixed size or nested, this means that they comprise smaller sub-units for various carbon pools. Nested plots are generally more practical and efficient in estimating forest biomass. Thus, in the present carbon inventory study, permanent nested sample plots are laid out. The required number of the permanent sample plots with appropriate sizes and shapes is carried out at the start of the project. Forest carbon measurement can be carried out in both square and circular plots. Nevertheless, circular samples are recommended for the areas which are hilly and inaccessible. Square plot each of 31.62 m x 31.62 m size is laid in each site as shown in Figure 4.1.

Training Manual for Capacity Building of Assam Forest Dept. on Carbon Stock Assessment of Forests 25
Figure 4.1 Permanent Square Plot
Sample Plot Allocations Estimating number of sample plots To measure each and every tree within the each selected site is not only time consuming, but also impractical and not feasible. Pearson et al., in 2005 has developed a statistical tool through which one can estimate the required number of sample plots to be laid in the project site that are statistically significant. Thus, through this statistical tool, measuring only a fraction of trees from the total project area can provide true values of biomass of the entire project area. The number of estimated sample plots to be laid out in the selected site depends upon various factors such as size and number of stratums, basic carbon density and its standard deviation in the selected project area. In all the selected pilot sites, estimated number of sampled plots to be laid out at each pilot site is calculated using the statistical equation mentioned below (Step V). The methodology for estimating the number of sample plots to be laid out at each pilot project site that are statistically significant is as follows:
STEP I. Identify the desired precision level.
(± 10% of the mean at the 95% confidence interval is frequently used)
STEP II. Identify the area or preliminary data.
(10-15 plots per stratum will suffice for variance analysis)
Training Manual for Capacity Building of Assam Forest Dept. on Carbon Stock Assessment of Forests 26
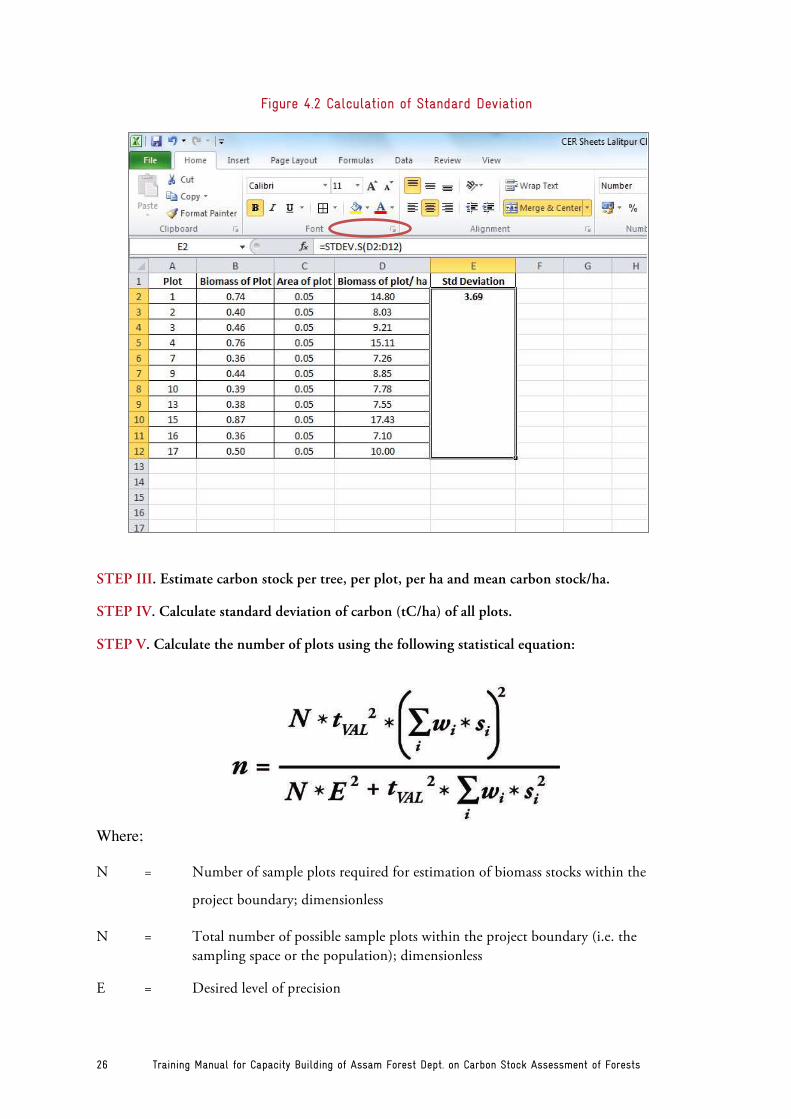
Figure 4.2 Calculation of Standard Deviation
STEP III. Estimate carbon stock per tree, per plot, per ha and mean carbon stock/ha.
STEP IV. Calculate standard deviation of carbon (tC/ha) of all plots.
STEP V. Calculate the number of plots using the following statistical equation:
Where;
N = Number of sample plots required for estimation of biomass stocks within the
project boundary; dimensionless
N = Total number of possible sample plots within the project boundary (i.e. the sampling space or the population); dimensionless
E = Desired level of precision
Training Manual for Capacity Building of Assam Forest Dept. on Carbon Stock Assessment of Forests 27
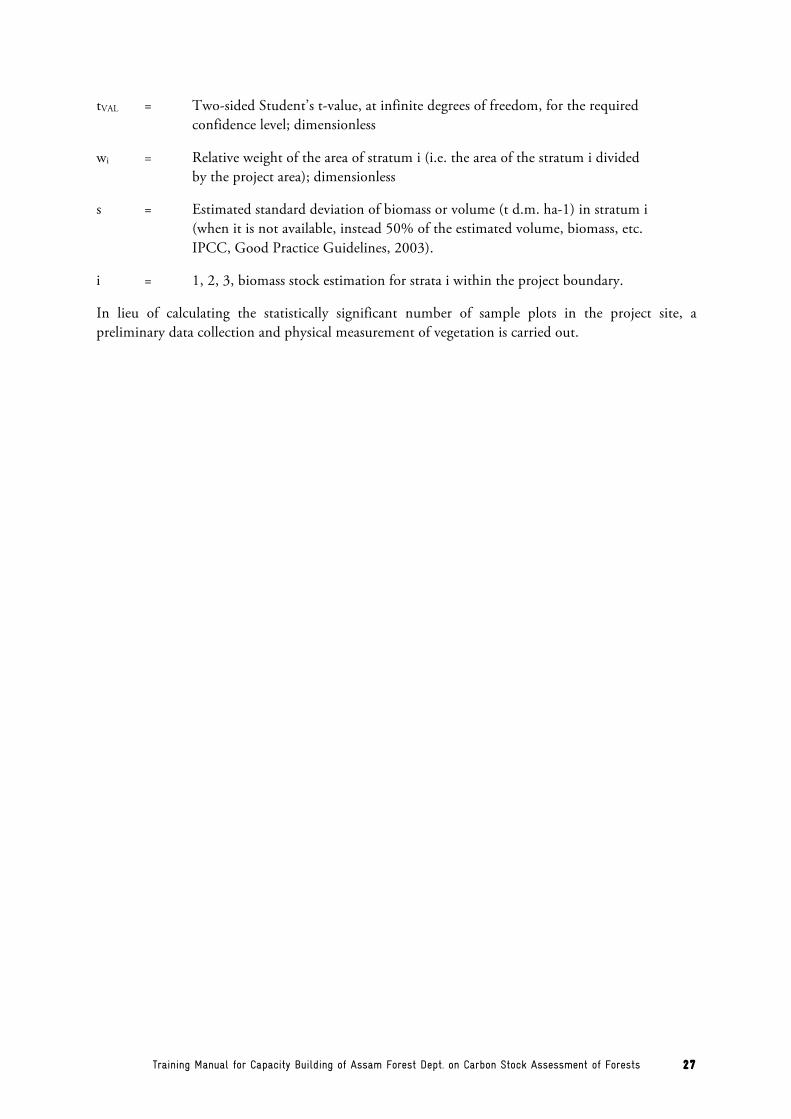
tVAL = Two-sided Student’s t-value, at infinite degrees of freedom, for the required confidence level; dimensionless
wi = Relative weight of the area of stratum i (i.e. the area of the stratum i divided by the project area); dimensionless
s = Estimated standard deviation of biomass or volume (t d.m. ha-1) in stratum i (when it is not available, instead 50% of the estimated volume, biomass, etc. IPCC, Good Practice Guidelines, 2003).
i = 1, 2, 3, biomass stock estimation for strata i within the project boundary.
In lieu of calculating the statistically significant number of sample plots in the project site, a preliminary data collection and physical measurement of vegetation is carried out.
Training Manual for Capacity Building of Assam Forest Dept. on Carbon Stock Assessment of Forests 28
Chapter 5. Field Measurements
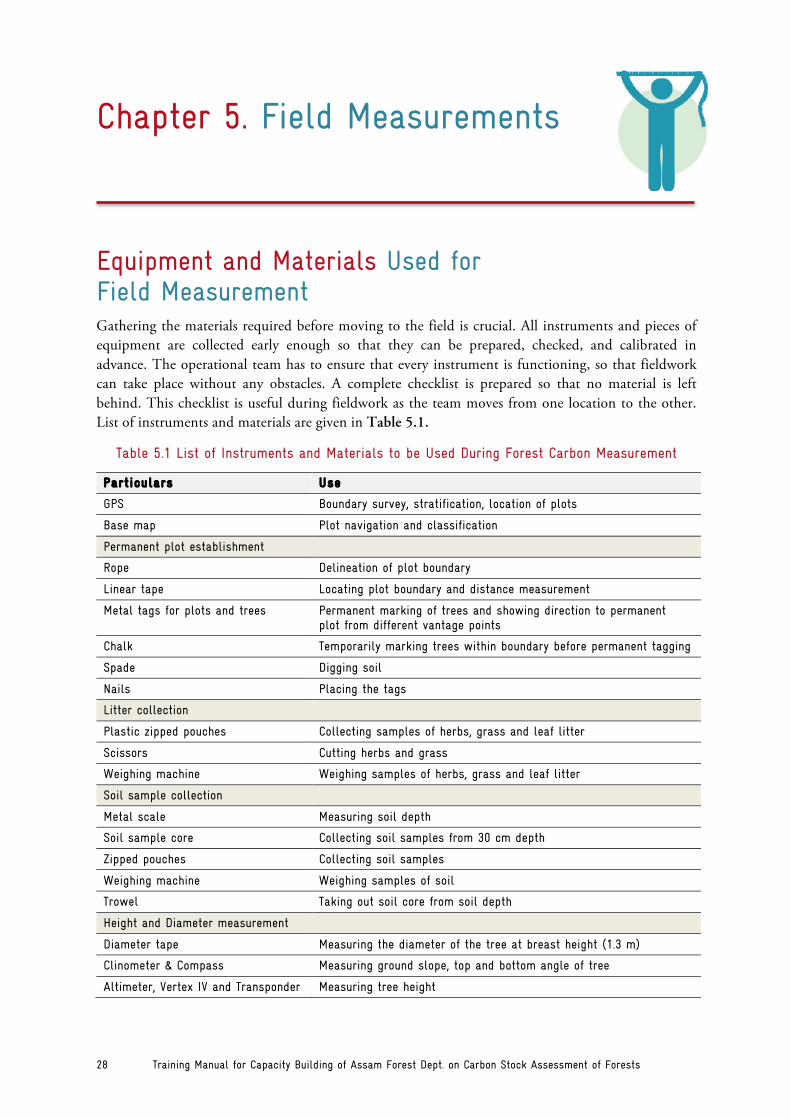
Equipment and Materials Used for Field Measurement Gathering the materials required before moving to the field is crucial. All instruments and pieces of equipment are collected early enough so that they can be prepared, checked, and calibrated in advance. The operational team has to ensure that every instrument is functioning, so that fieldwork can take place without any obstacles. A complete checklist is prepared so that no material is left behind. This checklist is useful during fieldwork as the team moves from one location to the other. List of instruments and materials are given in Table 5.1.
Table 5.1 List of Instruments and Materials to be Used During Forest Carbon Measurement
Particulars Use
GPS Boundary survey, stratification, location of plots
Base map Plot navigation and classification
Permanent plot establishment
Rope Delineation of plot boundary
Linear tape Locating plot boundary and distance measurement
Metal tags for plots and trees Permanent marking of trees and showing direction to permanent plot from different vantage points
Chalk Temporarily marking trees within boundary before permanent tagging
Spade Digging soil
Nails Placing the tags
Litter collection
Plastic zipped pouches Collecting samples of herbs, grass and leaf litter
Scissors Cutting herbs and grass
Weighing machine Weighing samples of herbs, grass and leaf litter
Soil sample collection
Metal scale Measuring soil depth
Soil sample core Collecting soil samples from 30 cm depth
Zipped pouches Collecting soil samples
Weighing machine Weighing samples of soil
Trowel Taking out soil core from soil depth
Height and Diameter measurement
Diameter tape Measuring the diameter of the tree at breast height (1.3 m)
Clinometer & Compass Measuring ground slope, top and bottom angle of tree
Altimeter, Vertex IV and Transponder Measuring tree height
Training Manual for Capacity Building of Assam Forest Dept. on Carbon Stock Assessment of Forests 29
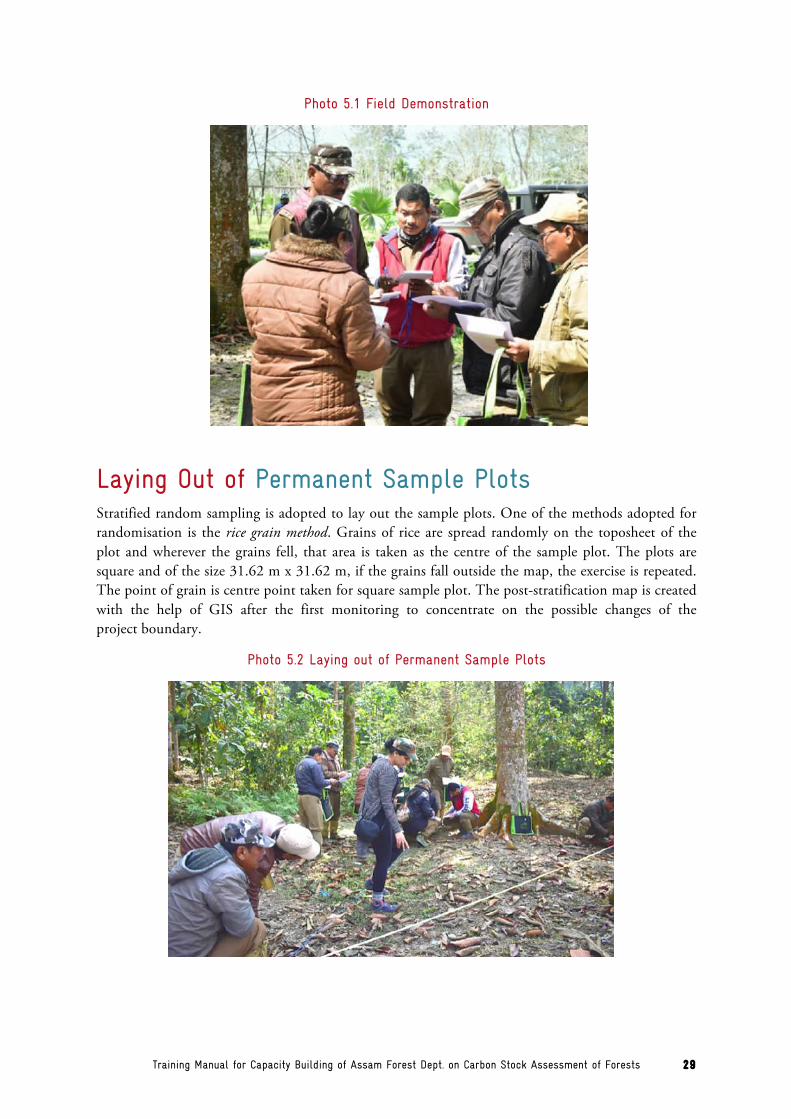
Photo 5.1 Field Demonstration
Laying Out of Permanent Sample Plots Stratified random sampling is adopted to lay out the sample plots. One of the methods adopted for randomisation is the rice grain method. Grains of rice are spread randomly on the toposheet of the plot and wherever the grains fell, that area is taken as the centre of the sample plot. The plots are square and of the size 31.62 m x 31.62 m, if the grains fall outside the map, the exercise is repeated. The point of grain is centre point taken for square sample plot. The post-stratification map is created with the help of GIS after the first monitoring to concentrate on the possible changes of the project boundary.
Photo 5.2 Laying out of Permanent Sample Plots

Training Manual for Capacity Building of Assam Forest Dept. on Carbon Stock Assessment of Forests 30
Center points of all plots must be marked permanently in the field using marks such as concrete pillars, metal rods, pipes, or stone poles. No matter what object is used for marking the centre, there is always a risk that it needs to be moved or removed. Therefore, the distances and bearing between the center and at least 3-4 permanent reference points (stones or trees) is recorded (as shown in the figure 5.1).
Figure 5.3 Referencing Centre of Plot
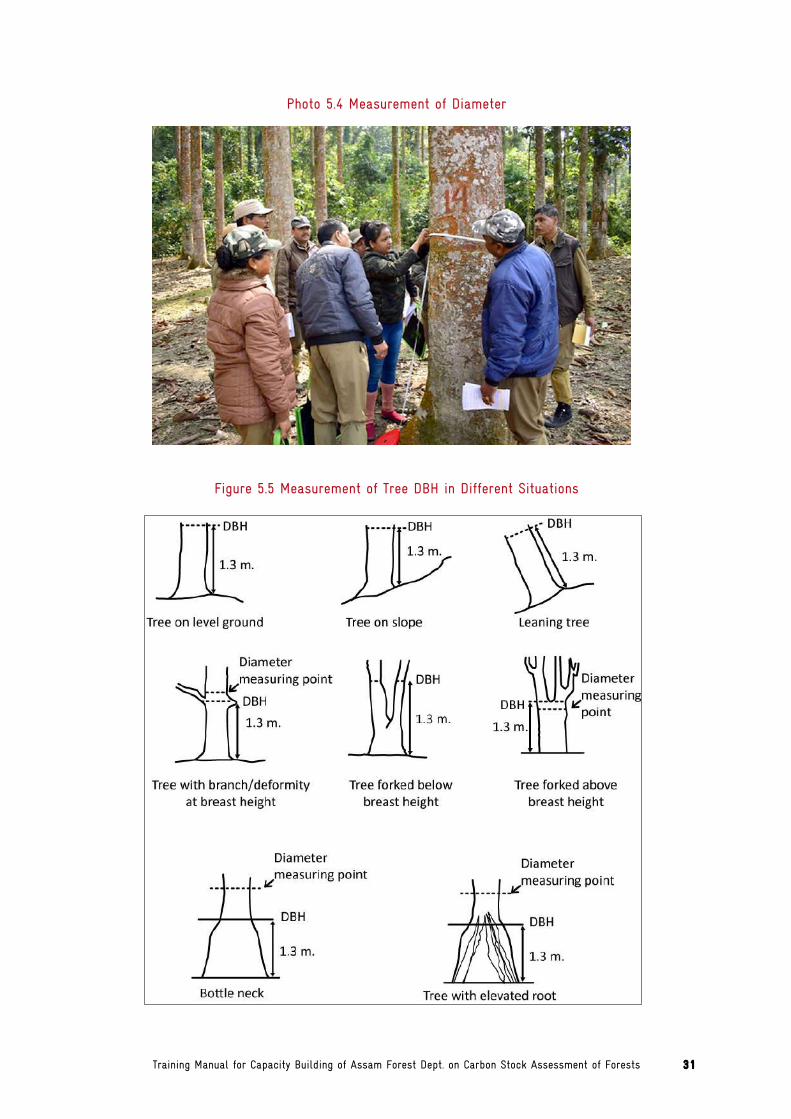
Measurement of Above Ground Biomass Measurement of tree diameter or girth and height Biomass of trees is estimated by following non-destructive method. The DBH (at 1.37m) and height of individual trees greater than or equal to 10 cm DBH are measured in each permanent square plot of 1000 m2 plot using diameter tape, altimeter and linear tape. The measurement of trees is started from the edge, moving inwards, and marking each tree to prevent accidentally counting it twice. Highly sensitive equipment such as Vertex IV and Transponder can also be used to measure tree height directly. Each tree is recorded individually, together with its species’ name if identification is possible. Trees on the border must be included if > 50% of their basal area falls within the plot and excluded if < 50% of their basal area falls outside the plot. Trees overhanging into the plot are excluded, but trees with their trunks inside the sampling plot and branches outside are included. For trees of an unusual shape, a standard forestry practice should be adopted (Karky and Banskota 2007; MacDicken 1997) before all sampling operations are carried out and applied to all plots. Diameter at breast height (DBH) is the basic measurement standard for trees. This measurement is recorded for all trees. (Note that, for stems with irregularities, measurement is carried out according to the principles illustrated in Figure 5.2.) For stems that fork from the ground, each individual stem is measured separately to indicate that they are part of the same tree. However, they are numbered by adding a letter suffix. Care should be taken to ensure that the diameter tape is put around the stem exactly at the indicated point of measurement.
Training Manual for Capacity Building of Assam Forest Dept. on Carbon Stock Assessment of Forests 31
Photo 5.4 Measurement of Diameter
Figure 5.5 Measurement of Tree DBH in Different Situations

Training Manual for Capacity Building of Assam Forest Dept. on Carbon Stock Assessment of Forests 32
Measurement of tree height Measuring tree height using stick
• The height of a tree can be measured by using the stick method. In this method, it is required to walk away from the tree until the base and top branches can easily be seen.
• The stick must be vertically held at arm’s length (straight elbow) over the view of the tree so that the markings on the stick that correspond with the branch tip and the base of the tree can be determined. The distance between these marks is proportional to the height of the tree. It is important that there is no movement of the head and body while reading the heights on the stick.
• The distance between the feet and the base of the tree and the distance at which the stick was from the eyes while taking the measurements will have to be determined.
• One can use a measuring stick (tape measure) to determine the distance between the eyes and the hand that held the stick. Alternatively, while holding the stick, one may also let a companion measure that distance.
• The distance to the tree can be measured with a tape measure. The three measurements mentioned below need to be recorded:
o The height of the tree on the measuring stick o The distance between the eyes and the stick o The distance from the base of the tree.
While making notes and calculations, it is important to record the units of measurement. The following relationship may be used to calculate the height of the trees:
Tree height = Distance to the tree × [the height of the tree on the stick] ÷ [distance between the eyes and the stick]
Figure 5.6 Measurement of Tree Height Using Stick Method
Training Manual for Capacity Building of Assam Forest Dept. on Carbon Stock Assessment of Forests 33
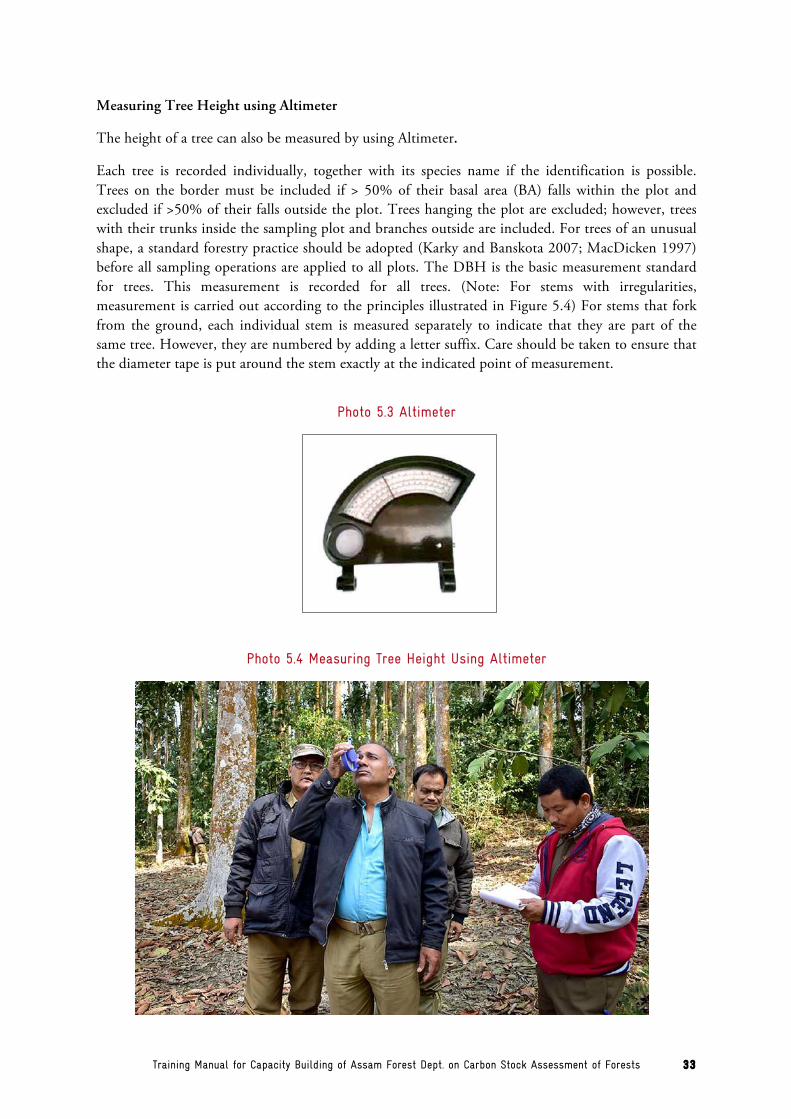
Measuring Tree Height using Altimeter
The height of a tree can also be measured by using Altimeter.
Each tree is recorded individually, together with its species name if the identification is possible. Trees on the border must be included if > 50% of their basal area (BA) falls within the plot and excluded if >50% of their falls outside the plot. Trees hanging the plot are excluded; however, trees with their trunks inside the sampling plot and branches outside are included. For trees of an unusual shape, a standard forestry practice should be adopted (Karky and Banskota 2007; MacDicken 1997) before all sampling operations are applied to all plots. The DBH is the basic measurement standard for trees. This measurement is recorded for all trees. (Note: For stems with irregularities, measurement is carried out according to the principles illustrated in Figure 5.4) For stems that fork from the ground, each individual stem is measured separately to indicate that they are part of the same tree. However, they are numbered by adding a letter suffix. Care should be taken to ensure that the diameter tape is put around the stem exactly at the indicated point of measurement.
Photo 5.3 Altimeter
Photo 5.4 Measuring Tree Height Using Altimeter
Training Manual for Capacity Building of Assam Forest Dept. on Carbon Stock Assessment of Forests 34
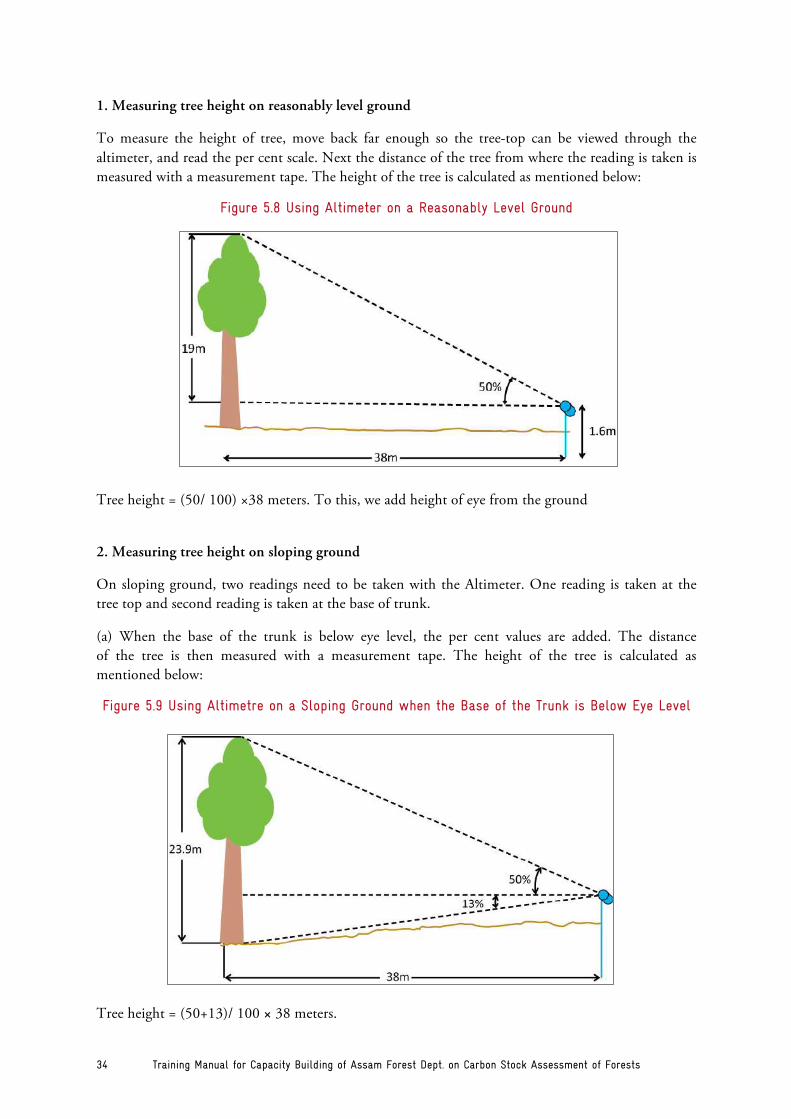
1. Measuring tree height on reasonably level ground
To measure the height of tree, move back far enough so the tree-top can be viewed through the altimeter, and read the per cent scale. Next the distance of the tree from where the reading is taken is measured with a measurement tape. The height of the tree is calculated as mentioned below:
Figure 5.8 Using Altimeter on a Reasonably Level Ground
Tree height = (50/ 100) ×38 meters. To this, we add height of eye from the ground
2. Measuring tree height on sloping ground
On sloping ground, two readings need to be taken with the Altimeter. One reading is taken at the tree top and second reading is taken at the base of trunk.
(a) When the base of the trunk is below eye level, the per cent values are added. The distance of the tree is then measured with a measurement tape. The height of the tree is calculated as mentioned below:
Figure 5.9 Using Altimetre on a Sloping Ground when the Base of the Trunk is Below Eye Level
Tree height = (50+13)/ 100 × 38 meters.

Training Manual for Capacity Building of Assam Forest Dept. on Carbon Stock Assessment of Forests 35
(b) When the base of the trunk is above eye level, the trunk base per cent is subtracted from the tree-top per cent. The distance of the tree is then measured with a measurement tape. The height of the tree is calculated as mentioned below:
Figure 5.10 Using Altimetre on a Sloping Ground when the Base of the Trunk is Above Eye Level
Tree height = (65-14)/ 100 × 38 meters
Estimation of Below Ground Biomass It is the most difficult pool to measure and generally not measured in forest inventory. However, it can be estimated by using IPCC default value of 0.27 in most of the cases which is basically a relationship between root (BGB) and Shoot (AGB) also known as root to shoot ratio. Good Practice Guidelines of IPCC provide ratios for six major global forest types. FSI has selectively used these defaults to estimate BGB.
Measurement of Bamboo Bamboo belongs to the family Poaceae. It is one of the fastest growing plants with the ability to survive in a wide variety of climatic and edaphic conditions. It plays an important role in carbon sequestration and bio-diversity conservation. The sampling design used for assessment of bamboo resources are a two stage stratified sampling. The data on bamboo is collected from each sample plot of forest inventory i.e. main square plot of 0.1 ha.
Clump forming bamboo For bamboo clump analysis, the information on total number of bamboo clumps and their respective diameters occurring in each 0.1 ha plot is recorded as shown in figure 5.7. The green (both sound and damaged) culms are further classified according to the age as current year culms (Karla), one to two year old culms (Mahila) and over two year old culms (Pakia). In case of dry and decayed culms (both sound as well as damaged), the age classification is not done. The culms are further grouped under different diameter (between 2nd and 3rd node) classes of 2cm to under 5cm, 5cm to under 8 cm and 8cm and above. These culms (three from each category) are harvested and the fresh weight is

Training Manual for Capacity Building of Assam Forest Dept. on Carbon Stock Assessment of Forests 36
measured in the field and sent to laboratory for drying to measure the dry weight. The average dry weight is calculated. The bamboo plots when multiplied with area factor gives the bamboo bearing area according to species and quality. The clump/ha is obtained according to species, quality and size classes. The number of culms per clump are counted and filled in the data collection form.
Figure 5.11 Sample Plot for Clump Forming Bamboo
Non-clump forming bamboo For non-clump forming bamboo, data on number of culms is selected from only 1/8th area of the plot touching the North west semi diagonal of the sample plot as shown in the Figure 5.8 below.
Figure 5.12 Sample Plot for Non-clump Forming Bamboo
Training Manual for Capacity Building of Assam Forest Dept. on Carbon Stock Assessment of Forests 37
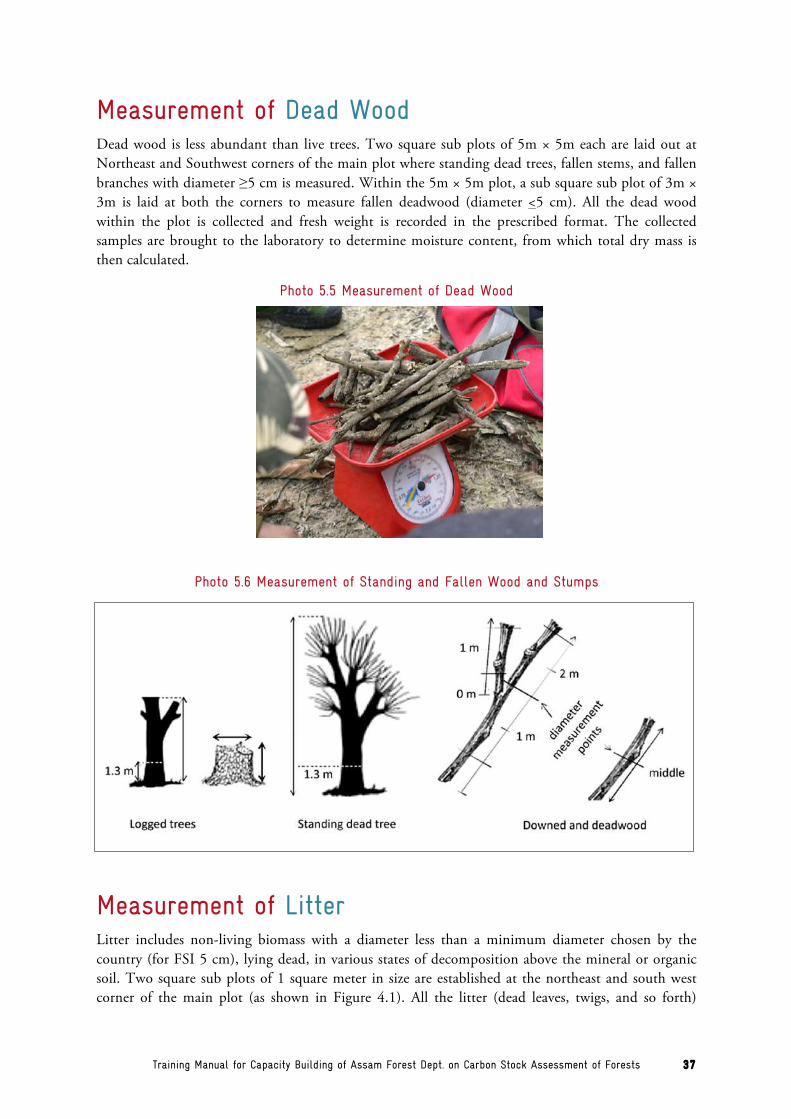
Measurement of Dead Wood Dead wood is less abundant than live trees. Two square sub plots of 5m × 5m each are laid out at Northeast and Southwest corners of the main plot where standing dead trees, fallen stems, and fallen branches with diameter ≥5 cm is measured. Within the 5m × 5m plot, a sub square sub plot of 3m × 3m is laid at both the corners to measure fallen deadwood (diameter <5 cm). All the dead wood within the plot is collected and fresh weight is recorded in the prescribed format. The collected samples are brought to the laboratory to determine moisture content, from which total dry mass is then calculated.
Photo 5.5 Measurement of Dead Wood
Photo 5.6 Measurement of Standing and Fallen Wood and Stumps
Measurement of Litter Litter includes non-living biomass with a diameter less than a minimum diameter chosen by the country (for FSI 5 cm), lying dead, in various states of decomposition above the mineral or organic soil. Two square sub plots of 1 square meter in size are established at the northeast and south west corner of the main plot (as shown in Figure 4.1). All the litter (dead leaves, twigs, and so forth)
Training Manual for Capacity Building of Assam Forest Dept. on Carbon Stock Assessment of Forests 38
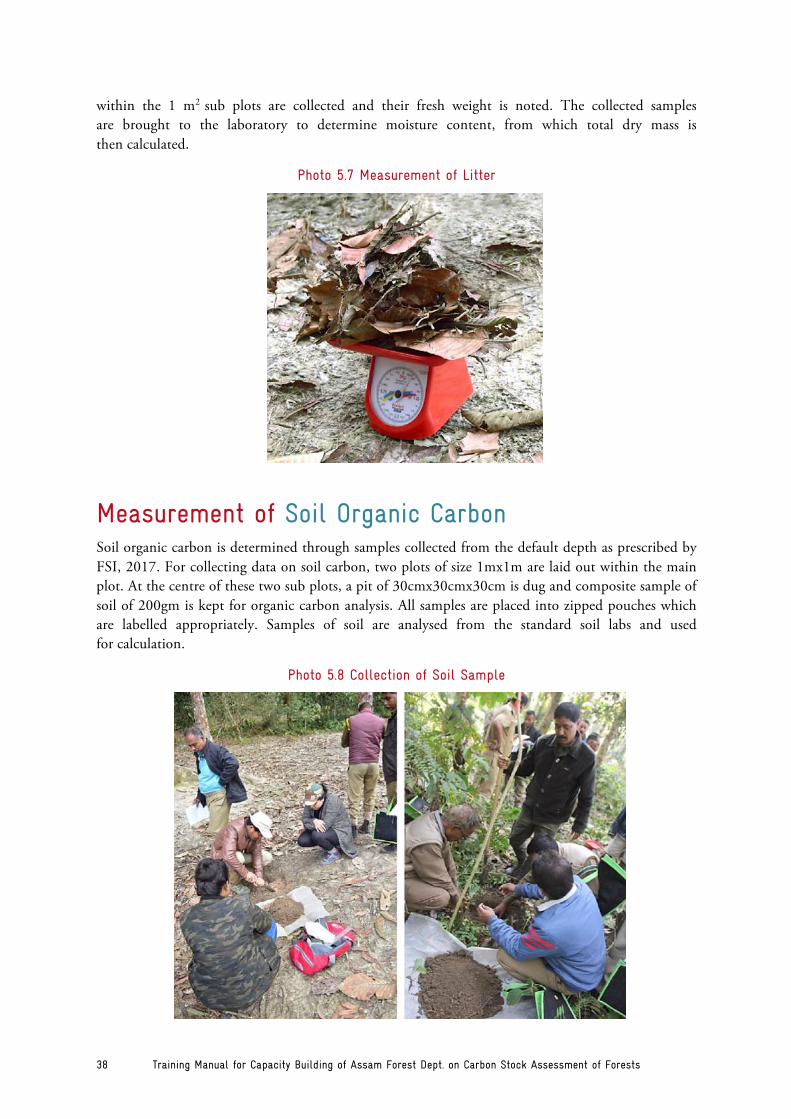
within the 1 m2 sub plots are collected and their fresh weight is noted. The collected samples are brought to the laboratory to determine moisture content, from which total dry mass is then calculated.
Photo 5.7 Measurement of Litter
Measurement of Soil Organic Carbon Soil organic carbon is determined through samples collected from the default depth as prescribed by FSI, 2017. For collecting data on soil carbon, two plots of size 1mx1m are laid out within the main plot. At the centre of these two sub plots, a pit of 30cmx30cmx30cm is dug and composite sample of soil of 200gm is kept for organic carbon analysis. All samples are placed into zipped pouches which are labelled appropriately. Samples of soil are analysed from the standard soil labs and used for calculation.
Photo 5.8 Collection of Soil Sample
Training Manual for Capacity Building of Assam Forest Dept. on Carbon Stock Assessment of Forests 39
Chapter 6. Data Analysis
When data collection for all the five carbon pools is completed, data analysis is the next major task to be accomplished. Analysis of all the carbon pools has been explained in this section.
Above Ground Biomass The selection of the appropriate allometric equation is a crucial step in estimating aboveground tree biomass (AGB). An allometric equation is a statistical relationship between key characteristic dimension(s) of trees that are fairly easy to measure, such as DBH or height, and other properties that are more difficult to assess, such as above-ground biomass. Allometric equations are established in a purely empirical way on the basis of exact measurements from a relatively large sample of typical trees. They permit an estimate of quantities that are difficult or costly to measure on the basis of a single (or at most a few) measurement. Allometric equations for biomass usually include information on trunk diameter at breast height DBH (in cm), total tree height H (in m), and wood-specific gravity (in g/cm³).
Above Ground Biomass (AGB) = Volume × Wood Density (WD) × Biomass Expansion Factor (BEF) BEF value
Open Forest – 1.14 Moderately dense forest – 2.5 Dense Forest – 3.4
After taking the sum of all the individual weights (in kg) of a sampling plot and dividing it by the area of a sampling plot (1000 m2), the biomass stock density is attained in kg m-2. This value can be converted to tha-1 by multiplying it by 10. Since the pilot areas are part of the tropical and sub-tropical region, the biomass stock density of a sampling plot will be converted to carbon stock densities after multiplication with the IPCC (2006) default carbon fraction of 0.47.
Below Ground Biomass One of the most common descriptors of the relationship between root (below-ground) and shoot (above-ground) biomass is the root-to-shoot ratio, which has become the standard method for estimating root biomass from the more easily measured shoot biomass. Belowground biomass estimation is much more difficult and time consuming than estimating aboveground biomass. Measurements of root biomass are indeed highly uncertain, and the lack of empirical values for this type of biomass has for decades been a major weakness in ecosystem models (Geider et al. 2001). To simplify the process for estimating below-ground biomass, it is recommended to estimate below-ground biomass as 27% of above-ground tree biomass.

Training Manual for Capacity Building of Assam Forest Dept. on Carbon Stock Assessment of Forests 40
BGB = AGB × 0.27 (IPCC Default value)
Where:
BGB = Below Ground Biomass and AGB = Above Ground Biomass
Dead Wood Deadwood biomass is estimated from the dry weight as obtained from the laboratory. Dry biomass weight is calculated from the plot separately, and then calculating on per ha basis. The amount of biomass per unit area is given as mentioned in the equation given below. Multiplying the biomass by 0.47, we can get the carbon stock present in deadwood.
DW = wfresh/A x wdry /wfresh × 1/1000
Where,
DW= biomass of deadwood Wfresh = weight of fresh field sample A = Size of the area Wdry = Weight of oven dry sample
Litter To determine the biomass of litter, herbs, and grass, samples are taken from the field within a small area of 1 m2. Fresh samples are weighed in the field and a well-mixed sub-sample is then placed in a marked bag. The sample is taken to the laboratory and oven dried until constant weight to determine water content. For the forest floor (herbs, grass, and litter), the amount of biomass per unit area is given by:
L = wfresh/A × wdry /wfresh × 1/1000
Where,
L = biomass of litter Wfresh = weight of fresh field sample A = Size of the area Wdry = Weight of oven dry sample
Soil Organic Carbon Soil samples are collected at 0-30 cm depth. Samples of exactly 200gm are taken and transferred to pre-weighed sampling bags. Subsequently, samples are transported to the laboratory and oven dried (70⁰ C) until constant weight to determine water content. Samples collected are composted and well-mixed per sampling plot and then prepared for carbon measurement by removing stones and plant residue > 2mm as well as by grinding. The carbon stock density of soil organic carbon is calculated as (Pearson et. al 2007):
Training Manual for Capacity Building of Assam Forest Dept. on Carbon Stock Assessment of Forests 41
SOC = rb × d × %C
Where,
SOC = soil organic carbon stock per unit area (t/ha) rb = soil bulk density (g/cm3) – Default value is 1.2 d = total depth at which sample is taken (cm) %C = carbon concentration
Total Carbon Stock Density The carbon stock density is calculated by summing the carbon stock densities of the individual carbon pools of that stratum using the following formula. It should be noted that any individual carbon pool of the given formula can be ignored if it does not contribute significantly to the total carbon stock.
C = CAGB + CBGB + CL + CDW + SOC
Where
C = carbon stock density C(AGB) = carbon in Above Ground Biomass C(BGB) = carbon in Below Ground Biomass C(L) = carbon in litter C(DW) = carbon in deadwood SOC = soil organic carbon
The total carbon stock is then converted to tons of CO2 equivalent by multiplying it by 44/12, or 3.67 (Pearson et al. 2007).
Training Manual for Capacity Building of Assam Forest Dept. on Carbon Stock Assessment of Forests 42
Bibliography
1. Bhishma P. Subedi, Shiva Shankar Pandey, Ajay Pandey, Eak Bahadur Rana, Sanjeeb Bhattarai, Tibendra Raj Banskota, Shambhu Charmakar, Rijan Tamrakar. (2011). Forest carbon stock measurements. Guidelines for measuring carbon stocks in community managed forest. ANASAB, FCF and ICIMOD, Kathmandu, Nepal.
2. Brown, S. (1997). Estimating biomass and biomass change of tropical forests. A primer. FAO Forestry Paper 134. Food and Agriculture Organisation of the United Nation, Rome, Italy.
3. CIFOR, World Agroforestry Centre and USAID. (2009). Assessing the implications of Climate change.
4. Chauhan S., Saxena A. (2012). Policy paper on ‗Methodology for Assessing Carbon Stock for REDD+ Projects in India‘. New Delhi, India: TERI.
5. Chaturvedi A.N. and Khanna L.S. (1982). Forest Mensuration and Biometry, Measurement of volume of trees. 364 pp.
6. Food and Agricultural Organisation. (2010). Global Forest Resources Assessment 2010. Rome, Italy.
7. Forest Survey of India. (2017). India State of Forest Survey Report, 2017.New Delhi: FSI, Ministry of Environment of Forests & Climate Change (MoEF&CC) Government of India.
8. Forest Survey of India. (2011). India State of Forest Survey Report, 2011.New Delhi: FSI, Ministry of Environment of Forests (MoEF) Government of India.
9. Forest Survey of India. (1996). Volume Equations for Forests of India, Nepal and Bhutan. New Delhi: MoEF, Government of India. p. 249.
10. Geider, et al. (2001) Primary productivity of planet earth: biological determinants and physical constraints in terrestrial and aquatic habitats. Global Climate biology, 849-882
11. Gera M., Chauhan S. 2010. Opportunities for carbon sequestration benefits from growing trees of medicinal importance on farmlands of Haryana. The Indian Forester, vol. 136 (1):287-300.
12. IPCC. (2006). Good Practices Guidelines for National Greenhouse Gas Inventories. Switzerland: Intergovernmental Panel on Climate Change.
13. Mohan Kumar, B & Rajesh, G & Sudheesh, K.G.. (2005). Aboveground biomass production and nutrient uptake of thorny bamboo [Bambusa bambos (L.) Voss] in the homegardens of Thrissur, Kerala. Journal of Tropical Agriculture. 43. 51–56.
Training Manual for Capacity Building of Assam Forest Dept. on Carbon Stock Assessment of Forests 43
14. Kurniatun Hairiah, Sonya Dewi, Fahmuddin Agus, Sandra Velarde, Andree Ekadinata, Subekti Rahayu and Meine van Noordwijk. (2010). Measuring carbon stocks across land use systems - A Manual. World Agroforestry Centre (ICRAF), SEA Regional Office, Indonesia: 155pp.
15. National Working Plan Code. (2014). Ministry of Environment, Forests and Climate Change, Government of India.
16. Pearson, T., Walker, S. and Brown, S. (2005). Sourcebook for Land Use, Land-Use Change and Forestry Projects. Winrock International and the Bio Carbon Fund of the World Bank.
17. Pearson, T R, Brown, S L, Birdsey, R A. (2007). Measurement guidelines for the sequestration of forest carbon. U.S.: Northern research Station, Department of Agriculture.
18. Reyes G, Brown S, Chapman J, and Lugo A E. (1992). Wood Densities of Tropical Tree Species. US Department of Agriculture Forest Service, New Orleans.
19. Timothy Pearson, Sarah Walker and Sandra Brown (2005). Sourcebook for land use, land use change and forestry projects. Winrock International.
20. UNFCCC (2009) Calculation of the number of sample plots for measurements with A/R CDM project activities version 02.
21. VCS (2017) Voluntary Carbon Standard: Guidance for Agriculture and Other Landuse Projects. USA: VCS-AFOLU
Training Manual for Capacity Building of Assam Forest Dept. on Carbon Stock Assessment of Forests 44
Glossary
Above Ground Biomass: The AGB carbon pool consists of all living vegetation above the soil, inclusive of stems, stumps, branches, bark, seeds and foliage
Below-ground Tree Biomass: The BGB carbon pool consists of the biomass contained within live roots
Biomass: Forest biomass is organic matter expressed as oven-dry tonnes per unit area: It can be referred to as biomass density when expressed as mass per unit area. Approximately 50% of dry forest biomass is carbon.
Canopy: The cover of branches and foliage formed by the crowns of trees.
Canopy Cover: The percentage of the ground covered by a vertical projection of the outermost perimeter of the natural spread of the foliage of plants.
Carbon Pool: Carbon pools are major components of and ecosystem that can either accumulate or release carbon.
Confidence Interval: A measure of the spread of data. The confidence interval gives a range of values in which there is a percentage probability (usually 95%) of the true mean occurring. Calculated by multiplying the standard error by the appropriate t-value.
Dead Organic Matter: The DOM carbon pool contains all non-living woody biomass and can be divided into wood (fallen trees, roots and stumps with diameter over 10cm) and litter (greater than2 mm and less than 10cm diameter) components.
Dense Forest: All lands with a forest cover having canopy density of 40 percent and above.
False Color Composite: The image generated by projecting any three spectral bands of the satellite data on the red, green and blue channels and does not show features in true colours.
Forests: All land with a canopy cover of greater than 10-30% (dependent upon national definition of forest). Can include natural forest, plantation, forested wetland and mangrove.
Forest Area: The area recorded as a forest in the Government records. It is also referred to as “Recorded forest area”.
Forest Cover: All lands, more than one hectare in area, with a tree canopy density of more than 10 per cent irrespective of ownership and legal status. Such lands may not necessarily be a recorded forest area. It also includes orchard, bamboo and palm.
Geographic Information System (GIS): A computer based system for capturing, storing, mani-pulating, analysing and displaying data, which are spatially referenced to the earth.
Growing Stock: The sum (by number or volume) of all the trees growing/living in the forest or a specified part of it.
Training Manual for Capacity Building of Assam Forest Dept. on Carbon Stock Assessment of Forests 45
Land Cover: Broad land use classes interpreted from satellite data. It includes very dense forest, moderately dense forest, open forest, scrub and non-forest.
Leakage: The loss of carbon outside the boundaries of the project as a result of project activities.
Litter: Woody material of trees having diameter <5cm which is not decomposed.
Moderately Dense Forest: All lands with forest cover having a canopy density between 40 to 70 percent.
Non Forest Land: Land without forest cover
Open Forest: Lands with forest cover having a canopy density between 10 to 40 percent.
Sequestration: The process of increasing the carbon stock in an ecosystem.
Soil Organic Matter: The SOM carbon pool is divided into mineral and organic soil carbon and contains biomass less than 2 mm diameter
Stratification: Stratification is the division of the area into more homogenous units of carbon density. The purpose of stratification is to increase the accuracy and precision of accounting by reducing field data variability.
Thematic Maps: Maps, generally on 150,000 scale, showing forest types, major species composition, crown density and other land uses prepared by interpretation of aerial photographs and verified by ground truthing.
Tree: A large woody perennial plant having a single well defined stem (bole or trunk) and a more or less definite crown. It also includes bamboos, palms, fruit trees, etc. and excludes non-perennial non-woody species like banana and tall shrubs or climbers. For the purpose of assessing growing stock and tree cover, only those trees having diameter at breast height (DBH) of 10 cm or more is measured.
Trees Outside Forests (TOF): Trees growing outside recorded forest areas
Very Dense Forest: Lands with forest cover having a canopy density of 70 per cent and above.
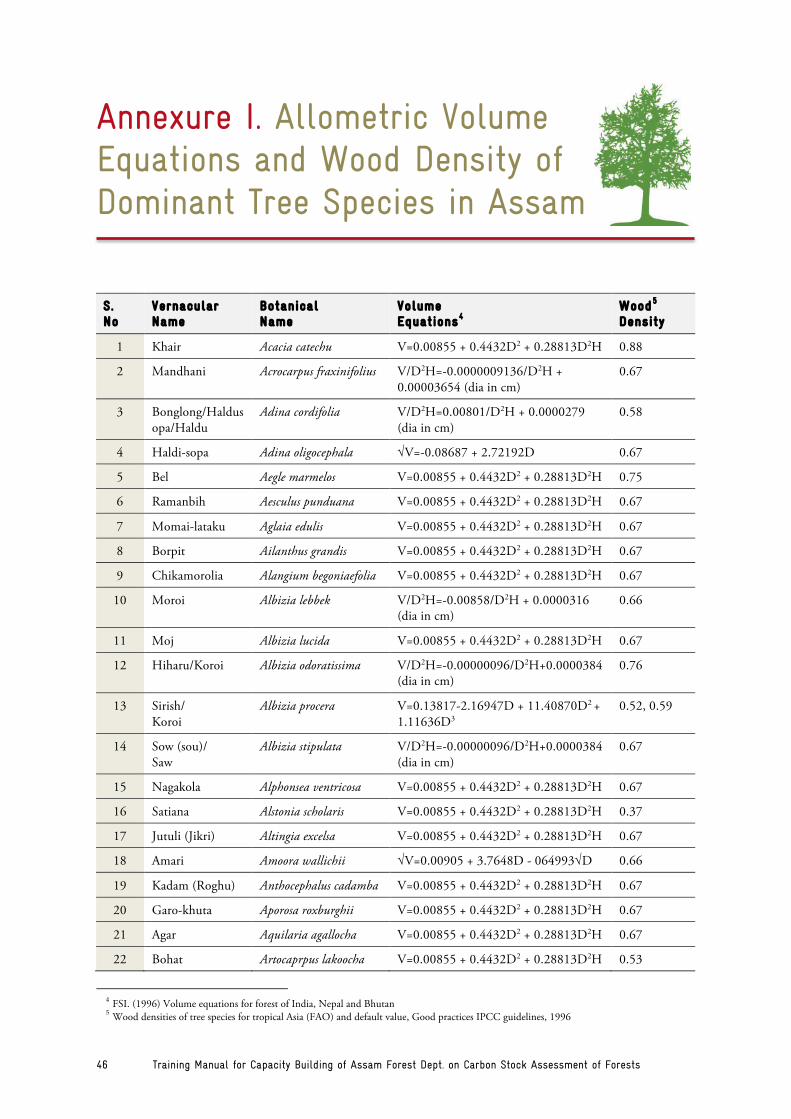
Training Manual for Capacity Building of Assam Forest Dept. on Carbon Stock Assessment of Forests 46
Annexure I. Allometric Volume Equations and Wood Density of Dominant Tree Species in Assam
S. No
Vernacular Name
Botanical Name
Volume Equations4
Wood5 Density
1 Khair Acacia catechu V=0.00855 + 0.4432D2 + 0.28813D2H 0.88
2 Mandhani Acrocarpus fraxinifolius V/D2H=-0.0000009136/D2H + 0.00003654 (dia in cm)
0.67
3 Bonglong/Haldusopa/Haldu
Adina cordifolia V/D2H=0.00801/D2H + 0.0000279 (dia in cm)
0.58
4 Haldi-sopa Adina oligocephala √V=-0.08687 + 2.72192D 0.67
5 Bel Aegle marmelos V=0.00855 + 0.4432D2 + 0.28813D2H 0.75
6 Ramanbih Aesculus punduana V=0.00855 + 0.4432D2 + 0.28813D2H 0.67
7 Momai-lataku Aglaia edulis V=0.00855 + 0.4432D2 + 0.28813D2H 0.67
8 Borpit Ailanthus grandis V=0.00855 + 0.4432D2 + 0.28813D2H 0.67
9 Chikamorolia Alangium begoniaefolia V=0.00855 + 0.4432D2 + 0.28813D2H 0.67
10 Moroi Albizia lebbek V/D2H=-0.00858/D2H + 0.0000316 (dia in cm)
0.66
11 Moj Albizia lucida V=0.00855 + 0.4432D2 + 0.28813D2H 0.67
12 Hiharu/Koroi Albizia odoratissima V/D2H=-0.00000096/D2H+0.0000384 (dia in cm)
0.76
13 Sirish/ Koroi
Albizia procera V=0.13817-2.16947D + 11.40870D2 + 1.11636D3
0.52, 0.59
14 Sow (sou)/ Saw
Albizia stipulata V/D2H=-0.00000096/D2H+0.0000384 (dia in cm)
0.67
15 Nagakola Alphonsea ventricosa V=0.00855 + 0.4432D2 + 0.28813D2H 0.67
16 Satiana Alstonia scholaris V=0.00855 + 0.4432D2 + 0.28813D2H 0.37
17 Jutuli (Jikri) Altingia excelsa V=0.00855 + 0.4432D2 + 0.28813D2H 0.67
18 Amari Amoora wallichii √V=0.00905 + 3.7648D - 064993√D 0.66
19 Kadam (Roghu) Anthocephalus cadamba V=0.00855 + 0.4432D2 + 0.28813D2H 0.67
20 Garo-khuta Aporosa roxburghii V=0.00855 + 0.4432D2 + 0.28813D2H 0.67
21 Agar Aquilaria agallocha V=0.00855 + 0.4432D2 + 0.28813D2H 0.67
22 Bohat Artocaprpus lakoocha V=0.00855 + 0.4432D2 + 0.28813D2H 0.53
4 FSI. (1996) Volume equations for forest of India, Nepal and Bhutan 5 Wood densities of tree species for tropical Asia (FAO) and default value, Good practices IPCC guidelines, 1996
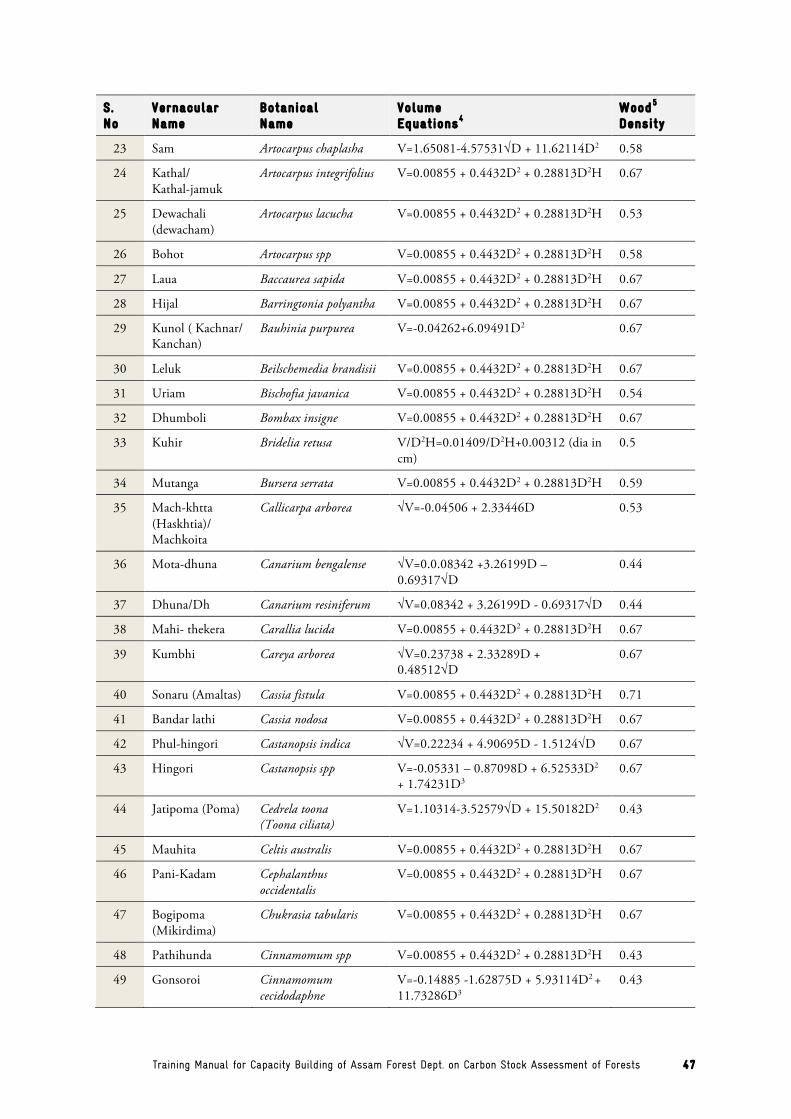
Training Manual for Capacity Building of Assam Forest Dept. on Carbon Stock Assessment of Forests 47
S . No
Vernacular Name
Botanical Name
Volume Equations4
Wood5 Density
23 Sam Artocarpus chaplasha V=1.65081-4.57531√D + 11.62114D2 0.58
24 Kathal/ Kathal-jamuk
Artocarpus integrifolius V=0.00855 + 0.4432D2 + 0.28813D2H 0.67
25 Dewachali (dewacham)
Artocarpus lacucha V=0.00855 + 0.4432D2 + 0.28813D2H 0.53
26 Bohot Artocarpus spp V=0.00855 + 0.4432D2 + 0.28813D2H 0.58
27 Laua Baccaurea sapida V=0.00855 + 0.4432D2 + 0.28813D2H 0.67
28 Hijal Barringtonia polyantha V=0.00855 + 0.4432D2 + 0.28813D2H 0.67
29 Kunol ( Kachnar/ Kanchan)
Bauhinia purpurea V=-0.04262+6.09491D2 0.67
30 Leluk Beilschemedia brandisii V=0.00855 + 0.4432D2 + 0.28813D2H 0.67
31 Uriam Bischofia javanica V=0.00855 + 0.4432D2 + 0.28813D2H 0.54
32 Dhumboli Bombax insigne V=0.00855 + 0.4432D2 + 0.28813D2H 0.67
33 Kuhir Bridelia retusa V/D2H=0.01409/D2H+0.00312 (dia in cm)
0.5
34 Mutanga Bursera serrata V=0.00855 + 0.4432D2 + 0.28813D2H 0.59
35 Mach-khtta (Haskhtia)/ Machkoita
Callicarpa arborea √V=-0.04506 + 2.33446D 0.53
36 Mota-dhuna Canarium bengalense √V=0.0.08342 +3.26199D – 0.69317√D
0.44
37 Dhuna/Dh Canarium resiniferum √V=0.08342 + 3.26199D - 0.69317√D 0.44
38 Mahi- thekera Carallia lucida V=0.00855 + 0.4432D2 + 0.28813D2H 0.67
39 Kumbhi Careya arborea √V=0.23738 + 2.33289D + 0.48512√D
0.67
40 Sonaru (Amaltas) Cassia fistula V=0.00855 + 0.4432D2 + 0.28813D2H 0.71
41 Bandar lathi Cassia nodosa V=0.00855 + 0.4432D2 + 0.28813D2H 0.67
42 Phul-hingori Castanopsis indica √V=0.22234 + 4.90695D - 1.5124√D 0.67
43 Hingori Castanopsis spp V=-0.05331 – 0.87098D + 6.52533D2
+ 1.74231D3 0.67
44 Jatipoma (Poma) Cedrela toona (Toona ciliata)
V=1.10314-3.52579√D + 15.50182D2 0.43
45 Mauhita Celtis australis V=0.00855 + 0.4432D2 + 0.28813D2H 0.67
46 Pani-Kadam Cephalanthus occidentalis
V=0.00855 + 0.4432D2 + 0.28813D2H 0.67
47 Bogipoma (Mikirdima)
Chukrasia tabularis V=0.00855 + 0.4432D2 + 0.28813D2H 0.67
48 Pathihunda Cinnamomum spp V=0.00855 + 0.4432D2 + 0.28813D2H 0.43
49 Gonsoroi Cinnamomum cecidodaphne
V=-0.14885 -1.62875D + 5.93114D2 + 11.73286D3
0.43
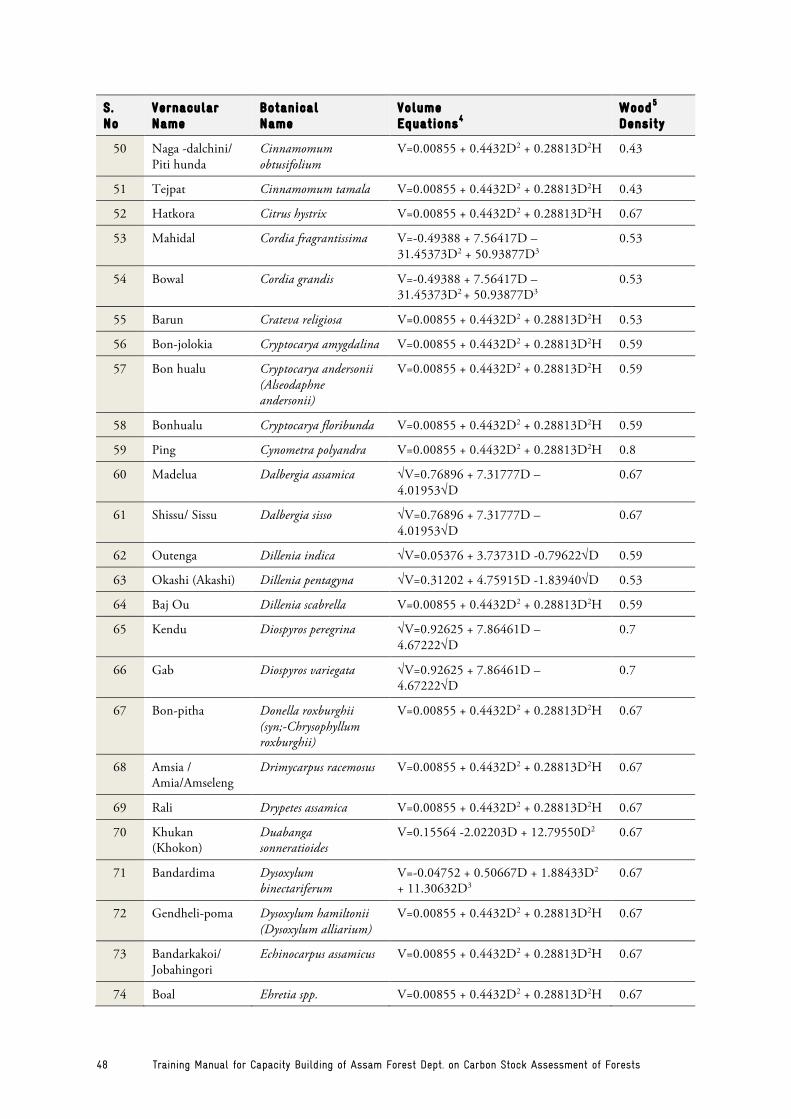
Training Manual for Capacity Building of Assam Forest Dept. on Carbon Stock Assessment of Forests 48
S . No
Vernacular Name
Botanical Name
Volume Equations4
Wood5 Density
50 Naga -dalchini/ Piti hunda
Cinnamomum obtusifolium
V=0.00855 + 0.4432D2 + 0.28813D2H 0.43
51 Tejpat Cinnamomum tamala V=0.00855 + 0.4432D2 + 0.28813D2H 0.43
52 Hatkora Citrus hystrix V=0.00855 + 0.4432D2 + 0.28813D2H 0.67
53 Mahidal Cordia fragrantissima V=-0.49388 + 7.56417D – 31.45373D2 + 50.93877D3
0.53
54 Bowal Cordia grandis V=-0.49388 + 7.56417D – 31.45373D2 + 50.93877D3
0.53
55 Barun Crateva religiosa V=0.00855 + 0.4432D2 + 0.28813D2H 0.53
56 Bon-jolokia Cryptocarya amygdalina V=0.00855 + 0.4432D2 + 0.28813D2H 0.59
57 Bon hualu Cryptocarya andersonii (Alseodaphne andersonii)
V=0.00855 + 0.4432D2 + 0.28813D2H 0.59
58 Bonhualu Cryptocarya floribunda V=0.00855 + 0.4432D2 + 0.28813D2H 0.59
59 Ping Cynometra polyandra V=0.00855 + 0.4432D2 + 0.28813D2H 0.8
60 Madelua Dalbergia assamica √V=0.76896 + 7.31777D – 4.01953√D
0.67
61 Shissu/ Sissu Dalbergia sisso √V=0.76896 + 7.31777D – 4.01953√D
0.67
62 Outenga Dillenia indica √V=0.05376 + 3.73731D -0.79622√D 0.59
63 Okashi (Akashi) Dillenia pentagyna √V=0.31202 + 4.75915D -1.83940√D 0.53
64 Baj Ou Dillenia scabrella V=0.00855 + 0.4432D2 + 0.28813D2H 0.59
65 Kendu Diospyros peregrina √V=0.92625 + 7.86461D – 4.67222√D
0.7
66 Gab Diospyros variegata √V=0.92625 + 7.86461D – 4.67222√D
0.7
67 Bon-pitha Donella roxburghii (syn;-Chrysophyllum roxburghii)
V=0.00855 + 0.4432D2 + 0.28813D2H 0.67
68 Amsia / Amia/Amseleng
Drimycarpus racemosus V=0.00855 + 0.4432D2 + 0.28813D2H 0.67
69 Rali Drypetes assamica V=0.00855 + 0.4432D2 + 0.28813D2H 0.67
70 Khukan (Khokon)
Duabanga sonneratioides
V=0.15564 -2.02203D + 12.79550D2 0.67
71 Bandardima Dysoxylum binectariferum
V=-0.04752 + 0.50667D + 1.88433D2
+ 11.30632D3 0.67
72 Gendheli-poma Dysoxylum hamiltonii (Dysoxylum alliarium)
V=0.00855 + 0.4432D2 + 0.28813D2H 0.67
73 Bandarkakoi/ Jobahingori
Echinocarpus assamicus V=0.00855 + 0.4432D2 + 0.28813D2H 0.67
74 Boal Ehretia spp. V=0.00855 + 0.4432D2 + 0.28813D2H 0.67
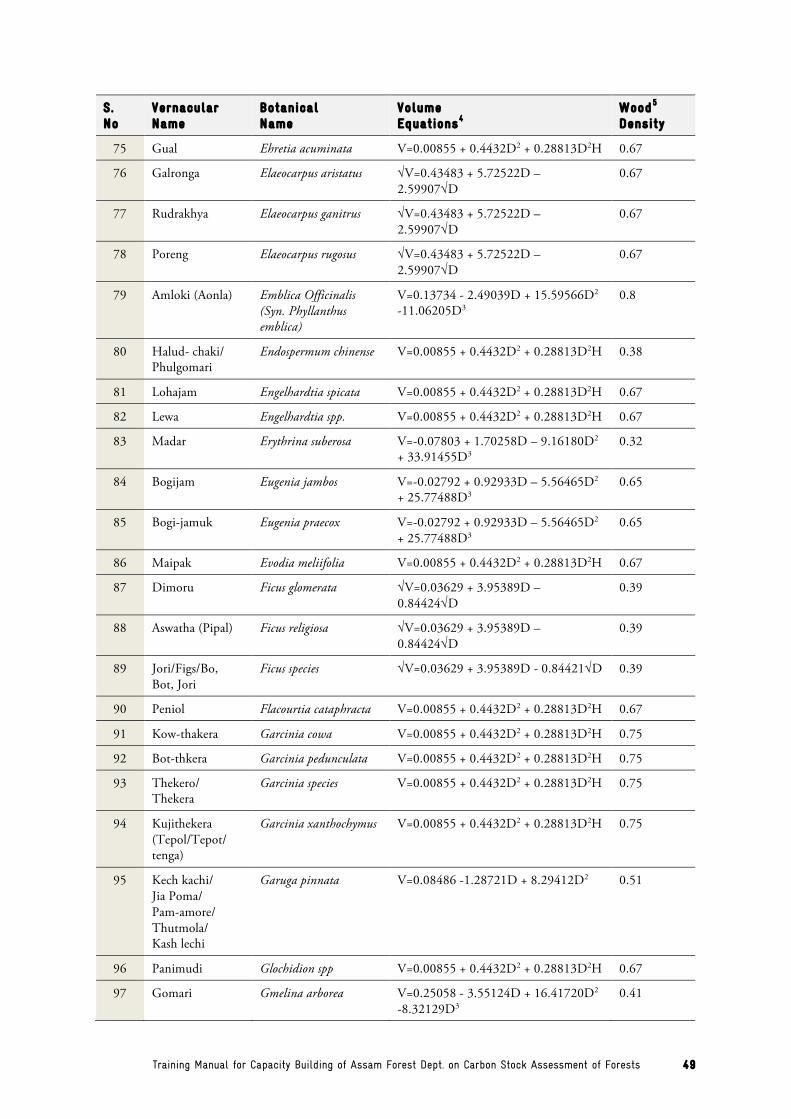
Training Manual for Capacity Building of Assam Forest Dept. on Carbon Stock Assessment of Forests 49
S . No
Vernacular Name
Botanical Name
Volume Equations4
Wood5 Density
75 Gual Ehretia acuminata V=0.00855 + 0.4432D2 + 0.28813D2H 0.67
76 Galronga Elaeocarpus aristatus √V=0.43483 + 5.72522D – 2.59907√D
0.67
77 Rudrakhya Elaeocarpus ganitrus √V=0.43483 + 5.72522D – 2.59907√D
0.67
78 Poreng Elaeocarpus rugosus √V=0.43483 + 5.72522D – 2.59907√D
0.67
79 Amloki (Aonla) Emblica Officinalis (Syn. Phyllanthus emblica)
V=0.13734 - 2.49039D + 15.59566D2
-11.06205D3 0.8
80 Halud- chaki/ Phulgomari
Endospermum chinense V=0.00855 + 0.4432D2 + 0.28813D2H 0.38
81 Lohajam Engelhardtia spicata V=0.00855 + 0.4432D2 + 0.28813D2H 0.67
82 Lewa Engelhardtia spp. V=0.00855 + 0.4432D2 + 0.28813D2H 0.67
83 Madar Erythrina suberosa V=-0.07803 + 1.70258D – 9.16180D2 + 33.91455D3
0.32
84 Bogijam Eugenia jambos V=-0.02792 + 0.92933D – 5.56465D2
+ 25.77488D3 0.65
85 Bogi-jamuk Eugenia praecox V=-0.02792 + 0.92933D – 5.56465D2
+ 25.77488D3 0.65
86 Maipak Evodia meliifolia V=0.00855 + 0.4432D2 + 0.28813D2H 0.67
87 Dimoru Ficus glomerata √V=0.03629 + 3.95389D – 0.84424√D
0.39
88 Aswatha (Pipal) Ficus religiosa √V=0.03629 + 3.95389D – 0.84424√D
0.39
89 Jori/Figs/Bo, Bot, Jori
Ficus species √V=0.03629 + 3.95389D - 0.84421√D 0.39
90 Peniol Flacourtia cataphracta V=0.00855 + 0.4432D2 + 0.28813D2H 0.67
91 Kow-thakera Garcinia cowa V=0.00855 + 0.4432D2 + 0.28813D2H 0.75
92 Bot-thkera Garcinia pedunculata V=0.00855 + 0.4432D2 + 0.28813D2H 0.75
93 Thekero/ Thekera
Garcinia species V=0.00855 + 0.4432D2 + 0.28813D2H 0.75
94 Kujithekera (Tepol/Tepot/ tenga)
Garcinia xanthochymus V=0.00855 + 0.4432D2 + 0.28813D2H 0.75
95 Kech kachi/ Jia Poma/ Pam-amore/ Thutmola/ Kash lechi
Garuga pinnata V=0.08486 -1.28721D + 8.29412D2 0.51
96 Panimudi Glochidion spp V=0.00855 + 0.4432D2 + 0.28813D2H 0.67
97 Gomari Gmelina arborea V=0.25058 - 3.55124D + 16.41720D2
-8.32129D3 0.41

Training Manual for Capacity Building of Assam Forest Dept. on Carbon Stock Assessment of Forests 50
S . No
Vernacular Name
Botanical Name
Volume Equations4
Wood5 Density
98 Kukur-huta Grewia multiflora V=0.00855 + 0.4432D2 + 0.28813D2H 0.46
99 Dalmugra Gynocardia odorata V=0.00855 + 0.4432D2 + 0.28813D2H 0.67
100 Dhamin Heritiera macrophylla V=0.00855 + 0.4432D2 + 0.28813D2H 0.56
101 Dhopa-paruli Heterophragma adenophyllum
V=0.00855 + 0.4432D2 + 0.28813D2H 0.67
102 Chamia/ Pahu udal
Hibiscus macrophyllus V=0.00855 + 0.4432D2 + 0.28813D2H 0.67
103 Dudhhkuri Holarrhena antidysenterica
V=0.17994 -2.78776D + 14.44961D2 0.67
104 Chtiabola Hovenia dulcis V=0.00855 + 0.4432D2 + 0.28813D2H 0.67
105 Panidodam Hymenodictyon excelsum V/D2=0.15698/D2_ 2.75681/D + 14.19521
0.67
106 Keseru Heteropanax fragrans V=0.00855 + 0.4432D2 + 0.28813D2H 0.67
107 Sia Nahor Kayea assamica V=0.00855 + 0.4432D2 + 0.28813D2H 0.67
108 Tamser (higuri) Kurrimia pulcherrima V=0.00855 + 0.4432D2 + 0.28813D2H 0.67
109 Pinchola Kydia calycina V=0.00855 + 0.4432D2 + 0.28813D2H 0.72
110 Ajhar (Jarul) Lagerstroemia flos-reginae
V=0.11740 – 1.58941D + 9.76464D2 0.55
111 Sida Lagerstroemia parviflora V=-0.152267 + 0.3194D2H 0.62
112 Jai-poma/Jhigan/ Ruhimola
Lannea grandis V=0.00855 + 0.4432D2 + 0.28813D2H 0.5
113 Soratgach Laportea pleurostigma V=0.00855 + 0.4432D2 + 0.28813D2H 0.67
114 Hoanlu Litsea polyantha V=0.00855 + 0.4432D2 + 0.28813D2H 0.4
115 Jageru Macaranga denticulata V=0.13333 - 2.18825D + 13.12678D2 0.53
116 Som (soom) Machilus bombycina V=-0.70958 + 13.03244D – 72.25358D2 + 147.43033D3
0.67
117 Kaunla/Kowala/ Kawla)
Machilus globosa V=-0.70958 + 13.03244D – 72.25358D2 + 147.43033D3
0.67
118 Bon-dai-sum Machilus villosa V=-0.70958 + 13.03244D – 72.25358D2 + 147.43033D3
0.67
119 Barhamthuri Magnolia hodgsonii (Talauma hodgsonii)
V=0.00855 + 0.4432D2 + 0.28813D2H 0.67
120 Murolia Mallotus albus V=0.00855 + 0.4432D2 + 0.28813D2H 0.67
121 Ruhini Mallotus philippinensis V=0.14749 - 2.87503D + 19.61977D2-19.11630D3
0.64
122 Koni-bih Mallotus repandus V=0.00855 + 0.4432D2 + 0.28813D2H 0.67
123 Aam/Bon-am Mangifera sylvatica V=0.00855 + 0.4432D2 + 0.28813D2H 0.52
124 Phulsopa Manglietia insignis V=0.00855 + 0.4432D2 + 0.28813D2H 0.67
125 Badam/ Nahori
Mansonia dipikae V=0.06337 – 1.46052D + 12.05817D2
– 5.52238 D3 0.67
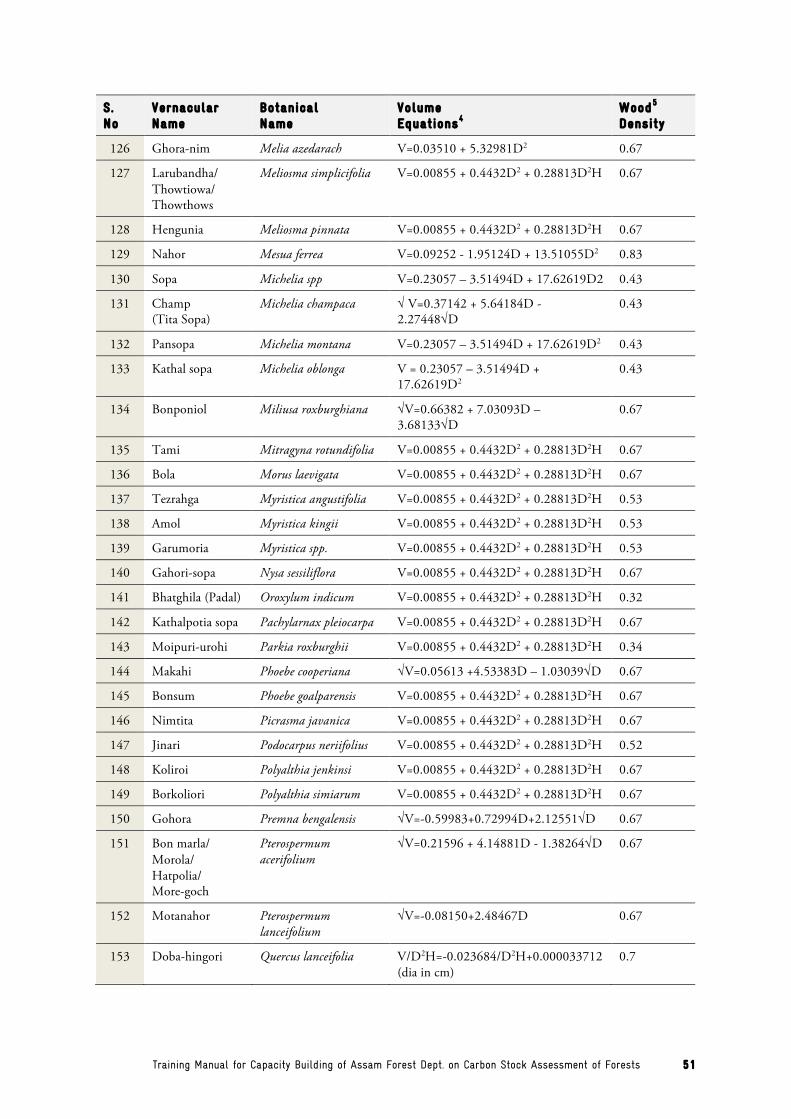
Training Manual for Capacity Building of Assam Forest Dept. on Carbon Stock Assessment of Forests 51
S . No
Vernacular Name
Botanical Name
Volume Equations4
Wood5 Density
126 Ghora-nim Melia azedarach V=0.03510 + 5.32981D2 0.67
127 Larubandha/ Thowtiowa/ Thowthows
Meliosma simplicifolia V=0.00855 + 0.4432D2 + 0.28813D2H 0.67
128 Hengunia Meliosma pinnata V=0.00855 + 0.4432D2 + 0.28813D2H 0.67
129 Nahor Mesua ferrea V=0.09252 - 1.95124D + 13.51055D2 0.83
130 Sopa Michelia spp V=0.23057 – 3.51494D + 17.62619D2 0.43
131 Champ (Tita Sopa)
Michelia champaca √ V=0.37142 + 5.64184D - 2.27448√D
0.43
132 Pansopa Michelia montana V=0.23057 – 3.51494D + 17.62619D2 0.43
133 Kathal sopa Michelia oblonga V = 0.23057 – 3.51494D + 17.62619D2
0.43
134 Bonponiol Miliusa roxburghiana √V=0.66382 + 7.03093D – 3.68133√D
0.67
135 Tami Mitragyna rotundifolia V=0.00855 + 0.4432D2 + 0.28813D2H 0.67
136 Bola Morus laevigata V=0.00855 + 0.4432D2 + 0.28813D2H 0.67
137 Tezrahga Myristica angustifolia V=0.00855 + 0.4432D2 + 0.28813D2H 0.53
138 Amol Myristica kingii V=0.00855 + 0.4432D2 + 0.28813D2H 0.53
139 Garumoria Myristica spp. V=0.00855 + 0.4432D2 + 0.28813D2H 0.53
140 Gahori-sopa Nysa sessiliflora V=0.00855 + 0.4432D2 + 0.28813D2H 0.67
141 Bhatghila (Padal) Oroxylum indicum V=0.00855 + 0.4432D2 + 0.28813D2H 0.32
142 Kathalpotia sopa Pachylarnax pleiocarpa V=0.00855 + 0.4432D2 + 0.28813D2H 0.67
143 Moipuri-urohi Parkia roxburghii V=0.00855 + 0.4432D2 + 0.28813D2H 0.34
144 Makahi Phoebe cooperiana √V=0.05613 +4.53383D – 1.03039√D 0.67
145 Bonsum Phoebe goalparensis V=0.00855 + 0.4432D2 + 0.28813D2H 0.67
146 Nimtita Picrasma javanica V=0.00855 + 0.4432D2 + 0.28813D2H 0.67
147 Jinari Podocarpus neriifolius V=0.00855 + 0.4432D2 + 0.28813D2H 0.52
148 Koliroi Polyalthia jenkinsi V=0.00855 + 0.4432D2 + 0.28813D2H 0.67
149 Borkoliori Polyalthia simiarum V=0.00855 + 0.4432D2 + 0.28813D2H 0.67
150 Gohora Premna bengalensis √V=-0.59983+0.72994D+2.12551√D 0.67
151 Bon marla/ Morola/ Hatpolia/ More-goch
Pterospermum acerifolium
√V=0.21596 + 4.14881D - 1.38264√D 0.67
152 Motanahor Pterospermum lanceifolium
√V=-0.08150+2.48467D 0.67
153 Doba-hingori Quercus lanceifolia V/D2H=-0.023684/D2H+0.000033712 (dia in cm)
0.7
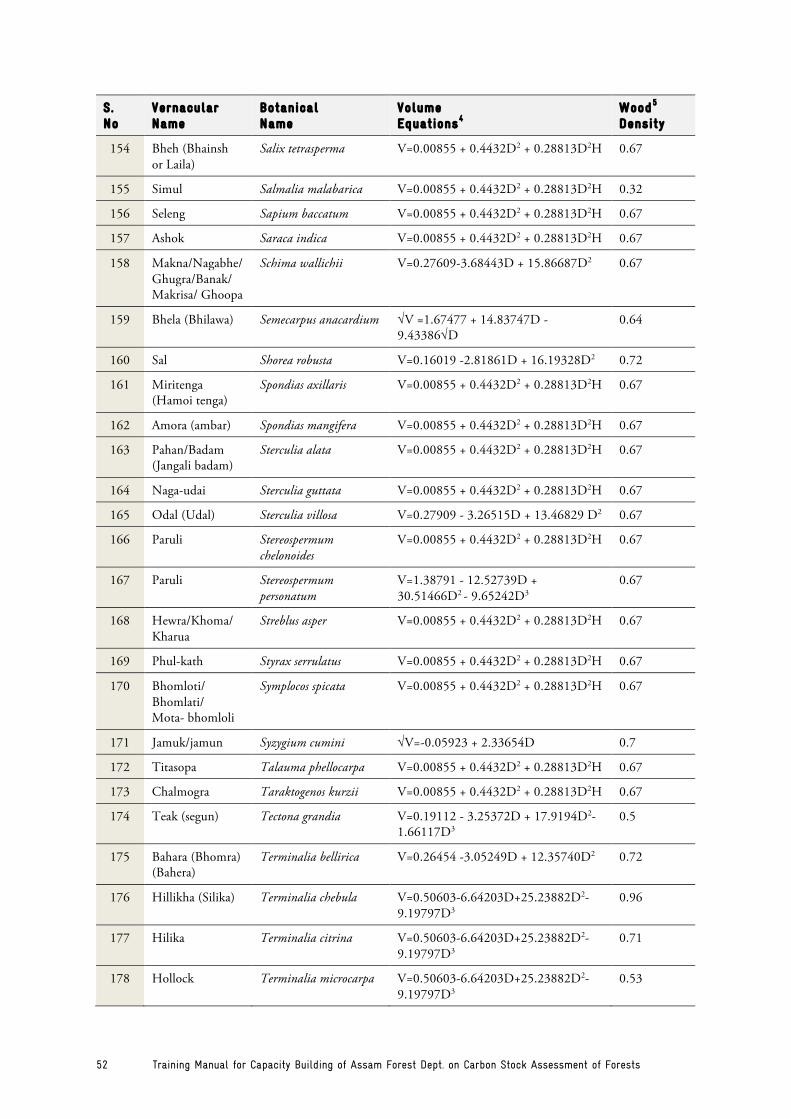
Training Manual for Capacity Building of Assam Forest Dept. on Carbon Stock Assessment of Forests 52
S . No
Vernacular Name
Botanical Name
Volume Equations4
Wood5 Density
154 Bheh (Bhainsh or Laila)
Salix tetrasperma V=0.00855 + 0.4432D2 + 0.28813D2H 0.67
155 Simul Salmalia malabarica V=0.00855 + 0.4432D2 + 0.28813D2H 0.32
156 Seleng Sapium baccatum V=0.00855 + 0.4432D2 + 0.28813D2H 0.67
157 Ashok Saraca indica V=0.00855 + 0.4432D2 + 0.28813D2H 0.67
158 Makna/Nagabhe/ Ghugra/Banak/ Makrisa/ Ghoopa
Schima wallichii V=0.27609-3.68443D + 15.86687D2 0.67
159 Bhela (Bhilawa) Semecarpus anacardium √V =1.67477 + 14.83747D - 9.43386√D
0.64
160 Sal Shorea robusta V=0.16019 -2.81861D + 16.19328D2 0.72
161 Miritenga (Hamoi tenga)
Spondias axillaris V=0.00855 + 0.4432D2 + 0.28813D2H 0.67
162 Amora (ambar) Spondias mangifera V=0.00855 + 0.4432D2 + 0.28813D2H 0.67
163 Pahan/Badam (Jangali badam)
Sterculia alata V=0.00855 + 0.4432D2 + 0.28813D2H 0.67
164 Naga-udai Sterculia guttata V=0.00855 + 0.4432D2 + 0.28813D2H 0.67
165 Odal (Udal) Sterculia villosa V=0.27909 - 3.26515D + 13.46829 D2 0.67
166 Paruli Stereospermum chelonoides
V=0.00855 + 0.4432D2 + 0.28813D2H 0.67
167 Paruli Stereospermum personatum
V=1.38791 - 12.52739D + 30.51466D2 - 9.65242D3
0.67
168 Hewra/Khoma/ Kharua
Streblus asper V=0.00855 + 0.4432D2 + 0.28813D2H 0.67
169 Phul-kath Styrax serrulatus V=0.00855 + 0.4432D2 + 0.28813D2H 0.67
170 Bhomloti/ Bhomlati/ Mota- bhomloli
Symplocos spicata V=0.00855 + 0.4432D2 + 0.28813D2H 0.67
171 Jamuk/jamun Syzygium cumini √V=-0.05923 + 2.33654D 0.7
172 Titasopa Talauma phellocarpa V=0.00855 + 0.4432D2 + 0.28813D2H 0.67
173 Chalmogra Taraktogenos kurzii V=0.00855 + 0.4432D2 + 0.28813D2H 0.67
174 Teak (segun) Tectona grandia V=0.19112 - 3.25372D + 17.9194D2-1.66117D3
0.5
175 Bahara (Bhomra) (Bahera)
Terminalia bellirica V=0.26454 -3.05249D + 12.35740D2 0.72
176 Hillikha (Silika) Terminalia chebula V=0.50603-6.64203D+25.23882D2-9.19797D3
0.96
177 Hilika Terminalia citrina V=0.50603-6.64203D+25.23882D2-9.19797D3
0.71
178 Hollock Terminalia microcarpa V=0.50603-6.64203D+25.23882D2-9.19797D3
0.53

Training Manual for Capacity Building of Assam Forest Dept. on Carbon Stock Assessment of Forests 53
S . No
Vernacular Name
Botanical Name
Volume Equations4
Wood5 Density
179 Bhelu (Tula) Tetrameles nudiflora V/D2 =0.12914/D2 -2.50478/D + 15.25108
0.3
180 Pakdima/ Phakdama
Trema orientalis V=0.00855 + 0.4432D2 + 0.28813D2H 0.31
181 Bhelkor Trewia nudiflora √V =-0.45312 -0.41426D + 2.10913√D
0.67
182 Mota-aman/ Neknekia
Turma pomifera V=0.00855 + 0.4432D2 + 0.28813D2H 0.67
183 Laban/Tibin Ulmus lancifolia V=0.00855 + 0.4432D2 + 0.28813D2H 0.67
184 Kethora/Mon Vangueria spinosa V=0.00855 + 0.4432D2 + 0.28813D2H 0.67
185 Morhal Vatica lanceifolia V=0.00855 + 0.4432D2 + 0.28813D2H 0.69
186 Ahoi Vitex peduncularis V=-0.16386 + 2.23116D -7.00969D2 + 22.13099D3
0.96
187 Lamtem Walsura robusta V=0.00855 + 0.4432D2 + 0.28813D2H 0.67
188 Dudi-goch Wrightia tomentosa V=0.00855 + 0.4432D2 + 0.28813D2H 0.67
189 Bojorni (Borjonoli) Bajrang/ Bajranali
Zanthoxylum rhetsa V=-0.04521 + 0.45290D + 5.18275D2 0.67
190 Boguri Ziziphus jujuba V=0.00855 + 0.4432D2 + 0.28813D2H 0.76
191 Bon-baguri Zizyphus rugosa V=0.00855 + 0.4432D2 + 0.28813D2H 0.76
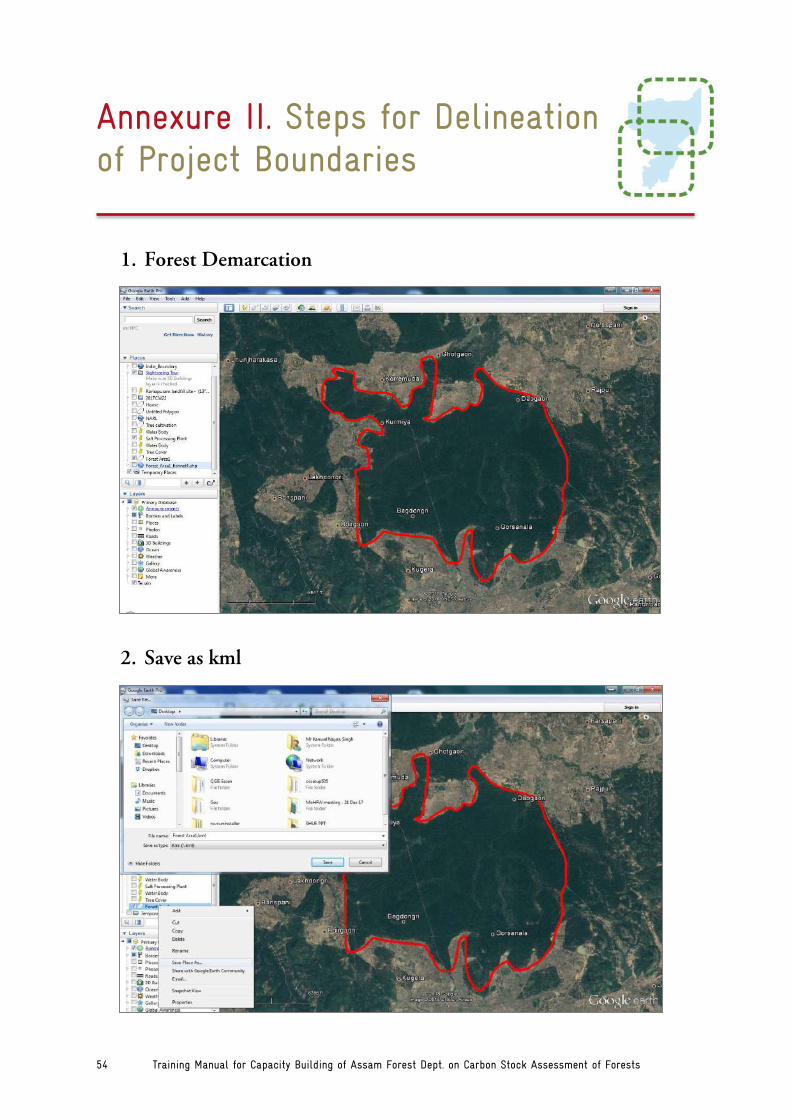
Training Manual for Capacity Building of Assam Forest Dept. on Carbon Stock Assessment of Forests 54
Annexure II. Steps for Delineation of Project Boundaries
1. Forest Demarcation
2. Save as kml
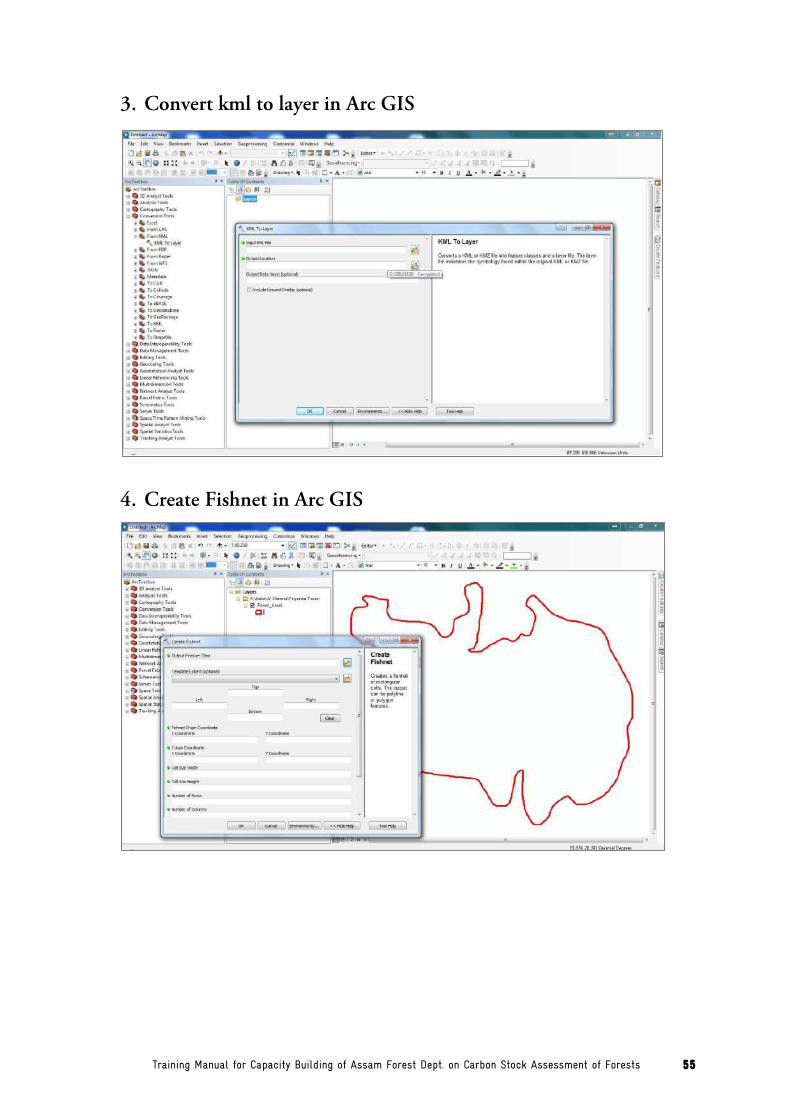
Training Manual for Capacity Building of Assam Forest Dept. on Carbon Stock Assessment of Forests 55
3. Convert kml to layer in Arc GIS
4. Create Fishnet in Arc GIS
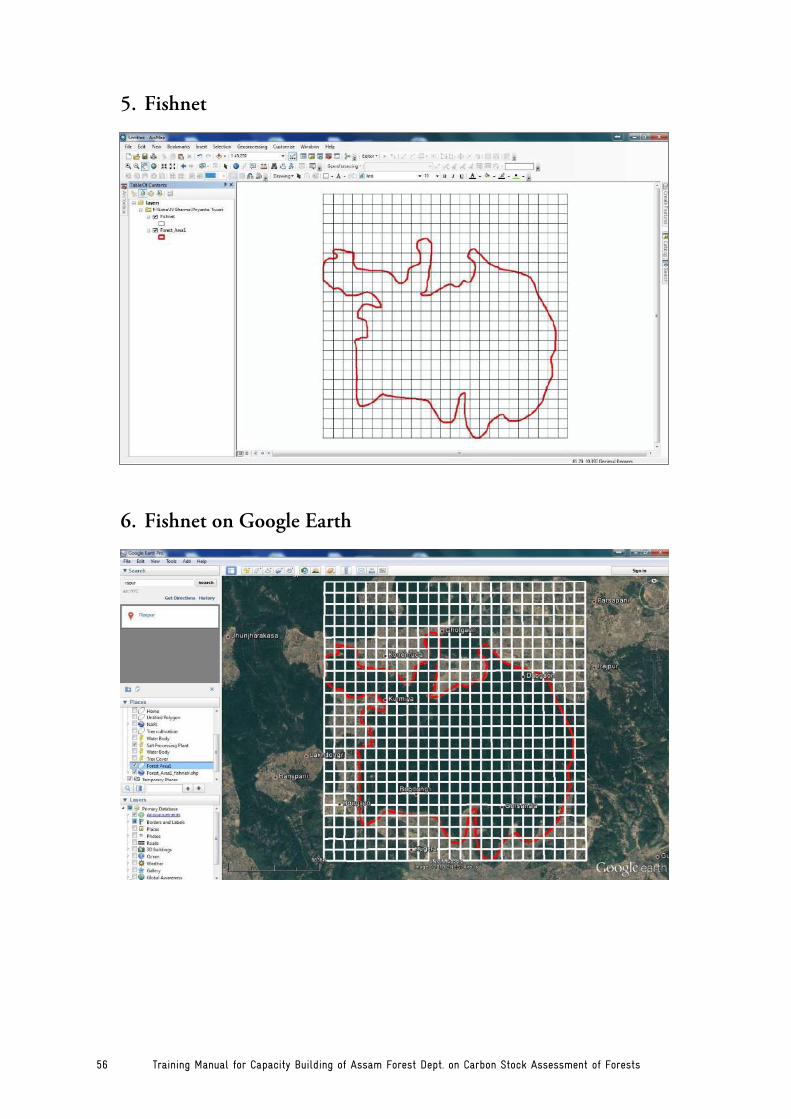
Training Manual for Capacity Building of Assam Forest Dept. on Carbon Stock Assessment of Forests 56
5. Fishnet
6. Fishnet on Google Earth
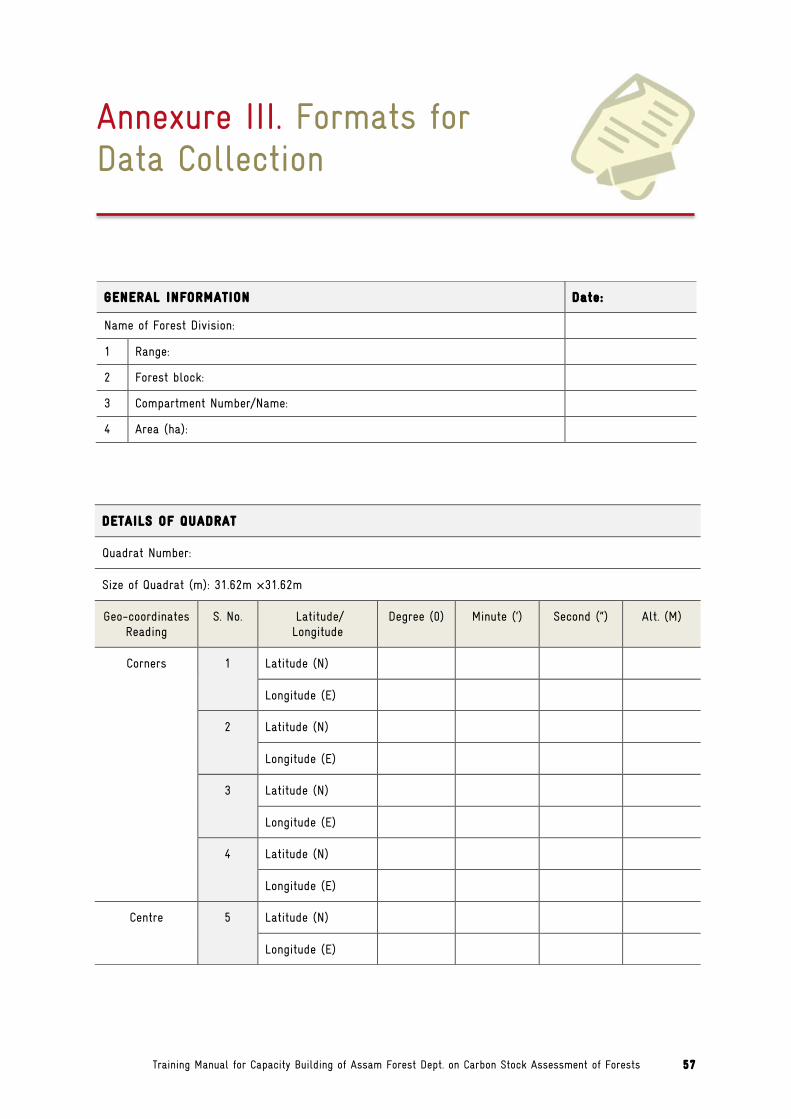
Training Manual for Capacity Building of Assam Forest Dept. on Carbon Stock Assessment of Forests 57
Annexure III. Formats for Data Collection
GENERAL INFORMATION Date:
Name of Forest Division:
1 Range:
2 Forest block:
3 Compartment Number/Name:
4 Area (ha):
DETAILS OF QUADRAT
Quadrat Number:
Size of Quadrat (m): 31.62m ×31.62m
Geo-coordinates Reading
S. No. Latitude/ Longitude
Degree (0) Minute (‘) Second (“) Alt. (M)
Corners 1 Latitude (N)
Longitude (E)
2 Latitude (N)
Longitude (E)
3 Latitude (N)
Longitude (E)
4 Latitude (N)
Longitude (E)
Centre 5 Latitude (N)
Longitude (E)
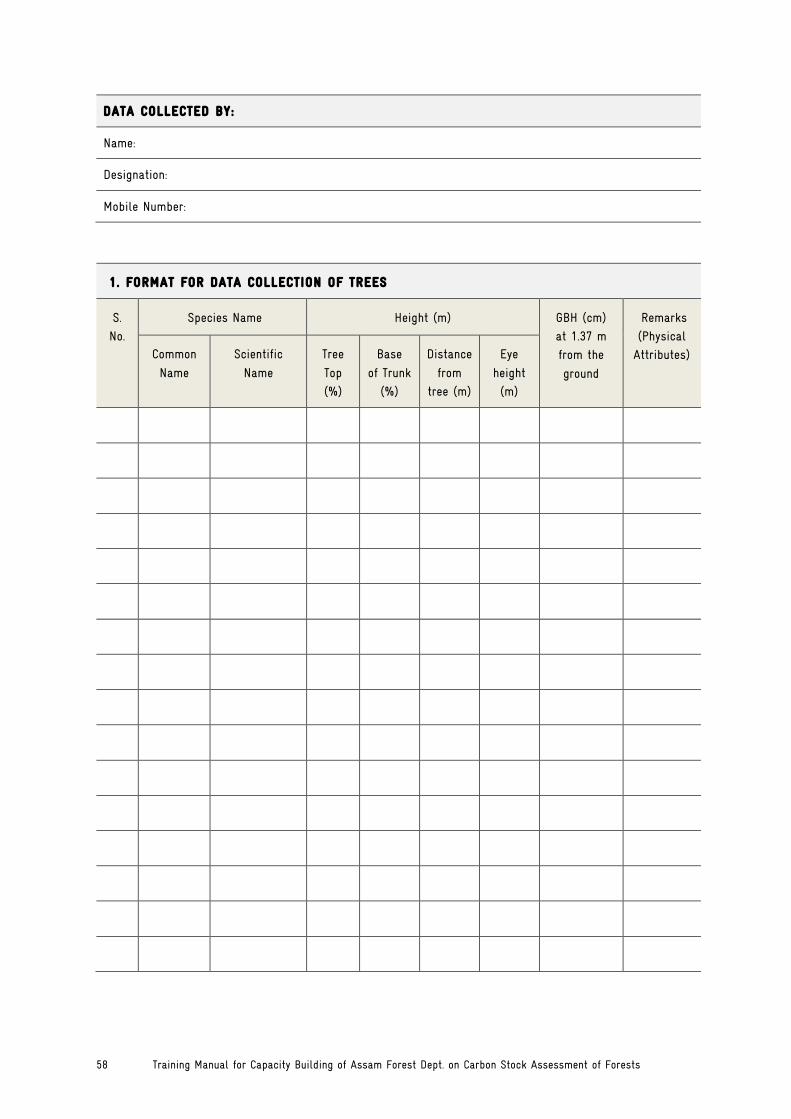
Training Manual for Capacity Building of Assam Forest Dept. on Carbon Stock Assessment of Forests 58
DATA COLLECTED BY:
Name:
Designation:
Mobile Number:
1. FORMAT FOR DATA COLLECTION OF TREES
S.
No.
Species Name Height (m) GBH (cm)
at 1.37 m
from the
ground
Remarks
(Physical
Attributes) Common
Name
Scientific
Name
Tree
Top
(%)
Base
of Trunk
(%)
Distance
from
tree (m)
Eye
height
(m)
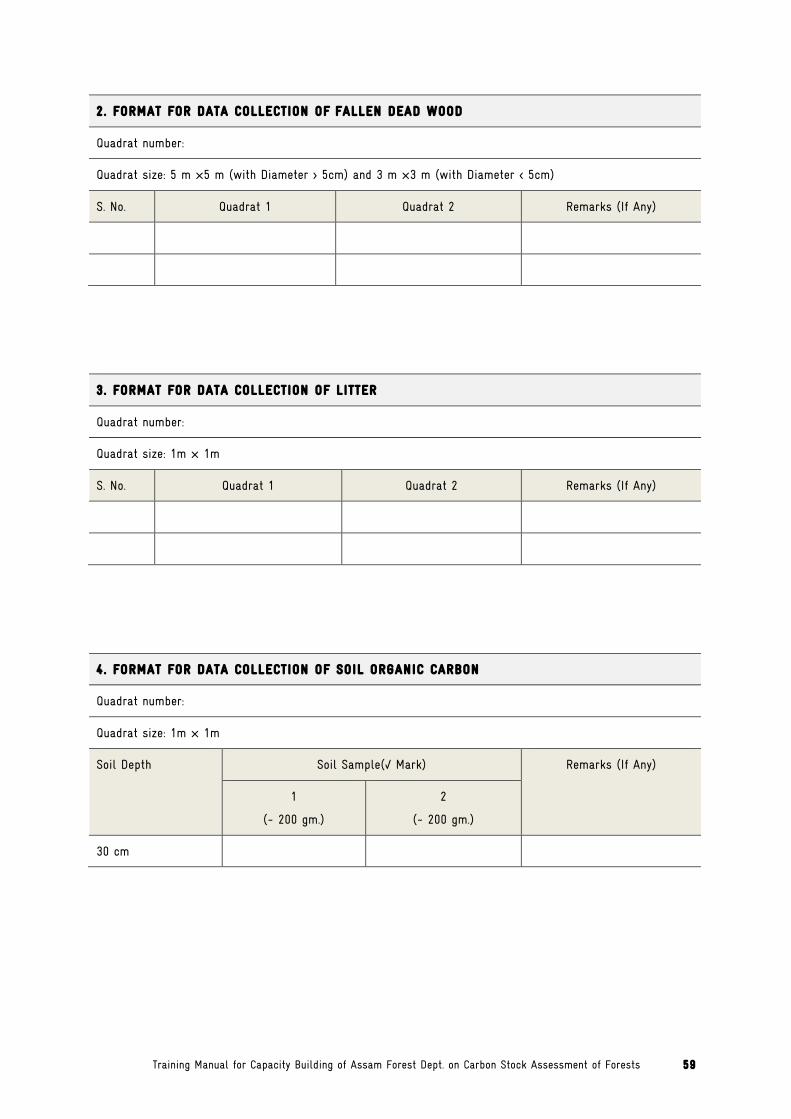
Training Manual for Capacity Building of Assam Forest Dept. on Carbon Stock Assessment of Forests 59
2 . FORMAT FOR DATA COLLECTION OF FALLEN DEAD WOOD
Quadrat number:
Quadrat size: 5 m ×5 m (with Diameter > 5cm) and 3 m ×3 m (with Diameter < 5cm)
S. No. Quadrat 1 Quadrat 2 Remarks (If Any)
3 . FORMAT FOR DATA COLLECTION OF LITTER
Quadrat number:
Quadrat size: 1m × 1m
S. No. Quadrat 1 Quadrat 2 Remarks (If Any)
4 . FORMAT FOR DATA COLLECTION OF SOIL ORGANIC CARBON
Quadrat number:
Quadrat size: 1m × 1m
Soil Depth Soil Sample(√ Mark) Remarks (If Any)
1
(~ 200 gm.)
2
(~ 200 gm.)
30 cm
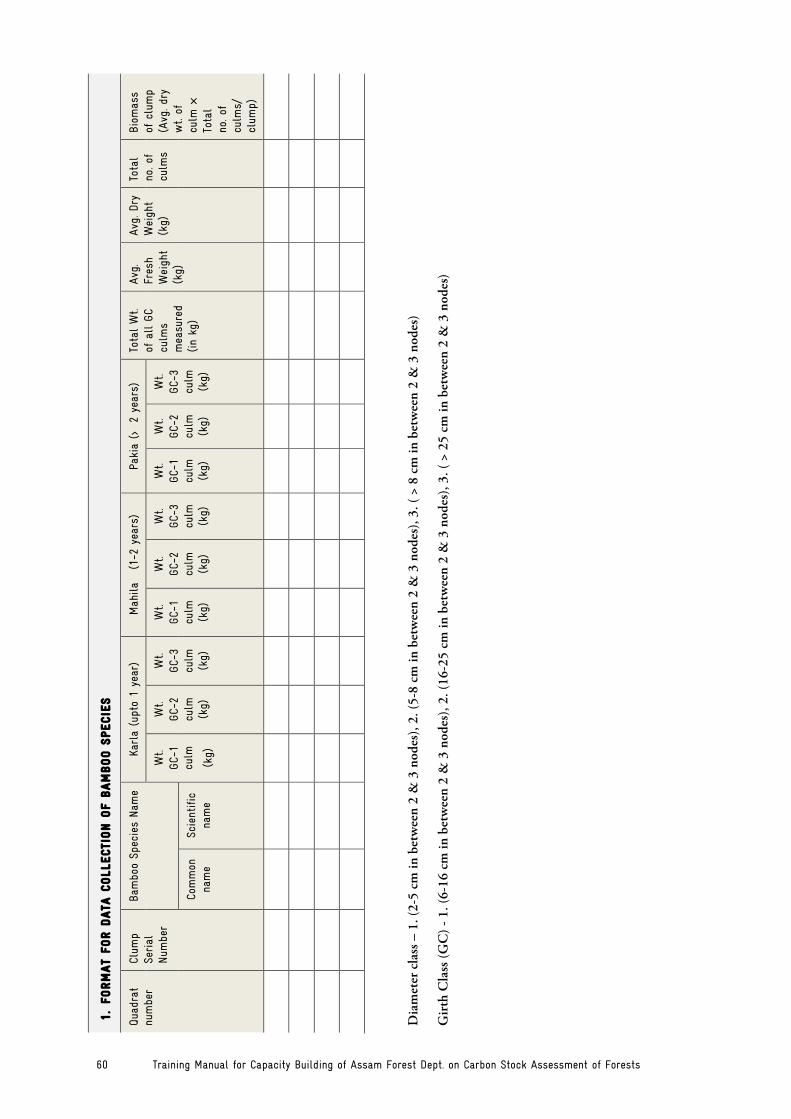
Training Manual for Capacity Building of Assam Forest Dept. on Carbon Stock Assessment of Forests 60
1.
FORM
AT
FOR D
ATA
COLLECTI
ON O
F B
AM
BOO S
PECIE
S
Quad
rat
num
ber
Clum
p Se
rial
Num
ber
Bam
boo
Spec
ies
Nam
e Ka
rla
(upt
o 1
year
) M
ahila
(1-
2 ye
ars)
Pa
kia
(>
2 ye
ars)
To
tal W
t. of
all G
C cu
lms
mea
sure
d (in
kg)
Avg.
Fres
h W
eigh
t (k
g)
Avg. D
ry
Wei
ght
(kg)
Tota
l no
. of
culm
s
Biom
ass
of
clu
mp
(Avg
. dry
wt.
of
culm
×
Tota
l
no. o
f cu
lms/
cl
ump)
Wt.
GC-1
cu
lm
(kg)
Wt.
GC-2
cu
lm
(kg)
Wt.
GC-3
cu
lm
(kg)
Wt.
GC-1
cu
lm
(kg)
Wt.
GC-2
cu
lm
(kg)
Wt.
GC-3
cu
lm
(kg)
Wt.
GC-1
cu
lm
(kg)
Wt.
GC-2
cu
lm
(kg)
Wt.
GC-3
cu
lm
(kg)
Co
mm
on
nam
e Sc
ient
ific
nam
e
D
iam
eter
cla
ss –
1. (
2-5
cm in
bet
wee
n 2
& 3
nod
es),
2. (5
-8 c
m in
bet
wee
n 2
& 3
nod
es),
3. (
> 8
cm in
bet
wee
n 2
& 3
nod
es)
Gir
th C
lass
(GC
) - 1
. (6-
16 c
m in
bet
wee
n 2
& 3
nod
es),
2. (1
6-25
cm
in b
etw
een
2 &
3 n
odes
), 3.
( >
25 c
m in
bet
wee
n 2
& 3
nod
es)
Training Manual for Capacity Building of Assam Forest Dept. on Carbon Stock Assessment of Forests 61
Annexure IV. Applications of Biomass Assessment & Steps to Prepare a Project Design Document
Biomass assessment will help to understand and develop projects under various carbon forestry schemes such as Afforestation/Reforestation Clean development Mechanism (A/R CDM) and Reducing Emissions from Deforestation and Forest Degradation and conservation of forest carbon stocks, sustainable management of forests, and enhancement of forest carbon stocks (REDD+) in developing countries.
Compliance Market & Voluntary Carbon Market Carbon trading is a practice designed to reduce overall emissions of carbon dioxide, along with other greenhouse gases, by providing a regulatory and economic incentive. Carbon offset markets exist both under compliance schemes and as voluntary programs. Compliance markets are created and regulated by mandatory regional, national, and international carbon reduction regimes, such as the Kyoto Protocol and the European Union’s Emissions Trading Scheme. Voluntary offset markets function outside of the compliance markets and enable companies and individuals to purchase carbon offsets on a voluntary basis.
Application of Biomass Assessment 1. The application of biomass assessment is to quantify the carbon stock (tC/ha) of forest.
2. Forest department can evaluate quality of their forest and accordingly they can take further actions for improvement of forest cover and contributing to achieving NDC target of 2.5 to 3 billion tons of CO2 by 2030.
3. Carbon stock assessment can be applied for obtaining carbon finance from compliance and voluntary carbon markets.
Steps Involved for Project Document Design Preparation There are three windows available for forest based carbon finance such as A/R CDM, REDD+ and voluntary carbon market. The forest area having less than 15% canopy cover are eligible for A/R CDM while areas having more than 15% canopy cover are eligible for REDD+ and voluntary carbon market.

Training Manual for Capacity Building of Assam Forest Dept. on Carbon Stock Assessment of Forests 62
A/R CDM
First and foremost Step is – Identification of area for carbon assessment through ground truthing /GPS/PRA. After that, a detailed project design document (PDD) needs to be prepared. In other word we can say this is a planning document which has realistic projections for future activities.
This document contains general description of project activity, baseline methodology, monitoring methodology, duration of project activity/crediting period, calculation of GHG emission by sources and environmental impacts.
This document requires several procedural steps and certificates which are screened by National Clean Development Mechanism Authority (NCDMA) housed in the MoEFCC (also Known as DNA – Designated National Authority). The DNA will screen the project and decide whether a project meets that sustainable development requirement. It issues a letter known as the Host Country Approval (HCA) letter. However it is important to note that this is just for the CDM mechanism. It is not needed for voluntary carbon market or REDD+ projects.
the PDD is validated by 3rd party known as DOE (Designated Operational Entity). DOE will visit actual sites and check suitability of land for carbon credit projects. Prior to the submission of the validation report to Executive Board (EB) of the UNFCCC, the DOE must have received from the DNA –
• A written approval of voluntary participation of the project (HCA from NCDMA, MoEF&CC, GoI)
• Confirmation that the project activity assists it in achieving sustainable development.
• Following documents need to be provided by the project proponent for PDD development and the same will be verified by DOE
o Certification of local project Committee o Certification of Incorporation o Certificate of Land Ownership o Low income certificate
And finally DOE will submit PDD to UNFCCC for registration that is also known as EB. The EB is overall supervisor of the project. The key task of the EB is the maintenance of registry.
After the successful study of the area as per the PDDs, a detailed verification exercise will be conducted for ground truthing and validation in each division.
Based on the real time data (such as the height and girth of trees), CERs will be calculated for each area. After the successful verification and certification by the DOE (Verifier), the EB (UNFCCC) will issue the corresponding amount of CERs and distribute them among the project participants.
REDD+
REDD Plus is a financial incentive mechanism for reducing emissions from deforestation and forest degradation, plus signifying positive elements of conservation, Sustainable forest management and enhancing carbon stock through afforestation & reforestation, with the potential of sustaining

Training Manual for Capacity Building of Assam Forest Dept. on Carbon Stock Assessment of Forests 63
livelihood of Forest Dependent Communities (FDCs), maintenance of ecosystem services and biodiversity conservation with safeguards of people living in and around forests (their rights, governance, and sustainable livelihood)
REDD+ Framework
Key requirements of REDD+
• Monitoring, and measurement, reporting and verification (M&MRV) for REDD+ is a way of addressing a country’s commitments to collecting and sharing this information.
• Safeguards: The social and environmental safeguards (Cancun Safeguards given by United Nations Framework Convention on Climate Change) are for the successful implementation of REDDplus in India. In order to protect potential risks while promoting benefits, seven safeguards are in place that must be supported throughout the implementation of REDD+ actions.
• Policies, laws and regulations (PLRs): in order to support implementation of REDD+ actions in a manner consistent with Cancun (and other) safeguards, i.e. how safeguards are being addressed.
• Institutional arrangements: The mandates, procedures and capacities to ensure that the relevant PLRs are actually implemented in practice, i.e. how safeguards are being respected.
• Information systems: These collect and make available information on how REDD+ safe-guards are being addressed and respected throughout REDD+ implementation

Training Manual for Capacity Building of Assam Forest Dept. on Carbon Stock Assessment of Forests 64
The summary of information needs to be submitted to UNFCCC for financing. Further the EB will forward the SI to Global Carbon Fund, where the GCF will review and finally make the payment. These payments will be equally distributed in the form of incentives to local communities for sustainably managing the forest resource, conserving the existing forest carbon stocks and enhancing the forest carbon stocks in the forest.
Gold Standard (GS)
In order to reduce the risk of unwanted secondary effects in the carbon market, the Gold Standard requires an extensive stakeholder consultation where the community defines the most important indicators of social, economic and environmental success. Gold Standard certification is there to highlight the best of the compliance market and to legitimize real efforts in the voluntary market. However, the Gold Standard is additional to and independent of the CDM.
For Indian scenario, only VCS and GS markets are suitable. Price as per VCS is 2.3 US Dollars and price as per GS – 4.6 US Dollars.

Deutsche Gesellschaft für Internationale Zusammenarbeit (GIZ) GmbH
Registered officesBonn and Eschborn, Germany
GIZ IndiaA-2/18, Third Floor, Safdarjung EnclaveNew Delhi 110 029, IndiaT +91 11 4949 5353
E [email protected] www.giz.de