Embed Size (px)
Citation preview

1
Training image-based scenario modeling of fractured reservoirs for flow uncertainty quantification Jung1, Darryl H. Fenwick2 and Jef Caers1 1 Department of Energy Resources Engineering, Stanford University 2 Streamsim Technologies, Inc.
This work was submitted to Computational Geosciences on 1st April 2013 (COMG-S-13-00086).
Abstract
Geological characterization of naturally fractured reservoirs is potentially associated with large
uncertainty. However, the geological modeling of discrete fracture networks (DFN) is in practice
considerably disconnected from uncertainty modeling based on conventional flow simulators.
DFN models provide a geologically consistent way of modeling fractures in reservoirs. However,
flow simulation of DFN models is currently infeasible at the field scale. To translate DFN models
to dual-media descriptions efficiently and fast, we propose a geostatistical approach based on
patterns. We will use experimental design to capture the uncertainties in the fracture
description and generate DFN models based upon. The DFN models are then upscaled to
equivalent continuum models. Patterns obtained from the upscaled DFN models are reduced to
manageable set and used as training images for multiple-point statistics (MPS). Once the
training images are obtained, they allow for fast realization of dual-porosity descriptions with
MPS directly – while circumventing the time-consuming process of DFN modeling and
upscaling. We demonstrate our ideas on a realistic middle-east type fractured reservoir system.
Introduction
Realistic description of uncertainty and predictive power of reservoir models is dependent upon
the ability to model geological phenomena. This is especially true for naturally fractured
reservoirs (NFR), which can bear risks such as early water breakthrough and poor oil recovery.
However, the evaluation and modeling of NFRs often bears shortcomings. In common modeling
practice, two kinds of models for NFRs are employed: highly detailed, geologically realistic
models built by geologists, and coarse, grid-based models used by engineers for reservoir flow
simulations following the dual media paradigm (Cacas, Daniel, & Letouzey, 2001; B. Dershowitz,
LaPointe, Eiben, & Wei, 2000; Warren & Root, 1963). The former are complicated, complex and

2
time-consuming discrete fracture network models (DFN), the latter are geo-cellular, i.e. grid-
based, models for use with conventional flow simulators in many cases partly or entirely
disconnected from the underlying geology.
Building one geologically realistic DFN model for a fractured reservoir can be tedious and time-
consuming. Building hundreds or even thousands of DFN models and running flow simulation at
reservoir scale for the purpose of sensitivity analysis and uncertainty quantification of reservoir
production is infeasible for practitioners. Simulating flow with conventional flow simulators
requires the upscaling of the flow properties of each DFN model to effective dual-media
properties on a grid is again a time-consuming process. Therefore limiting the DFN modeling
and upscaling, and instead directly modeling the effective properties in a geological consistent
manner would be advantageous. However, natural fractures comprise a complex system
(Zhong, Aydina, & McGuinness, 2009) and their characterization in the reservoir is associated
with many uncertainties (e.g. Guerriero et al., 2010) which must be captured in the dual media
model.
We propose a methodology based on multiple-point statistics (MPS) for fast and geologically
consistent generation of dual media models for the purpose of uncertainty modeling in NFRs.
MPS represents a group of geostatistical algorithms for stochastic pattern reproduction (Caers,
Strebelle, & Payrazyan, 2003; Caers & Zhang, 2002; Strebelle, 2002; an overview is provided in
Daly & Caers, 2010; Hu & Chugunova, 2008). MPS borrows the patterns to be reproduced from
so-called training images, and has been successfully applied to simulate depositional structures
of rocks (facies and petrophysical properties). The bottle-neck for applying MPS wide-scale is
the training image. We describe a methodology to obtain a manageable set of training images
for the fractured medium of dual medium models. Creating such set achieves two goals. Firstly,
an input for rapid dual medium generation via MPS while maintaining geological realism, and
secondly representing realistic dual medium scenarios and therefore representing realistic
uncertainty. In structural modeling (Bond, Gibbs, Shipton, & Jones, 2007; Cherpeau, Caumon,
Caers, & Lévy, 2012) as well as facies modeling (Feyen & Caers, 2006; Park, Scheidt, Fenwick,
Boucher, & Caers, 2013; Scheidt & Caers, 2009; Suzuki, Caumon, & Caers, 2008), such (discrete)
scenario-type uncertainty has proven to be one of the critical sources of geological uncertainty.
To obtain the set of training images, an extensive set of DFNs representing potential geological
scenarios is generated and upscaled to effective properties. For each model we also generate a
binary map of the flow model. This binary map is derived from the key observation that that in
the reservoir flow model, not all grid blocks must have two media – only the grid blocks which
contain a connected fracture network should be described in this manner (Bourbiaux, Basquet,
Cacas, Daniel, & Sarda, 2002). The pattern in this map is based on fracture intensity per grid cell

3
and determines for which grid cells should be represented by a dual medium (connected
fractures and matrix) or a single medium (disconnected fractures and matrix) in the flow
simulation. These patterns are clustered based on their pattern-based distances to identify
representative models to serve as training images. The training images are then employed to
generate directly flow models with MPS.
We would like to address three common misunderstandings upfront. First, we do not construct
training images for DFN models, instead we work with effective properties in the grid domain.
Second, we do not discretize fractures on the grid, instead we deal with a large number of
fractures per grid cell. We also do not simulate large scale fractures or fracture corridors, by
means of MPS (e.g. Souche et al., 2012). Third, the aim of this workflow is not to build a small
number of highly accurate fracture models, instead we are interested to evaluate realistically
uncertainty of the reservoir flow response which requires constructing a large number of flow
models.
Methodolgy
Overview
We will outline first broadly the methodology and then use an example to illustrate the details
of this workflow. Our workflow consists of various components that already exist in the
literature; hence the novelty lies in integrating them into a practical workflow applicable to real
field applications. This also means that various components (such as upscaling) can be
exchanged based on one’s own personal experience.
Step 1: This step consists of the usual geological work relating to understanding and describing
the fractured system. The goal here is to specify the various concepts as well as input
parameters related to fractured modeling.
Step 2: Generation of DFN scenarios based on the data gathered in step 1. Experimental design
can be used to limit the amount of scenarios generated.
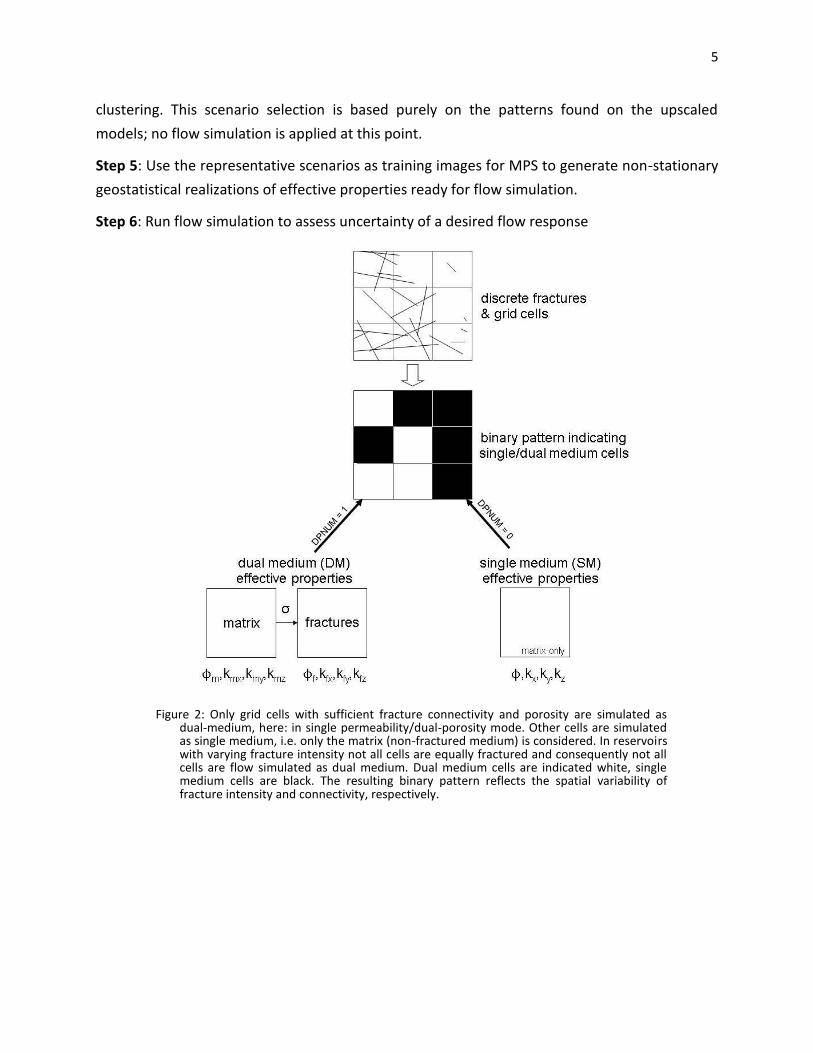
Step 3: Translation of the DFN models to dual medium scenarios consisting of modeling an
indicator for dual and single medium cells. This step upscales the DFN models to effective
properties for dual medium. From this step on, we no longer deal with DFNs. Translation of the
upscaled scenarios into a set of dual medium scenarios represented through patterns.
4
Step 4: Selection of a set of representative dual medium scenarios by means of distance-based
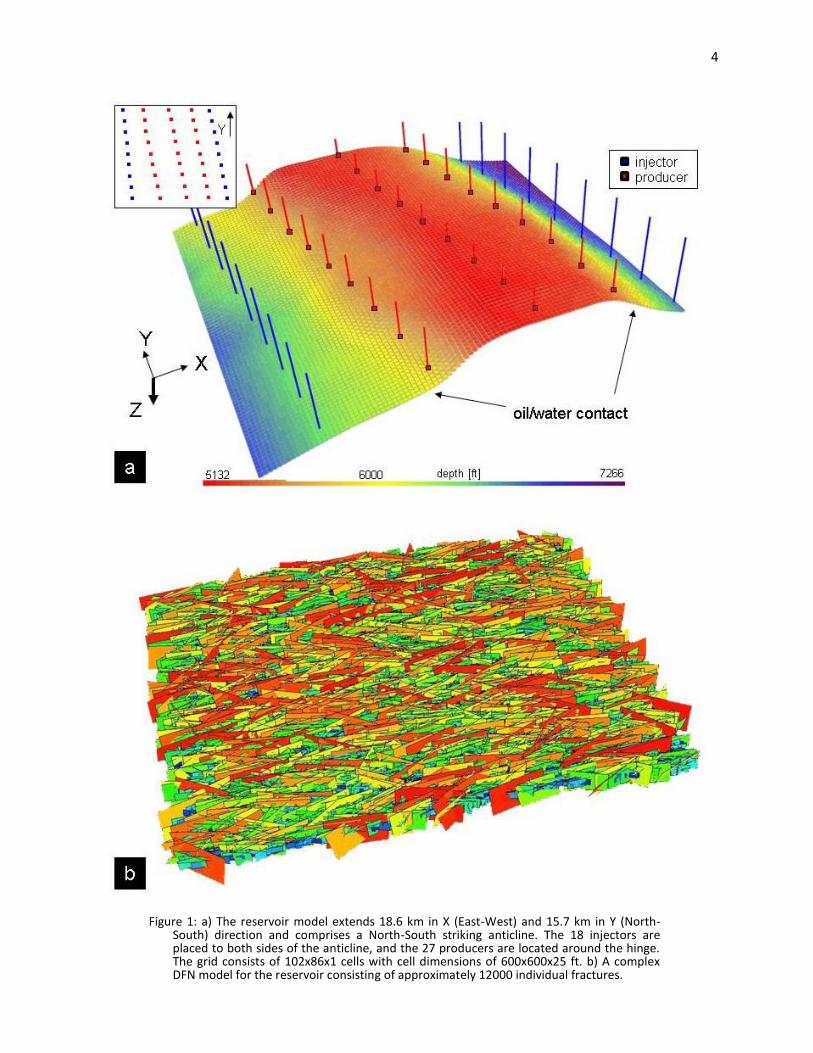
Figure 1: a) The reservoir model extends 18.6 km in X (East-West) and 15.7 km in Y (North-South) direction and comprises a North-South striking anticline. The 18 injectors are placed to both sides of the anticline, and the 27 producers are located around the hinge. The grid consists of 102x86x1 cells with cell dimensions of 600x600x25 ft. b) A complex DFN model for the reservoir consisting of approximately 12000 individual fractures.
5
clustering. This scenario selection is based purely on the patterns found on the upscaled
models; no flow simulation is applied at this point.
Step 5: Use the representative scenarios as training images for MPS to generate non-stationary
geostatistical realizations of effective properties ready for flow simulation.
Step 6: Run flow simulation to assess uncertainty of a desired flow response
Figure 2: Only grid cells with sufficient fracture connectivity and porosity are simulated as dual-medium, here: in single permeability/dual-porosity mode. Other cells are simulated as single medium, i.e. only the matrix (non-fractured medium) is considered. In reservoirs with varying fracture intensity not all cells are equally fractured and consequently not all cells are flow simulated as dual medium. Dual medium cells are indicated white, single medium cells are black. The resulting binary pattern reflects the spatial variability of fracture intensity and connectivity, respectively.
6
Case study description
To demonstrate and illustrate our methodology, we have constructed a model in analogy to
fractured reservoirs in the Middle East (e.g. Saleri, Al-Kaabi, & Muallem, 2006). In this synthetic
but realistic model, we aim to represent various elements common to fractured reservoirs such
as uncertainty in interpretation or presence of seismic data.
The dominating structure in our case is a North-South striking anticline which is accompanied
by buckle folds to both sides (Figure 1a). The model extends 18.6 km in X (East-West) and 15.7
km in Y (North-South) direction represented by 102x86 grid cells with a horizontal dimension of
600x600ft. The model has one layer with a thickness of 25ft. The initial oil-water contact is at
6100ft. The reservoir is produced with 45 wells, of which 18 are water injections wells and 27
are production wells. There is also pressure support from the aquifer. The position of the wells
is shown in Figure 1a. Injectors are marked blue and producers are red. The water injection
takes place at a constant bottom hole pressure of 4000 psi with a maximum allowable rate of
5000 stb/day. The total liquid production rate at each well is set to 2000 stb/day. Throughout
the production time of 3000 days the oil pressure stays above bubble point (no free gas). We
employed a streamline simulator using the dual-porosity single-permeability model to calculate
the flow responses. We are interesting in the surface oil production rate and cumulative oil
production. Note that since there is no free gas, and we are imposing total rate at the
producers, the sum of the oil and water rate is constant.
The permeability and porosity of the rock matrix is not the focus of this modeling approach and
kept constant at 200mD and 10%. From here on the term “effective properties” refers to the
effective properties of the fractured medium in a dual medium approach (Figure 2), specifically
the fracture porosity (φf), the fracture permeabilities (kfx,kfy,kfz) and the shape factor sigma (σ).
The sigma shape factor describes the fracture/matrix exchange (Kazemi, L.S., Porterfield, &
Zeman, 1976).
In our case study, as well as in real reservoirs, multiple geological scenarios of the fracture
system arise from the interpretation of data such as well-log, borehole imaging, seismic and /or
outcrop data. The hinges of folds – here the anticline structure – tend to have higher intensity
of fractures (e.g. Nelson, 2001; Zahm & Hennings, 2009). Although the analysis of the curvature
can be used as an indicator for fracture intensity (e.g. Chopra & Marfurt, 2007), orientation of
fractures are difficult to predict (e.g. Narr, Schechter, & Thompson, 2006). A seismic coherence
attribute may indicate the presence of fracture networks. A low coherence typically
corresponds to a higher intensity of fractures (e.g. Chopra, 2002; Neves, Zahrani, & Bremkamp,
7
2004). The formation of fracture corridors is a common feature of fractured reservoirs (e.g.
Gabrielsen, 1990; Questiaux, Couples, & Ruby, 2010). In our case we mimic corridors of high
fracture intensity as it can be derived from seismic coherence (Figure 6a). We now implement
the various details of our methodology within the context of this case.
Generating the DFN models (step 1 and 2)
To obtain DFN models reflecting the potential scenarios we designed a full factorial design
experiment on conceptual as well as parameter uncertainties (although the modeler may opt
for a full Monte Carlo should this be feasible) . The conceptual uncertainty comprises the spatial
distribution of fracture intensity and the presence (or absence) of different fracture sets. The
curvature of the anticline and corridors of decreased seismic coherence are assumed to be
indicators for variations in the fracture intensity. Fracture intensity can also be regarded as an
indirect measure of fracture intersections and is expressed as the P32 describing fracture area
per volume (W. S. Dershowitz & Herda, 1992). For our models we have set the average target
intensity to 0.06. Variations in the length, trend and orientation distribution of the fractures are
considered as parameter uncertainties. Fracture parameters such as length and orientation are
sampled from power law and Fisher distributions respectively during the stochastic generation
of a DFN (Golder Associates, 2012; Jones, Pringle, Fulton, & O’Neill, 1999). Large scale fractures,
i.e. faults, providing long-distance connectivity (or barriers) are not modeled here. In the scope
of this study we considered the hydraulic fracture parameters permeability, aperture and
compressibility as constant with the values 10D, 300µm and 10-5kPa-1. The experimental design
shown in Table 1 led to 156 (24×32+22×3) DFN models. To account for the spatial uncertainty of
the DFN we have generated four realizations for each scenario leading to a total of 624 models.
One DFN realization is shown in Figure 1b.
Table 1: Parameter variations used for the experimental design leading to 156 combinations, here: scenarios of the fracture network.

8
Translating DFN models to dual medium models & effective properties (step3)
In this step we translate the discrete fracture networks to a dual medium reservoir models by
determining which grid cells are single medium (matrix only) and which cells qualify for dual
medium. We then populate the fractured medium of the dual medium cells with effective
properties (Figure 2). Each DFN is represented by a dual medium model for use with
conventional flow simulators. The methods described in this section are standard approaches
and do not constitute the main contribution of this paper. In the scope of this study we did not
consider large fractures with long range connectivity. In the presented test case the fracture
intensity is varying between grid cells. Grid cells without sufficient fracture connectivity are
simulated as single medium, i.e. only the properties of the matrix are considered. To control
which cells are simulated as dual medium, we employed an auxiliary binary property “DPNUM”.
Cells with a DPNUM value of 1 are simulated as dual medium, cell with DPNUM equal to 0 are
run single medium. For single medium cells only the matrix properties are available. Various
approaches exist to detect which cells need to be considered as dual medium. We have decided
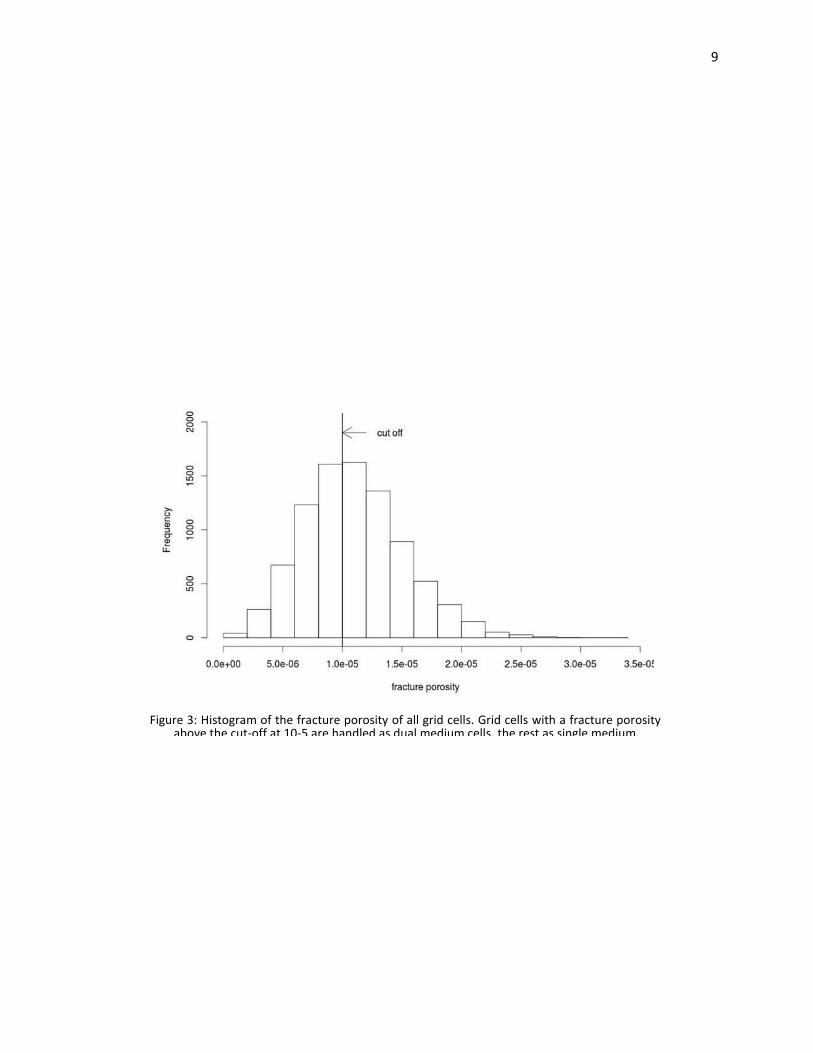
to determine dual medium cells based on a cut-off value of the fracture porosity, which is
highly correlated with the fracture intensity. The fracture porosity can be calculated rapidly
based on the volume of the fractures. The histogram of the fracture porosity of one flow model
and cut-off is shown in Figure 3. Based on this histogram, for our experiment we consider all
cells with a fracture porosity greater than 10-5 to contain dual media. Cells with fracture
porosity less than the cut-off are considered to have disconnected fractures and thus should
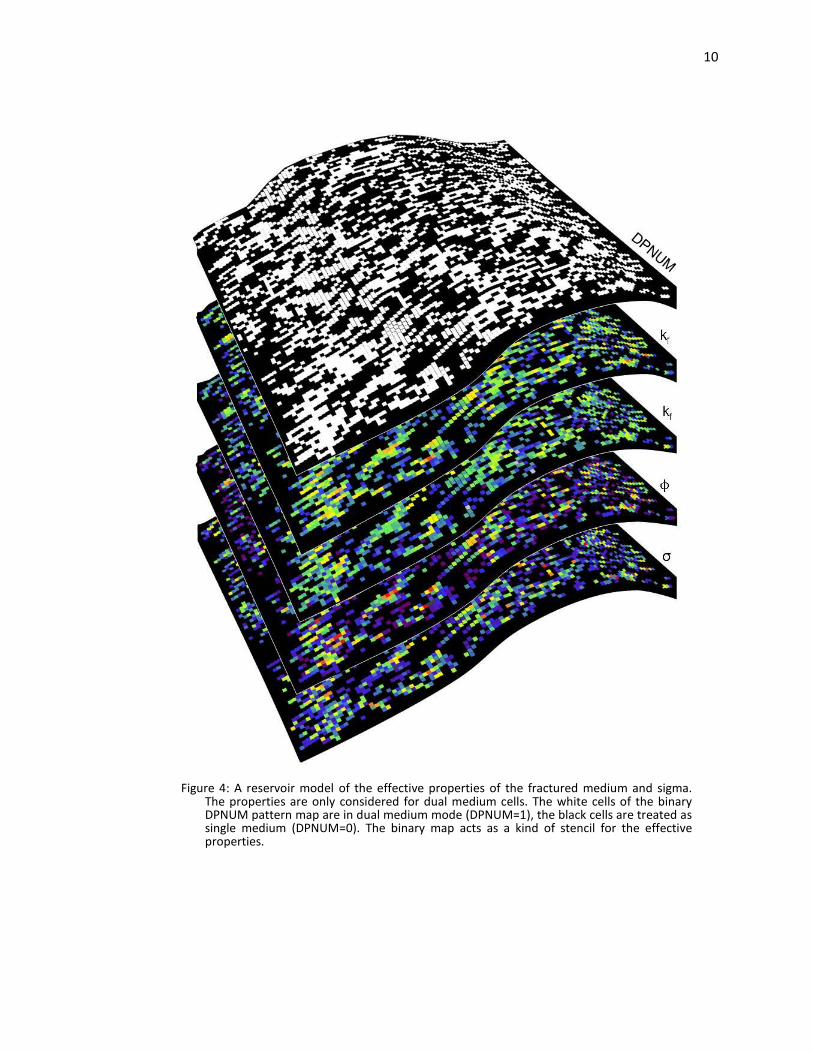
not be modeled using the dual-media paradigm. Figure 4 shows one flow model showing dual
media cells (white) and single media (black). The binary pattern reflects the underlying
connected fracture network as determined by the DFN model and porosity cut-off. As discussed
in the results section of this paper the binary pattern, i.e. spatial arrangement, of dual media
cells governs the flow response. For the effective properties, the fracture porosity and sigma
factor can be obtained directly. However, the upscaling of the fracture permeability is not
trivial and can be done analytically or flow-based. We have opted for the analytical method of
Oda (Oda, 1985) as it is substantially faster than flow-based upscaling. Although Oda is not
accurate for grid cells with low fracture intensity, it provides reasonable approximations, and its
speed makes it the method of choice for practitioners. The workflow however allows for
upscaling technique to be employed. We use a diagonal tensor representation for fracture
permeability as this is what is currently feasible in commercial simulators.
9
Figure 3: Histogram of the fracture porosity of all grid cells. Grid cells with a fracture porosity above the cut-off at 10-5 are handled as dual medium cells, the rest as single medium.
10
Figure 4: A reservoir model of the effective properties of the fractured medium and sigma. The properties are only considered for dual medium cells. The white cells of the binary DPNUM pattern map are in dual medium mode (DPNUM=1), the black cells are treated as single medium (DPNUM=0). The binary map acts as a kind of stencil for the effective properties.

11
Obtaining a representative set of training images (step 4)
Due to the complexity of fracture modeling (and its large uncertainty), one may not be able to
identify easily impacting input parameters that affect flow. Yet, in real cases, reservoir
engineers can rarely handle hundreds of fracture models or scenarios. Therefore, we propose
to reduce the set of all 156 possible scenarios to a more manageable set. We propose not to
work on parameter reduction but on pattern reduction (Caers, 2011). At the same time, this
reduced set needs to cover a similar uncertainty in flow as the original set. This will be
demonstrated later on in this paper.
To reduce the set of patterns yet maintain pattern diversity, we employ a distance-based
selection approach (Caers, 2011; Park et al., 2013; Scheidt & Caers, 2008, 2009). The
methodology presented in those papers applied to facies models (categorical variables) and due
to the translation of DFN to dual medium patterns, now becomes feasible on fractured
reservoirs modeled using dual medium flow behavior.
The selection approach aims at representing uncertainty through distances between models, in
this case the 156 scenarios. This distance then allows representing high-dimensional models in
low-dimensional space using multi-dimensional scaling (MDS), and, allows for grouping
scenarios into clusters with similar pattern characteristics. As described earlier in this paper we
have generated four realizations of each scenario leading to 624 patterns. To calculate the
distance between the 624 binary patterns, we employ the Modified Hausdorff Distances (MHD),
a distance which has been shown to be effective in distinguishing patterns containing thin lines
and sharp objects (Dubuisson & Jain, 1994). A k-medoid clustering technique (Maechler,
Rousseeuw, Struyf, Hubert, & Hornik, 2011) applied in metric space then allows selecting a
limited set of representative scenarios. We executed the clustering on the first two dimensions
of the Euclidean space created by MDS for which the Silhouette technique (Rousseeuw, 1987)
indicates a clear maximum at nine clusters. MHD is separates the patterns exceptionally good
into well-defined clusters. The patterns corresponding to the nine medoids then are used as
training images (Figure 5) in the following steps of the workflow, and are capable of capturing
uncertainty reasonably as shown in the results section. Note that the use of a MHD distance
does not require running any flow simulation; hence the selection technique is instantaneous.
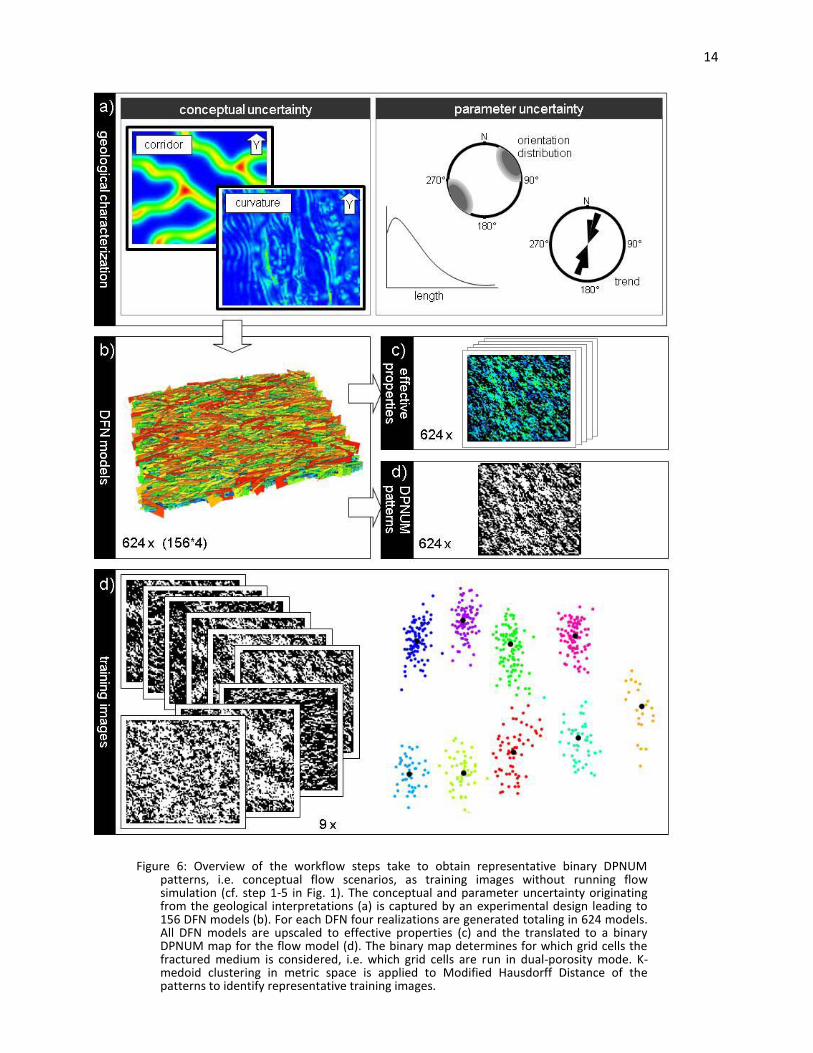
The workflow up to this stage is summarized in Figure 6.

12
Figure 5: The Modified Hausdorff Distance, a pattern-based distance, between the 624 binary maps (4 realizations of 156 scenarios) is mapped into metric space with Multi Dimensional Scaling. No absolute scale is shown for location of the data points because only the relative mutual distance is important. Similar patterns are located closer to together. Representative patterns are identified with k-medoids clustering and will be used as training images.

13
Generating fracture flow patterns from training images (step 5)
We used the MPS algorithm dispat (Honarkhah & Caers, 2010) to generate geostatistical binary
patterns for the reservoir based on the nine training images obtained in the previous step
(Figure 6). This allows modeling the within-scenario spatial uncertainty, where each scenario is
represented by a single training image. Dispat is a public domain fast pattern-based MPS
algorithm allowing the use of non-stationary training images (Honarkhah & Caers, 2012)
(https://github.com/SCRFpublic/DisPat). A comparison of the patterns obtained from initial
DFN models and patterns generated with MPS is shown in Figure 7. Once the basic flow model
represented through the binary map is generated, the dual medium cells (shown in white) are
populated with appropriate effective properties for the fractured medium. For simplification,
we populate the fractured medium with the constant average of each property, although this is
not a restriction to the methodology. How this is done specifically for this case as well as the
impact on the flow response is discussed in the results section, since this is not part of the
intended original contribution of this paper.
14
Figure 6: Overview of the workflow steps take to obtain representative binary DPNUM patterns, i.e. conceptual flow scenarios, as training images without running flow simulation (cf. step 1-5 in Fig. 1). The conceptual and parameter uncertainty originating from the geological interpretations (a) is captured by an experimental design leading to 156 DFN models (b). For each DFN four realizations are generated totaling in 624 models. All DFN models are upscaled to effective properties (c) and the translated to a binary DPNUM map for the flow model (d). The binary map determines for which grid cells the fractured medium is considered, i.e. which grid cells are run in dual-porosity mode. K-medoid clustering in metric space is applied to Modified Hausdorff Distance of the patterns to identify representative training images.

15
Figure 7: Comparison of binary DPNUM patterns obtained from DFN workflow (cf. steps 1-3 of the proposed workflow) and from the MPS workflow (cf. steps 6-7 of the proposed workflow). While it took several minutes to generate one pattern with the DFN workflow, it took only fifty milliseconds to simulate one pattern with the MPS algorithm Dispat.
16
Results
The goal of this study is to assess rapidly the field production performance of a large number of
models. The clustering of patterns based on the MHD was performed on the entire reservoir
scale, hence the selected nine patterns are targeted to predict global field production, not
individual well performance. In this section we will first assess which factor has the largest
impact on field production: dual medium properties (DPNUM) versus effective properties
(kf,φf,σ). Secondly we will compare the range of uncertainty, i.e. the variability, in flow
responses between two workflows to which we refer for convenience as “DFN-workflow” and
“MPS-workflow”. The DFN-workflow consists of generating DFN models, upscaling the fractures
to effective properties, and running flow simulations on the dual-medium models. This would
be the more standard approach. In the MPS-workflow the dual-medium models are directly
generated with MPS (step 5 of the workflow proposed in this paper) based on the selected
training-images obtained in step 4, and then flow simulated as well. This comparison will
therefore assess the effectiveness of the proposed workflow.
Impact of dual medium pattern versus effective properties
Our contribution focusses on dual medium patterns (DPNUM) and spatial distribution. However
flow simulation also requires specifying effective medium properties, such as porosity and
permeability for both dual and single medium cells, as well as the shape factor (σ). Since the
patterns generated with MPS are variations of the patterns in the training image, it is not
possible to simply copy the effective properties associated with each training image. To
populate the dual medium (DM) cells of MPS-simulated patterns fast with reasonable effective
properties for the fractured medium, we have decided to use the constant average of each
property (Figure 8). The average is calculated for each fracture property (kf,φf,σ) associated
with the training image individually while only considering dual medium cells. As we will show
in this section, using a constant average does not impact the flow response in our case because
the dual medium pattern is the most impacting factor. In the following we will compare
different ways to populate the dual medium cells with effective properties only focusing on the
fractured medium, because in our case the single medium cells contain only the properties of
matrix which are fixed and constant.
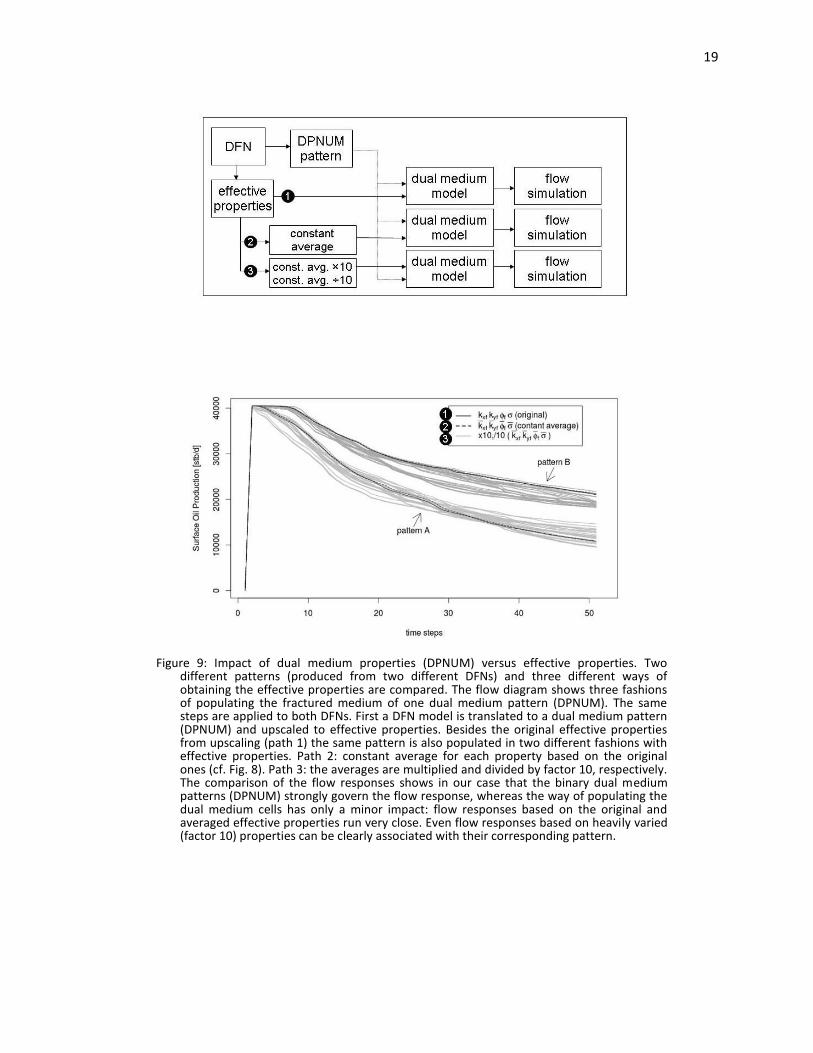
To evaluate the impact of the dual medium pattern versus the effective properties, we
populated the fractured medium of dual medium cells of two dual medium patterns in three
different fashions (see diagram in Figure 9):
17
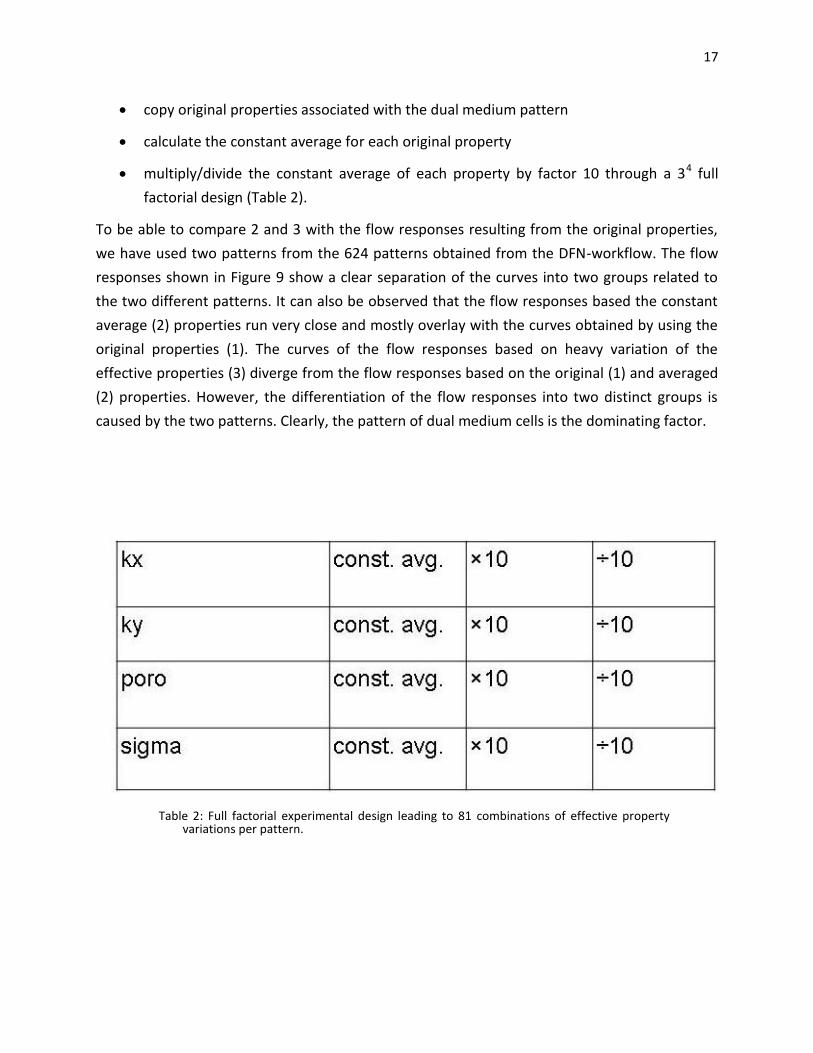
copy original properties associated with the dual medium pattern
calculate the constant average for each original property
multiply/divide the constant average of each property by factor 10 through a 34 full
factorial design (Table 2).
To be able to compare 2 and 3 with the flow responses resulting from the original properties,
we have used two patterns from the 624 patterns obtained from the DFN-workflow. The flow
responses shown in Figure 9 show a clear separation of the curves into two groups related to
the two different patterns. It can also be observed that the flow responses based the constant
average (2) properties run very close and mostly overlay with the curves obtained by using the
original properties (1). The curves of the flow responses based on heavy variation of the
effective properties (3) diverge from the flow responses based on the original (1) and averaged
(2) properties. However, the differentiation of the flow responses into two distinct groups is
caused by the two patterns. Clearly, the pattern of dual medium cells is the dominating factor.
Table 2: Full factorial experimental design leading to 81 combinations of effective property variations per pattern.
18
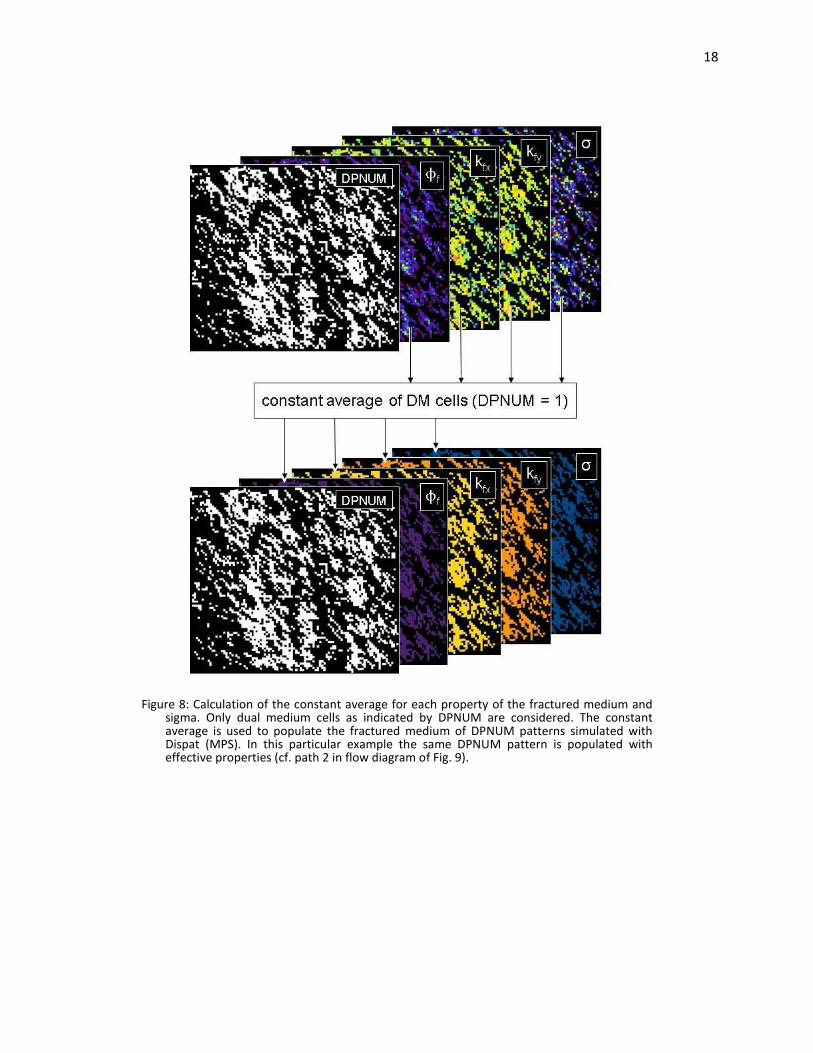
Figure 8: Calculation of the constant average for each property of the fractured medium and sigma. Only dual medium cells as indicated by DPNUM are considered. The constant average is used to populate the fractured medium of DPNUM patterns simulated with Dispat (MPS). In this particular example the same DPNUM pattern is populated with effective properties (cf. path 2 in flow diagram of Fig. 9).
19
Figure 9: Impact of dual medium properties (DPNUM) versus effective properties. Two different patterns (produced from two different DFNs) and three different ways of obtaining the effective properties are compared. The flow diagram shows three fashions of populating the fractured medium of one dual medium pattern (DPNUM). The same steps are applied to both DFNs. First a DFN model is translated to a dual medium pattern (DPNUM) and upscaled to effective properties. Besides the original effective properties from upscaling (path 1) the same pattern is also populated in two different fashions with effective properties. Path 2: constant average for each property based on the original ones (cf. Fig. 8). Path 3: the averages are multiplied and divided by factor 10, respectively. The comparison of the flow responses shows in our case that the binary dual medium patterns (DPNUM) strongly govern the flow response, whereas the way of populating the dual medium cells has only a minor impact: flow responses based on the original and averaged effective properties run very close. Even flow responses based on heavily varied (factor 10) properties can be clearly associated with their corresponding pattern.

20
Comparison of range of uncertainty
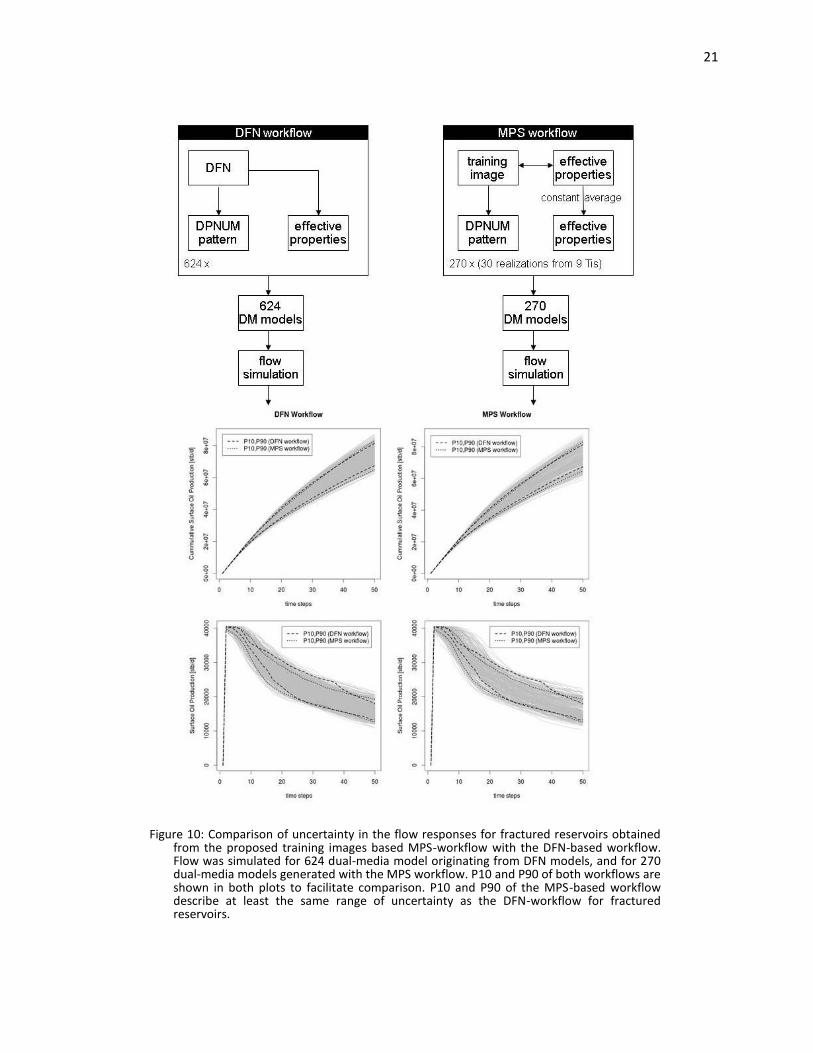
In this section we will show that our proposed MPS-workflow is suitable to fully cover the
uncertainty in flow response in a fraction of the time required by the DFN-workflow. Therefore
we will evaluate and compare flow responses of reservoir models generated by the two
workflows (see flow diagram in upper half of Figure 10). For the DFN-workflow we simulated
the flow responses of the 624 reservoir dual-medium models created in steps 1-4. These dual-
medium flow models are obtained through the upscaling of the actual DFN models. The process
of DFN generation and upscaling to effective properties took half a minute per model. The time
to generate the 624 models was 6 hours. For the MPS-workflow we simulated the flow
response for 270 dual-medium models in the following way: based on the nine training images
identified in step 5 we generated 30 realizations with the MPS algorithm Dispat. The variance in
flow response from these 30 models originates from the differences in the reproduced binary
patterns. The creation of one binary pattern with dispat took between 50 and 100 milli-
seconds, the subsequent population with effective properties is essentially instantaneous. The
time to generate the 270 DPNUM patterns was 20 seconds. Populating the cells of all models
with effective fracture properties via the averaging method took 30 seconds. For the total time
we are looking at 1 minute of the MPS-workflow versus one day for the DFN workflow. Note
that the MPS-workflow initially depends on the DFN-workflow for the creation of training
images. In practice however, the creation of the training image via the DFN-workflow is an
initial investment which allows later to generate thousands of earth models with the MPS-
workflow independently and rapid.
We will now compare the flow responses of the 624 flow models obtained from the DFN-
workflow with the 270 flow responses from the MPS-workflow. The uncertainty quantification
is based on the quantiles P10 and P90. The lower part of Figure 10 shows the flow responses
from both workflows. On left side are the 624 flow responses from the DFN-workflow, and on
the right side are the 270 flow responses from the MPS-workflow. The quantiles P10 and P90 of
both worfklows are shown in the left and the right side of Figure 10 to facilitate comparison.
The resulting flow responses show that the uncertainty in flow responses obtained from the
flow models generated with the MPS-based workflow capture uncertainty reasonably. The
curves for P10 and P90 run very close. In this reservoir study, the range of uncertainty covered
by the MPS- workflow is slightly greater.
21
Figure 10: Comparison of uncertainty in the flow responses for fractured reservoirs obtained from the proposed training images based MPS-workflow with the DFN-based workflow. Flow was simulated for 624 dual-media model originating from DFN models, and for 270 dual-media models generated with the MPS workflow. P10 and P90 of both workflows are shown in both plots to facilitate comparison. P10 and P90 of the MPS-based workflow describe at least the same range of uncertainty as the DFN-workflow for fractured reservoirs.

22
Impact of threshold on patterns and captured uncertainty
In this section we will evaluate the impact of the cut-off applied to the fracture porosity (φf)
when creating the binary dual medium models (DPNUM) in step 3 of the DFN-workflow.
Increasing or lowering the cut-off will lead to less or more dual medium cells, and change the
appearance of the patterns. Increasing the threshold lowers the number of dual medium cells
and leads to more refined patterns. Lowering the threshold increases the number of dual
medium cells and leads to more coarse patterns. To evaluate the sensitivity to the fracture
porosity threshold, we have increased and lowered the threshold by 10% in step 3 of the DFN-
workflow. For the increased as well for the lowered threshold we have applied the complete
workflow. The steps taken are summarized in Figure 11. In short, starting from the original 624
DFN models, we produced two additional sets of 624 binary patterns each corresponding to the
two threshold variations (+ 10%, -10%), calculated the Modified Hausdorff Distance between
each group of 624 patterns separately, executed multi-dimensional scaling (MDS) and k-medoid
clustering to identify training images in each group, generated 30 realizations for each training
image with Dispat (MPS), populated the dual medium cells with effective properties, and
performed flow simulations. For detailed explanation of the workflow please refer to
methodology section of this paper. In the group with 10% increased threshold we have
identified 9 training images shown in Figure 11. For the 10% decreased threshold we also have
identified 9 training images show in Figure 12. Although the patterns become either more
refined or coarse in comparison to the patterns obtained using the original threshold, the basic
structure does not change. All three levels of the threshold lead to 9 training images. Figure 13
compares the range of uncertainty (P10,P90) calculated from the flow responses based on
three different fracture porosity thresholds (270 flow responses per threshold): original (10-5),
+10%, -10%. The P10 and P90 for each threshold run very close, and capture similar ranges of
uncertainty.

23
Figure 11: To compare the impact of the threshold/cut-off on fracture porosity used during the pattern production in step 3 of the workflow, we re-run the workflow for two additional thresholds. Therefore we increased and decreased the original threshold by 10%.
24
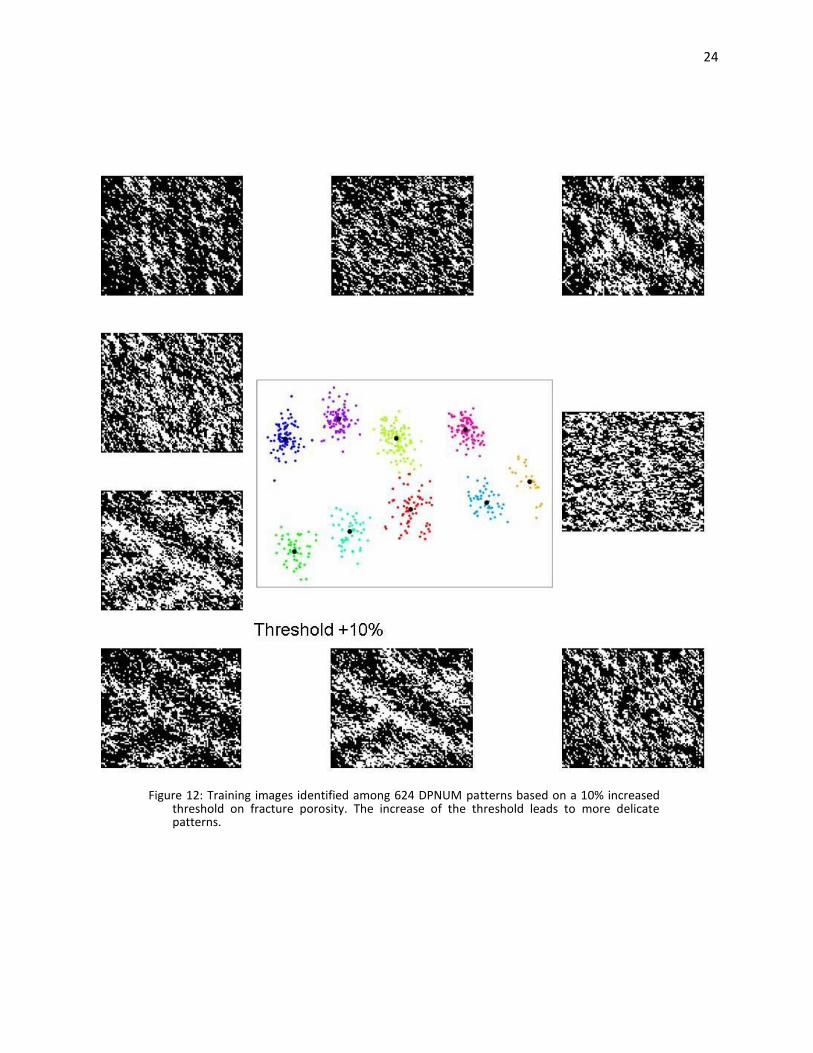
Figure 12: Training images identified among 624 DPNUM patterns based on a 10% increased threshold on fracture porosity. The increase of the threshold leads to more delicate patterns.
25
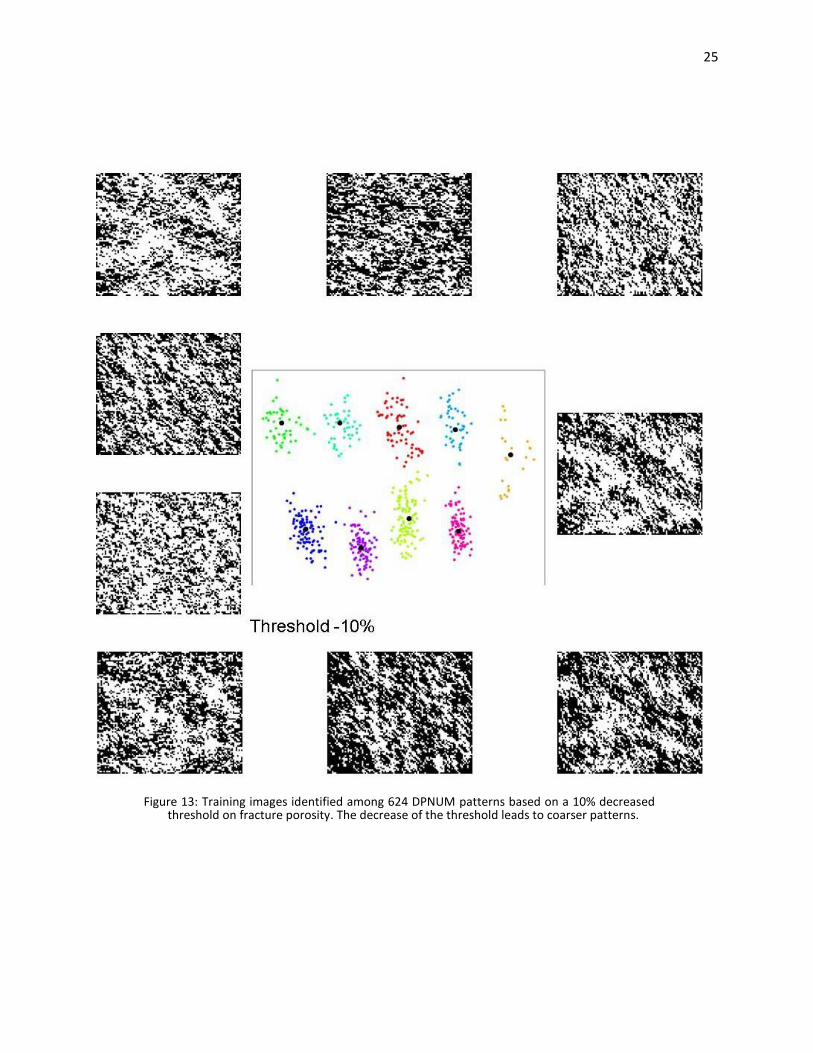
Figure 13: Training images identified among 624 DPNUM patterns based on a 10% decreased threshold on fracture porosity. The decrease of the threshold leads to coarser patterns.

26
Figure 14: Evaluation of the impact of the threshold used for DPNUM pattern production on the uncertainty in flow responses. For each of the three different thresholds the MPS-workflow was run and dual medium models were generated for flow simulation. The used training images are shown in Fig. 5, 12 and 13. The variation of the threshold by 10% does in our case not influence the range of uncertainty.

27
Conclusions
In this paper we have introduced a pattern and training image-based approach to dual porosity
descriptions of naturally fractured reservoirs. The patterns of effective properties are obtained
from Discrete Fracture Networks (DFN) to preserve geologic consistency. Once relevant
patterns are obtained, the tedious task of DFN modeling is no longer required. The generation
of large numbers of earth models with MPS can be achieved in a fraction of the time and with
far fewer computer resources necessary to generate the same amount of DFN models. We have
shown that the pattern-based approach is able to capture uncertainty of the flow responses
reasonably. Due to the selection of already available components, the proposed workflow will
be easy to integrate into existing reservoir modeling software. Further, the modular design of
the workflow provides the freedom to employ different techniques, e.g. for clustering, MPS
algorithm, and flow simulations.
Acknowledgements
We would like to thank Golder Associates for providing us with the DFN modeling package
Fracman. Also we would like to thank all sponsors of the Stanford Center for Reservoir
Forecasting for supporting our research.
28
References
Bond, C. E., Gibbs, A. D., Shipton, Z. K., & Jones, S. (2007). What do you think this is? “Conceptual uncertainty” in geoscience interpretation. GSA Today, 17(11), 4–10.
Bourbiaux, B., Basquet, R., Cacas, M.-C., Daniel, J.-M., & Sarda, S. (2002). An Integrated Workflow to Account for Multi-Scale Fractures in Reservoir Simulation Models: Implementation and Benefits. In Proceedings of Abu Dhabi International Petroleum Exhibition and Conference. Presented at the Abu Dhabi International Petroleum Exhibition and Conference. doi:10.2118/78489-MS
Cacas, M. C., Daniel, J. M., & Letouzey, J. (2001). Nested geological modelling of naturally fractured reservoirs. Petroleum Geoscience, 7, 43–52. doi:10.1144/petgeo.7.S.S43
Caers, J. (2011). Modeling Uncertainty in the Earth Sciences. Wiley. Retrieved from http://onlinelibrary.wiley.com/book/10.1002/9781119995920
Caers, J., Strebelle, S., & Payrazyan, K. (2003). Stochastic integration of seismic data and geologic scenarios: A West Africa submarine channel saga. The Leading Edge, 22(3), 192–196. doi:10.1190/1.1564521
Caers, J., & Zhang, T. (2002). Multiple-point Geostatistics: A Quantitative Vehicle for Integrating Geologic Analogs into Multiple Reservoir Models. In G. M. Grammer, P. M. Harris, & G. P. Eberli (Eds.), Integration of Outcrop and Modern Analogs in Reservoir Modeling (Vol. 80, pp. 383–394). AAPG.
Cherpeau, N., Caumon, G., Caers, J., & Lévy, B. (2012). Method for Stochastic Inverse Modeling of Fault Geometry and Connectivity Using Flow Data. Mathematical Geosciences, 44(2), 147–168. doi:10.1007/s11004-012-9389-2
Chopra, S. (2002). Coherence cube and beyond. First Break, 20(1), 27–33. doi:10.1046/j.1365-2397.2002.00225.x
Chopra, S., & Marfurt, K. J. (2007). Volumetric curvature attributes for fault/fracture characterization. First Break, 25(7), 35–46.
Daly, C., & Caers, J. (2010). Multi-point geostatistics - an introductory overview. First Break, 28(9), 39–47.
Dershowitz, B., LaPointe, P., Eiben, T., & Wei, L. (2000). Integration of Discrete Feature Network Methods With Conventional Simulator Approaches. SPE Reservoir Evaluation & Engineering, 3(2). doi:10.2118/62498-PA
Dershowitz, W. S., & Herda, H. H. (1992). Interpretation of fracture spacing and intensity. In Tillerson & Wawersik (Eds.), The 33th U.S. Symposium on Rock Mechanics (USRMS), June 3 - 5, 1992 , Santa Fe, NM (pp. 757–766). American Rock Mechanics Association.
Dubuisson, M.-P., & Jain, A. K. (1994). A modified Hausdorff distance for object matching. In , Proceedings of the 12th IAPR International Conference on Pattern Recognition, 1994. Vol. 1 - Conference A: Computer Vision Image Processing (Vol. 1, pp. 566 –568 vol.1). Presented at the , Proceedings of the 12th IAPR International Conference on Pattern Recognition, 1994. Vol. 1 - Conference A: Computer Vision Image Processing. doi:10.1109/ICPR.1994.576361
Feyen, L., & Caers, J. (2006). Quantifying geological uncertainty for flow and transport modeling in multi-modal heterogeneous formations. Advances in Water Resources, 29(6), 912–929. doi:10.1016/j.advwatres.2005.08.002
Gabrielsen, R. H. (1990). Characterization of joints and faults. In Rock Joints: Proceedings of a regional conference of the International Society for Rock Mechanics, Loen, 4-6 June 1990 (pp. 11–17). Rotterdam: Taylor & Francis (Balkema).
Golder Associates. (2012). FracMan. Redmond, USA. Retrieved from http://www.fracman.com/
Guerriero, V., Iannace, A., Mazzoli, S., Parente, M., Vitale, S., & Giorgioni, M. (2010). Quantifying uncertainties in multi-scale studies of fractured reservoir analogues: Implemented statistical analysis of scan line data from carbonate rocks. Journal of Structural Geology, 32(9), 1271–1278. doi:10.1016/j.jsg.2009.04.016
29
Honarkhah, M., & Caers, J. (2010). Stochastic Simulation of Patterns Using Distance-Based Pattern Modeling. Mathematical Geosciences, 42(5), 487–517. doi:10.1007/s11004-010-9276-7
Honarkhah, M., & Caers, J. (2012). Direct Pattern-Based Simulation of Non-stationary Geostatistical Models. Mathematical Geosciences, 44(6), 651–672. doi:10.1007/s11004-012-9413-6
Hu, L. Y., & Chugunova, T. (2008). Multiple-point geostatistics for modeling subsurface heterogeneity: A comprehensive review. Water Resources Research, 44(11), W11413. doi:10.1029/2008WR006993
Jones, M. A., Pringle, A. B., Fulton, I. M., & O’Neill, S. (1999). Discrete fracture network modelling applied to groundwater resource exploitation in southwest Ireland. Geological Society, London, Special Publications, 155(1), 83–103. doi:10.1144/GSL.SP.1999.155.01.08
Kazemi, H., L.S., M., Porterfield, K. L., & Zeman, P. R. (1976). Numerical Simulation of Water-Oil Flow in Naturally Fractured Reservoirs. SPE Journal, 16(6). doi:10.2118/5719-PA
Maechler, M., Rousseeuw, P., Struyf, A., Hubert, M., & Hornik, K. (2011). cluster: Cluster Analysis Basics and Extensions. R package version 1.14.1.
Narr, W., Schechter, D. S., & Thompson, L. B. (2006). Naturally Fractured Reservoir Characterization. Richardson, Texas, USA: Society of Petroleum Engineers.
Nelson, R. (2001). Geologic Analysis of Naturally Fractured Reservoirs (2nd ed.). Gulf Professional Publishing.
Neves, F. A., Zahrani, M. S., & Bremkamp, S. W. (2004). Detection of potential fractures and small faults using seismic attributes. The Leading Edge, 23(9), 903–906. doi:10.1190/1.1803500
Oda, M. (1985). Permeability tensor for discontinuous rock masses. Geotechnique, 35(4), 483–495. doi:10.1680/geot.1985.35.4.483
Park, H., Scheidt, C., Fenwick, D., Boucher, A., & Caers, J. (2013). History matching and uncertainty quantification of facies models with multiple geological interpretations. Computational Geosciences, 1–13. doi:10.1007/s10596-013-9343-5
Questiaux, J.-M., Couples, G. D., & Ruby, N. (2010). Fractured reservoirs with fracture corridors. Geophysical Prospecting, 58(2), 279–295. doi:10.1111/j.1365-2478.2009.00810.x
Rousseeuw, P. J. (1987). Silhouettes: A graphical aid to the interpretation and validation of cluster analysis. Journal of Computational and Applied Mathematics, 20, 53–65. doi:10.1016/0377-0427(87)90125-7
Saleri, N. G., Al-Kaabi, A. O., & Muallem, A. S. (2006). Haradh III: A Milestone for Smart Fields. Journal of Petroleum Technology, 58(11), 28–32.
Scheidt, C., & Caers, J. (2008). Representing Spatial Uncertainty Using Distances and Kernels. Mathematical Geosciences, 41(4), 397–419. doi:10.1007/s11004-008-9186-0
Scheidt, C., & Caers, J. (2009). Uncertainty Quantification in Reservoir Performance Using Distances and Kernel Methods - Application to a West Africa Deepwater Turbidite Reservoir. SPE Journal, 14(4). doi:10.2118/118740-PA
Souche, L., Astratti, D., Aarre, V., Clerc, N., Clark, A., Al Dayyni, T. N. A., & Mahmoud, S. L. (2012). A dual representation of multiscale fracture network modelling: application to a giant UAE carbonate field. First Break, 30(5), 43–52.
Strebelle, S. (2002). Conditional Simulation of Complex Geological Structures Using Multiple-Point Statistics. Mathematical Geology, 34(1), 1–21. doi:10.1023/A:1014009426274
Suzuki, S., Caumon, G., & Caers, J. (2008). Dynamic data integration for structural modeling: model screening approach using a distance-based model parameterization. Computational Geosciences, 12(1), 105–119. doi:10.1007/s10596-007-9063-9
Warren, J. E., & Root, P. J. (1963). The Behavior of Naturally Fractured Reservoirs. Society of Petroleum Engineers

30
Journal, 3(3). doi:10.2118/426-PA
Zahm, C. K., & Hennings, P. H. (2009). Complex fracture development related to stratigraphic architecture: Challenges for structural deformation prediction, Tensleep Sandstone at the Alcova anticline, Wyoming. AAPG Bulletin, 93(11), 1427–1446. doi:10.1306/08040909110
Zhong, J., Aydina, A., & McGuinness, D. L. (2009). Ontology of fractures. Journal of Structural Geology, 31(3), 251–259. doi:10.1016/j.jsg.2009.01.008