Embed Size (px)
Citation preview

TRAI Audit Wireless Report for Kolkata
Circle
EAST ZONE
Prepared by:
`
Submitted to:
QE March 2017
TRAI RO, Kolkata
TRAI Audit Wireless Report-Kolkata Circle JFM Quarter-2017
1
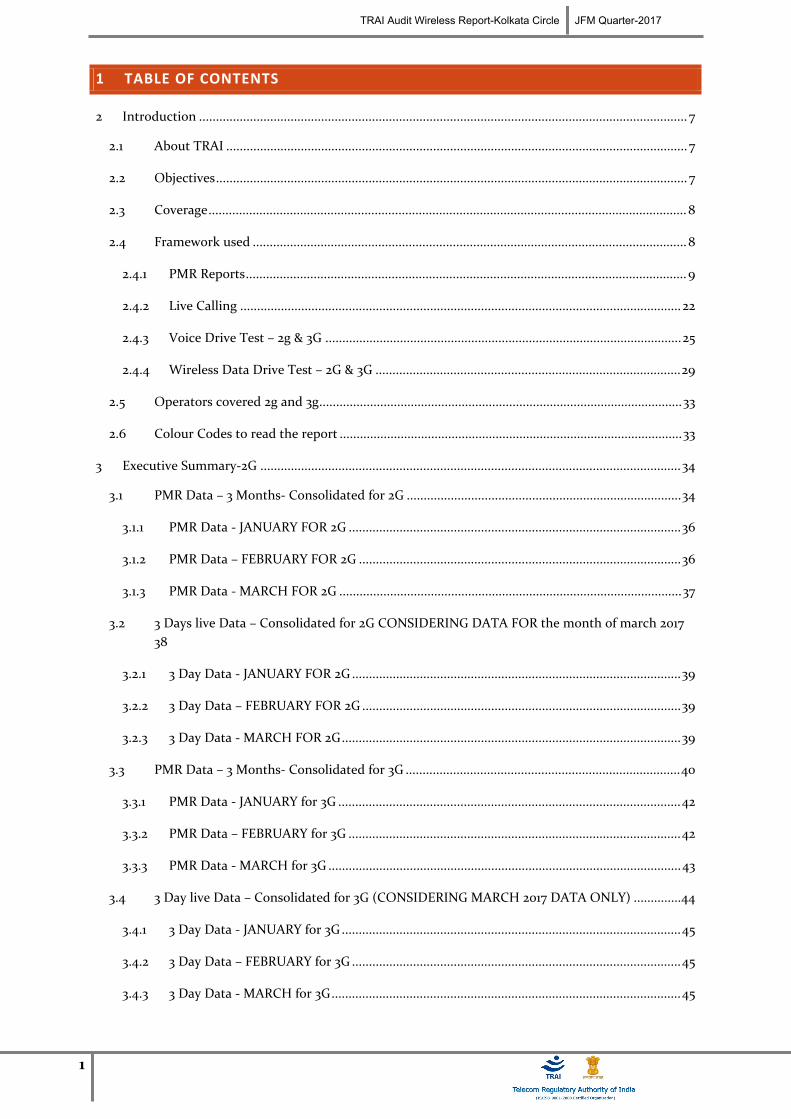
1 TABLE OF CONTENTS
2 Introduction ................................................................................................................................................ 7
2.1 About TRAI ........................................................................................................................................ 7
2.2 Objectives........................................................................................................................................... 7
2.3 Coverage............................................................................................................................................. 8
2.4 Framework used ................................................................................................................................8
2.4.1 PMR Reports..................................................................................................................................9
2.4.2 Live Calling .................................................................................................................................. 22
2.4.3 Voice Drive Test – 2g & 3G .........................................................................................................25
2.4.4 Wireless Data Drive Test – 2G & 3G ..........................................................................................29
2.5 Operators covered 2g and 3g...........................................................................................................33
2.6 Colour Codes to read the report .....................................................................................................33
3 Executive Summary-2G ............................................................................................................................ 34
3.1 PMR Data – 3 Months- Consolidated for 2G .................................................................................34
3.1.1 PMR Data - JANUARY FOR 2G ..................................................................................................36
3.1.2 PMR Data – FEBRUARY FOR 2G ...............................................................................................36
3.1.3 PMR Data - MARCH FOR 2G .....................................................................................................37
3.2 3 Days live Data – Consolidated for 2G CONSIDERING DATA FOR the month of march 201738
3.2.1 3 Day Data - JANUARY FOR 2G.................................................................................................39
3.2.2 3 Day Data – FEBRUARY FOR 2G ..............................................................................................39
3.2.3 3 Day Data - MARCH FOR 2G....................................................................................................39
3.3 PMR Data – 3 Months- Consolidated for 3G .................................................................................40
3.3.1 PMR Data - JANUARY for 3G .....................................................................................................42
3.3.2 PMR Data – FEBRUARY for 3G ..................................................................................................42
3.3.3 PMR Data - MARCH for 3G ........................................................................................................43
3.4 3 Day live Data – Consolidated for 3G (CONSIDERING MARCH 2017 DATA ONLY) ..............44
3.4.1 3 Day Data - JANUARY for 3G....................................................................................................45
3.4.2 3 Day Data – FEBRUARY for 3G .................................................................................................45
3.4.3 3 Day Data - MARCH for 3G.......................................................................................................45

TRAI Audit Wireless Report-Kolkata Circle JFM Quarter-2017
2
3.5 Wireless data PMR & 3 Day Live – Consolidated for 2G ..............................................................46
3.6 Wireless data PMR & 3 Day Live – Consolidated for 3G...............................................................47
3.7 Live Calling Data – Consolidated ...................................................................................................48
3.8 Billing and customer care – Consolidated.....................................................................................49
3.9 Inter Operator Call Assessment – Consolidated............................................................................51
3.10 Comparison Between TRAI RO and Operator’s data for PMR 2G...............................................52
3.11 Comparison Between TRAI RO and Operator’s data for PMR 3G ...............................................53
4 Critical Findings........................................................................................................................................ 54
5 Parameter Description & Detailed Findings - Comparison Between PMR Data, 3 Day Live Data and Live Calling Data for 2G ................................................................................................................................... 55
5.1 BTS Accumulated Downtime..........................................................................................................55
5.1.1 Parameter Description ................................................................................................................55
5.1.2 Key Findings - Consolidated ......................................................................................................56
5.2 Worst Affected BTS due to downtime ...........................................................................................59
5.2.1 Parameter Description................................................................................................................59
5.2.2 Key Findings – Consolidated......................................................................................................60
5.3 Call Set Up Success Rate .................................................................................................................63
5.3.1 Parameter Description................................................................................................................63
5.3.2 Key Findings - Consolidated ......................................................................................................64
5.4 Network Channel Congestion- Paging Channel /TCH Congestion/POI....................................66
5.4.1 Parameter Description................................................................................................................66
5.4.2 Key Findings - SDCCH/Paging Channel Congestion (Consolidated) .....................................67
5.4.3 Key Findings – TCH Congestion (Consolidated)......................................................................69
5.4.4 Key Findings – POI Congestion (Consolidated) – Average of 3 months.................................72
5.5 Call Drop Rate.................................................................................................................................. 76
5.5.1 Parameter Description................................................................................................................76
5.5.2 Key Findings - Consolidated.......................................................................................................77
5.6 Cells having greater than 3% TCH drop ........................................................................................79
5.6.1 Parameter Description................................................................................................................79
5.6.2 Key Findings - Consolidated ......................................................................................................80
5.7 Voice Quality ...................................................................................................................................82

TRAI Audit Wireless Report-Kolkata Circle JFM Quarter-2017
3
5.7.1 Parameter Description................................................................................................................82
5.7.2 Key Findings ................................................................................................................................83
6 Parameter Description & Detailed Findings - Comparison Between PMR Data, 3 Day Live Data and Live Calling Data for 3G ...................................................................................................................................85
6.1 Node Bs downtime ..........................................................................................................................85
6.1.1 Parameter Description................................................................................................................85
6.1.2 Key Findings - Consolidated ......................................................................................................86
6.2 Worst affected Node Bs due to downtime ....................................................................................89
6.2.1 Parameter Description................................................................................................................89
6.2.2 Key Findings – Consolidated......................................................................................................90
6.3 Call Set Up Success Rate .................................................................................................................92
6.3.1 Parameter Description................................................................................................................92
6.3.2 Key Findings - Consolidated.......................................................................................................93
6.4 Network Channel Congestion- RRC Congestion/ Circuit Switched RAB Congestion...............96
6.4.1 Parameter Description................................................................................................................96
6.4.2 Key Findings - RRC Congestion (Consolidated).......................................................................98
6.4.3 Key Findings – Circuit Switched RAB Congestion (Consolidated)........................................100
6.5 Circuit Switched Voice Drop Rate ................................................................................................ 102
6.5.1 Parameter Description............................................................................................................... 102
6.5.2 Key Findings - Consolidated ..................................................................................................... 103
6.6 Worst affected cells having more than 3% Circuit Switched Voice Drop Rate .........................105
6.6.1 Parameter Description............................................................................................................... 105
6.6.2 Key Findings - Consolidated ..................................................................................................... 106
6.7 Circuit Switch Voice Quality......................................................................................................... 109
6.7.1 Parameter Description .............................................................................................................. 109
6.7.2 Key Findings................................................................................................................................ 110
7 Parameter Description & Detailed Findings - Wireless Data Services 2G ...........................................112
7.1 Service Activation /Provisioning for 2G ........................................................................................112
7.1.1 Parameter Description ............................................................................................................... 112
7.2 PDP Context Activation Success Rate for 2G................................................................................115
7.2.1 Parameter Description................................................................................................................ 115

TRAI Audit Wireless Report-Kolkata Circle JFM Quarter-2017
4
7.2.2 Key Findings................................................................................................................................ 115
7.3 Drop rate for 2G .............................................................................................................................. 117
7.3.1 Parameter Description ............................................................................................................... 117
7.3.2 Key Findings................................................................................................................................ 118
8 Parameter Description & Detailed Findings - Wireless Data Services 3G...........................................120
8.1 Service Activation /Provisioning for 3G........................................................................................120
8.1.1 Parameter Description............................................................................................................... 120
8.1.2 Key Findings ............................................................................................................................... 120
8.2 PDP Context Activation Success Rate for 3G ...............................................................................123
8.2.1 Parameter Description............................................................................................................... 123
8.2.2 Key Findings ............................................................................................................................... 123
8.3 Drop rate for 3G.............................................................................................................................. 125
8.3.1 Parameter Description............................................................................................................... 125
8.3.2 Key Findings ............................................................................................................................... 126
9 Parameter Description and Detailed Findings – Non-Network Parameters ......................................128
9.1 Metering and billing credibility .................................................................................................... 128
9.1.1 Parameter Description............................................................................................................... 128
9.1.2 Key Findings – Metering and billing credibility (Postpaid)....................................................130
9.1.3 Key Findings - Metering and billing credibility (Prepaid).......................................................131
9.2 Resolution of Billing/ Charging Complaints ................................................................................132
9.2.1 Parameter Description............................................................................................................... 132
9.2.2 Key Findings - within 4 weeks .................................................................................................. 134
9.2.3 Key Findings within 6 weeks..................................................................................................... 134
9.3 Period of Applying Credit/Wavier ................................................................................................ 135
9.3.1 Parameter Description ............................................................................................................... 135
9.3.2 Key Findings ............................................................................................................................... 136
9.4 Call Centre Performance-IVR ........................................................................................................ 137
9.4.1 Parameter Description............................................................................................................... 137
9.4.2 Key Findings ............................................................................................................................... 138
9.5 Call Centre Performance-Voice to Voice......................................................................................139

TRAI Audit Wireless Report-Kolkata Circle JFM Quarter-2017
5
9.5.1 Parameter Description............................................................................................................... 139
9.5.2 Key Findings............................................................................................................................... 140
9.6 Termination/Closure of Service..................................................................................................... 141
9.6.1 Parameter Description ............................................................................................................... 141
9.6.2 Key Findings ............................................................................................................................... 142
9.7 Refund of Deposits After closure .................................................................................................. 142
9.7.1 Parameter Description............................................................................................................... 142
9.7.2 Key Findings ............................................................................................................................... 143
10 Detailed Findings - Drive Test Data....................................................................................................... 144
10.1 Operator Assisted Drive Test - voice ............................................................................................144
11 Annexure – Consolidated-2G.................................................................................................................. 145
11.1 Network Availability ...................................................................................................................... 145
11.2 Connection Establishment (Accessibility) ...................................................................................146
11.3 Connection Maintenance (Retainability) .....................................................................................147
11.4 Voice quality................................................................................................................................... 148
11.5 POI Congestion .............................................................................................................................. 149
11.6 Additional Network Related parameters......................................................................................150
12 Annexure – Consolidated-3G................................................................................................................... 151
12.1 Network Availability ....................................................................................................................... 151
12.2 Connection Establishment (Accessibility)....................................................................................152
12.3 Connection Maintenance (Retainability) .....................................................................................153
12.4 Voice quality ................................................................................................................................... 154
12.5 POI Congestion .............................................................................................................................. 154
12.6 Additional Network Related parameters ......................................................................................155
13 Annexure – Customer Services ............................................................................................................... 156
13.1 Metering and billing credibility .................................................................................................... 156
13.2 Customer Care................................................................................................................................ 160
13.3 Termination / closure of service .................................................................................................... 161
13.4 Time taken for refund of deposits after closure ...........................................................................161
13.5 Live Calling Results for Resolution of Service Requests..............................................................162

TRAI Audit Wireless Report-Kolkata Circle JFM Quarter-2017
6
13.6 Live Calling Results for Level 1 Services........................................................................................162
13.7 Level 1 Service calls made .............................................................................................................. 163
13.8 Counter Details .............................................................................................................................. 180
13.8.1 Ericsson .................................................................................................................................. 182
13.8.2 NSN (Nokia Siemens Networks)...........................................................................................183
13.8.3 Huawei ................................................................................................................................... 184
13.9 Block Schematic Diagrams............................................................................................................ 186
13.9.1 Ericsson .................................................................................................................................. 186
13.9.2 NSN (Nokia Siemens Networks) ..........................................................................................187
13.9.3 Huawei ................................................................................................................................... 188
14 Annexure – JANUARY -2G...................................................................................................................... 189
15 Annexure – FEBRUARY-2G .................................................................................................................... 194
16 Annexure – MARCH-2G.......................................................................................................................... 199
17 Annexure – JANUARY -3G .....................................................................................................................204
18 Annexure – FEBRUARY-3G....................................................................................................................209
19 Annexure – MARCH-3G ..........................................................................................................................214
20 Abbreviations ........................................................................................................................................... 219

TRAI Audit Wireless Report-Kolkata Circle JFM Quarter-2017
7
2 INTRODUCTION
2.1 ABOUT TRAI
TRAI's mission is to create and nurture conditions for growth of telecommunications in the country in a manner and at a pace that will enable India to play a leading role in the emerging global information society. One of the main objectives of TRAI is to provide a fair and transparent policy environment which promotes a level playing field and facilitates fair competition.
In pursuance of above objective, TRAI has been issuing regulations, order and directives to deal with the issues or complaints raised by the operators as well as the consumers. These regulations, order and directives have helped to nurture the growth of multi operator multi service - an open competitive market from a government owned monopoly. Also, the directions, orders and regulations issued cover a wide range of subjects including tariff, interconnection and quality of service as well as governance of the Authority.
TRAI initiated a regulation - The Standard of Quality of Service of Basic Telephone Service (Wireline) and Cellular Mobile Telephone Service regulations, 2009 (7 of 2009) dated December 20, 2009 and Quality of Service of Broadband Service Regulations, 2006 (11 of 2006) dated October 6, 2006 that provide the benchmarks for the parameters on customer perception of service to be achieved by service provider.
In order to assess the above regulations, TRAI has commissioned a third party agency to conduct the audit of the service providers and check the performance of the operators on the various benchmarks set by Telecom Regulatory Authority of India (TRAI).
2.2 OBJECTIVES
The primary objective of the Audit module is to-
Audit and Assess the Quality of Services being rendered by Basic (Wireline), Cellular Mobile (Wireless), and Broadband service against the parameters notified by TRAI. (The parameters of Quality of Services (QoS) have been specified by in the respective regulations published by TRAI).
This report covers the audit results of the audit conducted for Cellular Mobile (Wireless) services in Kolkata circle.

TRAI Audit Wireless Report-Kolkata Circle JFM Quarter-2017
8
2.3 COVERAGE
The audit was conducted in Kolkata circle covering all the SSAs (Secondary Switching Areas).
2.4 FRAMEWORK USED
Audit Actvities
PMR Reports
Monthly PMR
3 Day LiveData
CustomerService
Drive Test
Operator Assisted
Independent
Live Calling
Billing Complaints
Service Requests
Level 1 Service
Customer Care
Inter Operator call
Let’s discuss each of the activity in detail and the methodology adopted for each of the module.

TRAI Audit Wireless Report-Kolkata Circle JFM Quarter-2017
9
2.4.1 PMR REPORTS
2.4.1.1 SIGNIFICANCE AND METHODOLOGY
PMR or Performance Monitoring Reports are generated to assess the various Quality of Service parameters involved in the mobile telephony service, which indicate the overall health of service for an operator.
The newly generated PMR reports are then taken in hard copy, duly signed by thecompetent authority of operators. TRAI RO auditors also sign the same report.
All the calculations are done by TRAI RO auditors to generate a new PMR reportfrom that raw data.
During TRAI audit, raw data is extracted from the operator’s server/ NOC/exchange/ OMC/ customer service center/ billing center etc. by the TRAI ROauditor with assistance from the operator personnel in order to generate PMR
reports (Network/ Billing /Customer Service etc).
The TRAI RO auditors inform the operators about the audit schedule in advance.Accordingly, the auditors visit the operator premises to conduct the audit.
The PMR report for network parameters is taken for each month of the audit quarter and is required to be extracted and verified in the first week of the subsequent month of the audit month. However as per present scenario PMR data for last Quarter was collected in the month of April, 2017.
The PMR report for customer service parameters is extracted from Customer Service Center and verified once every quarter in the subsequent month of the last month of the quarter. For existing Quarter report the date was verified in the month of April, 2017 and May, 2017
The raw data extracted from operator’s systems is used to create PMR in the following three formats.
Monthly PMR (Network Parameters & Wireless Data Services) – 2G & 3G 3 Day Live Measurement Data (Network Parameters & Wireless Data Services) – 2G & 3G Customer Service Data
Let us understand these formats in detail.

TRAI Audit Wireless Report-Kolkata Circle JFM Quarter-2017
10
2.4.1.2 MONTHLY PMR 2G
This involved calculation of the various 2G Quality of Service network parameters through monthly Performance Monitoring Reports (PMR). The PMR reports were generated from the data extracted from operator’s systems by the TRAI RO representatives with the assistance of the operator at TRAI, RO, Kolkata office for the month of January, February and March 2017. The performance of operators on various parameters was assessed against the benchmarks. Parameters include-
BTS accumulated downtimeWorst affected BTS due to downtime
Network Availability
Call Set Up success Rate (CSSR)
Connection Establishment (Accessibility)
SDCCH/Paging Channel CongestionTCH CongestionPoint of Interconnection
Network Congestion Parameters
Call Drop rateWorst affected cells having more than 3% TCH drop
Connection Maintenance
% Connections with good voice quality
Voice Quality
All the parameters have been described in detail along with key findings of the parameters in section 5 of the report. The benchmark values for each parameter have been given in the table below.

TRAI Audit Wireless Report-Kolkata Circle JFM Quarter-2017
11
2.4.1.3 AUDIT PARAMETERS – NETWORK 2G
Let us now look at the various parameters involved in the audit reports.
Network Related
Network Parameters - 2G
Parameter Category Parameter Benchmark
BTSs Accumulated downtime (not available for service) ≤ 2%Network Availability
Worst affected BTSs due to downtime ≤ 2%
Call Set-up Success Rate (within licensee's own network) ≥ 95%
SDCCH/ Paging Chl. Congestion (%age) ≤ 1%Connection Establishment (Accessibility) TCH Congestion (%age) ≤ 2%
Call Drop Rate (%age) ≤ 2%
Worst affected cells having more than 3% TCH drop ≤ 3%
%age of connection with good voice quality ≥ 95%
Connection Maintenance (Retainability)
Point of Interconnection (POI) ≤ 0.5%

TRAI Audit Wireless Report-Kolkata Circle JFM Quarter-2017
12
2.4.1.4 MONTHLY PMR 3G
This involved calculation of the various 3G Quality of Service network parameters through monthly Performance Monitoring Reports (PMR). The PMR reports were generated from the data extracted from operator’s systems by the TRAI RO representatives with the assistance of the operator at TRAI, RO, Kolkata office for the month of January, February and March 2017. The performance of operators on various parameters was assessed against the benchmarks. Parameters include-
Node Bs accumulated downtimeWorst affected Node Bs due to downtime
Network Availability
Call Set Up success Rate (CSSR)
Connection Establishment (Accessibility)
RRC CongestionCircuit Switched RAB CongestionPoint of Interconnection
Network Congestion Parameters
Circuit Switched Voice Drop rateWorst affected cells having more than 3% Circuit switched Voice drop rate
Connection Maintenance
% Connections with good Circuit Switched Voice Quality
Voice Quality
All the parameters have been described in detail along with key findings of the parameters in section 5 of the report. The benchmark values for each parameter have been given in the table below.

TRAI Audit Wireless Report-Kolkata Circle JFM Quarter-2017
13
2.4.1.5 AUDIT PARAMETERS – NETWORK 3G
Let us now look at the various parameters involved in the audit reports.
Network Related
Network Parameters - 3G
Node Bs downtime (not available for service) ≤ 2%Network Availability
Worst affected Node Bs due to downtime ≤ 2%
Call Set-up Success Rate (within licensee's own network) ≥ 95%
RRC Congestion ≤ 1%Connection Establishment (Accessibility) Circuit Switched RAB Congestion ≤ 2%
Circuit Switched voice drop rate ≤ 2%
Worst affected cells having more than 3% Circuit switched voice drop rate
≤ 3%
%age of connection with good circuit switched voice quality ≥ 95%
Connection Maintenance (Retainability)
Point of Interconnection (POI) 0.5%
2.4.1.6 MONTHLY PMR – WIRELESS DATA SERVICES (2G & 3G)
The PMR report for wireless data service (2G and 3G) is extracted at the operator premises and verified in Apr, 2017 for the last Quarter. This includes three parameters-
Services Activation/ provisioning:- Activation done within 4 hours ≥ 95% PDP Context activation success rate:- PDP Context activation success rate ≥ 95% Drop Rate:- Drop Rate ≤ 5%
2.4.1.7 AUDIT PARAMETERS – WIRELESS DATA SERVICES (2G & 3G)
Wireless Data Service
Service Activation Activation done within 4 hours ≥ 95%
PDP Context activation success rate
PDP Context activation success rate ≥ 95%
Drop Rate Drop Rate ≤ 5%

TRAI Audit Wireless Report-Kolkata Circle JFM Quarter-2017
14
2.4.1.8 POINT OF DATA EXTRACTION
The data is extracted from a terminal/computer connected to OMCR & OSS on the operator network.

TRAI Audit Wireless Report-Kolkata Circle JFM Quarter-2017
15
2.4.1.9 STEP BY STEP AUDIT PROCEDURE
The key steps followed for extraction of reports at the operator premises are given below.
The final audit or PMR sheet is signed by the operator person in-charge along withauthorized stamp.
TRAI RO officials validate the values with raw data and also provide their comments,wherever required.
TRAI RO officials then prepare a PMR report from the extracted data with assistance fromthe operator.
The extracted data is validated and verfied by TRAI RO officials.
TRAI RO officers visit the operator's server/exchange/central NOC to extract data fromoperator's systems. Operator personnel assist the auditor in extraction process.
Audit formats and schedule is shared with the operators in advance. Details include dayof the visit and date of 3 day data collection and other requirements.
Tender document and latest list of licensees as per TRAI are taken as a referencedocument for assimilating the presence of operators. The wireless operators are then
contacted for the audit.
Data has been extracted and calculated as per the counter details provided by the operators. The details of counters have been provided in section 8.15 of the report. The calculation methodology for each parameter has been stated in the table given below.

TRAI Audit Wireless Report-Kolkata Circle JFM Quarter-2017
16
2.4.1.10 GENERIC CALCULATION METHODOLOGY– NETWORK PARAMETERS 2G
Parameter Calculation Methodology
BTS Accumulated Downtime
Sum of downtime of BTSs in a month in hours i.e. total outage time of all BTSs in hours during a month / (24 x Number of days in a month x Number of BTSs in the network in licensed service area) x 100
Worst Affected BTS Due to Downtime(Number of BTSs having accumulated downtime greater than 24 hours in a month / Number of BTS in Licensed Service Area) * 100
Call Setup Success Rate (Calls Established / Total Call Attempts) * 100
SDCCH/ Paging Channel Congestion
TCH Congestion
SDCCH / TCH Congestion% = [(A1 x C1) + (A2 x C2) +…….+ (An x Cn)] / (A1 + A2 +…+ An)
Where:A1 = Number of attempts to establish SDCCH / TCH made on day 1C1 = Average SDCCH / TCH Congestion % on day 1A2 = Number of attempts to establish SDCCH / TCH made on day 2C2 = Average SDCCH / TCH Congestion % on day 2An = Number of attempts to establish SDCCH / TCH made on day nCn = Average SDCCH / TCH Congestion % on day n
POI Congestion
POI Congestion% = [(A1 x C1) + (A2 x C2) +…….+ (An x Cn)] / (A1 + A2 +…+ An)Where:A1 = POI traffic offered on all POIs (no. of calls) on day 1C1 = Average POI Congestion % on day 1A2 = POI traffic offered on all POIs (no. of calls) on day 2C2 = Average POI Congestion % on day 2An = POI traffic offered on all POIs (no. of calls) on day nCn = Average POI Congestion % on day n
Call Drop Rate Total Calls Dropped / Total Calls Established x 100
Worst Affected Cells having more than 3% TCH drop
Total number of cells having more than 3% TCH drop during CBBH/ Total number of cells in the LSA x 100
Connections with good voice qualityNo. of voice samples with good voice quality / Total number of samples x 100

TRAI Audit Wireless Report-Kolkata Circle JFM Quarter-2017
17
2.4.1.11 CALCULATION METHODOLOGY – NETWORK PARAMETERS 3G
Parameter Calculation Methodology
Node Bs Accumulated Downtime
Sum of downtime of Node Bs in a month in hours i.e. total outage time of all Node Bs in hours during a month / (24 x Number of days in a month x Number of Node Bs in the network in licensed service area) x 100
Worst Affected Node Bs Due to Downtime(Number of Node Bs having accumulated downtime greater than 24 hours in a month / Number of Node B in Licensed Service Area) * 100
Call Setup Success Rate (RRC Established / Total RRC Attempts) * 100
RRC Congestion
Circuit Switched RAB Congestion
RRC / RAB Congestion% = [(A1 x C1) + (A2 x C2) +…….+ (An x Cn)] / (A1 + A2 +…+ An)
Where:A1 = Number of attempts to establish RRC/ RAB made on day 1C1 = Average RRC/ RAB Congestion % on day 1A2 = Number of attempts to establish RRC/ RAB made on day 2C2 = Average RRC/ RAB Congestion % on day 2An = Number of attempts to establish RRC/ RAB made on day nCn = Average RRC/ RAB Congestion % on day n
POI Congestion
POI Congestion% = [(A1 x C1) + (A2 x C2) +…….+ (An x Cn)] / (A1 + A2 +…+ An)Where:A1 = POI traffic offered on all POIs (no. of calls) on day 1C1 = Average POI Congestion % on day 1A2 = POI traffic offered on all POIs (no. of calls) on day 2C2 = Average POI Congestion % on day 2An = POI traffic offered on all POIs (no. of calls) on day nCn = Average POI Congestion % on day n
Circuit Switched Voice Drop RateNo. of voice RAB normally released / (No. of voice RAB normally released + RAB abnormally released) x 100
Worst Affected Cells having more than 3% Circuit Switched Voice Drop Rate
Number of cells having CSV drop rate > 3% during CBBH in a month / Total number of cells in the licensed area) x 100
Connections with good Circuit switched voice quality
1- ( Number of Faulty Transport Blocks In Uplink downlink After Selection Combining Speech / Total number of Transport Blocks In Uplink downlink After Selection Combining Speech)) x 100

TRAI Audit Wireless Report-Kolkata Circle JFM Quarter-2017
18
2.4.1.12 3 DAY LIVE DATA
The main purpose of 3 day live measurement is to evaluate the network parameters on intraday basis. While the monthly PMR report provides an overall view of the performance of QoS parameters, the 3 day live data helps looking at intraday performance on the network parameters discussed earlier. All the calculations are done on the basis of that raw data of 3 days.
The 3 day live data provides a sample of 9 days in a quarter (3 days each month of a quarter) with hourly performance, which enables the auditor to identify and validate intraday issues for an operator on the Q0S network parameters. For example, network congestion being faced by an operator during busy/peak hours.
Network related parameters were evaluated for a period of 3 days in each month. 3 day live audit was conducted for 3 consecutive weekdays for each month. The data was extracted from each operator’s server/ NOC etc. at the end of the 3rd day. The extracted data is then used to create a report (similar to PMR report) to assess the various QoS parameters.
The 3 day live measurement was conducted for network parameters (2G & 3G) and wireless data services (2G & 3G).
2.4.1.13 TCBH – SIGNIFICANCE AND SELECTION METHODOLOGY
As per QoS regulations 2009 (7 of 2009), Time Consistent Busy Hour” or “TCBH” means the one hour period starting at the same time each day for which the average traffic of the resource group concerned is greatest over the days under consideration and such Time Consistent Busy Hour shall be established on the basis of analysis of traffic data for a period of ninety days.
Step by step procedure to identify TCBH for an operator:
Day wise raw data is fetched from the operator'sOMCR and kept in a readable format (preferablyMS-Excel). Data for a period of 90 days is used toidentify TCBH.
The 90 day period is decided upon the basis ofmonth of audit. For example, for audit of Aug 2015,the 90 day period data used to identify TCBH wouldbe the data of Jun, Jul and Aug 2015
For each day, the hour in which average traffic ofthe resource group concerned is greatest for the daywill be the 'Busy Hour' for the operator.
The modal frequency of the busy hour is calculatedfor 90 days period and the hour with highest modalfrequency will be considered as TCBH for theoperator

TRAI Audit Wireless Report-Kolkata Circle JFM Quarter-2017
19
2.4.1.14 CBBH – SIGNIFICANCE AND SELECTION METHODOLOGY
As per QoS regulations 2009 (7 of 2009), Cell Bouncing Busy Hour (CBBH) means the one hour period in a day during which a cell in cellular mobile telephone network experiences the maximum traffic.
Step by step procedure to identify CBBH for an operator:
Day wise raw data is fetched from the operator's OMCRand kept in a readable format (preferably MS-Excel). Datafor a period of 90 days is used to identify CBBH.
For each day, the hour in which a cell in cellular mobiletelephone network experiences maximum traffic for theday will be the 'Busy Hour' for the operator.
The 90 day period is decided upon the basis of month ofaudit. For example, for audit of Aug 2015, the 90 dayperiod data used to identify CBBH would be the data ofJun, Jul and Aug 2015
The modal frequency of the busy hour is calculated for 90days period and the hour with highest modal frequencywill be considered as CBBH for the operator
2.4.1.15 CUSTOMER SERVICE PARAMETERS
The data to generate PMR report for customer service parameters is extracted at the operator premises and verified once every quarter in the subsequent month of the last month of the quarter. For example, data for quarter ending MARCH 2017 (JAS’17) was collected in the month of April 2017. To extract the data for customer service parameters for the purpose of audit, TRAI RO auditors primarily visit the following locations/ departments/ offices at the operator’s end.
Central Billing Center Central Customer Service Center
The operators are duly informed in advance about the audit schedule.
The Customer Service Quality Parameters include the following:
Metering and billing credibility (postpaid and prepaid) Resolution of billing/charging complaints Period of applying credit/waiver/adjustment to customer’s account Response time to the customer for assistance Termination/closure of service Time taken for refund of security deposit after closures.
Most of the customer service parameters were calculated by averaging over the quarter; however billing parameters were calculated by averaging over one billing cycle for a quarter.

TRAI Audit Wireless Report-Kolkata Circle JFM Quarter-2017
20
All the parameters have been described in detail along with key findings of the parameter in section 6 of the report. The benchmark values for each parameter have been given in the table below.
2.4.1.16 AUDIT PARAMETERS – CUSTOMER SERVICE

TRAI Audit Wireless Report-Kolkata Circle JFM Quarter-2017
21
2.4.1.17 CALCULATION METHODOLOGY – CUSTOMER SERVICE PARAMETERS
Parameter Calculation Methodology
Metering and billing credibility - PostpaidTotal billing complaints received during the relevant billing cycle / Total bills generated during the relevant billing cycle *100
Metering and billing credibility – PrepaidTotal charging complaints received during the quarter/ Total number of subscribers reported by the operator at the end of the quarter * 100
Resolution of billing/ charging complaints (Postpaid + Prepaid)
There are two benchmarks involved here:
Billing or Charging Complaints resolved in 4 weeks from date of receipt / Total billing or charging complaints received during the quarter) x 100
Billing or Charging Complaints resolved in 6 weeks from date of receipt / Total billing or charging complaints received during the quarter) x 100
Period of applying credit waiverNumber of cases where credit waiver is applied within 7 days/ total number of cases eligible for credit waiver * 100
Call centre performance IVR (Calling getting connected and answered by IVR)
Number of calls connected and answered by IVR/ All calls attempted to IVR * 100
Call centre performance (Voice to Voice)
Call centre performance Voice to Voice = (Number of calls answered by operator within 90 seconds/ All calls attempted to connect to the operator) * 100
The calculation excludes the calls dropped before 90 seconds
Time taken for termination/ closure of serviceNumber of closures done within 7 days/ total number of closure requests * 100
Time taken for refund for deposit after closuresNumber of cases of refund after closure done within 60 days/ total number of cases of refund after closure * 100

TRAI Audit Wireless Report-Kolkata Circle JFM Quarter-2017
22
2.4.2 LIVE CALLING
2.4.2.1 SIGNIFICANCE AND METHODOLOGY
The main purpose of live calling is to verify the performance of various customer service parameters by doing test calls to the subscribers/ specific numbers. Below is a step wise procedure of live calling.
Using operator SIM, the auditors also make test calls to subscribers of other operatorsto assess the inter-operator call connectivity in the same licensed service area
The auditors also verify the performance of call center, level 1 services by calling thenumbers using operator SIM. The list of call center numbers is provided by theoperator. The process followed to test Level 1 services has been stated below.
TRAI RO officials then make live calls using operator SIM to a random sample ofsubscribers from the raw data provided to verify the resolution of complaints
The TRAI RO officials visits each operator premises to do live calling. The operatorsprovide the raw data of customer complaints (billing & service) and also the list of
customer service numbers to be verified through live calling
Live calling activity was carried out during the period April 2017. The data considered for live calling was for the month prior to the month in which the live calling activity was being conducted. In this case, data of March 2017 was considered for live calling activity conducted in APRIL 2017.
A detailed explanation of each parameter is explained below.
2.4.2.2 BILLING COMPLAINTS
Live calling is done to verify Resolution of billing complaints within stipulated time. The process for this parameter is stated below.
Auditors request the operator provided the database of all the subscribers who reported billing complaints in one month prior to TRAI RO officers visit
A sample of 10% or 100 complainants, whichever is less, is selected randomly from the list provided by operator
Calls are made by auditors to the sample of subscribers to check and record whether the complaint was resolved within the timeframes as mentioned in the benchmark.

TRAI Audit Wireless Report-Kolkata Circle JFM Quarter-2017
23
All the complaints related to billing as per clause 3.7.2 of QoS regulation of 20th December, 2009 were considered as population for selection of samples. A complete list of the same has been provided in Section 6.1.1.
TRAI benchmark-
Resolution of billing/ charging complaints - 98% within 4 weeks, 100% within 6 weeks
2.4.2.3 SERVICE COMPLAINTS REQUESTS
“Service request” means a request made to a service provider by its consumer pertaining to his account, and includes.
A request for change of tariff plan A request for activation or deactivation of a value added service or a supplementary
service or a special pack A request for activation of any service available on the service provider’s network A request for shift or closure or termination of service or for billing details
All the complaints other than billing were covered. A total of 100 calls per service provider for each service in licensed service area were done by the TRAI RO officials.
2.4.2.4 LEVEL 1 SERVICE
Level 1 is used for accessing special services like emergency services, supplementary services, inquiry and operator-assisted services.
Level 1 Services include services such as police, fire, ambulance (Emergency services). Test calls were made from operator SIMs. A total of 300 test calls were made per service provider in the quarter.
2.4.2.4.1 PROCESS TO TEST LEVEL 1 SERVICES
On visiting the operator’s premises (Exchange/Central Server etc.), auditors ask the operator authorized personnel to provide a list of Level 1 services being active in their service. The list should contain a description of the numbers along with dialing code.
Operators might provide a long list of L1 services. To identify emergency L1 service numbers, auditors check if there is any number that starts with code ‘10’ in that list. If auditors find any emergency number in addition to the below list, that number is also tested during live calling.
On receiving the list, auditors verify it if the below given list of numbers are active in the service provider’s network.
If there are any other additional numbers provided by the operator, auditors also do live calling on those numbers along with below list.
If any of these numbers is not active, then we would write the same in our report, auditors write in the report.
Post verifying the list, auditors do live calling by equally distributing the calls among the various numbers and update the results in the live calling sheet.

TRAI Audit Wireless Report-Kolkata Circle JFM Quarter-2017
24
Level 1 Number Type of Service
100 Police101 Fire102 Ambulance104 Health Information Helpline108 Emergency and Disaster Management Helpline138 All India Helpine for Passangers149 Public Road Transport Utility Service181 Chief Minister Helpline182 Indian Railway Security Helpline1033 Road Accident Management Service
1037 Public Grievance Cell DoT Hq as 'Telecom Consumer Grievance Redressal Helpline'
1056 Emergency Medical Services106X State of the Art Hospitals1063 Public Grievance Cell DoT Hq1064 Anti Corruption Helpline1070 Relief Commission for Natural Calamities1071 Air Accident Helpline1072 Rail Accident Helpline1073 Road Accident Helpline1077 Control Room for District Collector1090 Call Alart ( Crime Branch)1091 Women Helpline1097 National AIDS Helpline to NACO1099 Central Accident and Trauma Services (CATS)
10580 Educationa & Vocational Guidance and Counselling
10589 Mother and Child Tracking ( MCTH)10740 Central Pollution Control Board10741 Pollution Control Board
1511 Police Related Service for all Metro Railway Project
1512 Prevention of Crime in Railway1514 National Career Service(NCS)15100 Free Legal Service Helpline155304 Municipal Corporations155214 Labour Helpline1903 Sashastra Seema Bal (SSB)1909 National Do Not Call Registry1912 Complaint of Electricity1916 Drinking Water Supply1950 Election Commission of India1965 Vigilance as Anti Corruption Helpline1323 IRCTC Railway e-Catering Services155350 Aviators Air Rescue Pvt. Ltd155256 Indian Airforce (IAF)
TRAI Audit Wireless Report-Kolkata Circle JFM Quarter-2017
25
14444 Cash Kukt Bharat Abhiyan Helpline1906 Petroleum Industry Emergency Helpline1517 Child Helpline1533 NDMC Citizen Facilitation Service to NDMC1095 Traffic Control Helpline1079 Disaster Management Service155226 Indian Airforce (IAF) Helpline10582 Women and Child Trakicking Helpline155225 CISF Helpline1955 IVRS system on Call drop1922 Hon'l Prime Minister Mann ki Baat14404 National Consumer Helpline1800-313-1947 UIDAI155231 Helpline for Women Workers14441 National Informatics Centre (NIC)
2.4.2.5 CUSTOMER CARE
Live calling is done to verify response time for customer assistance is done to verify the performance of call center in terms of
Calls getting connected and answered by operator’s IVR. % age of calls answered by operator / voice to voice) within 90 seconds: In 95% of the cases or
more
The process for this parameter is stated below.
Overall sample size is 100 calls per service provider per circle at different points of time, evenly distributed across the selected exchanges – 50 calls between 1100 HRS to 1400 HRS and 50 calls between 1600 HRS to 1900 HRS.
Time to answer the call by the operator was assessed from the time interviewer pressed the requisite button for being assisted by the operator.
All the supplementary services that have any kind of human intervention are to be covered here. It also includes the IVR assisted services.
2.4.2.6 INTER OPERATOR CALL ASSESEMENT
A total of 100 calls per service provider to all the other service providers in a licensed service area were done for the purpose of audit.
2.4.3 VOICE DRIVE TEST – 2G & 3G

TRAI Audit Wireless Report-Kolkata Circle JFM Quarter-2017
26
2.4.3.1 SIGNIFICANCE AND METHODOLOGY
Drive test, as the name suggests, is conducted to measure the performance of an operator in a moving vehicle in a specified network coverage area.The main purpose of the drive test is to check the health of the mobile network of various operators in the area in terms of coverage (signal strength), voice quality, call drop rate, call set up success rate etc.
To assess the indoor coverage, the test is also conducted at two static indoor locations in each SSA, such as Malls, office buildings, shopping complexes, government buildings etc.
TRAI empaneled auditors generally conducted two types of drive tests as mentioned below. Operator Assisted Drive Test Independent Drive Test (No IDT conducted during the period under consideration)
The main difference between the two is that in the operator assisted, operators participate in the drive test along with their hardware, software, phones etc. while in the independent drive test TRAI RO conducts the drive test on solitary basis and uses its own hardware. Operators generally do not have any knowledge of the drive test being conducted. A detailed explanation of the two methodologies has been provided below.
2.4.3.2 OPERATOR ASSISTED DRIVE TEST – VOICE 2G & 3G
SSAs are selected according to the total no. of SSAs on that region and audited according to the TRAI instruction; it depends on the total no. of drive on that circle. The drive tests were conducted for all operators in the circle, for both 2G and 3G voice services. As per TRAI instructions, the 2G drive was done in 2G only mode, while 3G drive test was conducted in dual mode (3G on priority).
As per the new directive given by TRAI headquarters, drive test in the quarter were conducted at a SSA level. SSAs have been defined in two categories by TRAI as per the criticality of the SSA.
1. Normal SSA2. Difficult SSA
During the drive test in normal SSA, the methodology adopted for the drive test is:
3 consecutive days were selected for drive test in selected SSA. SSAs were defined as per BSNL and SSA list was finalized by regional TRAI office.
On an average, a minimum of 80 kilometers was covered each day, covering a minimum distance of 250kms in 3 days.
Route map was designed in such a way that all the major roads, highways and all the important towns and villages were covered as part of audit.
Special emphasis was given to those areas where the number of complaints received were on the higher side, if provided by TRAI.
The route is defined in a way that we cover maximum area in the SSA and try to cover maximum villages and cities within the SSA. The route is designed such that there is no overlap of roads (if possible).
The route was classified as-o With In cityo Major Roadso Highways
TRAI Audit Wireless Report-Kolkata Circle JFM Quarter-2017
27
o Shopping complex/ Mallo Office Complex/ Government Building
There were no fixed calls which we need to do for within city, major roads and highways, but a minimum of 30 calls in each route, i.e., within city, major roads and highways on each day. For indoors, 20 calls each for shopping and office complex each day preferably in relatively bigger city.
The drive test covered selected cities and adjoining towns/rural areas where the service provider has commenced service, including congested areas and indoor sites.
The drive test of each mobile network was conducted between 10 am and 8 pm on weekdays. The Vehicle used in the drive tests was equipped with the test tool that automatically generates
calls on the mobile telephone networks. The speed of the vehicle was kept at around 30-50 km/hr. The holding period of each test call was 120 seconds. A test call was generated 10 seconds after the previous test call is completed. For 3G, the gap
between two calls was 30 seconds. Height of the antenna was kept uniform in case of all service providers.
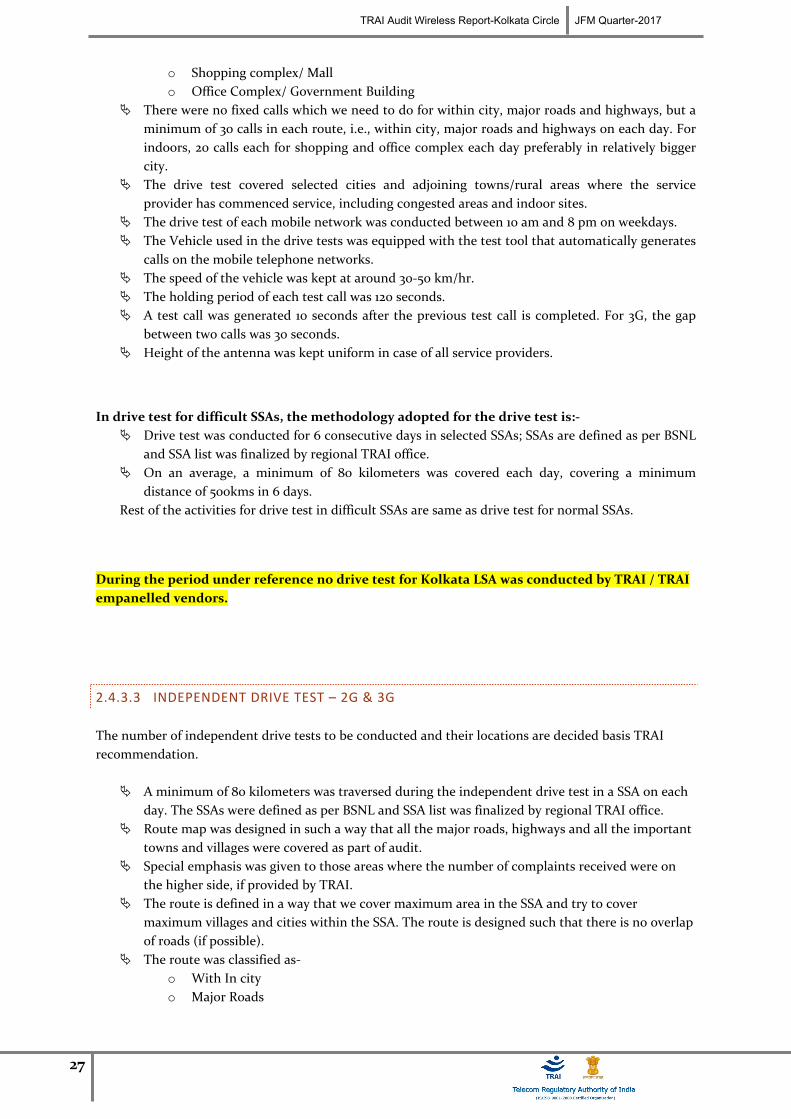
In drive test for difficult SSAs, the methodology adopted for the drive test is:- Drive test was conducted for 6 consecutive days in selected SSAs; SSAs are defined as per BSNL
and SSA list was finalized by regional TRAI office. On an average, a minimum of 80 kilometers was covered each day, covering a minimum
distance of 500kms in 6 days.Rest of the activities for drive test in difficult SSAs are same as drive test for normal SSAs.
During the period under reference no drive test for Kolkata LSA was conducted by TRAI / TRAI empanelled vendors.
2.4.3.3 INDEPENDENT DRIVE TEST – 2G & 3G
The number of independent drive tests to be conducted and their locations are decided basis TRAI recommendation.
A minimum of 80 kilometers was traversed during the independent drive test in a SSA on each day. The SSAs were defined as per BSNL and SSA list was finalized by regional TRAI office.
Route map was designed in such a way that all the major roads, highways and all the important towns and villages were covered as part of audit.
Special emphasis was given to those areas where the number of complaints received were on the higher side, if provided by TRAI.
The route is defined in a way that we cover maximum area in the SSA and try to cover maximum villages and cities within the SSA. The route is designed such that there is no overlap of roads (if possible).
The route was classified as-o With In cityo Major Roads

TRAI Audit Wireless Report-Kolkata Circle JFM Quarter-2017
28
o Highwayso Shopping complex/ Mallo Office Complex/ Government Building
There were no fixed calls which we need to do for within city, major roads and highways, but a minimum of 30 calls in each route, i.e., within city, major roads and highways on each day. For indoors, 20 calls each for shopping and office complex each day preferably in relatively bigger city.
The drive test covered selected cities and adjoining towns/rural areas where the service provider has commenced service, including congested areas and indoor sites.
The drive test of each mobile network was conducted between 10 am and 8 pm on weekdays. The Vehicle used in the drive tests was equipped with the test tool that automatically generates
calls on the mobile telephone networks. The speed of the vehicle was kept at around 30-50 km/hr. The holding period of each test call was 120 seconds. A test call was generated 10 seconds after the previous test call is completed. For 3G, the gap
between two calls was 30 seconds. Height of the antenna was kept uniform in case of all service providers.
2.4.3.4 PARAMETERS EVALUATED DURING VOICE DRIVE TEST – 2G & 3G
The parameters which were captured during the drive test include. Below are the parameters which are captured for the GSM and CDMA operators.
Coverage-Signal strength (GSM) Total calls made (A) Number of calls with signal strength between 0 to -75 dBm Number of calls with signal strength between 0 to -85 dBm Number of calls with signal strength between 0 to -95 dBm
Coverage-Signal strength (CDMA) Total Ec/Io BINS (A) Total Ec/Io BINS with less than –15 (B) Low Interference = [1 - (B/A)] x 100
Voice quality (GSM) Total Rx Qual Samples– A Rx Qual samples with 0-5 value – B %age samples with good voice quality = B/A x 100
Voice quality (CDMA) Total FER BINs (forward FER) – A FER BINs with 0-2 value (forward FER) – B FER BINs with 0-4 value (forward FER) – C %age samples with FER bins having 0-2 value (forward FER) = B/A x 100 %age samples with FER bins having 0-4 value (forward FER) = C/A x 100 No. of FER samples with value > 4 = [A-C]
Call setup success rate Total number of call attempts – A Total Calls successfully established – B Call success rate (%age) = (B/A) x 100
Blocked calls 100% - Call Set up Rate
Call drop rate

TRAI Audit Wireless Report-Kolkata Circle JFM Quarter-2017
29
Total Calls successfully established – A Total calls dropped after being established – B Call Drop Rate (%age) = (B/A) x 100
During the period under reference no drive test for Kolkata LSA was conducted by TRAI / TRAI empanelled vendors.
2.4.4 WIRELESS DATA DRIVE TEST – 2G & 3G
The data drive test is conducted at stationary places called hotspots in a SSA for all the days the voice drive test is conducted in the same SSA.
During the period under reference no drive test for Kolkata LSA was conducted by TRAI / TRAI empanelled vendors.
2.4.4.1 METHODOLOGY
The measurement setup is used to conduct test calls for measuring successful data transmission download and upload attempts, minimum download speed, average throughput and latency is given in figure given below.
The basic measurement set-up consists of a Test-Device and a Test-Server with specified software and hardware. Test calls are established between the Test-Device and Test-Server and measurements are made for the respective QoS parameters. These parameters are measured in a stationary mode. Service Activation/Provisioning, PDP Context Activation Success Rate and Drop rate are reported from the actual network counters/database.
To assess the quality of the connection between an end user and an Internet Service Provider (ISP), ideally the Test-Server is placed as near as possible to the gateway providing the interconnection between access network and ISP network. The location of the test-server is as near as possible to the gateway providing the interconnection between access network and ISP network implies that the measurements will not reflect the influence in the QoS of the ISP network, between that gateway and the gateway interconnecting with the Internet.

TRAI Audit Wireless Report-Kolkata Circle JFM Quarter-2017
30
Figure for Measurement set-up
2.4.4.2 REQUIREMENTS FOR THE TEST-SERVER
For all tests, a dedicated test server is used as a well-defined reference. The test server may be located centrally for all the licensed service areas (LSA) or for a number of LSAs or in each LSA (not more than one in each LSA). Under no circumstances a commercial server (e.g. www.yahoo.com) is used, since the test conditions for such a server may change over time making later reproduction of the results impossible. The test server is identified by an IP address and not by its fully qualified Domain Name (FQDN) in order to avoid issues with Domain Name Server (DNS) lookup and including the DNS caching strategies of the used operating system into the measurement.
The Transmission Control Protocol (TCP) settings of the server tested against, is also recorded. Since the number of host operating systems for internet servers is larger than on the client side, no detailed recommendation concerning the TCP settings of the server is given.
However, the TCP stack of the reference server should at least be capable of the following:o Maximum Segment Size between 1380 Bytes and 1460 Bytes.o TCP RX Window Size > 4096 Byteso SACK (Selective Acknowledgement) enabled.o TCP Fast Retransmit.o TCP Fast Recovery enabled.o Delayed ACK enabled (200ms).
2.4.4.3 TEST FILES

TRAI Audit Wireless Report-Kolkata Circle JFM Quarter-2017
31
The test file consist of incompressible data i.e. a data file that is already compressed, e.g. like a zip or jpg file. The test file has at least twice the size (in Kbit) of the theoretically maximum data transmission rate per second (in Kbit/s) of the Internet access under consideration.
2.4.4.4 REPRESENTATIVENESS OR NUMBER OF TEST CALLS
The choice of adequate test calls, i.e. geographical locations of origin and destination of calls as well as traffic variations, is a crucial point with respect to the comparability and validation of the statistics are calculated for the measured parameters. For each parameter, it is ensured that the samples are aggregated over all classes of customers for fairness in reflecting the QoS actually perceived by the user and the statistics are preserved to substantiate the same.
The necessary number of samples (test calls) are 1067 for each of the category “A” and “Metro” licensed service area (LSA), 600 for each of the category “B” LSA and 384 for each of the category “C” LSA for all the parameters.
2.4.4.5 PARAMETERS EVALUATED DURING DATA DRIVE TEST AT HOTSPOTS
2.4.4.5.1 SUCCESSFUL DATA TRANSMISSIONS DOWNLOAD ATTEMPTS
The successful data download attempts is defined as the ratio of successful data downloads to the total number of data download attempts in a specified time period. A data transmission is successful if a test file is downloaded completely and with no errors.
Measurement:
The percentage that is the sum total of successful data downloads, divided by the sum total of all attempts to download a test file is provided. The statistics are calculated from test calls made according to the measurement set-up and taking into account the representativeness requirements. The successful data download is measured by downloading a test file. An attempt to transmit the test file is considered unsuccessful if it takes longer than 60 seconds.
Successful data transmission download attempts =
Total Successful download attempts ×100
Total download attempts
2.4.4.5.2 SUCCESSFUL DATA TRANSMISSION UPLOAD ATTEMPTS
The successful data upload attempts is defined as the ratio of successful data uploads to the total number of data upload attempts in a specified time period. A data upload is successful if a test file is uploaded completely and with no errors.
Measurement:

TRAI Audit Wireless Report-Kolkata Circle JFM Quarter-2017
32
The percentage that is the sum total of successful data uploads, divided by the sum total of all attempts to upload a test file should be provided. The statistics are calculated from test calls made according to the measurement set-up and taking into account the representativeness requirements. The successful data upload is measured by uploading a test file. An attempt to transmit the test file is considered unsuccessful if it takes longer than 60 seconds.
Successful data transmission upload attempts = Total Successful upload attempts ×100
Total upload attempts
2.4.4.5.3 MINIMUM DOWNLOAD SPEED
The download speed is defined as the data transmission rate that is achieved for downloading a test file from a test server to a test device.
Measurement:
The minimum download speed is calculated from test calls made according to the measurement set-up. Test calls are to be made to weigh the results according to the patterns of real traffic. Minimum download speed is the average of the lower 10% of all such test calls.
Minimum download speed (average of lower 10% of all test calls) =Download speed (A1+A2+A3+A4+A5+A6) ×1006Note- A1, A2, A3, A4 A5 & A6 are download speeds at 6 hotspots
2.4.4.5.4 AVERAGE THROUGHPUT FOR PACKET DATA
It is defined as the rate at which packets are transmitted in a network. In a mobile network the download speed varies depending on the number of users in a particular location. Even though a service provider may be advertising certain speed, the actual speed may vary as per the number of users in the network and there could be customer dissatisfaction on account of relatively slow speed. Hence, there is a need to prescribe an average throughput to protect the interest of consumers. The service providers need to constantly upgrade their network to meet average throughput benchmark.
The throughput is defined as the data transmission rate that is achieved for downloading a test file from a test server to a test device.
The service provider will advertise the throughput being offered to its customers as per their category or plan and it should be meted out as per their commitment.
Measurement:
The average throughput for packet data should be calculated from all the test calls made according to the measurement setup.Test calls are made to weigh the results according to the patterns of real traffic. Average throughput is calculated as the average of all such test calls.
Average Throughput for Packet data = Average of download attempts in Kbit/ average download time in secs.

TRAI Audit Wireless Report-Kolkata Circle JFM Quarter-2017
33
2.4.4.5.5 LATENCY
Latency is the amount of time taken by a packet to reach the receiving endpoint after being transmitted from the sending point. This time period is termed the "end-to-end delay" occurring along the transmission path. Latency generally refers to network conditions, such as congestion, that may affect the overall time required for transit.
Measurement:
Latency is measured with the test server for ping connected directly to the server on the same Intranet domain.
Latency (Percentage of successful pinged) = Total number of successful ping ×100Total number of ping sent to the Test Server
2.5 OPERATORS COVERED 2G AND 3G
Name of Operator Number of Subscriber as per VLR-2G
Aircel 2204537
Airtel 4632595
BSNL 813115
Idea 2464950
MTS 239796
Reliance CDMA Serviced Closed
Reliance GSM 4093229
TATA CDMA 186096
TATA GSM 1958167
Vodafone 5014866Name of Operator Number of Subscriber as per VLR-3GAircel 3G 451462Airtel 3G 627600BSNL 3G 70188Idea 3G NAReliance 3G 4093229Vodafone 3G 889204
MARCH’17 VLR data was considered for the number of subscribers.
2.6 COLOUR CODES TO READ THE REPORT
Not Meeting the benchmark Best Performing Operator

TRAI Audit Wireless Report-Kolkata Circle JFM Quarter-2017
34
3 EXECUTIVE SUMMARY-2G
The objective assessment of Quality of Service (QoS) carried out by TRAI RO officials gives an insight into the overall performance of various operators in the Kolkata circle, with a parameter wise performance evaluation as compared to TRAI benchmark.
3.1 PMR DATA – 3 MONTHS- CONSOLIDATED FOR 2G
Network Availability Connection Establishment (Accessibility)
Connection Maintenance (Retainability)
Name of Service Provider
BTSs Accumulated downtime (not available for service)
Worst affected BTSs due to downtime
Call Set-up Success Rate (within licensee's own network)
SDCCH/ Paging Chl. Congestion
TCH Congestion
Call Drop Rate (%age)
Worst affected cells having more than 3% TCH drop
%age of connection with good voice quality
Benchmark ≤ 2% ≤ 2% ≥ 95% ≤ 1% ≤ 2% ≤ 2% ≤ 3% ≥ 95%
Aircel 0.07% 0.17% 98.20% 0.15% 0.05% 0.60% 2.40% 98.07%Airtel 0.00% 0.00% 99.66% 0.05% 0.04% 0.68% 2.39% 98.35%BSNL 1.42% 1.87% 99.30% 0.40% 0.75% 1.38% 1.88% 99.80%Idea 0.21% 0.34% 99.68% 0.05% 0.09% 0.28% 0.18% 98.08%MTS 0.04% 0.00% 99.89% NA 0.00% 0.46% 2.68% 99.60%Reliance GSM 1.35% 6.06% 97.40% 0.10% 0.50% 0.27% 0.42% 98.99%TATA CDMA 0.10% 0.00% 99.34% NA 0.13% 0.27% 2.83% 99.72%TATA GSM 0.06% 0.09% 99.49% 0.03% 0.02% 0.35% 0.96% 98.78%Vodafone 0.04% 0.20% 99.56% 0.04% 0.44% 0.71% 2.74% 98.12%
NA: SDCCH/ Paging channel congestion not applicable for CDMA operators and MTS
Following are the parameter wise observations for wireless operators for Kolkata circle:
BTSs Accumulated Downtime:
All operators met the benchmark. Minimum BTS Accumulated downtime was recorded for Airtel at 0.00%.
Worst Affected BTSs Due to Downtime:
Reliance GSM failed to meet the benchmark. Minimum worst affected BTSs due to downtime was recorded for Airtel, TATA CDMA and MTS at 0.00%.
Call Set-up Success Rate (CSSR):
All operators met the benchmark for CSSR. The maximum CSSR was observed for MTS with 99.89%.

TRAI Audit Wireless Report-Kolkata Circle JFM Quarter-2017
35
SDCCH/ Paging Chl. Congestion:
All operators met the benchmark on SDCCH / Paging Channel Congestion. TATA GSM recorded the best SDCCH / Paging Channel Congestion with 0.03%.TCH Congestion:All operators met the benchmark on TCH congestion, while MTS performed the best on TCH congestion with 0.00%
Call Drop Rate:
All operators met the benchmark for the parameter. Minimum call drop rate was recorded for Reliance GSM and TATA CDMA at 0.27%.
Worst Affected Cells Having More than 3% TCH Drop:
All operators met the benchmark for the parameter. Best performance was recorded for Idea at 0.18%.
Voice Quality
All operators met the benchmark for the parameter. Best performance was recorded for BSNL at 99.80%.
All the service providers were measuring this parameter as per the TRAI guidelines that have been stated in parameter description section.

36
Below are the month wise summary tables for each network parameter basis PMR data.
3.1.1 PMR DATA - JANUARY FOR 2G
Month January 2017
Network Availability Connection Establishment (Accessibility) Connection Maintenance (Retainability)
Name of Service Provider Month January
BTSs Accumulated downtime (not available for service)
Worst affected BTSs due to downtime
Call Set-up Success Rate (within licensee's own network)
SDCCH/ Paging Chl. Congestion
TCH Congestion
Call Drop Rate (%age)
Worst affected cells having more than 3% TCH drop
%age of connection with good voice quality
Benchmark ≤ 2% ≤ 2% ≥ 95% ≤ 1% ≤ 2% ≤ 2% ≤ 3% ≥ 95%
Aircel 0.10% 0.08% 98.10% 0.14% 0.04% 0.61% 2.50% 98.07%
Airtel 0.00% 0.00% 99.60% 0.03% 0.03% 0.64% 2.43% 98.34%
BSNL 1.16% 1.80% 99.28% 0.38% 0.08% 0.99% 1.49% 99.83%
Idea 0.19% 0.30% 99.72% 0.05% 0.12% 0.28% 0.18% 98.11%
MTS 0.05% 0.00% 99.90% NA 0.00% 0.49% 2.69% 99.65%
Reliance GSM 1.52% 6.06% 98.65% 0.07% 0.79% NA 0.35% 99.02%
TATA CDMA 0.09% 0.00% 99.24% NA 0.16% 0.33% 2.95% 99.65%
TATA GSM 0.04% 0.06% 99.50% 0.02% 0.01% 0.40% 1.15% 98.74%
Vodafone 0.05% 0.22% 99.53% 0.04% 0.47% 0.73% 2.76% 98.13%
3.1.2 PMR DATA – FEBRUARY FOR 2G
Month February 2017
Network Availability Connection Establishment (Accessibility) Connection Maintenance (Retainability)
Name of Service Provider Month February
BTSs Accumulated downtime (not available for service)
Worst affected BTSs due to downtime
Call Set-up Success Rate (within licensee's own network)
SDCCH/ Paging Chl. Congestion
TCH Congestion
Call Drop Rate (%age)
Worst affected cells having more than 3% TCH drop
%age of connection with good voice quality
Benchmark ≤ 2% ≤ 2% ≥ 95% ≤ 1% ≤ 2% ≤ 2% ≤ 3% ≥ 95%
Aircel 0.06% 0.17% 98.20% 0.17% 0.04% 0.61% 2.31% 98.05%
Airtel 0.01% 0.00% 99.67% 0.05% 0.04% 0.72% 2.39% 98.33%
BSNL 1.56% 1.88% 99.30% 0.26% 0.39% 0.67% 2.86% 99.82%
Idea 0.23% 0.34% 99.72% 0.06% 0.09% 0.29% 0.24% 98.06%
MTS 0.02% 0.00% 99.90% NA 0.00% 0.47% 2.73% 99.65%
Reliance GSM 2.13% 10.21% 94.86% 0.13% 0.42% NA 0.41% 98.96%
TATA CDMA 0.03% 0.00% 99.41% NA 0.09% 0.26% 2.85% 99.76%
TATA GSM 0.04% 0.00% 99.49% 0.02% 0.02% 0.35% 0.89% 98.75%
Vodafone 0.02% 0.04% 99.56% 0.04% 0.44% 0.71% 2.76% 98.12%

TRAI Audit Wireless Report-Kolkata Circle JFM Quarter-2017
37
3.1.3 PMR DATA - MARCH FOR 2G
Month March 2017
Network Availability Connection Establishment (Accessibility) Connection Maintenance (Retainability)
Name of Service Provider Month March
BTSs Accumulated downtime (not available for service)
Worst affected BTSs due to downtime
Call Set-up Success Rate (within licensee's own network)
SDCCH/ Paging Chl. Congestion
TCH Congestion
Call Drop Rate (%age)
Worst affected cells having more than 3% TCH drop
%age of connection with good voice quality
Benchmark ≤ 2% ≤ 2% ≥ 95% ≤ 1% ≤ 2% ≤ 2% ≤ 3% ≥ 95%
Aircel 0.06% 0.25% 98.30% 0.14% 0.07% 0.60% 2.40% 98.10%
Airtel 0.00% 0.00% 99.71% 0.06% 0.05% 0.67% 2.37% 98.38%
BSNL 1.68% 1.95% 99.31% 0.56% 1.78% 1.53% 1.31% 99.77%
Idea 0.23% 0.38% 99.61% 0.05% 0.05% 0.28% 0.11% 98.08%
MTS 0.07% 0.00% 99.87% NA 0.00% 0.42% 2.61% 99.50%
Reliance GSM 0.59% 1.92% 98.68% 0.11% 0.28% NA 0.43% 98.98%
TATA CDMA 0.19% 0.00% 99.36% NA 0.15% 0.24% 2.69% 99.75%
TATA GSM 0.10% 0.22% 99.47% 0.05% 0.02% 0.31% 0.85% 98.84%
Vodafone 0.05% 0.35% 99.58% 0.05% 0.42% 0.71% 2.70% 98.09%

TRAI Audit Wireless Report-Kolkata Circle JFM Quarter-2017
38
3.2 3 DAYS LIVE DATA – CONSOLIDATED FOR 2G CONSIDERING DATA FOR THE MONTH OF MARCH 2017
3 Day LIVE CONSOLIDATED FOR 2G ( CONSIDERING MARCH 2017 DATA ONLY)
Network Availability Connection Establishment (Accessibility) Connection Maintenance (Retainability)
Name of Service Provider 3 Day March
BTSs Accumulated downtime (not available for service)
Worst affected BTSs due to downtime
Call Set-up Success Rate (within licensee's own network)
SDCCH/ Paging Chl. Congestion
TCH Congestion
Call Drop Rate (%age)
Worst affected cells having more than 3% TCH drop
%age of connection with good voice quality
Benchmark ≤ 2% ≤ 2% ≥ 95% ≤ 1% ≤ 2% ≤ 2% ≤ 3% ≥ 95%
Aircel 0.10% 0.04% 98.67% 0.08% 0.01% 0.48% 2.21% 98.56%
Airtel 0.08% 0.00% 99.73% 0.05% 0.04% 0.66% 2.36% 98.32%
BSNL 0.67% 0.23% 98.69% 0.41% 1.84% 1.49% 2.12% 98.83%
Idea 0.23% 0.25% 99.61% 0.05% 0.01% 0.22% 0.01% 98.35%
MTS 0.17% 0.00% 99.90% NA 0.00% 0.32% 0.08% 99.06%
Reliance GSM 0.84% 0.00% 97.96% 0.05% 0.08% NA 0.04% 99.11%
TATA CDMA 0.00% 0.00% 99.52% NA 0.02% 0.28% 2.34% 99.75%
TATA GSM 0.02% 0.00% 99.57% 0.04% 0.01% 0.25% 0.66% 99.16%
Vodafone 0.04% 0.07% 99.74% 0.05% 0.26% 0.57% 2.82% 98.32%
A three day live measurement was conducted to measure the QoS provided by the operators for the month of March 2017 data only. The table provided below gives a snapshot of the performance of all operators during live measurement.
NA: SDCCH/ Paging channel congestion not applicable for CDMA operators. .
BTSs Accumulated Downtime:All operators met the benchmark. Minimum BTS Accumulated downtime was recorded for TATA CDMA at 0.00%.
Worst Affected BTSs Due to Downtime:All operators met the benchmark.
Call Set-up Success Rate (CSSR):All operators met the benchmark for CSSR. The maximum CSSR was observed for MTS with 99.90%.
SDCCH/ Paging Chl. Congestion:All operators met the benchmark on SDCCH / Paging Channel Congestion. TATA GSM recorded the best SDCCH / Paging Channel Congestion.

TRAI Audit Wireless Report-Kolkata Circle JFM Quarter-2017
39
TCH Congestion:All operators met the benchmark, while MTS performed the best on TCH congestion.
Call Drop Rate:All operators met the benchmark for the parameter. Minimum call drop rate was recorded for IDEA GSM. No valid data obtained from Reliance GSM for Kolkata LSA
Worst Affected Cells Having More than 3% TCH Drop:All operators met the benchmark for the parameter.. Best performance was recorded for Idea at 0.01%.
Voice QualityAll operators met the benchmark for the parameter. Best performance was recorded for TATA CDMA at 99.75%
Below are the month wise summary tables for each network parameter basis 3 day live data.
3.2.1 3 DAY DATA - JANUARY FOR 2G
Data not computed
3.2.2 3 DAY DATA – FEBRUARY FOR 2G
Data not computed.
3.2.3 3 DAY DATA - MARCH FOR 2G
3 Day LIVE CONSOLIDATED FOR 2G ( CONSIDERING MARCH 2017 DATA ONLY)
Network Availability Connection Establishment (Accessibility) Connection Maintenance (Retainability)
Name of Service Provider 3 Day March
BTSs Accumulated downtime (not available for service)
Worst affected BTSs due to downtime
Call Set-up Success Rate (within licensee's own network)
SDCCH/ Paging Chl. Congestion
TCH Congestion
Call Drop Rate (%age)
Worst affected cells having more than 3% TCH drop
%age of connection with good voice quality
Benchmark ≤ 2% ≤ 2% ≥ 95% ≤ 1% ≤ 2% ≤ 2% ≤ 3% ≥ 95%
Aircel 0.10% 0.04% 98.67% 0.08% 0.01% 0.48% 2.21% 98.56%
Airtel 0.08% 0.00% 99.73% 0.05% 0.04% 0.66% 2.36% 98.32%
BSNL 0.67% 0.23% 98.69% 0.41% 1.84% 1.49% 2.12% 98.83%
Idea 0.23% 0.25% 99.61% 0.05% 0.01% 0.22% 0.01% 98.35%
MTS 0.17% 0.00% 99.90% NA 0.00% 0.32% 0.08% 99.06%
Reliance GSM 0.84% 0.00% 97.96% 0.05% 0.08% NA 0.04% 99.11%
TATA CDMA 0.00% 0.00% 99.52% NA 0.02% 0.28% 2.34% 99.75%
TATA GSM 0.02% 0.00% 99.57% 0.04% 0.01% 0.25% 0.66% 99.16%
Vodafone 0.04% 0.07% 99.74% 0.05% 0.26% 0.57% 2.82% 98.32%

TRAI Audit Wireless Report-Kolkata Circle JFM Quarter-2017
40
3.3 PMR DATA – 3 MONTHS- CONSOLIDATED FOR 3G
Network Availability Connection Establishment (Accessibility) Connection Maintenance (Retainability)
Name of Service Provider
Node Bs downtime (not available for service)
Worst affected Node Bs due to downtime
CSSR RRC Congestion
Circuit Switched RAB Congestion
Call drop rate
Worst affected cells having more than 3% Circuit switched
%Circuit Switch Voice Quality(CSV quality)
Benchmark ≤ 2% ≤ 2% ≥ 95% ≤ 1% ≤ 2% ≤ 2% ≤ 3% ≥ 95%
Aircel 3G 0.08% 0.14% 99.61% 0.21% 0.04% 0.28% 2.92% 98.64%Airtel 3G 0.00% 0.00% 99.61% 0.00% 0.00% 0.34% 1.86% 99.24%BSNL 3G 1.26% 1.95% 96.24% 0.60% 0.74% 1.50% 2.88% 99.81%Idea 3G 0.15% 0.22% 99.91% 0.00% 0.00% 0.18% 0.09% 99.79%Reliance 3G 0.26% 1.79% 99.96% 0.03% 0.01% 0.05% 0.16% 99.89%Vodafone 3G 0.03% 0.04% 100.00% 0.00% 0.00% 0.27% 2.28% 98.88%
Following are the parameter wise observations for wireless operators for Kolkata circle:
Node Bs downtime:All operators met the benchmark. Minimum Node Bs Accumulated downtime was recorded for Airtel 3G at 0.00%.
Worst affected Node Bs due to downtime:BSNL 3G failed to meet the benchmark. Minimum worst affected Node Bs due to downtime was recorded for Airtel 3G at 0.00%.
Call Set-up Success Rate (CSSR):All operators met the benchmark for CSSR. The maximum CSSR was observed for Vodafone with 100.00%.
RRC Congestion:All operators met the benchmark for RRC congestion. Minimum RRC congestion was recorded for Airtel 3G at 0.00%.
Circuit Switched RAB Congestion:All operators met the benchmark for Circuit Switched RAB congestion. Minimum Circuit Switched RAB congestion was recorded for Airtel 3G at 0.0o%.
Call Drop Rate:All operators met the benchmark for the parameter. Minimum call drop rate was recorded for Reliance 3G at 0.05%.
Worst affected cells having more than 3% Circuit switched voice drop rate:

TRAI Audit Wireless Report-Kolkata Circle JFM Quarter-2017
41
All operators met he benchmark for the parameter. Best performance was recorded for Idea 3G at 0.09%.
Circuit Switch Voice Quality:All operators met the benchmark for the parameter. Best performance was recorded for Reliance 3G at 99.89%
Below are the month wise summary tables for each network parameter basis PMR data.

TRAI Audit Wireless Report-Kolkata Circle JFM Quarter-2017
42
3.3.1 PMR DATA - JANUARY FOR 3G
Month January 2017
Network Availability Connection Establishment (Accessibility)
Connection Maintenance (Retainability)
Name of Service Provider Month January
Node Bs downtime (not available for service)
Worst affected Node Bs due to downtime
CSSR RRC Congestion
Circuit Switched RAB Congestion
Call drop rate
Worst affected cells having more than 3% Circuit switched voice drop rate
%Circuit Switch Voice Quality(CSV quality)
Benchmark ≤ 2% ≤ 2% ≥ 95% ≤ 1% ≤ 2% ≤ 2% ≤ 3% ≥ 95%
Aircel 3G 0.11% 0.05% 99.67% 0.18% 0.01% 0.28% 2.88% 98.67%
Airtel 3G 0.00% 0.00% 99.61% 0.00% 0.00% 0.25% 1.91% 99.00%
BSNL 3G 1.23% 1.94% 97.09% 0.69% 1.32% 1.77% 2.85% 99.83%
Idea 3G 0.13% 0.15% 99.92% 0.00% 0.00% 0.19% 0.16% 99.80%
Reliance 3G 0.24% 1.85% 99.93% 0.05% 0.01% 0.04% 0.15% 99.89%
Vodafone 3G 0.04% 0.08% 100.00% 0.00% 0.00% 0.25% 2.27% 98.77%
3.3.2 PMR DATA – FEBRUARY FOR 3G
Month February 2017
Network Availability Connection Establishment (Accessibility)
Connection Maintenance (Retainability)
Name of Service Provider Month February
Node Bs downtime (not available for service)
Worst affected Node Bs due to downtime
CSSR RRC Congestion
Circuit Switched RAB Congestion
Call drop rate
Worst affected cells having more than 3% Circuit switched voice drop rate
%Circuit Switch Voice Quality(CSV quality)
Benchmark ≤ 2% ≤ 2% ≥ 95% ≤ 1% ≤ 2% ≤ 2% ≤ 3% ≥ 95%
Aircel 3G 0.06% 0.16% 99.62% 0.20% 0.02% 0.30% 2.95% 98.67%
Airtel 3G 0.00% 0.00% 99.62% 0.00% 0.00% 0.24% 1.83% 99.00%
BSNL 3G 1.34% 1.99% 95.65% 0.73% 0.22% 1.12% 2.85% 99.83%
Idea 3G 0.17% 0.30% 99.91% 0.00% 0.00% 0.18% 0.08% 99.79%
Reliance 3G 0.24% 1.70% 99.96% 0.03% 0.02% 0.04% 0.18% 99.89%
Vodafone 3G 0.02% 0.00% 100.00% 0.00% 0.00% 0.28% 2.30% 98.94%
3.3.3 PMR DATA - MARCH FOR 3G

TRAI Audit Wireless Report-Kolkata Circle JFM Quarter-2017
43
Network Availability Connection Establishment (Accessibility)
Connection Maintenance (Retainability)
Name of Service Provider Month March
Node Bs downtime (not available for service)
Worst affected Node Bs due to downtime
CSSR RRC Congestion
Circuit Switched RAB Congestion
Call drop rate
Worst affected cells having more than 3% Circuit switched voice drop rate
%Circuit Switch Voice Quality(CSV quality)
Benchmark ≤ 2% ≤ 2% ≥ 95% ≤ 1% ≤ 2% ≤ 2% ≤ 3% ≥ 95%
Aircel 3G 0.06% 0.21% 99.53% 0.24% 0.08% 0.28% 2.93% 98.56%
Airtel 3G 0.00% 0.00% 99.60% 0.00% 0.00% 0.25% 1.84% 99.73%
BSNL 3G 1.34% 1.92% 95.99% 0.37% 0.67% 0.85% 2.92% 99.77%
Idea 3G 0.17% 0.20% 99.91% 0.00% 0.00% 0.18% 0.03% 99.78%
Reliance 3G 0.31% 1.82% 99.98% 0.02% 0.01% 0.05% 0.15% 99.89%
Vodafone 3G 0.03% 0.04% 99.99% 0.01% 0.01% 0.27% 2.28% 98.93%

44
3.4 3 DAY LIVE DATA – CONSOLIDATED FOR 3G (CONSIDERING MARCH 2017 DATA ONLY)
A three day live measurement was conducted to measure the QoS provided by the operators. The table provided below gives a snapshot of the performance of all operators during live measurement.
Network Availability Connection Establishment (Accessibility) Connection Maintenance (Retainability)
Name of Service Provider
Node Bs downtime (not available for service)
Worst affected Node Bs due to downtime
CSSR RRC Congestion
Circuit Switched RAB Congestion
Call drop rate
Worst affected cells having more than 3% Circuit switched
%Circuit Switch Voice Quality(CSV quality)
Benchmark ≤ 2% ≤ 2% ≥ 95% ≤ 1% ≤ 2% ≤ 2% ≤ 3% ≥ 95%
Aircel 3G 0.11% 0.05% 99.56% 0.21% 0.03% 0.30% 2.77% 98.48%Airtel 3G 0.00% 0.00% 99.59% 0.00% 0.00% 0.30% 1.93% 99.73%BSNL 3G 0.63% 0.24% 95.86% 0.36% 0.71% 0.56% 0.81% 98.50%Idea 3G 0.18% 0.20% 99.90% 0.00% 0.00% 0.16% 0.07% 99.87%Reliance 3G 1.17% 0.00% 100.00% 0.01% 0.00% 0.04% 0.12% 99.89%Vodafone 3G 0.02% 0.00% 100.00% 0.00% 0.01% 0.26% 2.36% 98.91%
Node Bs downtime:
All operators met the benchmark for the parameter. Minimum Node Bs Accumulated downtime was recorded for Airtel 3G at 0.00%.
Worst affected Node Bs due to downtime:All operators met the benchmark for the parameter. Minimum worst affected Node Bs due to downtime was recorded for Airtel 3G , Reliance 3G and Vodafone 3G at 0.00%.
Call Set-up Success Rate (CSSR):All operators met the benchmark for the parameter. The maximum CSSR was observed for Reliance 3G & Vodafone 3G with 100.00%.
RRC Congestion:All operators met the benchmark for the parameter. Minimum RRC congestion was for Airtel 3G and Vodafone 3G with 0.00%.
Circuit Switched RAB Congestion:All operators met the benchmark for the parameter. Minimum Circuit Switched RAB congestion was for Airtel 3G , Idea 3G & Reliance 3G with 0.00%
Call Drop Rate:All operators met the benchmark for the parameter. Minimum call drop rate was recorded for Reliance 3G at 0.04%.

TRAI Audit Wireless Report-Kolkata Circle JAS Quarter-2016
45
Worst affected cells having more than 3% Circuit switched voice drop rate:All operators met the benchmark for the parameter. Minimum Worst affected cells having more than 3% Circuit switched voice drop rate was recorded for Idea 3G at 0.07%.
Circuit Switch Voice Quality:All operators met the benchmark. Best performance was recorded for Reliance 3G at 99.89%.
Below are the month wise summary tables for each network parameter basis 3 day live data.
3.4.1 3 DAY DATA - JANUARY FOR 3G
Data not computed
3.4.2 3 DAY DATA – FEBRUARY FOR 3G
Data not computed
3.4.3 3 DAY DATA - MARCH FOR 3G
Network Availability Connection Establishment (Accessibility) Connection Maintenance (Retainability)
Name of Service Provider 3 Day March
Node Bs downtime (not available for service)
Worst affected Node Bs due to downtime
CSSR RRC Congestion
Circuit Switched RAB Congestion
Call drop rate
Worst affected cells having more than 3% Circuit switched voice drop rate
%Circuit Switch Voice Quality(CSV quality)
Benchmark ≤ 2% ≤ 2% ≥ 95% ≤ 1% ≤ 2% ≤ 2% ≤ 3% ≥ 95%
Aircel 3G 0.11% 0.05% 99.56% 0.21% 0.03% 0.30% 2.77% 98.48%
Airtel 3G 0.00% 0.00% 99.59% 0.00% 0.00% 0.27% 1.93% 99.73%
BSNL 3G 0.63% 0.24% 95.86% 0.36% 0.71% 0.56% 0.81% 98.50%
Idea 3G 0.18% 0.20% 99.90% 0.00% 0.00% 0.16% 0.07% 99.87%
Reliance 3G 1.17% 0.00% 100.00% 0.01% 0.00% 0.04% 0.12% 99.89%
Vodafone 3G 0.02% 0.00% 100.00% 0.00% 0.01% 0.26% 2.36% 98.91%

TRAI Audit Wireless Report-Kolkata Circle JAS Quarter-2016
46
3.5 WIRELESS DATA PMR & 3 DAY LIVE – CONSOLIDATED FOR 2G
Wireless Data-PMR Wireless Data-Live Data
Name of Service Provider
Activation done within 4 hours
PDP Context activation success rate
Drop Rate
Activation done within 4 hours
PDP Context activation success rate
Drop Rate
Benchmark ≥ 95% ≥ 95% ≤ 5% ≥ 95% ≥ 95% ≤ 5%Aircel 99.98% 98.37% 0.82% 99.96% 99.53% 0.62%Airtel 99.35% 99.09% 1.41% 99.70% 97.84% 1.40%BSNL 98.77% 99.74% NA 99.93% 99.74% NAIdea 99.99% 99.86% 0.97% NA 99.82% 1.23%MTS 92.71% 99.84% 0.83% 100.00% 96.53% 0.84%Reliance GSM 99.98% 99.61% 0.27% 99.99% 99.95% 0.37%TATA CDMA 98.26% 96.59% 3.25% NA 94.90% 0.83%TATA GSM 100.00% 99.98% 1.26% NA 99.99% 1.18%Vodafone 99.95% 99.93% 2.32% 99.96% 99.92% 2.65%
NA: - No data received from operators
Following are the parameter wise observations for wireless operators for Kolkata circle:
Activation done within 4 hours:
In PMR MTS failed to meet the Benchmark with 92.71%. Maximum Activation done within 4 hours is recorded for TATA GSM at 100.00%. During 3Days live Tata CDMA failed to meet the benchmark. Maximum Activation done within 4 hours was recorded for TATA GSM at 100.00%. However in 3day live maximum Activation done within 4 hours was recorded by MTS at 100%. TATA GSM and CDMA failed to produce the above data to TRAI auditors.
PDP Context activation success rate:
In PMR as well as 3Days live all operators met the benchmark. Maximum PDP content Activation success rate was recorded for Tata GSM at 99.98%. However in 3day live maximum PDP content Activation success rate TATA CDMA failed to meet the benchmark. PDP content Activation success rate was recorded for TATA GSM for 3 day live category.
Drop Rate:
All operators met the benchmark in PMR as well as 3day live. The minimum drop rate was observed in PMR for Reliance GSM at 0.27% and 3days live for Reliance GSM at 0.37%

TRAI Audit Wireless Report-Kolkata Circle JAS Quarter-2016
47
3.6 WIRELESS DATA PMR & 3 DAY LIVE – CONSOLIDATED FOR 3GWireless Data-PMR Wireless Data-Live Data
Name of Service Provider
Activation done within 4 hours
PDP Context activation success rate
Drop Rate
Activation done within 4 hours
PDP Context activation success rate
Drop Rate
Benchmark ≥ 95% ≥ 95% ≤ 5% ≥ 95% ≥ 95% ≤ 5%Aircel 3G 99.98% 98.37% 0.84% 99.96% 99.53% 0.62%Airtel 3G NA 99.66% 0.48% 99.70% 99.95% 0.07%BSNL 3G 98.42% 99.91% 3.68% 99.93% 99.91% 2.21%Idea 3G 99.99% 99.11% 1.12% NA 99.22% 1.81%Reliance 3G 99.98% 99.15% 0.35% 99.99% NA NAVodafone 3G 99.93% 98.97% 0.29% NA 98.93% 0.36%
Following are the parameter wise observations for wireless operators for Kolkata circle:
Activation done within 4 hours:
In PMR as well as 3days live all operators met the benchmark. Maximum Activation done within 4 hours was recorded for Idea 3G at 99.99%. However in 3day live maximum Activation done within 4 hours was recorded for Reliance 3G at 99.99%.
PDP Context activation success rate:
In PMR as well as 3Days live all operators met the benchmark. Maximum PDP content Activation success rate was recorded for BSNL 3G at 99.91%. However in 3day live maximum PDP content Activation success rate was recorded for Airtel 3G at 99.95%.
Drop Rate:
All operators met the benchmark in PMR as well as 3day live. The minimum drop rate was observed for Vodafone 3G and for as well 3days live Airtel 3G.

48
Below are the month wise summary tables for each network parameter basis PMR and Live data.
3.7 LIVE CALLING DATA – CONSOLIDATED
Metering and Billing Response time to customer for assistance
Level 1 Service
Service Requests
Name of Service Provider %age complaints resolved within 4 weeks
%age complaints resolved within 6 weeks
Accessibility of call centre/ customer care
Percentage of calls answered by the operators (voice to voice) within 90 seconds
Call answered
Complaint /Request attended to Satisfaction
Benchmark 98% 100% ≥ 95% ≥ 95% ≥ 95%
Aircel 97.30% 100.00% 100.00% 100.00% 28.57% 100.00%
Airtel 99.00% 100.00% 100.00% 96.00% 47.62% 95.00%
BSNL 84.62% 100.00% 100.00% 99.00% 69.77% 68.09%
Idea 98.00% 100.00% 100.00% 100.00% 51.22% 99.00%
MTS 100.00% 100.00% 100.00% 100.00% 46.51% 97.92%
Reliance GSM 97.00% 97.00% 100.00% 100.00% 53.49% 95.00%
TATA CDMA NA NA 100.00% 100.00% NA 95.00%
TATA GSM NA NA 100.00% 100.00% 44.19% 58.97%
Vodafone 100.00% 100.00% 100.00% 100.00% 69.77% 100.00%
Resolution of billing complaints
As per the consumers (live calling exercise) Aircel, BSNL, Reliance GSM failed to meet the benchmark of resolving 98% complaints within 4 weeks and Reliance GSM failed to meet the benchmark of 100% complaints within 6 weeks.
Accessibility of Call Centre/Customer Care-IVR
For the IVR aspect, all of the operators met the recording 100% for the parameter.
Customer Care / Helpline Assessment (voice to voice)
All the operators meet the TRAI benchmark of 95%
Level 1 Service
As per the live calling results, none of the operators met the TRAI benchmark for level 1 service. The details of live calling done for the level 1 service have been provided in the annexure for each operator.
It was also observed that a number of Category-I (i.e. mandatory) services were not being operated by most of the operators.
Complaint/Request Attended to Satisfaction
All operators performed satisfactorily in terms of satisfaction of the customers for service requests. Aircel and Vodafone recorded the best performance at 100.00%.

49
3.8 BILLING AND CUSTOMER CARE – CONSOLIDATED
Metering and billing credibility Billing Complaints
Response time to customer for assistance
Customer care
Name of Service Provider
Postpaid Subscribers
Prepaid Subscribers
% of complaints resolved in 4 weeks
% of complaints resolved in 6 weeks
% of cases where credit/wavier is received within one week
Percentage of calls answered by the IVR
Percentage of calls answered by the operators (voice to voice) within 90 seconds
Benchmark ≤ 0.1% ≤ 0.1% ≥ 98% ≥ 100% ≥ 100% ≥ 95% ≥ 95%
Aircel 0.01% 0.01% 100.00% 100.00% 100.00% 96.59% 92.03%Airtel 0.06% 0.02% 96.64% 96.64% 100.00% 92.67% 88.96%BSNL 0.02% 0.01% 100.00% 100.00% 100.00% 96.95% 96.03%Idea 0.62% 0.04% 100.00% 100.00% 100.00% 98.36% 99.22%MTS 0.10% 0.01% 100.00% 100.00% 100.00% 99.74% 96.43%Reliance GSM 0.08% 0.03% 100.00% 100.00% 100.00% 99.56% 94.46%TATA CDMA 0.00% 0.00% 100.00% 100.00% 100.00% NA 99.01%TATA GSM 0.00% 0.00% NA NA 100.00% 98.54% 97.38%Vodafone 0.10% 0.05% 100.00% 100.00% 100.00% 100.00% 97.06%
Metering and Billing Credibility – Post-paid Subscribers
For the billing disputes of post-paid subscribers, it was observed that Idea failed to meet the TRAI benchmark for the parameter. TATA GSM & CDMA had the best performance with 0.00% billing disputes.
Metering and Billing Credibility – Prepaid Subscribers
For the prepaid customers, all operators met the benchmark of charging disputes. TATA GSM & TATA CDMA performed the best with 0.00% disputes.
Resolution of billing complaints
All operators met the TRAI benchmark of resolution of billing complaints within 4 weeks and 6 weeks except AIRTEL. No data received from TATA GSM for above two categories.
Response Time to customer for assistance - % of cases in which advance waiver is received within one week
All the operators met the TRAI benchmark of providing credit or waiver within one week in case of complaints received.
Customer Care Percentage of calls answered by the IVR
Airtel failed to meet the TRAI benchmark of 95% IVR call being attended. Vodafone recorded the best performance for the parameter. For TATA CDMA no data was obtained.

TRAI Audit Wireless Report-Kolkata Circle JAS Quarter-2016
50
Customer Care Percentage of calls answered by the operators (Voice to Voice) within 90 seconds
Aircel, Airtel and Reliance GSM failed to meet the TRAI specified benchmark of 95%. Idea recorded the best performance for the parameter with 99.22%.

51
3.9 INTER OPERATOR CALL ASSESSMENT – CONSOLIDATED
6. Inter Operator Call Assessment
Inter operator call Assessment To↓ From→
Aircel Airtel BSNL Idea MTS Reliance CDMA Reliance GSM TATA CDMA TATA GSM Vodafone
Aircel NA 100.00% 100.00% 100.00% 100.00% NS 100.00% 100.00% 100.00% 100.00%
Airtel 100.00% NA 100.00% 100.00% 100.00% NS 100.00% 100.00% 100.00% Not Tested
BSNL 100.00% 100.00% NA 100.00% 100.00% NS 100.00% 100.00% 100.00% 100.00%
Idea 100.00% 100.00% 100.00% NA 100.00% NS 100.00% 100.00% 100.00% 100.00%
MTS 100.00% 100.00% 100.00% 100.00% NA NS 100.00% 100.00% 100.00% 100.00%
Reliance CDMA NS NS NS NS NS NS NS NS NS NS
Reliance GSM 100.00% 100.00% 100.00% 100.00% 100.00% NS NA 100.00% 100.00% 100.00%
TATA CDMA 100.00% 100.00% 100.00% 100.00% 100.00% NS 100.00% NA 100.00% 100.00%
TATA GSM 100.00% 100.00% 100.00% 100.00% 100.00% NS 100.00% 100.00% NA 100.00%
Vodafone 100.00% 100.00% 100.00% 100.00% 100.00% NS 100.00% 100.00% 100.00% NA
Maximum Problem faced by the calling operator to other operator. The orange colour denotes performance below circle average.

TRAI Audit Wireless Report-Kolkata Circle JAS Quarter-2016
52
3.10 COMPARISON BETWEEN TRAI RO AND OPERATOR’S DATA FOR PMR 2G
Network Availability Connection Establishment (Accessibility) Connection Maintenance (Retainability)
Name of service Provider
BTSs Accumulated downtime (not available for service) (%age)
Worst affected BTSs due to downtime (%age)
Call Set-up Success Rate (within licensee's own network)
SDCCH/ Paging Chl. Congestion (%age)
TCH Congestion (%age)
Call Drop Rate (%age)
Worst affected cells having more than 3% TCH drop (call drop) rate (%age)
Connection with good voice quality
Point of Interconnection (POI) Congestion
Benchmark ≤ 2% ≤ 2% ≥ 95% ≤ 1% ≤ 2% ≤ 2% ≤ 3% ≥ 95% ≤ 0.5%
Operators TRAI RO Operators TRAI
RO Operators TRAI RO Operators TRAI
RO Operators TRAI RO Operators TRAI
RO Operators TRAI RO Operators TRAI
RO Operators TRAI RO
Aircel 0.07% 0.07% 0.17% 0.17% 98.2% 98.20% 0.15% 0.15% 0.05% 0.05% 0.61% 0.60% 2.4% 2.40% 98.07% 98.07% 0% 0%
AIRTEL 0% 0.00% 0% 0.00% 99.66% 99.66% 0.05% 0.05% 0.04% 0.04% 0.68% 0.68% 2.39% 2.39% 98.35% 98.35% 0% 0%
BSNL 1.46% 1.42% 1.87% 1.87% 99.3% 99.30% 0.4% 0.40% 0.75% 0.75% 1.06% 1.38% 1.99% 1.88% 99.81% 99.80% 0% 0%
IDEA 0.16% 0.21% 0.27% 0.34% 99.58% 99.68% 0.11% 0.05% 0.14% 0.09% 0.35% 0.28% 0.67% 0.18% 97.78% 98.08% 0% 0%
MTS 0.05% 0.04% 0% 0.00% 99.89% 99.89% 0% NA 0% 0.00% 0.46% 0.46% 2.67% 2.68% 99.6% 99.60% 0% 0%
RTL 0.46% 1.35% 1.88% 6.06% 95.41% 97.40% 0.1% 0.10% 0.5% 0.50% 0.12% 0.27% 0.4% 0.42% 98.99% 98.99% 0% 0%
TTSL CDMA 0.11% 0.10% 0% 0.00% 99.34% 99.34% 0% NA 0.13% 0.13% 0.28% 0.27% 2.83% 2.83% 99.72% 99.72% 0% 0%
TTSL GSM 0.06% 0.06% 0.09% 0.09% 99.49% 99.49% 0.03% 0.03% 0.02% 0.02% 0.35% 0.35% 0.96% 0.96% 98.78% 98.78% 0% 0%
Vodafone 0.04% 0.04% 0.2% 0.20% 99.56% 99.56% 0.04% 0.04% 0.44% 0.44% 0.72% 0.71% 2.74% 2.74% 98.11% 98.12% 0% 0%

TRAI Audit Wireless Report-Kolkata Circle JAS Quarter-2016
53
3.11 COMPARISON BETWEEN TRAI RO AND OPERATOR’S DATA FOR PMR 3G
Network Availability Connection Establishment (Accessibility) Connection Maintenance (Retainability)
Name of service Provider
Node-B's Accumulated downtime (not available for service)
Worst affected BTSs and Node-B's due to downtime
CSSR RRC Congestion Circuit Switched RAB Congestion Call Drop Rate
Worst affected cells having more than 3% Circuit Switched Voice Drop Rate
Circuit Switch Voice Quality (CSV quality)
Point of Interconnection (POI) Congestion
Benchmark ≤ 2% ≤ 2% ≥ 95% ≤ 1% ≤ 2% ≤ 2% ≤ 3% ≥ 95% ≤ 0.5%
Operators TRAI RO Operators TRAI
RO Operators TRAI RO Operators TRAI RO Operators TRAI
RO Operators TRAI RO Operators TRAI
RO Operators TRAI RO Operators TRAI RO
Aircel 0.08% 0.08% 0.14% 0.14% 99.61% 99.61% 0.21% 0.21% 0.04% 0.04% 0.28% 0.28% 2.92% 2.92% 98.64 98.64% 0% 0%
AIRTEL 0% 0.00% 0% 0.00% 99.61% 99.61% 0% 0.00% 0% 0.00% 0.25% 0.34% 1.86% 1.86% 99.25 99.24% 0% 0%
BSNL 1.23% 1.26% 1.9% 1.95% 96.33% 96.24% 0.53% 0.60% 0.7% 0.74% 1.2% 1.50% 2.8% 2.88% 99.77 99.81% 0% 0%
IDEA 0.16% 0.15% 0.22% 0.22% 99.91% 99.91% 0% 0.00% 0% 0.00% 0.18% 0.18% 0.09% 0.09% 99.79 99.79% 0% 0%
RTL 0.28% 0.26% 1.76% 1.79% 99.95% 99.96% 0.03% 0.03% 0.01% 0.01% 0.05% 0.05% 0.16% 0.16% 99.90 99.89% 0% 0%
Vodafone 0.03% 0.03% 0.04% 0.04% 99.9% 100.00% 0% 0.00% 0.01% 0.00% 0.27% 0.27% 2.29% 2.28% 98.98 98.88% 0% 0%
Value calculated by Operator and TRAI RO OFFICE match Value calculated by Operator and TRAI RO OFFICE do not match

54
4 CRITICAL FINDINGS
PMR Consolidated (Network Parameters) for 2G
Reliance GSM failed to meet the benchmark Worst Affected Cells Having More than 3% TCH Drop.
3 Day Live Measurement (Network Parameters) for 2G
No critical findings noted.
PMR and 3days live Consolidated (Network Parameters) for 3G
BSNL 3G failed to meet the benchmark for worst affected Node Bs due to downtime during PMR audit.
Wireless data services for 2G
MTS failed to meet the benchmark for Activation done within 4 hours. TATA CDMA failed to reach the benchmark in PDP context activation success rate
Wireless data services for 3G
No critical findings noted.
Live Calling
As per the consumers (live calling exercise) Aircel, BSNL, Reliance GSM failed to meet the benchmark of resolving 98% complaints within 4 weeks and Reliance GSM failed to meet the benchmark of 100% complaints within 6 weeks.
As per the live calling results, none of the operators met the TRAI benchmark for level 1 service. The details of live calling done for the level 1 service have been provided in the annexure for each operator.
For the IVR aspect, all of the operators successfully met the benchmark of recording 100% for the parameter.
All the operators met the TRAI benchmark of 95%
Metering and billing credibility
For the billing disputes of post-paid subscribers, it was observed that Idea failed to meet the TRAI benchmark for the parameter. TATA GSM & CDMA had the best performance with 0.00% billing disputes.
Airtel failed to meet the TRAI benchmark of 95% IVR call being attended. Vodafone recorded the best performance for the parameter.
All the operators met the TRAI benchmark of providing credit or waiver within one week in case of complaints received.
Drive Test (Operator Assisted) voice
No drive test conducted in the given LSA under period in consideration.

55
5 PARAMETER DESCRIPTION & DETAILED FINDINGS - COMPARISON BETWEEN PMR DATA, 3 DAY LIVE DATA AND LIVE CALLING DATA FOR 2G
5.1 BTS ACCUMULATED DOWNTIME
5.1.1 PARAMETER DESCRIPTION
The parameter of network availability would be measured from following sub-parameters
1. BTSs Accumulated downtime (not available for service)
2. Worst affected BTSs due to downtime
1. Definition - BTSs (Base Transceiver Station) accumulated downtime (not available for service) shall basically measure the downtime of the BTSs, including its transmission links/circuits during the period of a month, but excludes all planned service downtime for any maintenance or software up gradation. For measuring the performance against the benchmark for this parameter the downtime of each BTS lasting more than 1 hour at a time in a day during the period of a month were considered.
2. Computation Methodology –BTS accumulated downtime (not available for service) = Sum of downtime of BTSs in a month in hours i.e. total outage time of all BTSs in hours
during a month / (24 x Number of days in a month x Number of BTSs in the network in licensed service area) x 100
3. TRAI Benchmark –
a. BTSs Accumulated downtime (not available for service) ≤ 2%
4. Audit Procedure –
The fault alarm details at the OMC (MSC) for the network outages (due to own network elements and infrastructure service provider end outages) was audited
All the BTS in service area were considered. Planned outages due to network up gradation, routine maintenance were not considered.

TRAI Audit Wireless Report-Kolkata Circle JAS Quarter-2016
56
Any outage as a result of force majeure were not considered at the time of calculation
Data is extracted from system log of the server of the operator. This data is in raw format which is further processed to arrive at the cumulative values.
List of operating sites with cell details and ids are taken from the operator.
When there is any outage a performance report gets generated in line with that cell resulting and master base of the Accumulated downtime and worst affected BTS due to downtime.
5.1.2 KEY FINDINGS - CONSOLIDATED
Data Source: Operations and Maintenance Center (OMC) of the operators
All operators met the benchmark on aspect of BTS accumulated downtime as per audit/PMR data.

TRAI Audit Wireless Report-Kolkata Circle JAS Quarter-2016
57
5.1.2.1 KEY FINDINGS – JANUARY
Data Source: Operations and Maintenance Center (OMC) of the operators
5.1.2.2 KEY FINDINGS – FEBRUARY

TRAI Audit Wireless Report-Kolkata Circle JAS Quarter-2016
58
Data Source: Operations and Maintenance Center (OMC) of the operators
5.1.2.3 KEY FINDINGS – MARCH
Data Source: Operations and Maintenance Center (OMC) of the operators

TRAI Audit Wireless Report-Kolkata Circle JAS Quarter-2016
59
5.2 WORST AFFECTED BTS DUE TO DOWNTIME
5.2.1 PARAMETER DESCRIPTION
Definition – Worst Affected BTS due to downtime shall basically measure percentage of BTS having downtime greater than 24 hours in a month. Planned outages were not considered as part while computing.
For measuring the parameter “Percentage of worst affected BTSs due to downtime" the downtime of each BTS lasting for more than 1 hour at a time in a day during the period of a month was considered.
Computation Methodology –
Worst affected BTSs due to downtime = (Number of BTSs having accumulated downtime greater than 24 hours in a month / Number of BTS in
Licensed Service Area) * 100 TRAI Benchmark –
a. Worst affected BTSs due to downtime ≤ 2%
Audit Procedure –
i. The fault alarm details at the OMC (MSC) for the network outages (due to own network elements and infrastructure service provider end outages) was audited
ii. All the BTS in service area were considered. Planned outages due to network up gradation, routine maintenance were not considered.
iii. Data is extracted from system log of the server of the operator. This data is in raw format which is further processed to arrive at the cumulative values.
iv. Any outage as a result of force majeure was not considered at the time of calculation.
v. List of operating sites with cell details and ids are taken from the operator.
vi. All the BTS having down time greater than 24 hours is assessed and values of BTS accumulated downtime is computed in accordance.

TRAI Audit Wireless Report-Kolkata Circle JAS Quarter-2016
60
5.2.2 KEY FINDINGS – CONSOLIDATED
Data Source: Operations and Maintenance Center (OMC) of the operators
All operatots except Reliance GSM met the benchmark for worst affected BTSs due to downtime as per audit/PMR data.
Significant difference was observed between PMR & live measurement data for BSNL and Reliance GSM. The possible reason for the variation could be the difference in time frame of data as PMR data is for 30 days and live measurement data is for three days.

TRAI Audit Wireless Report-Kolkata Circle JAS Quarter-2016
61
5.2.2.1 KEY FINDINGS – JANUARY
Data Source: Operations and Maintenance Center (OMC) of the operators
5.2.2.2 KEY FINDINGS – FEBRUARY

TRAI Audit Wireless Report-Kolkata Circle JAS Quarter-2016
62
Data Source: Operations and Maintenance Center (OMC) of the operators
5.2.2.3 KEY FINDINGS – MARCH
Data Source: Operations and Maintenance Center (OMC) of the operators

TRAI Audit Wireless Report-Kolkata Circle JAS Quarter-2016
63
5.3 CALL SET UP SUCCESS RATE
5.3.1 PARAMETER DESCRIPTION
1. Definition: The ratio of successful calls established to total calls is known as Call Set-Up Success Rate (CSSR).2. Computation Methodology-
(Calls Established / Total Call Attempts) * 100
Call Established means the following events have happened in call setup:-
call attempt is made
the TCH is allocated
the call is routed to the outward path of the concerned MSC
3. TRAI Benchmark ≥ 95%4. Audit Procedure –
The cell-wise data generated through counters/ MMC available in the switch for traffic measurements
CSSR calculation should be measured using OMC generated data only
Measurement should be only in Time Consistent Busy Hour (CBBH) period for all days of the week
Counter data is extracted from the NOC of the operators.
Total calls established include all calls established excluding Signaling blocking, TCH Drop and TCH blocking.
The numerator and denominator values are derived from adding the counter values from the MSC.

TRAI Audit Wireless Report-Kolkata Circle JAS Quarter-2016
64
5.3.2 KEY FINDINGS - CONSOLIDATED
Data Source: Network Operations Center (NOC) of the operators
All operators met the TRAI benchmark as per audit/PMR data, 3days live.
5.3.2.1 KEY FINDINGS – JANUARY

TRAI Audit Wireless Report-Kolkata Circle JAS Quarter-2016
65
Data Source: Network Operations Center (NOC) of the operators
5.3.2.2 KEY FINDINGS – FEBRUARY
Data Source: Network Operations Center (NOC) of the operators
5.3.2.3 KEY FINDINGS – MARCH

TRAI Audit Wireless Report-Kolkata Circle JAS Quarter-2016
66
Data Source: Network Operations Center (NOC) of the operators
5.4 NETWORK CHANNEL CONGESTION- PAGING CHANNEL /TCH CONGESTION/POI
5.4.1 PARAMETER DESCRIPTION
1. Definition: It means a call is not connected because there is no free channel to serve the call attempt. This parameter represents congestion in the network. It happens at three levels:
SDCCH Level: Stand-alone dedicated control channel
TCH Level: Traffic Channel
POI Level: Point of Interconnect
2. Computational Methodology:
SDCCH / TCH Congestion% = [(A1 x C1) + (A2 x C2) +…….+ (An x Cn)] / (A1 + A2 +…+ An)
Where:-A1 = Number of attempts to establish SDCCH / TCH made on day 1
C1 = Average SDCCH / TCH Congestion % on day 1
A2 = Number of attempts to establish SDCCH / TCH made on day 2
C2 = Average SDCCH / TCH Congestion % on day 2
An = Number of attempts to establish SDCCH / TCH made on day n
Cn = Average SDCCH / TCH Congestion % on day n
POI Congestion% = [(A1 x C1) + (A2 x C2) +…….+ (An x Cn)] / (A1 + A2 +…+ An)
Where:-A1 = POI traffic offered on all POIs (no. of calls) on day 1
C1 = Average POI Congestion % on day 1
A2 = POI traffic offered on all POIs (no. of calls) on day 2

TRAI Audit Wireless Report-Kolkata Circle JAS Quarter-2016
67
C2 = Average POI Congestion % on day 2
An = POI traffic offered on all POIs (no. of calls) on day n
Cn = Average POI Congestion % on day n
3. Benchmark:
SDCCH Congestion: ≤ 1%, TCH Congestion: ≤ 2%, POI Congestion: ≤ 0.5%
4. Audit Procedure –
Audit of the details of SDCCH and TCH congestion percentages computed by the operator (using OMC–Switch data only) would be conducted
The operator should be measuring this parameter during Time consistent busy hour (TCBH) only SDCCH
5.4.2 KEY FINDINGS - SDCCH/PAGING CHANNEL CONGESTION (CONSOLIDATED)
Data Source: Network Operations Center (NOC) of the operators
NA: SDCCH/ Paging channel congestion not applicable for CDMA operators.

TRAI Audit Wireless Report-Kolkata Circle JAS Quarter-2016
68
All operators met the benchmark as per PMR/audit Data.
5.4.2.1 KEY FINDINGS – JANUARY
Data Source: Network Operations Center (NOC) of the operators
5.4.2.2 KEY FINDINGS – FEBRUARY

TRAI Audit Wireless Report-Kolkata Circle JAS Quarter-2016
69
Data Source: Network Operations Center (NOC) of the operators
5.4.2.3 KEY FINDINGS – MARCH
Data Source: Network Operations Center (NOC) of the operators
5.4.3 KEY FINDINGS – TCH CONGESTION (CONSOLIDATED)

TRAI Audit Wireless Report-Kolkata Circle JAS Quarter-2016
70
Data Source: Network Operations Center (NOC) of the operators
All operators met the benchmark as per audit/PMR report.
5.4.3.1 KEY FINDINGS – MONTH 1
Data Source: Network Operations Center (NOC) of the operators
5.4.3.2 KEY FINDINGS – MONTH 2
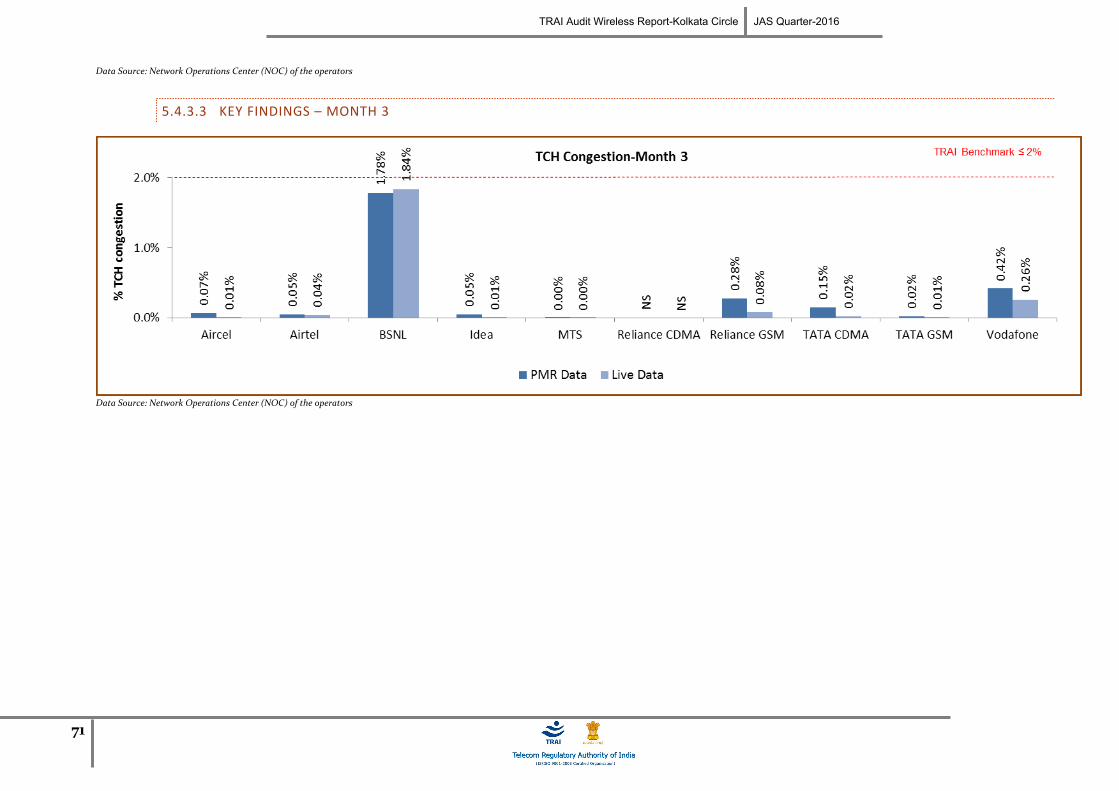
TRAI Audit Wireless Report-Kolkata Circle JAS Quarter-2016
71
Data Source: Network Operations Center (NOC) of the operators
5.4.3.3 KEY FINDINGS – MONTH 3
Data Source: Network Operations Center (NOC) of the operators

72
5.4.4 KEY FINDINGS – POI CONGESTION (CONSOLIDATED) – AVERAGE OF 3 MONTHS
Data Source: Network Operations Center (NOC) of the operators
All operators met the benchmark of POI Congestion as per PMR/audit Data.
POI congestion Benchmark Aircel Airtel BSNL Idea MTS Reliance CDMA Reliance GSM TATA CDMA TATA GSM Vodafone
Total number of working POIs 50 31 79 101 40 NS 29 42 30 45
No. of POIs not meeting benchmark
0 0 0 0 0 NS 0 0 0 0
Total Capacity of all POIs (A) - in erlangs
245277 252664 454707 229568 107734 NS 42778 62119 40178 649227
Traffic served for all POIs (B)- in erlangs
90973 124451 21611 123941 24903 NS 26322 21341 15101 364511
POI congestion ≤ 0.5% 0.00% 0.00% 0.00% 0.00% 0.00% NS 0.00% 0.00% 0.00% 0.00%
POI congestion Benchmark Aircel Airtel BSNL Idea MTS Reliance CDMA Reliance GSM TATA CDMA TATA GSM Vodafone
Total number of working POIs 50 31 79 102 40 NS 29 42 30 45
No. of POIs not meeting benchmark
0 0 0 0 0 NS 0 0 0 0
Total Capacity of all POIs (A) - in erlangs
81986 94616 52656 76641 35319 NS 19024 20070 12084 221433
Traffic served for all POIs (B)- in erlangs
16513 24636 11478 21557 6829 NS 6546 3892 2100 68069
POI congestion ≤ 0.5% 0.00% 0.00% 0.00% 0.00% 0.00% NS 0.00% 0.00% 0.00% 0.00%
Audit Results for POI Congestion- PMR data
Live Measurement Results for POI Congestion- 3 Day data

TRAI Audit Wireless Report-Kolkata Circle JAS Quarter-2016
73
5.4.4.1 KEY FINDINGS – MONTH 1
Data Source: Network Operations Center (NOC) of the operators
POI congestion Benchmark Aircel Airtel BSNL Idea MTS Reliance CDMA Reliance GSM TATA CDMA TATA GSM Vodafone
Total number of working POIs 50 31 79 101 40 NS 29 42 30 45
No. of POIs not meeting benchmark 0 0 0 0 0 NS 0 0 0 0
Total Capacity of all POIs (A) - in erlangs 81658 82245 402051 77146 35731 NS 11877 21516 13617 210980
Traffic served for all POIs (B)- in erlangs 30106 42385 10701 39067 6857 NS 9454 7126 5143 115295
POI congestion ≤ 0.5% 0.00% 0.00% 0.00% 0.00% 0.00% NS 0.00% 0.00% 0.00% 0.00%
POI congestion Benchmark Aircel Airtel BSNL Idea MTS Reliance CDMA Reliance GSM TATA CDMA TATA GSM Vodafone
Total number of working POIs NA NA NA NA NA NA NA NA NA NA
No. of POIs not meeting benchmark NA NA NA NA NA NA NA NA NA NA
Total Capacity of all POIs (A) - in erlangs NA NA NA NA NA NA NA NA NA NA
Traffic served for all POIs (B)- in erlangs NA NA NA NA NA NA NA NA NA NA
POI congestion ≤ 0.5% NA NA NA NA NA NA NA NA NA NA
Live Measurement Results for POI Congestion- 3 Day data-January
Audit Results for POI Congestion- PMR data-January

TRAI Audit Wireless Report-Kolkata Circle JAS Quarter-2016
74
POI congestion Benchmark Aircel Airtel BSNL Idea MTS Reliance CDMA Reliance GSM TATA CDMA TATA GSM Vodafone
Total number of working POIs 50 31 N/A 101 40 NS 29 42 30 45
No. of POIs not meeting benchmark 0 0 0 0 0 NS 0 0 0 0
Total Capacity of all POIs (A) - in erlangs 81768 83299 N/A 76680 35319 NS 11877 20330 13591 218028
Traffic served for all POIs (B)- in erlangs 30297 41052 N/A 41338 6862 NS 9659 7216 5263 122675
POI congestion ≤ 0.5% 0.00% 0.00% 0.00% 0.00% 0.00% NS 0.00% 0.00% 0.00% 0.00%
POI congestion Benchmark Aircel Airtel BSNL Idea MTS Reliance CDMA Reliance GSM TATA CDMA TATA GSM Vodafone
Total number of working POIs NA NA NA NA NA NA NA NA NA NA
No. of POIs not meeting benchmark NA NA NA NA NA NA NA NA NA NA
Total Capacity of all POIs (A) - in erlangs NA NA NA NA NA NA NA NA NA NA
Traffic served for all POIs (B)- in erlangs NA NA NA NA NA NA NA NA NA NA
POI congestion ≤ 0.5% NA NA NA NA NA NA NA NA NA NA
Audit Results for POI Congestion- PMR data-February
Live Measurement Results for POI Congestion- 3 Day data-February
5.4.4.2 KEY FINDINGS – MONTH 2
Data Source: Network Operations Center (NOC) of the operators

TRAI Audit Wireless Report-Kolkata Circle JAS Quarter-2016
75
5.4.4.3 KEY FINDINGS – MONTH 3
Data Source: Network Operations Center (NOC) of the operators
POI congestion Benchmark Aircel Airtel BSNL Idea MTS Reliance CDMA Reliance GSM TATA CDMA TATA GSM Vodafone
Total number of working POIs 50 31 79 101 40 NS 29 42 30 45
No. of POIs not meeting benchmark 0 0 0 0 0 NS 0 0 0 0
Total Capacity of all POIs (A) - in erlangs 81851 87121 52656 75742 36684 NS 19024 20273 12970 220218
Traffic served for all POIs (B)- in erlangs 30571 41014 10910 43536 11184 NS 7209 6999 4695 126542
POI congestion ≤ 0.5% 0.00% 0.00% 0.00% 0.00% 0.00% NS 0.00% 0.00% 0.00% 0.00%
POI congestion Benchmark Aircel Airtel BSNL Idea MTS Reliance CDMA Reliance GSM TATA CDMA TATA GSM Vodafone
Total number of working POIs 50 31 79 102 40 NS 29 42 30 45
No. of POIs not meeting benchmark 0 0 0 0 0 NS 0 0 0 0
Total Capacity of all POIs (A) - in erlangs 81986 94616 52656 76641 35319 NS 19024 20070 12084 221433
Traffic served for all POIs (B)- in erlangs 16513 24636 11478 21557 6829 NS 6546 3892 2100 68069
POI congestion ≤ 0.5% 0.00% 0.00% 0.00% 0.00% 0.00% NS 0.00% 0.00% 0.00% 0.00%
Audit Results for POI Congestion- PMR data-March
5. POI Congestion
Live Measurement Results for POI Congestion- 3 Day data-March

76
5.5 CALL DROP RATE
5.5.1 PARAMETER DESCRIPTION
1. Definition - The dropped call rate is the ratio of successfully originated calls that were found to drop to the total number of successfully originated calls that were correctly released.
Total calls dropped = All calls ceasing unnaturally i.e. due to handover or due to radio loss
Total calls established = All calls that have TCH allocation during busy hour
2. Computational Methodology: (Total Calls Dropped / Total Calls Established) x 100
3. TRAI Benchmark –
Call drop rate ≤ 2%
4. Audit Procedure –
Audit of traffic data of the relevant quarter kept in OMC-R at MSCs and used for arriving at CDR was used
The operator should only be considering those calls which are dropped during Time consistent busy hour (TCBH) for all days of the relevant quarter.

TRAI Audit Wireless Report-Kolkata Circle JAS Quarter-2016
77
5.5.2 KEY FINDINGS - CONSOLIDATED
Data Source: Network Operations Center (NOC) of the operators
All operators met the benchmark for call drop rate during audit.
5.5.2.1 KEY FINDINGS – MONTH 1

TRAI Audit Wireless Report-Kolkata Circle JAS Quarter-2016
78
Data Source: Network Operations Center (NOC) of the operators
5.5.2.2 KEY FINDINGS – MONTH 2
Data Source: Network Operations Center (NOC) of the operators
5.5.2.3 KEY FINDINGS – MONTH 3

TRAI Audit Wireless Report-Kolkata Circle JAS Quarter-2016
79
Data Source: Network Operations Center (NOC) of the operators
5.6 CELLS HAVING GREATER THAN 3% TCH DROP
5.6.1 PARAMETER DESCRIPTION
1. Definition- Worst Affected Cells having more than 3% TCH drop shall measure the ratio of total number of cells in the network to the ratio of cells having more than 3% TCH drop.
2. Computational Methodology: (Total number of cells having more than 3% TCH drop during CBBH/ Total number of cells in the network) x 100
3. TRAI Benchmark –
Worst affected cells having more than 3% TCH drop rate ≤ 3%
4. Audit Procedure –
Audit of traffic data of the relevant quarter kept in OMC-R at MSCs and used for arriving at CDR would be conducted.
The operator should only be considering those calls which are dropped during Cell Bouncing Busy hour (CBBH) for all days of the relevant quarter.

TRAI Audit Wireless Report-Kolkata Circle JAS Quarter-2016
80
5.6.2 KEY FINDINGS - CONSOLIDATED
Data Source: Network Operations Center (NOC) of the operators
All operators met the benchmark.
5.6.2.1 KEY FINDINGS – MONTH 1

TRAI Audit Wireless Report-Kolkata Circle JAS Quarter-2016
81
Data Source: Network Operations Center (NOC) of the operators
5.6.2.2 KEY FINDINGS – MONTH 2
Data Source: Network Operations Center (NOC) of the operators
5.6.2.3 KEY FINDINGS – MONTH 3

TRAI Audit Wireless Report-Kolkata Circle JAS Quarter-2016
82
Data Source: Network Operations Center (NOC) of the operators
5.7 VOICE QUALITY
5.7.1 PARAMETER DESCRIPTION
1. Definition:
for GSM service providers the calls having a value of 0 –5 are considered to be of good quality (on a seven point scale)
For CDMA the measure of voice quality is Frame Error Rate (FER). FER is the probability that a transmitted frame will be received incorrectly. Good voice quality of a call is considered when it FER value lies between 0 – 4 %
2. Computational Methodology:
% Connections with good voice quality = (No. of voice samples with good voice quality / Total number of samples) x 100
3. TRAI Benchmark: ≥ 95%
4. Audit Procedure –
a. A sample of calls would be taken randomly from the total calls established.
b. The operator should only be considering those calls which are meeting the desired benchmark of good voice quality.

TRAI Audit Wireless Report-Kolkata Circle JAS Quarter-2016
83
5.7.2 KEY FINDINGS
Data Source: Network Operations Center (NOC) of the operators
All operators met the benchmark for Voice quality as per PMR audit. During drive test Aircel, Reliance GSM failed to meet the TRAI benchmark for voice quality.
5.7.2.1 KEY FINDINGS – MONTH 1

TRAI Audit Wireless Report-Kolkata Circle JAS Quarter-2016
84
5.7.2.2 KEY FINDINGS – MONTH 2
Data Source: Network Operations Center (NOC) of the operators
5.7.2.3 KEY FINDINGS – MONTH 3

TRAI Audit Wireless Report-Kolkata Circle JAS Quarter-2016
85
Data Source: Network Operations Center (NOC) of the operators
6 PARAMETER DESCRIPTION & DETAILED FINDINGS - COMPARISON BETWEEN PMR DATA, 3 DAY LIVE DATA AND LIVE CALLING DATA FOR 3G
6.1 NODE BS DOWNTIME
6.1.1 PARAMETER DESCRIPTION
The parameter of network availability would be measured from following sub-parameters
1. Node Bs downtime (not available for service)
2. Worst affected Node Bs due to downtime
Definition - Node Bs downtime (not available for service): In the case of 3G networks, instead of BTS the nomenclature is Node B. The measurement methodology for the parameter Node B Accumulated downtime (not available for service) will be similar to the existing parameter for BTSs Accumulated downtime (not available for service).
Data Extraction/collection methodology - Data extraction to be done from appropriate counters. Auditors should be aware of counter details and definitions for each operator.
Source of Data: Network Operation Center (NOC) or a Central Server Computation Methodology –
Node Bs downtime (not available for service) = Sum of downtime of Node Bs in a month in hours i.e. total outage time of all Node Bs in hours during a month / (24 x Number of days in a month x Number of Node Bs in the network in licensed service area) x 100
3. TRAI Benchmark –
a. Node Bs downtime (not available for service) ≤ 2%

TRAI Audit Wireless Report-Kolkata Circle JAS Quarter-2016
86
4. Audit Procedure –
The fault alarm details at the OMC (MSC) for the network outages (due to own network elements and infrastructure service provider end outages) was audited
All the Node Bs in service area was considered. Planned outages due to network up gradation, routine maintenance were not considered.
Any outage as a result of force majeure were not considered at the time of calculation
Data is extracted from system log of the server of the operator. This data is in raw format which is further processed to arrive at the cumulative values.
List of operating sites with cell details and ids are taken from the operator.
When there is any outage a performance report gets generated in line with that cell resulting and master base of the Node Bs downtime and worst affected Node Bs due to downtime.
6.1.2 KEY FINDINGS - CONSOLIDATED
Data Source: Operations and Maintenance Center (OMC) of the operators

TRAI Audit Wireless Report-Kolkata Circle JAS Quarter-2016
87
All operators met the benchmark for Node Bs down time in PMR audit data, rest of the operators are meeting the benchmark.
Significant difference was observed between PMR & live measurement data for BSNL 3G & Reliance 3G. The possible reason for the variation could be the difference in time frame of data as PMR data is for 30 days and live measurement data is for three days.
6.1.2.1 KEY FINDINGS – MONTH 1
Data Source: Operations and Maintenance Center (OMC) of the operators

TRAI Audit Wireless Report-Kolkata Circle JAS Quarter-2016
88
6.1.2.2 KEY FINDINGS – MONTH 2
Data Source: Operations and Maintenance Center (OMC) of the operators
6.1.2.3 KEY FINDINGS – MONTH 3
Data Source: Operations and Maintenance Center (OMC) of the operators

TRAI Audit Wireless Report-Kolkata Circle JAS Quarter-2016
89
6.2 WORST AFFECTED NODE BS DUE TO DOWNTIME
6.2.1 PARAMETER DESCRIPTION
Definition – Worst Affected Node Bs due to downtime shall basically measure percentage of Node Bs having downtime greater than 24 hours in a month. Planned outages were not considered as part while computing.
For measuring the parameter “Percentage of worst affected Node Bs due to downtime" the downtime of each Node B lasting for more than 1 hour at a time in a day during the period of a month was considered.
Computation Methodology –
Worst affected Node Bs due to downtime = (Number of Node Bs having accumulated downtime greater than 24 hours in a month / Number of
Node Bs in Licensed Service Area) * 100 TRAI Benchmark –
b. Worst affected Node Bss due to downtime ≤ 2%
Audit Procedure –
i. The fault alarm details at the OMC (MSC) for the network outages (due to own network elements and infrastructure service provider end outages) was audited
ii. All the Node Bs in service area were considered. Planned outages due to network up gradation, routine maintenance were not considered.
iii. Data is extracted from system log of the server of the operator. This data is in raw format which is further processed to arrive at the cumulative values.
iv. Any outage as a result of force majeure was not considered at the time of calculation.
v. List of operating sites with cell details and ids are taken from the operator.
vi. All the Node Bs having down time greater than 24 hours is assessed and values of Node Bs accumulated downtime is computed in accordance.

TRAI Audit Wireless Report-Kolkata Circle JAS Quarter-2016
90
6.2.2 KEY FINDINGS – CONSOLIDATED
Data Source: Operations and Maintenance Center (OMC) of the operators
All operators except BSNL 3G and Reliance 3G met the benchmark for worst affected BTSs due to downtime as per audit/PMR data. Significant difference was observed between PMR & live measurement data for Reliance and BSNL. The possible reason for the variation could be the difference in time frame of data as PMR data is for 30 days and live measurement data is for three days.
6.2.2.1 KEY FINDINGS – MONTH 1

TRAI Audit Wireless Report-Kolkata Circle JAS Quarter-2016
91
Data Source: Operations and Maintenance Center (OMC) of the operators
6.2.2.2 KEY FINDINGS – MONTH 2
Data Source: Operations and Maintenance Center (OMC) of the operators
6.2.2.3 KEY FINDINGS – MONTH 3
Data Source: Operations and Maintenance Center (OMC) of the operators

TRAI Audit Wireless Report-Kolkata Circle JAS Quarter-2016
92
6.3 CALL SET UP SUCCESS RATE
6.3.1 PARAMETER DESCRIPTION
1. Definition: This parameter is same for 2G Networks as well as 3G Networks. However, the network elements involved in both the networks are different. Call Set-up Success Rate is defined as the ratio of Established Calls to Call Attempts. For establishing a call in 3G Networks, User Equipment (UE) accesses the Universal Terrestrial Radio Access Network (UTRAN) and establishes an RRC connection. Once RRC connection is established the Non Access Stratum (NAS) messages are exchanged between the UE and the Core Network (CN). The last step of the call setup is the establishment of a Radio Access Bearer (RAB) between the CN and the UE. However, any RAB abnormal release after RAB Assignment Response or Alerting/Connect message is to be considered as a dropped call.
2. Data Extraction/collection methodology - Data extraction to be done from appropriate counters. Auditors should be aware of counter details and definitions for each operator.
3. Source of Data: Network Operation Center (NOC) or a Central Server
4. Computation Methodology-(RRC Established / Total RRC Attempts) * 100
RRC Established means the following events have happened in RRC setup:-
RRC attempt is made
The RRC established
The RRC is routed to the outward path of the concerned MSC
5. TRAI Benchmark ≥ 95%
6. Audit Procedure –
The cell-wise data generated through counters/ MMC available in the switch for traffic measurements
CSSR calculation should be measured using OMC generated data only

TRAI Audit Wireless Report-Kolkata Circle JAS Quarter-2016
93
Measurement should be only in Time Consistent Busy Hour (CBBH) period for all days of the week
Counter data is extracted from the NOC of the operators.
Total calls established include all calls established excluding RAB congestion.
The numerator and denominator values are derived from adding the counter values from the MSC.
6.3.2 KEY FINDINGS - CONSOLIDATED
Data Source: Network Operations Center (NOC) of the operators
All operators met the TRAI benchmark as per audit/PMR data except BSNL 3G as per live audit and no drive test was conducted during the audit period.

TRAI Audit Wireless Report-Kolkata Circle JAS Quarter-2016
94
6.3.2.1 KEY FINDINGS – MONTH 1
Data Source: Network Operations Center (NOC) of the operators
6.3.2.2 KEY FINDINGS – MONTH 2
Data Source: Network Operations Center (NOC) of the operators

TRAI Audit Wireless Report-Kolkata Circle JAS Quarter-2016
95
6.3.2.3 KEY FINDINGS – MONTH 3
Data Source: Network Operations Center (NOC) of the operators

TRAI Audit Wireless Report-Kolkata Circle JAS Quarter-2016
96
6.4 NETWORK CHANNEL CONGESTION- RRC CONGESTION/ CIRCUIT SWITCHED RAB CONGESTION
6.4.1 PARAMETER DESCRIPTION
1. Definition (RRC Congestion): This parameter has been amended to include RRC Congestion in 3G Networks.2. Definition (Circuit Switched RAB congestion): Circuit Switched RAB congestion is similar to Traffic Channel Congestion. Therefore, the
existing parameter has been amended to include RAB congestion in 3G Networks.3. Point of Interconnection (POI) Congestion: This parameter denotes congestion at the outgoing traffic between two networks and is
equally applicable for 2G networks and 3G networks.
RRC Level: Stand-alone dedicated control channel
RAB Level: Traffic Channel
POI Level: Point of Interconnect
4. Data Extraction/collection methodology - Data extraction to be done from appropriate counters. Auditors should be aware of counter details and definitions for each operator.
5. Source of Data: Network Operation Center (NOC) or a Central Server6. Computational Methodology:
RRC / RAB Congestion% = [(A1 x C1) + (A2 x C2) +…….+ (An x Cn)] / (A1 + A2 +…+ An)
Where:-A1 = Number of attempts to establish RRC/ RAB made on day 1
C1 = Average RRC / RAB Congestion % on day 1
A2 = Number of attempts to establish RRC / RAB made on day 2
C2 = Average RRC / RAB Congestion % on day 2
An = Number of attempts to establish RRC / RAB made on day n
Cn = Average RRC / RAB Congestion % on day n

TRAI Audit Wireless Report-Kolkata Circle JAS Quarter-2016
97
POI Congestion% = [(A1 x C1) + (A2 x C2) +…….+ (An x Cn)] / (A1 + A2 +…+ An)
Where:-A1 = POI traffic offered on all POIs (no. of calls) on day 1
C1 = Average POI Congestion % on day 1
A2 = POI traffic offered on all POIs (no. of calls) on day 2
C2 = Average POI Congestion % on day 2
An = POI traffic offered on all POIs (no. of calls) on day n
Cn = Average POI Congestion % on day n
7. Benchmark:
RRC Congestion: ≤ 1%, RAB Congestion: ≤ 2%, POI Congestion: ≤ 0.5%
8. Audit Procedure –
Audit of the details of RRC and RAB congestion percentages computed by the operator (using OMC–Switch data only) would be conducted
The operator should be measuring this parameter during Time consistent busy hour (TCBH) only RRC

TRAI Audit Wireless Report-Kolkata Circle JAS Quarter-2016
98
6.4.2 KEY FINDINGS - RRC CONGESTION (CONSOLIDATED)
Data Source: Network Operations Center (NOC) of the operators
All operators met the benchmark for RRC Congestion with live data.
6.4.2.1 KEY FINDINGS – MONTH 1
Data Source: Network Operations Center (NOC) of the operators

TRAI Audit Wireless Report-Kolkata Circle JAS Quarter-2016
99
6.4.2.2 KEY FINDINGS – MONTH 2
Data Source: Network Operations Center (NOC) of the operators
6.4.2.3 KEY FINDINGS – MONTH 3
Data Source: Network Operations Cente r (NOC) of the operators
6.4.3 KEY FINDINGS – CIRCUIT SWITCHED RAB CONGESTION (CONSOLIDATED)

TRAI Audit Wireless Report-Kolkata Circle JAS Quarter-2016
100
Data Source: Network Operations Center (NOC) of the operators
All operators met the benchmark as per audit/PMR & 3days live report.
6.4.3.1 KEY FINDINGS – MONTH 1

TRAI Audit Wireless Report-Kolkata Circle JAS Quarter-2016
101
6.4.3.2 KEY FINDINGS – MONTH 2
Data Source: Network Operations Center (NOC) of the operators
6.4.3.3 KEY FINDINGS – MONTH 3
Data Source: Network Operations Center (NOC) of the operators

102
6.5 CIRCUIT SWITCHED VOICE DROP RATE
6.5.1 PARAMETER DESCRIPTION
1. Definition - The Call Drop Rate measures the inability of Network to maintain a call and is defined as the ratio of abnormal speech disconnects with respect to all speech disconnects (both normal and abnormal). In 3G Networks, a normal disconnect is initiated from the Mobile Switching Centre (MSC) at completion of the call by a RAB Disconnect message. An abnormal RAB disconnect can be initiated by either UTRAN or CN and includes Radio Link Failures, Uplink (UL) or Downlink (DL) interference or any other reason.
Total No. of voice RAB abnormally released = All calls ceasing unnaturally i.e. due to handover or due to radio loss
No. of voice RAB normally released = All calls that have RAB allocation during busy hour
2. Data Extraction/collection methodology - Data extraction to be done from appropriate counters. Auditors should be aware of counter details and definitions for each operator.
3. Source of Data: Network Operation Center (NOC) or a Central Server
4. Computational Methodology: (No. of voice RAB normally released / (No. of voice RAB normally released + RAB abnormally released )x 100
Key Performance Indicator Term Definition
#RAB Normal Release(CSV) Number of voice RAB normally Released
#RAB Abnormal Release(CSV) Number of voice RAB abnormally Released
5. TRAI Benchmark –
Circuit switched voice drop rate ≤ 2%
6. Audit Procedure –
Audit of traffic data of the relevant quarter kept in OMC-R at MSCs and used for arriving at CDR was used

TRAI Audit Wireless Report-Kolkata Circle JAS Quarter-2016
103
The operator should only be considering those calls which are dropped during Time consistent busy hour (TCBH) for all days of the relevant quarter.
6.5.2 KEY FINDINGS - CONSOLIDATED
Data Source: Network Operations Center (NOC) of the operators
All operators met the benchmark for call drop rate during audit.
Significant difference was observed between PMR & live measurement data for BSNL. The possible reason for the variation could be the difference in time frame of data as PMR data is for 30 days and live measurement data is for three days.

TRAI Audit Wireless Report-Kolkata Circle JAS Quarter-2016
104
6.5.2.1 KEY FINDINGS – MONTH 1
Data Source: Network Operations Center (NOC) of the operators
6.5.2.2 KEY FINDINGS – MONTH 2
Data Source: Network Operations Center (NOC) of the operators

TRAI Audit Wireless Report-Kolkata Circle JAS Quarter-2016
105
6.5.2.3 KEY FINDINGS – MONTH 3
Data Source: Network Operations Center (NOC) of the operators
6.6 WORST AFFECTED CELLS HAVING MORE THAN 3% CIRCUIT SWITCHED VOICE DROP RATE
6.6.1 PARAMETER DESCRIPTION
1. Definition- Cells having more than 3% circuit switch voice quality: The existing parameter has been amended to cover 3G Networks to assess worst affected cells having more than 3% CSV Drop Rate.
2. Data Extraction/collection methodology - Data extraction to be done from appropriate counters. Auditors should be aware of counter details and definitions for each operator.
3. Source of Data: Network Operation Center (NOC) or a Central Server

TRAI Audit Wireless Report-Kolkata Circle JAS Quarter-2016
106
4. Computational Methodology: (Number of cells having CSV drop rate > 3% during CBBH in a month / Total number of cells in the licensed area) x 100
5. TRAI Benchmark –
Worst affected cells having CSV drop rate > 3% during CBBH in a month ≤ 3%
6. Audit Procedure –
Audit of traffic data of the relevant quarter kept in OMC-R at MSCs and used for arriving at CDR would be conducted.
The operator should only be considering those calls which are dropped during Cell Bouncing Busy hour (CBBH) for all days of the relevant quarter.
6.6.2 KEY FINDINGS - CONSOLIDATED

TRAI Audit Wireless Report-Kolkata Circle JAS Quarter-2016
107
Data Source: Network Operations Center (NOC) of the operators
All operators met the benchmark during audit PMR/live.
Significant difference was observed between PMR & live measurement data for BSNL. The possible reason for the variation could be the difference in time frame of data as PMR data is for 30 days and live measurement data is for three days.
6.6.2.1 KEY FINDINGS – MONTH 1

TRAI Audit Wireless Report-Kolkata Circle JAS Quarter-2016
108
Data Source: Network Operations Center (NOC) of the operators
6.6.2.2 KEY FINDINGS – MONTH 2
Data Source: Network Operations Center (NOC) of the operators
6.6.2.3 KEY FINDINGS – MONTH 3
Data Source: Network Operations Center (NOC) of the operators

TRAI Audit Wireless Report-Kolkata Circle JAS Quarter-2016
109
6.7 CIRCUIT SWITCH VOICE QUALITY
6.7.1 PARAMETER DESCRIPTION
5. Definition:
for GSM service providers the calls having a value of 0 –5 are considered to be of good quality (on a seven point scale)
For CDMA the measure of voice quality is Frame Error Rate (FER). FER is the probability that a transmitted frame will be received incorrectly. Good voice quality of a call is considered when it FER value lies between 0 – 4 %
6. Computational Methodology:
% Connections with good voice quality = (No. of voice samples with good voice quality / Total number of samples) x 100
7. TRAI Benchmark: ≥ 95%
8. Audit Procedure –
a. A sample of calls would be taken randomly from the total calls established.
b. The operator should only be considering those calls which are meeting the desired benchmark of good voice quality.

TRAI Audit Wireless Report-Kolkata Circle JAS Quarter-2016
110
6.7.2 KEY FINDINGS
Data Source: Network Operations Center (NOC) of the operators
All operators met the benchmark for voice quality. No drive test was conducted during the audit period for the given LSA.
6.7.2.1 KEY FINDINGS – MONTH 1

TRAI Audit Wireless Report-Kolkata Circle JAS Quarter-2016
111
Data Source: Network Operations Center (NOC) of the operators
6.7.2.2 KEY FINDINGS – MONTH 2
Data Source: Network Operations Center (NOC) of the operators
6.7.2.3 KEY FINDINGS – MONTH 3
Data Source: Network Operations Center (NOC) of the operators

TRAI Audit Wireless Report-Kolkata Circle JAS Quarter-2016
112
7 PARAMETER DESCRIPTION & DETAILED FINDINGS - WIRELESS DATA SERVICES 2G
7.1 SERVICE ACTIVATION /PROVISIONING FOR 2G
7.1.1 PARAMETER DESCRIPTIONThis refers to the activation of services after activation of the SIM. This involves programming the various databases with the customer's information and anygateways to standard Internet chat or mail services or any data services. The service provider typically sends these settings to the subscriber's handset using SMS or WAP.
% activation done within 4 hours = Total Time Taken for Activation ×100Total request time made

TRAI Audit Wireless Report-Kolkata Circle JAS Quarter-2016
113
All operators met the benchmark for PMR as well as live audit except MTS for PMR.
Significant difference was observed between PMR & live measurement data for TATA CDMA and BSNL. The possible reason for the variation could be the difference in time frame of data as PMR data is for 30 days and live measurement data is for three days.
7.1.1.1 KEY FINDINGS – MONTH 1

TRAI Audit Wireless Report-Kolkata Circle JAS Quarter-2016
114
7.1.1.2 KEY FINDINGS – MONTH 2
7.1.1.3 KEY FINDINGS – MONTH 3
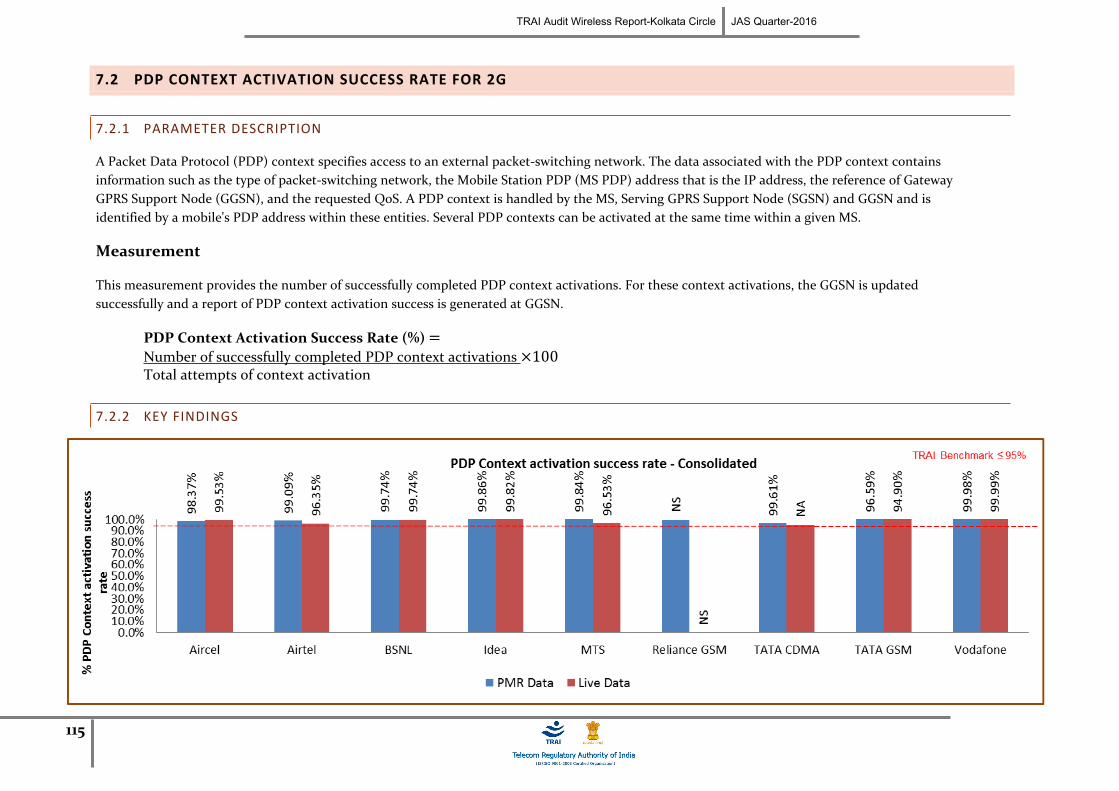
TRAI Audit Wireless Report-Kolkata Circle JAS Quarter-2016
115
7.2 PDP CONTEXT ACTIVATION SUCCESS RATE FOR 2G
7.2.1 PARAMETER DESCRIPTION
A Packet Data Protocol (PDP) context specifies access to an external packet-switching network. The data associated with the PDP context contains information such as the type of packet-switching network, the Mobile Station PDP (MS PDP) address that is the IP address, the reference of Gateway GPRS Support Node (GGSN), and the requested QoS. A PDP context is handled by the MS, Serving GPRS Support Node (SGSN) and GGSN and is identified by a mobile's PDP address within these entities. Several PDP contexts can be activated at the same time within a given MS.
Measurement
This measurement provides the number of successfully completed PDP context activations. For these context activations, the GGSN is updated successfully and a report of PDP context activation success is generated at GGSN.
PDP Context Activation Success Rate (%) =Number of successfully completed PDP context activations ×100Total attempts of context activation
7.2.2 KEY FINDINGS

TRAI Audit Wireless Report-Kolkata Circle JAS Quarter-2016
116
All operators met the benchmark for PMR as well as live audit
7.2.2.1 KEY FINDINGS – MONTH 1
7.2.2.2 KEY FINDINGS – MONTH 2

TRAI Audit Wireless Report-Kolkata Circle JAS Quarter-2016
117
7.2.2.3 KEY FINDINGS – MONTH 3
7.3 DROP RATE FOR 2G
7.3.1 PARAMETER DESCRIPTION
It measures the inability of Network to maintain a connection and is defined as the ratio of abnormal disconnects w.r.t. all disconnects (both normal and abnormal). An abnormal disconnect may happen because of Radio Link Failures, Uplink (UL) or Downlink (DL) interference, bad coverage, unsuccessful handovers or any other reason. The drop rate is to be measured for all generations of the technologies separately.
Drop rate = No. of Dropped data Calls ×100
No. of Successful data calls

TRAI Audit Wireless Report-Kolkata Circle JAS Quarter-2016
118
7.3.2 KEY FINDINGS
All operators met the benchmark for PMR as well as live audit. Note: BSNL did not submit the data for % Drop Rate for both PMR and Live audit .
7.3.2.1 KEY FINDINGS – MONTH 1
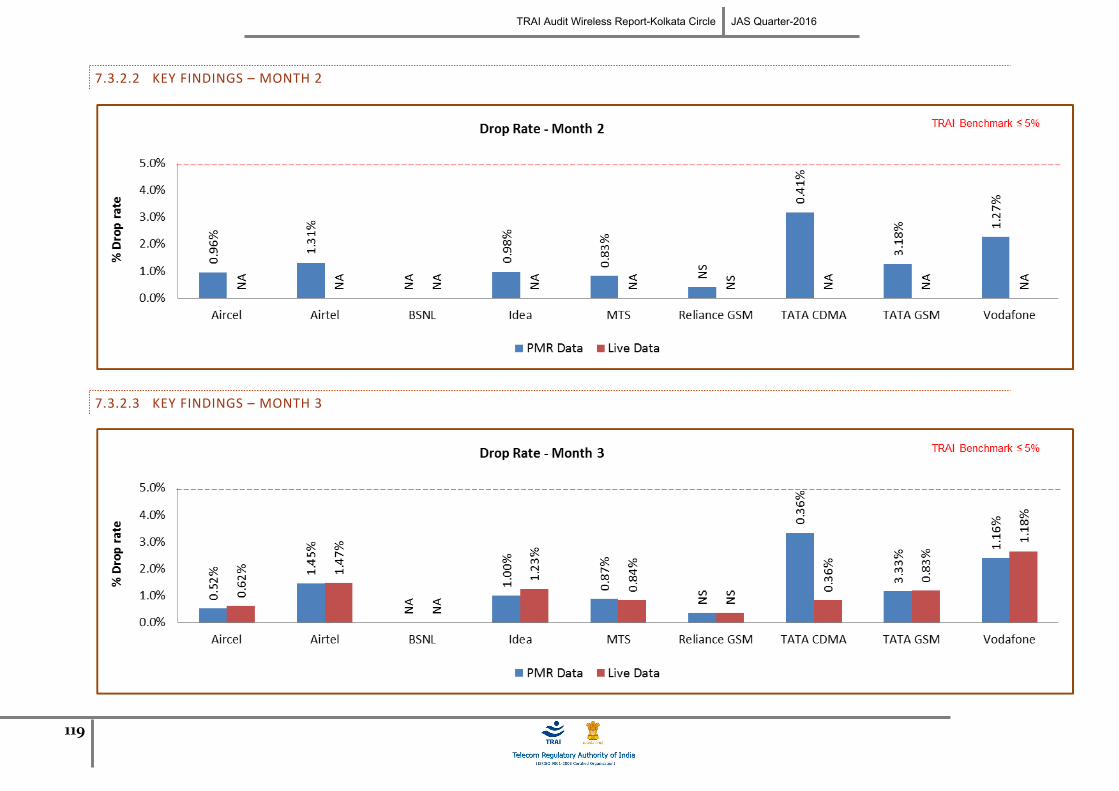
TRAI Audit Wireless Report-Kolkata Circle JAS Quarter-2016
119
7.3.2.2 KEY FINDINGS – MONTH 2
7.3.2.3 KEY FINDINGS – MONTH 3

TRAI Audit Wireless Report-Kolkata Circle JAS Quarter-2016
120
8 PARAMETER DESCRIPTION & DETAILED FINDINGS - WIRELESS DATA SERVICES 3G
8.1 SERVICE ACTIVATION /PROVISIONING FOR 3G
8.1.1 PARAMETER DESCRIPTION
This refers to the activation of services after activation of the SIM. This involves programming the various databases with the customer's information and any gateways to standard Internet chat or mail services or any data services. The service provider typically sends these settings to the subscriber's handset using SMS or WAP.
% activation done within 4 hours = Total Time Taken for Activation ×100Total request time made
8.1.2 KEY FINDINGS
All operators met the benchmark for PMR as well as live audit.

TRAI Audit Wireless Report-Kolkata Circle JAS Quarter-2016
121
8.1.2.1 KEY FINDINGS – MONTH 1
8.1.2.2 KEY FINDINGS – MONTH 2

TRAI Audit Wireless Report-Kolkata Circle JAS Quarter-2016
122
8.1.2.3 KEY FINDINGS – MONTH 3

TRAI Audit Wireless Report-Kolkata Circle JAS Quarter-2016
123
8.2 PDP CONTEXT ACTIVATION SUCCESS RATE FOR 3G
8.2.1 PARAMETER DESCRIPTION
A Packet Data Protocol (PDP) context specifies access to an external packet-switching network. The data associated with the PDP context contains information such as the type of packet-switching network, the Mobile Station PDP (MS PDP) address that is the IP address, the reference of Gateway GPRS Support Node (GGSN), and the requested QoS. A PDP context is handled by the MS, Serving GPRS Support Node (SGSN) and GGSN and is identified by a mobile's PDP address within these entities. Several PDP contexts can be activated at the same time within a given MS.
Measurement
This measurement provides the number of successfully completed PDP context activations. For these context activations, the GGSN is updated successfully and a report of PDP context activation success is generated at GGSN.
PDP Context Activation Success Rate (%) =Number of successfully completed PDP context activations ×100Total attempts of context activation
8.2.2 KEY FINDINGS

TRAI Audit Wireless Report-Kolkata Circle JAS Quarter-2016
124
All operators met the benchmark for PMR as well as live audit. Reliance 3G data not available.
8.2.2.1 KEY FINDINGS – MONTH 1
8.2.2.2 KEY FINDINGS – MONTH 2

TRAI Audit Wireless Report-Kolkata Circle JAS Quarter-2016
125
8.2.2.3 KEY FINDINGS – MONTH 3
8.3 DROP RATE FOR 3G
8.3.1 PARAMETER DESCRIPTION
It measures the inability of Network to maintain a connection and is defined as the ratio of abnormal disconnects w.r.t. all disconnects (both normal and abnormal). An abnormal disconnect may happen because of Radio Link Failures, Uplink (UL) or Downlink (DL) interference, bad coverage, unsuccessful handovers or any other reason. The drop rate is to be measured for all generations of the technologies separately.
Drop rate = No. of Dropped data Calls ×100
No. of Successful data calls

TRAI Audit Wireless Report-Kolkata Circle JAS Quarter-2016
126
8.3.2 KEY FINDINGS
All operators met the benchmark for PMR as well as live audit.
8.3.2.1 KEY FINDINGS – MONTH 1

TRAI Audit Wireless Report-Kolkata Circle JAS Quarter-2016
127
8.3.2.2 KEY FINDINGS – MONTH 2
8.3.2.3 KEY FINDINGS – MONTH 3

TRAI Audit Wireless Report-Kolkata Circle JAS Quarter-2016
128
9 PARAMETER DESCRIPTION AND DETAILED FINDINGS – NON-NETWORK PARAMETERS
9.1 METERING AND BILLING CREDIBILITY
The billing complaints for postpaid are calculated by averaging over one billing cycle in a quarter. For example, there are three billing cycles in a quarter, the data for each billing cycle is calculated separately and then averaged over.
The charging complaints for prepaid are calculated by taking all complaints in a quarter.
9.1.1 PARAMETER DESCRIPTION
All the complaints related to billing/ charging as per clause 3.7.2 of QoS regulation of 20th December, 2009 were covered. The types of billing complaints covered are listed below.
Payments made and not credited to the subscriber account
Payment made on time but late payment charge levied wrongly
Wrong roaming charges
Double charges
Charging for toll free services
Local calls charged/billed as STD/ISD or vice versa
Calls or messages made disputed
Validity related complaints
Credit agreed to be given in resolution of complaint, but not accounted in the bill
Charging for services provided without consent
Charging not as per tariff plans or top up vouchers/ special packs etc.
Overcharging or undercharging

TRAI Audit Wireless Report-Kolkata Circle JAS Quarter-2016
129
In addition to the above, any billing complaint which leads to billing error, waiver, refund, credit, or any adjustment is also considered as valid billing complaint for calculating the number of disputed bills.
Computational Methodology:
Billing complaints per 100 bills issued (Post-paid) = (Total billing complaints** received during the relevant billing cycle / Total bills generated* during the relevant billing cycle)*100
*Operator to include all types of bills generated for customers. This would include printed bills, online bills and any other forms of bills generated
**Billing complaints here shall include only dispute related issues (including those that may arise because of a lack of awareness at the subscribers’ end). It does not include any provisional issues (such as delayed dispatch of billing statements, etc.) in which the operator has opened a ticket internally.
Charging complaints per 100 subscribers (Prepaid) = (Total charging complaints received during the quarter/ Total number of subscribers reported by the operator at the end of the quarter) * 100
TRAI Benchmark: <= 0.1%
Audit Procedure:
Audit of billing complaint details for the complaints received during the quarter and used for arriving at the benchmark reported to TRAI would be conducted
For Postpaid, the total billing complaints would be audited by averaging over billing cycles in a quarter
For Prepaid, the data of total charging complaints in a quarter would be taken for the purpose of audit
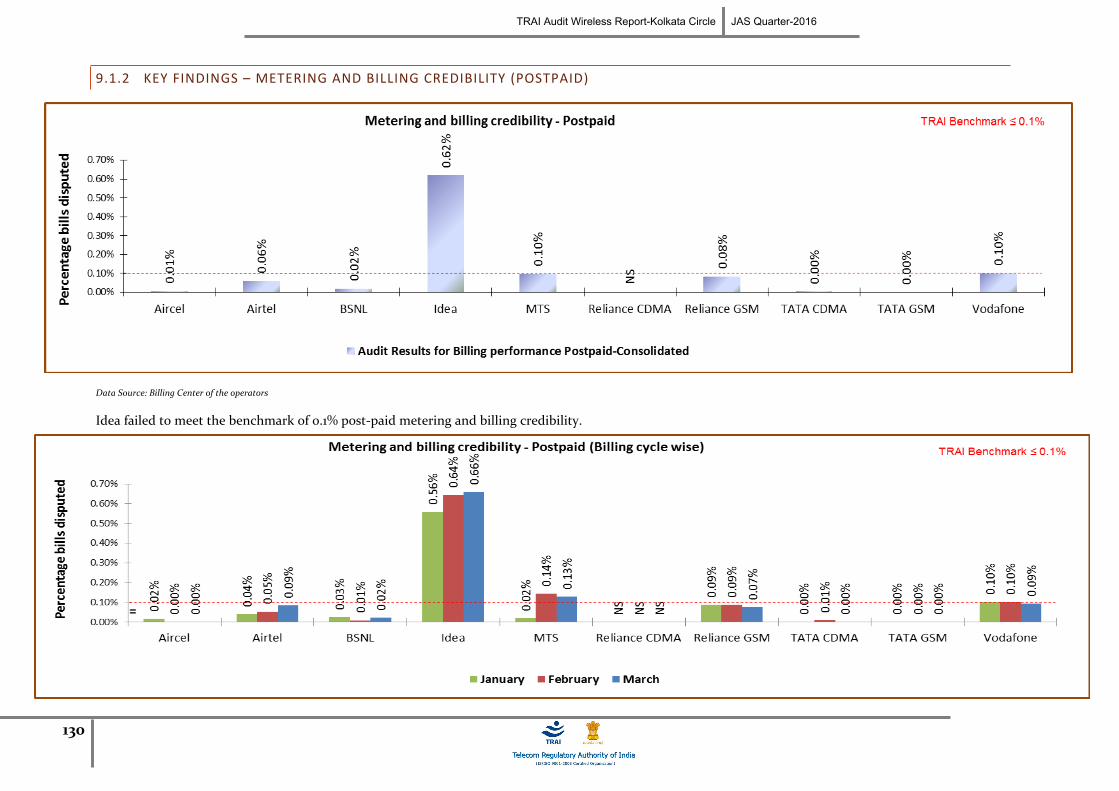
TRAI Audit Wireless Report-Kolkata Circle JAS Quarter-2016
130
9.1.2 KEY FINDINGS – METERING AND BILLING CREDIBILITY (POSTPAID)
Data Source: Billing Center of the operators
Idea failed to meet the benchmark of 0.1% post-paid metering and billing credibility.

TRAI Audit Wireless Report-Kolkata Circle JAS Quarter-2016
131
Data Source: Billing Center of the operators
9.1.3 KEY FINDINGS - METERING AND BILLING CREDIBILITY (PREPAID)
Data Source: Billing Center of the operators
All operators met the benchmark for metering and billing credibility of prepaid subscribers.

TRAI Audit Wireless Report-Kolkata Circle JAS Quarter-2016
132
9.2 RESOLUTION OF BILLING/ CHARGING COMPLAINTS
9.2.1 PARAMETER DESCRIPTION
Calculation of Percentage resolution of billing complaints
The calculation methodology (given below) as per QoS regulations 2009 (7 of 2009) was followed to -calculate resolution of billing complaints.
Resolution of billing complaints within 4 weeks:
Resolution of billing complaints within 6 weeks:

TRAI Audit Wireless Report-Kolkata Circle JAS Quarter-2016
133
**Billing complaints here shall include only dispute related issues (including those that may arise because of a lack of awareness at the subscribers’ end). It does not include any provisional issues (such as delayed dispatch of billing statements, etc.) in which the operator has opened a ticket internally. Complaints raised by the consumers to operator are only considered as part of the calculation.
The complaints that get marked as invalid by the operator are not considered for calculation as those complaints cannot be considered as resolved by the operator.
*** Date of resolution in this case would refer to the date when a communication has taken place from the operator’s end to inform the complainant about the final resolution of the issue / dispute.
Benchmark: 98% complaints resolved within 4 weeks, 100% within 6 weeks.
9.2.2 KEY FINDINGS - WITHIN 4 WEEKSData Source: Billing Center of the operators
All operators met the TRAI benchmark of resolution of billing complaints within 4 weeks except Aircel, BSNL and Reliance GSM in live calling category.

TRAI Audit Wireless Report-Kolkata Circle JAS Quarter-2016
134
9.2.3 KEY FINDINGS WITHIN 6 WEEKS
Data Source: Billing Center of the operators
All operators met the TRAI benchmark of resolution of billing complaints within 6 week except Airtel as per Audit results and Reliance GSM for live calling category. No data received from TATA GSM unlike earlier occasions.

TRAI Audit Wireless Report-Kolkata Circle JAS Quarter-2016
135
9.3 PERIOD OF APPLYING CREDIT/WAVIER
9.3.1 PARAMETER DESCRIPTION
Computational Methodology:
Period of applying credit waiver = (number of cases where credit waiver is applied within 7 days/ total number of cases eligible for credit waiver) * 100
TRAI Benchmark:
Period of applying credit waiver within 7 days: 100%
Audit Procedure:
Operator to provide details of:-
List of all eligible cases along with
Date of applying credit waiver to all the eligible cases.
Date of resolution of complaint for all eligible cases

TRAI Audit Wireless Report-Kolkata Circle JAS Quarter-2016
136
9.3.2 KEY FINDINGSData Source: Billing Center of the operators
All operators met the benchmark for this parameter.
9.4 CALL CENTRE PERFORMANCE-IVR

TRAI Audit Wireless Report-Kolkata Circle JAS Quarter-2016
137
9.4.1 PARAMETER DESCRIPTION
Computational Methodology:
Call centre performance IVR = (Number of calls connected and answered by IVR/ All calls attempted to IVR) * 100
TRAI Benchmark: >= 95%
Audit Procedure:
Operators provide details of the following from their central call centre/ customer service database:
Total calls connected and answered by IVR
Total calls attempted to IVR
Also live calling is done to test the calls connected and answered by IVR
9.4.2 KEY FINDINGS

TRAI Audit Wireless Report-Kolkata Circle JAS Quarter-2016
138
Data Source: Customer Service Center of the operators
As per PMR Airtel failed to meet the benchmark.
9.5 CALL CENTRE PERFORMANCE-VOICE TO VOICE
9.5.1 PARAMETER DESCRIPTION
Computational Methodology:
Call centre performance Voice to Voice = (Number of calls answered by operator within 90 seconds/ All calls attempted to connect to the operator) * 100
Audit Procedure:
Operators provide details of the following from their central call centre/ customer service database:
Total calls connected and answered by operator within 90 seconds
Total calls attempted to connect to the operator
Also live calling was done to test the calls answered within 90 seconds by the operator

TRAI Audit Wireless Report-Kolkata Circle JAS Quarter-2016
139
Benchmark: 95% calls to be answered within 90 seconds
9.5.2 KEY FINDINGS
Data Source: Customer Service Center of the operators

TRAI Audit Wireless Report-Kolkata Circle JAS Quarter-2016
140
Aircel, Airtel and Reliance GSM were not able to meet the benchmark as per audit PMR data. However, as per live calling done to customers, the performance of all operators met the benchmark. Reliance CDMA is not offering any service in the LSA.
Data Source: Customer Service Center of the operators
9.6 TERMINATION/CLOSURE OF SERVICE
9.6.1 PARAMETER DESCRIPTION
Computational Methodology:
Time taken for closure of service = (number of closures done within 7 days/ total number of closure requests) * 100
TRAI Benchmark:
Termination/Closure of Service: <=7 days
Audit Procedure:
Operator provide details of the following from their central billing/CS database:

TRAI Audit Wireless Report-Kolkata Circle JAS Quarter-2016
141
Date of lodging the closure request (all requests in given period)
Date of closure of service
9.6.2 KEY FINDINGS
Data Source: Customer Service Center of the operators
All operators met the TRAI benchmark for the parameter except Idea.
9.7 REFUND OF DEPOSITS AFTER CLOSURE
9.7.1 PARAMETER DESCRIPTION
Computational Methodology:
Time taken for refund for deposit after closures = (number of cases of refund after closure done within 60 days/ total number of cases of refund after closure) * 100

TRAI Audit Wireless Report-Kolkata Circle JAS Quarter-2016
142
Any case where the operators need to return the amount back to consumers post closure of service in form of cheque/cash is considered to be refund.
TRAI Benchmark:
Time taken for refund for deposit after closures: 100% within 60 days
Audit Procedure:
Operator provide details of the following from their central billing/refund database:
Dates of completion of all ‘closure requests’ resulting in requirement of a refund by the operator.
Dates of refund pertaining to all closure request received during the relevant quarter
9.7.2 KEY FINDINGS
Data Source: Customer Service Center of the operators

TRAI Audit Wireless Report-Kolkata Circle JAS Quarter-2016
143
NA:- Not Applicable
All operators met the TRAI benchmark for the parameter except Reliance GSM.
10 DETAILED FINDINGS - DRIVE TEST DATA
10.1 OPERATOR ASSISTED DRIVE TEST - VOICE
No OADT conducted for the given period for the LSA under consideration.

TRAI Audit Wireless Report-Kolkata Circle JAS Quarter-2016
144
Benchmark Aircel Airtel BSNL Idea MTS Reliance CDMA Reliance GSM TATA CDMA TATA GSM Vodafone
Number of BTSs in the licensed service area
7207 8813 3842 7084 1713 NS 4848 1770 5340 8426
Sum of downtime of BTSs in a month (in hours)
3790 134 40477 10958 571 NS 48522 1346 2424 2433
BTSs accumulated downtime (not available for service)
≤ 2% 0.07% 0.00% 1.42% 0.21% 0.04% NS 1.35% 0.10% 0.06% 0.04%
Number of BTSs having accumulated downtime >24 hours
12 0 72 24 0 NS 294 0 5 17
Worst affected BTSs due to downtime
≤ 2% 0.17% 0.00% 1.87% 0.34% 0.00% NS 6.06% 0.00% 0.09% 0.20%
Benchmark Aircel Airtel BSNL Idea MTS Reliance CDMA Reliance GSM TATA CDMA TATA GSM Vodafone
Number of BTSs in the licensed service area
2400 2934 1285 2362 571 NS 1616 590 1781 2830
Sum of downtime of BTSs in a month (in hours)
175 161 616 393 71 NS 983 0 31 83
BTSs accumulated downtime (not available for service)
≤ 2% 0.10% 0.08% 0.67% 0.23% 0.17% NS 0.84% 0.00% 0.02% 0.04%
Number of BTSs having accumulated downtime >24 hours
1 0 3 6 0 NS 0 0 0 2
Worst affected BTSs due to downtime
≤ 2% 0.04% 0.00% 0.23% 0.25% 0.00% NS 0.00% 0.00% 0.00% 0.07%
1. Network Availability
Audit Results for Network Availability- PMR data
Live Measurement Results for Network Availability- 3 Day live data
11 ANNEXURE – CONSOLIDATED-2G
11.1 NETWORK AVAILABILITY

TRAI Audit Wireless Report-Kolkata Circle JAS Quarter-2016
145
CSSR Benchmark Aircel Airtel BSNL Idea MTS Reliance CDMA Reliance GSM TATA CDMA TATA GSM Vodafone
CSSR ≥ 95% 98.20% 99.66% 99.30% 99.68% 99.89% NS 97.40% 99.34% 99.49% 99.56%
SDCCH/Paging channel congestion ≤ 1% 0.15% 0.05% 0.40% 0.05% NA NS 0.10% NA 0.03% 0.04%
TCH congestion ≤ 2% 0.05% 0.04% 0.75% 0.09% 0.00% NS 0.50% 0.13% 0.02% 0.44%
CSSR Benchmark Aircel Airtel BSNL Idea MTS Reliance CDMA Reliance GSM TATA CDMA TATA GSM Vodafone
CSSR ≥ 95% 98.67% 99.73% 98.69% 99.61% 99.90% NS 97.96% 99.52% 99.57% 99.74%
SDCCH/Paging channel congestion ≤ 1% 0.08% 0.05% 0.41% 0.05% NA NS 0.05% NA 0.04% 0.05%
TCH congestion ≤ 2% 0.01% 0.04% 1.84% 0.01% 0.00% NS 0.08% 0.02% 0.01% 0.26%
CSSR Benchmark Aircel Airtel BSNL Idea MTS Reliance CDMA Reliance GSM TATA CDMA TATA GSM Vodafone
Total number of call attempts 0 0 0 0 0 NS 0 0 0 0
Total number of successful calls established
0 0 0 0 0 NS 0 0 0 0
CSSR ≥ 95% NA NA NA NA NA NS NA NA NA NA
%age blocked calls NA NA NA NA NA NS NA NA NA NA
Audit Results for CSSR, SDCCH and TCH congestion- PMR data
Live measurement results for CSSR, SDCCH and TCH congestion- 3 Day Data
Drive test results for CSSR (Average of three drive tests) and blocked calls- Drive Test Data
Data Source: Operations and Maintenance Center (OMC) of the operators
11.2 CONNECTION ESTABLISHMENT (ACCESSIBILITY)
Data Source: Network Operations Center (NOC) of the operators and Data Source: Drive test reports submitted by operators to auditors

TRAI Audit Wireless Report-Kolkata Circle JAS Quarter-2016
146
Call drop rate Benchmark Aircel Airtel BSNL Idea MTS Reliance CDMA Reliance GSM TATA CDMA TATA GSM Vodafone
Total number of calls established 173880883 292746856 127218457 170684457 20520019 NS 0 9844192 137814220 337696977
Total number of calls dropped 1051464 1980191 1760290 483285 93792 NS 148143 26940 487943 2408925
Call drop rate ≤ 2% 0.60% 0.68% 1.38% 0.28% 0.46% NS NA 0.27% 0.35% 0.71%
Total number of cells in the network 21606 26222 10718 21296 6585 NS 14541 5904 15868 21929
Total number of cells having more than 3% TCH
519 628 202 38 176 NS 58 167 153 601
Worst affected cells having more than 3% TCH
≤ 3% 2.40% 2.39% 1.88% 0.18% 2.68% NS 0.40% 2.83% 0.96% 2.74%
Call drop rate Benchmark Aircel Airtel BSNL Idea MTS Reliance CDMA Reliance GSM TATA CDMA TATA GSM Vodafone
Total number of calls established 74551434 10516107 17829170 77564491 8909051 NS 0 4293964 58830610 168269539
Total number of calls dropped 359291 69162 265053 171404 28606 NS 41291 12048 149916 951607
Call drop rate ≤ 2% 0.48% 0.66% 1.49% 0.22% 0.32% NS NA 0.28% 0.25% 0.57%
Total number of cells in the network 7197 8746 3587 7102 2195 NS 4847 1968 5288 7376
Total number of cells having more than 3% TCH
159 206 76 1 2 NS 2 46 35 208
Worst affected cells having more than 3% TCH
≤ 3% 2.21% 2.36% 2.12% 0.01% 0.08% NS 0.04% 2.34% 0.66% 2.82%
Call drop rate Benchmark Aircel Airtel BSNL Idea MTS Reliance CDMA Reliance GSM TATA CDMA TATA GSM Vodafone
Total number of calls established 0 0 0 0 0 NS 0 0 0 0
Total number of calls dropped 0 0 0 0 0 NS 0 0 0 0
Call drop rate ≤ 2% NA NA NA NA NA NS NA NA NA NA
Drive test results for Call drop rate (Average of three drive tests) - Drive Test Data
Audit Results for Call drop rate and for number of cells having more than 3% TCH-PMR data
Live measurement results for Call drop rate and for number of cells having more than 3% TCH- 3 Day data
11.3 CONNECTION MAINTENANCE (RETAINABILITY)

TRAI Audit Wireless Report-Kolkata Circle JAS Quarter-2016
147
Data Source: Network Operations Center (NOC) of the operators and Drive test reports submitted by operators to auditors
11.4 VOICE QUALITY
Voice quality Benchmark Aircel Airtel BSNL Idea MTS Reliance CDMA Reliance GSM TATA CDMA TATA GSM Vodafone
Total number of sample calls 36458805874 109385115618 12000 27073400362 197550 NS 21674470162 728222946 19336138106 53776489436
Total number of calls with good voice quality
35756370905 107578789894 11976 26554130278 196757 NS 21454927894 726175114 19100138823 52763304882
%age calls with good voice quality ≥ 95% 98.07% 98.35% 99.80% 98.08% 99.60% NS 98.99% 99.72% 98.78% 98.12%
Voice quality Benchmark Aircel Airtel BSNL Idea MTS Reliance CDMA Reliance GSM TATA CDMA TATA GSM Vodafone
Total number of sample calls 15597312412 3881903850 600 10844362756 158040 NS 7991986750 347931316 8135169451 23387422731
Total number of calls with good voice quality
15373185937 3816758277 593 10665107331 156550 NS 7920697883 347076806 8066713044 22994228607
%age calls with good voice quality ≥ 95% 98.56% 98.32% 98.83% 98.35% 99.06% NS 99.11% 99.75% 99.16% 98.32%
Voice quality Benchmark Aircel Airtel BSNL Idea MTS Reliance CDMA Reliance GSM TATA CDMA TATA GSM Vodafone
Total number of sample calls 0 0 0 0 NA NS 0 NA 0 0
Total number of calls with good voice quality
0 0 0 0 NA NS 0 NA 0 0
%age calls with good voice quality ≥ 95% NA NA NA NA NA NA NA NA NA NA
Audit Results for Voice quality -PMR Data
Live measurement results for Voice quality-3 Day data
Drive test results for Voice quality (Average of three drive tests) - DT data
Data Source: Network Operations Center (NOC) of the operators and Drive test reports submitted by operators to auditors

TRAI Audit Wireless Report-Kolkata Circle JAS Quarter-2016
148
11.5 POI CONGESTION
POI congestion Benchmark Aircel Airtel BSNL Idea MTS Reliance CDMA Reliance GSM TATA CDMA TATA GSM Vodafone
Total number of working POIs 50 31 79 101 40 NS 29 42 30 45
No. of POIs not meeting benchmark 0 0 0 0 0 NS 0 0 0 0
Total Capacity of all POIs (A) - in erlangs
245277 252664 454707 229568 107734 NS 42778 62119 40178 649227
Traffic served for all POIs (B)- in erlangs
90973 124451 21611 123941 24903 NS 26322 21341 15101 364511
POI congestion ≤ 0.5% 0.00% 0.00% 0.00% 0.00% 0.00% NS 0.00% 0.00% 0.00% 0.00%
POI congestion Benchmark Aircel Airtel BSNL Idea MTS Reliance CDMA Reliance GSM TATA CDMA TATA GSM Vodafone
Total number of working POIs 50 31 79 102 40 NS 29 42 30 45
No. of POIs not meeting benchmark 0 0 0 0 0 NS 0 0 0 0
Total Capacity of all POIs (A) - in erlangs
81986 94616 52656 76641 35319 NS 19024 20070 12084 221433
Traffic served for all POIs (B)- in erlangs
16513 24636 11478 21557 6829 NS 6546 3892 2100 68069
POI congestion ≤ 0.5% 0.00% 0.00% 0.00% 0.00% 0.00% NS 0.00% 0.00% 0.00% 0.00%
Audit Results for POI Congestion- PMR data
Live Measurement Results for POI Congestion- 3 Day data
Data Source: Network Operations Center (NOC) of the operators

TRAI Audit Wireless Report-Kolkata Circle JAS Quarter-2016
149
11.6 ADDITIONAL NETWORK RELATED PARAMETERS
Traffic in Erlang Aircel Airtel BSNL Idea MTS Reliance CDMA Reliance GSM TATA CDMA TATA GSM Vodafone
Eqipped capacity of the network 103866 109877 136000 68503 50400 NS 88000 80688 98432 152699
Total taffic handled in erlang during TCBH
58504 97017 50810 58488 6983 NS 50708 10797 39291 113299
Total no. of customers served (as per VLR)
2204537 4632595 813115 2464950 239796 NS 3965842 186096 1958167 5014866
Audit Results for Total Traffic Handled in Erlang
Data Source: Network Operations Center (NOC) of the operators

TRAI Audit Wireless Report-Kolkata Circle JAS Quarter-2016
150
12 ANNEXURE – CONSOLIDATED-3G
12.1 NETWORK AVAILABILITY
Benchmark Aircel 3G Airtel 3G BSNL 3G Idea 3G Reliance 3G Vodafone 3G
(Number of Node Bs in the network in the licensed service area
5605 7569 2415 5991 4077 7974
Sum of downtime (i.e. total outage time) of Node Bs
3164 36 22660 6786 7777 1904
Node Bs downtime (not available for service) ≤ 2% 0.08% 0.00% 1.26% 0.15% 0.26% 0.03%
Number of Node Bs having accumulated downtime of >24 hours in a month
8 0 47 13 73 3
Worst affected Node Bs due to downtime ≤ 2% 0.14% 0.00% 1.95% 0.22% 1.79% 0.04%
Benchmark Aircel 3G Airtel 3G BSNL 3G Idea 3G Reliance 3G Vodafone 3G
(Number of Node Bs in the network in the licensed service area
1868 2545 835 1997 1375 2679
Sum of downtime (i.e. total outage time) of Node Bs
154 0 380 259 1159 44
Node Bs downtime (not available for service) ≤ 2% 0.11% 0.00% 0.63% 0.18% 1.17% 0.02%
Number of Node Bs having accumulated downtime of >24 hours in a month
1 0 2 4 0 0
Worst affected Node Bs due to downtime ≤ 2% 0.05% 0.00% 0.24% 0.20% 0.00% 0.00%
1. Network Availability
Audit Results for Network Availability- PMR data
Live Measurement Results for Network Availability- 3 Day live data
Data Source: Operations and Maintenance Center (OMC) of the operators

TRAI Audit Wireless Report-Kolkata Circle JAS Quarter-2016
151
12.2 CONNECTION ESTABLISHMENT (ACCESSIBILITY)
Benchmark Aircel 3G Airtel 3G BSNL 3G Idea 3G Reliance 3G Vodafone 3G
CSSR ≥ 95% 99.61% 99.61% 96.24% 99.91% 99.96% 100.00%
RRC Congestion ≤ 1% 0.21% 0.00% 0.60% 0.00% 0.03% 0.00%
Circuit Switched RAB Congestion ≤ 2% 0.04% 0.00% 0.74% 0.00% 0.01% 0.00%
Benchmark Aircel 3G Airtel 3G BSNL 3G Idea 3G Reliance 3G Vodafone 3G
CSSR ≥ 95% 99.56% 99.59% 95.86% 99.90% 100.00% 100.00%
RRC Congestion ≤ 1% 0.21% 0.00% 0.36% 0.00% 0.01% 0.00%
Circuit Switched RAB Congestion ≤ 2% 0.03% 0.00% 0.71% 0.00% 0.00% 0.01%
CSSR Benchmark Aircel 3G Airtel 3G BSNL 3G Idea 3G Reliance 3G Vodafone 3G
Total number of RRC attempts (A) 0 0 0 0 NP 0
Total number of RRC established (B) 0 0 0 0 NP 0
Call setup success rate (B/A*100) ≥ 95% NA NA NA NA NP NA
%age blocked calls NA NA NA NA NP NA
Audit Results for CSSR, RRC Congestion and Circuit Switched RAB Congestion- PMR data
Live measurement results for CSSR, RRC Congestion and Circuit Switched RAB Congestion- 3 Day Data
Drive test results for CSSR (Average of three drive tests) and blocked calls- Drive Test Data
Data Source: Network Operations Center (NOC) of the operators and Data Source: Drive test reports submitted by operators to auditors

TRAI Audit Wireless Report-Kolkata Circle JAS Quarter-2016
152
12.3 CONNECTION MAINTENANCE (RETAINABILITY)
Benchmark Aircel 3G Airtel 3G BSNL 3G Idea 3G Reliance 3G Vodafone 3G
Total calls successfully established (A) (Number of voice RAB normally released)
35655998 NDR 221927103 24159608 23260367 104442805
Total calls dropped after establishment (B) (Number of voice RAB abnormally released)
101126 NDR 3330031 43931 10480 279891
Call drop rate (B/A*100) ≤ 2% 0.28% 0.34% 1.50% 0.18% 0.05% 0.27%
Total no. of cells in the licensed service area (B) 16788 23044 5902 18226 12020 23617
No. of affected cells having CSV call drop rate >3% during (CBBH) in a month (A)
490 429 170 17 19 539
Worst affected cells having more than 3% Circuit switched voice drop rate (A/B*100)
≤ 3% 2.92% 1.86% 2.88% 0.09% 0.16% 2.28%
Benchmark Aircel 3G Airtel 3G BSNL 3G Idea 3G Reliance 3G Vodafone 3G
Total calls successfully established (A) (Number of voice RAB normally released)
15216006 2478162 2575225 11146709 9461966 55319706
Total calls dropped after establishment (B) (Number of voice RAB abnormally released)
45651 6704 14454 18368 3763 146121
Call drop rate (B/A*100) ≤ 2% 0.30% 0.30% 0.56% 0.16% 0.04% 0.26%
Total no. of cells in the licensed service area (B) 5595 7752 2462 6077 4052 7931
No. of affected cells having CSV call drop rate >3% during (CBBH) in a month (A)
155 150 20 4 5 187
Worst affected cells having more than 3% Circuit switched voice drop rate (A/B*100)
≤ 3% 2.77% 1.93% 0.81% 0.07% 0.12% 2.36%
Call drop rate Benchmark Aircel 3G Airtel 3G BSNL 3G Idea 3G Reliance 3G Vodafone 3G
Total calls successfully established (A) (Number of voice RAB normally released)
0 0 0 0 NP 0
Total calls dropped after establishment (B) (Number of voice RAB abnormally released)
0 0 0 0 NP 0
Call drop rate (B/A*100) ≤ 2% NA NA NA NA NP NA
Drive test results for Call drop rate (Average of three drive tests) - Drive Test Data
Audit Results for Call drop rate and Worst affected cells having more than 3% Circuit switched voice drop rate -PMR data
Live measurement results for Call drop rate and Worst affected cells having more than 3% Circuit switched voice drop rate - 3 Day data
Data Source: Network Operations Center (NOC) of the operators and Drive test reports submitted by operators to auditors

TRAI Audit Wireless Report-Kolkata Circle JAS Quarter-2016
153
12.4 VOICE QUALITY
Voice quality Benchmark Aircel 3G Airtel 3G BSNL 3G Idea 3G Reliance 3G Vodafone 3G
Total Transport Blocks InUplink downlink After Selection Combining Speech-10Sec
127979620231 0 18000 82740201500 NA 284255123369
Faulty Transport Blocks InUplink downlink After Selection Combining Speech-10Sec
1744925913 0 34 173059994 NA 3180847321
%Circuit Switch Voice Quality(CSV quality) (B/A*100)
≥ 95% 98.64% 99.24% 99.81% 99.79% 99.89% 98.88%
Voice quality Benchmark Aircel 3G Airtel 3G BSNL 3G Idea 3G Reliance 3G Vodafone 3G
Total Transport Blocks InUplink downlink After Selection Combining Speech-10Sec
66044858004 NA 600 36626282500 NA 144414304782
Faulty Transport Blocks InUplink downlink After Selection Combining Speech-10Sec
1004415705 NA 591 81514119 NA 1571398698
%Circuit Switch Voice Quality(CSV quality) (B/A*100)
≥ 95% 98.48% 99.73% 98.50% 99.87% 99.89% 98.91%
Voice quality Benchmark Aircel 3G Airtel 3G BSNL 3G Idea 3G Reliance 3G Vodafone 3G
Total Transport Blocks InUplink downlink After Selection Combining Speech-10Sec
0 0 0 0 NP 0
Faulty Transport Blocks InUplink downlink After Selection Combining Speech-10Sec
0 0 0 0 NP 0
%Circuit Switch Voice Quality(CSV quality) (B/A*100)
≥ 95% NA NA NA NA NP NA
Audit Results for Voice quality -PMR Data
Live measurement results for Voice quality-3 Day data
Drive test results for Voice quality (Average of three drive tests) - DT data
Data Source: Network Operations Center (NOC) of the operators and Drive test reports submitted by operators to auditors

TRAI Audit Wireless Report-Kolkata Circle JAS Quarter-2016
154
12.5 POI CONGESTION
POI congestion Benchmark Aircel 3G Airtel 3G BSNL 3G Idea 3G Reliance 3G Vodafone 3G
Total number of working POIs 50 31 79 101 29 45
No. of POIs not meeting benchmark 0 0 2 0 0 0
Total Capacity of all POIs (A) - in erlangs 245277 252664 856758 229568 42778 649227
Traffic served for all POIs (B)- in erlangs 90973 124451 32312 123941 26322 364511
POI congestion ≤ 0.5% 0.00% 0.00% 0.00% 0.00% 0.00% 0.00%
POI congestion Benchmark Aircel 3G Airtel 3G BSNL 3G Idea 3G Reliance 3G Vodafone 3G
Total number of working POIs 50 31 79 102 29 45
No. of POIs not meeting benchmark 0 0 0 0 0 0
Total Capacity of all POIs (A) - in erlangs 81986 94616 52656 76641 19024 221433
Traffic served for all POIs (B)- in erlangs 16513 24636 11478 21557 6546 68069
POI congestion ≤ 0.5% 0.00% 0.00% 0.00% 0.00% 0.00% 0.00%
Audit Results for POI Congestion- PMR data
Live Measurement Results for POI Congestion- 3 Day data
Data Source: Network Operations Center (NOC) of the operators

TRAI Audit Wireless Report-Kolkata Circle JAS Quarter-2016
155
12.6 ADDITIONAL NETWORK RELATED PARAMETERS
Traffic in Erlang Aircel 3G Airtel 3G BSNL 3G Idea 3G Reliance 3G Vodafone 3G
Eqipped capacity of the network 0 NA 24620 0 NA NA
Total taffic handled in erlang during TCBH 4781 35382 10832 8119 NA 44402
Total no. of customers served (as per VLR) 451462 627600 70188 0 NA 889204
13 ANNEXURE – CUSTOMER SERVICES
13.1 METERING AND BILLING CREDIBILITY

TRAI Audit Wireless Report-Kolkata Circle JAS Quarter-2016
156
Total bills generated during the period 17528 1928462 232731 223126 69725 NS 228707 26476 85007 3641923
Total number of bills disputed 1 1140 43 1387 66 NS 192 1 0 3630
Total number of valid billing complaints 0 271 31 200 4 NS 131 1 0 1984
Total complaints considered invalid 1 869 12 1187 62 NS 61 0 0 1646
Percentage bills disputed (Avg of 3 billing cycles)
≤ 0.1% 0.01% 0.06% 0.02% 0.62% 0.10% NS 0.08% 0.00% 0.00% 0.10%
Total bills generated during the first billing cycle
6166 643752 75235 70195 24796 NS 81474 8936 30422 1198745
Total number of bills disputed in first billing cycle
1 251 19 391 5 NS 72 0 0 1224
Total number of valid billing complaints (billing cycle 1)
0 51 15 65 2 NS 49 0 0 651
Total complaints considered invalid (billing cycle 1)
1 200 4 326 3 NS 23 0 0 573
Percentage bills disputed (first billing cycle) ≤ 0.1% 0.02% 0.04% 0.03% 0.56% 0.02% NS 0.09% 0.00% 0.00% 0.10%
Total bills generated during the second billing cycle
5868 642355 79070 77550 23190 NS 75805 8788 28020 1214488
Total number of bills disputed in second billing cycle
0 341 7 500 33 NS 67 1 0 1250
Total number of valid billing complaints (billing cycle 2)
0 101 6 71 2 NS 42 1 0 772
Total complaints considered invalid (billing cycle 2)
0 240 1 429 31 NS 25 0 0 478
Percentage bills disputed (second billing cycle)
≤ 0.1% 0.00% 0.05% 0.01% 0.64% 0.14% NS 0.09% 0.01% 0.00% 0.10%
Total bills generated during the third billing cycle
5494 642355 78426 75381 21739 NS 71428 8752 26565 1228690
Total number of bills disputed in third billing cycle
0 548 17 496 28 NS 53 0 0 1156
Total number of valid billing complaints (billing cycle 3)
0 119 10 64 0 NS 40 0 0 561
Total complaints considered invalid (billing cycle 3)
0 429 7 432 28 NS 13 0 0 595
Percentage bills disputed (third billing cycle) ≤ 0.1% 0.00% 0.09% 0.02% 0.66% 0.13% NS 0.07% 0.00% 0.00% 0.09%
March
February
Metering and billing credibility - Postpaid (Avg of 3 billing cycles)
Metering and billing credibility - Postpaid
January

TRAI Audit Wireless Report-Kolkata Circle JAS Quarter-2016
157
Data Source: Billing Center of the operators
Performance prepaid Benchmark Aircel Airtel BSNL Idea MTS Reliance CDMA Reliance GSM TATA CDMA TATA GSM Vodafone
Total number of charging complaints (valid) - sum of 3 months
28 1247 226 619 25 NS 2442 0 0 6392
Total complaints considered invalid (sum of 3 months)
1873 1861 12 2204 13 NS 723 0 0 1012
Total number of charging complaints (sum of 3 months)
1901 3108 238 2823 38 NS 3165 0 0 7404
Total no of customers served (Sum of 3 months)
13070858 12954503 2410647 7329966 356870 NS 11597619 521310 8357529 14401622
Percentage of charging complaints disputed ≤ 0.1% 0.01% 0.02% 0.01% 0.04% 0.01% NS 0.03% 0.00% 0.00% 0.05%
Metering and billing credibility - Prepaid
Data Source: Billing Center of the operators

TRAI Audit Wireless Report-Kolkata Circle JAS Quarter-2016
158
Billing Performance Benchmark Aircel Airtel BSNL Idea MTS Reliance CDMA Reliance GSM TATA CDMA TATA GSM Vodafone
Total number of billing/charging complaints 1902 4248 125 4210 104 NS 3357 1 0 11034
Total number of complaints resolved in favour of customer
28 1518 112 819 29 NS 2573 1 0 8376
Total complaints considered invalid 1874 2730 13 3391 75 NS 784 0 0 2658
Number of complaints resolved in 4 weeks 28 1467 112 819 29 NS 2573 1 0 8376
Percentage complaints resolved within 4 weeks
≥ 98% 100.00% 96.64% 100.00% 100.00% 100.00% NS 100.00% 100.00% NA 100.00%
Number of complaints resolved in 6 weeks 28 1467 112 819 29 NS 2573 1 0 8376
Percentage complaints resolved within 6 weeks
100.00% 100.00% 96.64% 100.00% 100.00% 100.00% NS 100.00% 100.00% NA 100.00%
Total number of complaints where credit/waiver is required
28 1467 52 819 29 NS 2573 1 0 4487
Percentage cases in which credit/waiver was received within 1 week
100% 100% 100% 100% 100% 100% NS 100% 100% 100% 100%
Resolution of billing complaints Benchmark Aircel Airtel BSNL Idea MTS Reliance CDMA Reliance GSM TATA CDMA TATA GSM Vodafone
Total Number of calls made 74 100 52 100 100 NS 100 0 0 100
Number of cases resolved in 4 weeks 72 99 44 98 100 NS 97 0 0 100
Percentage cases resolved in 4 weeks ≥ 98% 97.30% 99.00% 84.62% 98.00% 100.00% NS 97.00% NA NA 100.00%
Number of cases resolved in 6 weeks 74 100 52 100 100 NS 97 0 0 100
Percentage cases resolved in 6 weeks 100.00% 100.00% 100.00% 100.00% 100.00% 100.00% NS 97.00% NA NA 100.00%
Resolution of Billing ComplaintsResolution of billing complaints (Postpaid+Prepaid)-Consolidated
Period of applying credit / waiver
Live calling results for resolution of billing complaints
Data Source: Billing Center of the operators

TRAI Audit Wireless Report-Kolkata Circle JAS Quarter-2016
159
13.2 CUSTOMER CARE
Customer Care Assessment Benchmark Aircel Airtel BSNL Idea MTS Reliance CDMA Reliance GSM TATA CDMA TATA GSM Vodafone
Total number of call attempts to customer care for assistance
7149202 1657553 1563148 4621959 372609 NS 3676962 0 308083 5981582
Number of calls getting connected and answered (electronically)
6905604 1536106 1515541 4546018 371629 NS 3660635 0 303576 5981544
Percentage calls getting connected and answered
≥ 95% 96.59% 92.67% 96.95% 98.36% 99.74% NS 99.56% NA 98.54% 100.00%
Customer Care Assessment Benchmark Aircel Airtel BSNL Idea MTS Reliance CDMA Reliance GSM TATA CDMA TATA GSM Vodafone
Total Number of calls received (3 months) 1785888 1078988 30096 1456525 103885 NS 767500 19716 372975 2224668
Total Number of calls answered within 90 seconds (3 months)
1643481 959878 28902 1445169 100176 NS 724993 19521 363191 2159263
Percentage calls answered within 90 seconds (Avg of 3 months)
≥ 95% 92.03% 88.96% 96.03% 99.22% 96.43% NS 94.46% 99.01% 97.38% 97.06%
Total calls received (Month 1) 627920 371450 10700 454162 40379 NS 267699 6855 129813 719935
Total calls answered within 90 seconds (Month 1)
597153 328679 10188 449927 38515 NS 258439 6796 126680 713059
% calls answered within 90 seconds (Month 1)
≥ 95% 95.10% 88.49% 95.21% 99.07% 95.38% NS 96.54% 99.14% 97.59% 99.04%
Total calls received (Month 2) 557831 320168 8666 459460 31074 NS 239014 6397 121416 666838
Total calls answered within 90 seconds (Month 2)
508460 306916 8485 456537 30029 NS 231552 6318 117849 638869
% calls answered within 90 seconds (Month 2)
≥ 95% 91.15% 95.86% 97.91% 99.36% 96.64% NS 96.88% 98.77% 97.06% 95.81%
Total calls received (Month 3) 600137 387370 10730 542903 32432 NS 260787 6464 121746 837895
Total calls answered within 90 seconds (Month 3)
537868 324283 10229 538705 31632 NS 235002 6407 118662 807335
% calls answered within 90 seconds (Month 3)
≥ 95% 89.62% 83.71% 95.33% 99.23% 97.53% NS 90.11% 99.12% 97.47% 96.35%
Customer Care Assessment Benchmark Aircel Airtel BSNL Idea MTS Reliance CDMA Reliance GSM TATA CDMA TATA GSM Vodafone
Total number of call attempts to customer care for assistance
100 100 100 82 100 NS 100 86 53 100
Number of calls getting connected and answered (electronically)
100 100 100 82 100 NS 100 86 53 100
Percentage calls getting connected and answered
≥ 95% 100.00% 100.00% 100.00% 100.00% 100.00% NS 100.00% 100.00% 100.00% 100.00%
Customer Care Assessment Benchmark Aircel Airtel BSNL Idea MTS Reliance CDMA Reliance GSM TATA CDMA TATA GSM Vodafone
Total Number of calls received 100 100 100 82 100 NS 100 86 53 100
Total Number of calls getting connected and answered
100 96 99 82 100 NS 100 86 53 100
Live Calling Percentage calls getting connected and answered
≥ 95% 100.00% 96.00% 99.00% 100.00% 100.00% NS 100.00% 100.00% 100.00% 100.00%
Live calling results for customer care (IVR)
Audit results for customer care (IVR and voice-to-Voice) -Consolidated
Audit results for customer care (voice-to-Voice)- (Avg of 3 months)-Consolidated
January
February
March
Live calling results for customer care (Voice to Voice)

TRAI Audit Wireless Report-Kolkata Circle JAS Quarter-2016
160
13.3 TERMINATION / CLOSURE OF SERVICE
Termination Benchmark Aircel Airtel BSNL Idea MTS Reliance CDMA Reliance GSM TATA CDMA TATA GSM Vodafone
Total number of closure request 273 8863 3429 4020 2608 NS 2031 717 1437 26946
Number of requests attended within 7 days 273 8863 3429 3789 2608 NS 2031 717 1437 26946
Percentage cases in which termination done within 7 days
100.00% 100.00% 100.00% 100.00% 94.25% 100.00% NS 100.00% 100.00% 100.00% 100.00%
Audit results for termination / closure of service-Consolidated
Data Source: Customer Service Center of the operators
13.4 TIME TAKEN FOR REFUND OF DEPOSITS AFTER CLOSURE
Refund Benchmark Aircel Airtel BSNL Idea MTS Reliance CDMA Reliance GSM TATA CDMA TATA GSM Vodafone
Total number of cases requiring refund of deposits
433 711 99 1828 NA NS 1540 116 73 11643
Total number of cases where refund was made within 60 days
433 711 99 1828 NA NS 1061 116 73 11643
Percentage cases in which refund was receive within 60 days
100.00% 100.00% 100.00% 100.00% 100.00% NA NS 68.90% 100.00% 100.00% 100.00%
Audit results for refund of deposits-Consolidated
Data Source: Billing Center of the operators

TRAI Audit Wireless Report-Kolkata Circle JAS Quarter-2016
161
13.5 LIVE CALLING RESULTS FOR RESOLUTION OF SERVICE REQUESTS
Resolution of service requests Aircel Airtel BSNL Idea MTS Reliance CDMA Reliance GSM TATA CDMA TATA GSM Vodafone
Total Number of calls made 92 100 94 100 48 NS 100 100 78 100
Number of cases resolved to satisfaction 92 95 64 99 47 NS 95 95 46 100
Percentage cases resolved in four weeks 100.00% 95.00% 68.09% 99.00% 97.92% NS 95.00% 95.00% 58.97% 100.00%
Live calling results for resolution of service requests
Data Source: Live calls made by auditors from operator’s network
13.6 LIVE CALLING RESULTS FOR LEVEL 1 SERVICES
Level 1 services Aircel Airtel BSNL Idea MTS Reliance CDMA Reliance GSM TATA CDMA TATA GSM Vodafone
Total no. of calls made 252 252 258 246 258 NS 258 NDR 258 258
Calls answered 72 120 180 126 120 NS 138 NDR 114 180
% of calls connected ≥ 95% 28.57% 47.62% 69.77% 51.22% 46.51% NS 53.49% NA 44.19% 69.77%
Live calling for level 1 services

162
13.7 LEVEL 1 SERVICE CALLS MADE
All the numbers given in mandatory list in Section 2.4.2.4.1 were tested. The following table provides the numbers that are activated for each operator. A tick () for
an operator signifies that the number was active for the operator.
Live calls were made to the active numbers to test the calls answered. The details of the same have been given below for each operator.
Aircel
Level 1 Number Type of Service WorkingNot Working
Calls MadeCalls Connected
Calls Made( PROPORTIONATE)
Calls Connected ( PROPORTIONATE)
100 Police Y 40 40 6 6101 Fire Y 22 22 6 6102 Ambulance Y 18 18 6 6104 Health Information Helpline N 0 0108 Emergency and Disaster Management Helpline Y 27 27 6 6138 All India Helpine for Passangers N 6 0149 Public Road Transport Utility Service N 0 0181 Chief Minister Helpline N 0 0182 Indian Railway Security Helpline N 6 01033 Road Accident Management Service N 0 0
1037Public Grievance Cell DoT Hq as 'Telecom Consumer Grievance Redressal Helpline'
N 6 0
1056 Emergency Medical Services N 0 0106X State of the Art Hospitals N 6 01063 Public Grievance Cell DoT Hq N 6 01064 Anti Corruption Helpline N 0 01070 Relief Commission for Natural Calamities Y 14 14 6 61071 Air Accident Helpline Y 26 26 6 61072 Rail Accident Helpline N 0 01073 Road Accident Helpline Y 31 31 6 6

TRAI Audit Wireless Report-Kolkata Circle JAS Quarter-2016
163
1077 Control Room for District Collector N 0 01090 Call Alart ( Crime Branch) N 6 01091 Women Helpline N 6 01097 National AIDS Helpline to NACO N 0 01099 Central Accident and Trauma Services (CATS) N 0 010580 Educationa & Vocational Guidance and Counselling N 0 010589 Mother and Child Tracking ( MCTH) N 0 010740 Central Pollution Control Board N 0 010741 Pollution Control Board N 0 01511 Police Related Service for all Metro Railway Project N 6 01512 Prevention of Crime in Railway Y 16 16 6 61514 National Career Service(NCS) N 6 015100 Free Legal Service Helpline N 6 0155304 Municipal Corporations N 6 0155214 Labour Helpline N 6 01903 Sashastra Seema Bal (SSB) N 6 01909 National Do Not Call Registry Y 91 91 6 61912 Complaint of Electricity N 6 01916 Drinking Water Supply N 6 01950 Election Commission of India N 6 01965 Vigilance as Anti Corruption Helpline N 6 01323 IRCTC Railway e-Catering Services Y 6 6 6 6155350 Aviators Air Rescue Pvt. Ltd N 6 0155256 Indian Airforce (IAF) N 6 014444 Cash Kukt Bharat Abhiyan Helpline N 6 01906 Petroleum Industry Emergency Helpline N 6 01517 Child Helpline N 6 01533 NDMC Citizen Facilitation Service to NDMC N 6 01095 Traffic Control Helpline N 6 01079 Disaster Management Service N 0 0

TRAI Audit Wireless Report-Kolkata Circle JAS Quarter-2016
164
155226 Indian Airforce (IAF) Helpline N 6 010582 Women and Child Trakicking Helpline N 6 0155225 CISF Helpline N 6 01955 IVRS system on Call drop N 0 01922 Hon'l Prime Minister Mann ki Baat Y 6 6 6 614404 National Consumer Helpline N 6 01800-313-1947 UIDAI Y 43 43 6 6155231 Helpline for Women Workers N 6 014441 National Informatics Centre (NIC) N 6 0Airtel
Level 1 Number Type of Service WorkingNot Working
Calls MadeCalls Connected
Calls Made( PROPORTIONATE)
Calls Connected ( PROPORTIONATE)
100 Police Y 5 5 6 6101 Fire Y 5 5 6 6102 Ambulance Y 5 5 6 6104 Health Information Helpline N 0 0108 Emergency and Disaster Management Helpline N 6 0138 All India Helpine for Passangers Y 5 5 6 6149 Public Road Transport Utility Service N 0 0181 Chief Minister Helpline Y 5 5 0 0182 Indian Railway Security Helpline Y 5 5 6 61033 Road Accident Management Service N 0 0
1037Public Grievance Cell DoT Hq as 'Telecom Consumer Grievance Redressal Helpline'
N 6 0
1056 Emergency Medical Services N 0 0106X State of the Art Hospitals N 6 01063 Public Grievance Cell DoT Hq N 6 01064 Anti Corruption Helpline N 0 01070 Relief Commission for Natural Calamities Y 5 5 6 61071 Air Accident Helpline Y 5 5 6 6

TRAI Audit Wireless Report-Kolkata Circle JAS Quarter-2016
165
1072 Rail Accident Helpline Y 5 5 0 01073 Road Accident Helpline Y 5 5 6 61077 Control Room for District Collector N 0 01090 Call Alart ( Crime Branch) Y 5 5 6 61091 Women Helpline N 6 01097 National AIDS Helpline to NACO Y 5 5 0 01099 Central Accident and Trauma Services (CATS) N 0 010580 Educationa & Vocational Guidance and Counselling N 0 010589 Mother and Child Tracking ( MCTH) N 0 010740 Central Pollution Control Board N 0 010741 Pollution Control Board N 0 01511 Police Related Service for all Metro Railway Project N 6 01512 Prevention of Crime in Railway N 6 01514 National Career Service(NCS) N 6 015100 Free Legal Service Helpline N 6 0155304 Municipal Corporations N 6 0155214 Labour Helpline N 6 01903 Sashastra Seema Bal (SSB) Y 5 5 6 61909 National Do Not Call Registry Y 5 5 6 61912 Complaint of Electricity Y 5 5 6 61916 Drinking Water Supply N 6 01950 Election Commission of India Y 5 5 6 61965 Vigilance as Anti Corruption Helpline Y 5 5 6 61323 IRCTC Railway e-Catering Services Y 5 5 6 6155350 Aviators Air Rescue Pvt. Ltd Y 5 5 6 6155256 Indian Airforce (IAF) N 6 014444 Cash Kukt Bharat Abhiyan Helpline N 6 01906 Petroleum Industry Emergency Helpline Y 5 5 6 61517 Child Helpline N 6 01533 NDMC Citizen Facilitation Service to NDMC N 6 0

TRAI Audit Wireless Report-Kolkata Circle JAS Quarter-2016
166
1095 Traffic Control Helpline N 6 01079 Disaster Management Service N 0 0155226 Indian Airforce (IAF) Helpline Y 5 5 6 610582 Women and Child Trakicking Helpline N 6 0155225 CISF Helpline N 6 01955 IVRS system on Call drop N 0 01922 Hon'l Prime Minister Mann ki Baat N 6 014404 National Consumer Helpline Y 5 5 6 61800-313-1947 UIDAI Y 5 5 6 6155231 Helpline for Women Workers N 6 014441 National Informatics Centre (NIC) N 6 0BSNL
Level 1 Number Type of Service WorkingNot Working
Calls MadeCalls Connected
Calls Made( PROPORTIONATE)
Calls Connected ( PROPORTIONATE)
100 Police Y 6 6 6 6101 Fire Y 6 6 6 6102 Ambulance Y 6 6 6 6104 Health Information Helpline N 0 0108 Emergency and Disaster Management Helpline N 6 0138 All India Helpine for Passangers Y 6 5 6 6149 Public Road Transport Utility Service Y 6 5 0 0181 Chief Minister Helpline Y 6 4 6 6182 Indian Railway Security Helpline Y 6 6 6 61033 Road Accident Management Service N 0 0
1037Public Grievance Cell DoT Hq as 'Telecom Consumer Grievance Redressal Helpline'
N 6 0
1056 Emergency Medical Services N 0 0106X State of the Art Hospitals N 6 01063 Public Grievance Cell DoT Hq N 6 01064 Anti Corruption Helpline N 0 0

TRAI Audit Wireless Report-Kolkata Circle JAS Quarter-2016
167
1070 Relief Commission for Natural Calamities Y 6 1 6 61071 Air Accident Helpline Y 6 6 6 61072 Rail Accident Helpline N 0 01073 Road Accident Helpline Y 6 6 6 61077 Control Room for District Collector N 0 01090 Call Alart ( Crime Branch) Y 3 3 6 61091 Women Helpline Y 5 2 6 61097 National AIDS Helpline to NACO N 0 01099 Central Accident and Trauma Services (CATS) N 0 010580 Educationa & Vocational Guidance and Counselling N 0 010589 Mother and Child Tracking ( MCTH) N 0 010740 Central Pollution Control Board N 0 010741 Pollution Control Board N 0 01511 Police Related Service for all Metro Railway Project Y 6 6 6 61512 Prevention of Crime in Railway Y 6 6 6 61514 National Career Service(NCS) Y 6 5 6 615100 Free Legal Service Helpline N 6 0155304 Municipal Corporations Y 6 4 6 6155214 Labour Helpline Y 6 5 6 61903 Sashastra Seema Bal (SSB) N 6 01909 National Do Not Call Registry Y 6 6 6 61912 Complaint of Electricity Y 6 6 6 61916 Drinking Water Supply N 6 01950 Election Commission of India Y 6 6 6 61965 Vigilance as Anti Corruption Helpline N 6 01323 IRCTC Railway e-Catering Services Y 6 6 6 6155350 Aviators Air Rescue Pvt. Ltd N 6 0155256 Indian Airforce (IAF) Y 6 4 6 614444 Cash Kukt Bharat Abhiyan Helpline Y 4 2 6 61906 Petroleum Industry Emergency Helpline Y 5 3 6 6

TRAI Audit Wireless Report-Kolkata Circle JAS Quarter-2016
168
1517 Child Helpline Y 6 6 6 61533 NDMC Citizen Facilitation Service to NDMC N 6 01095 Traffic Control Helpline Y 5 5 6 61079 Disaster Management Service N 0 0155226 Indian Airforce (IAF) Helpline Y 5 4 6 610582 Women and Child Trakicking Helpline N 6 0155225 CISF Helpline Y 2 2 6 61955 IVRS system on Call drop N 0 01922 Hon'l Prime Minister Mann ki Baat N 6 014404 National Consumer Helpline N 6 01800-313-1947 UIDAI Y 5 5 6 6155231 Helpline for Women Workers Y 5 5 6 614441 National Informatics Centre (NIC) Y 3 3 6 6Idea
Level 1 Number Type of Service WorkingNot Working
Calls MadeCalls Connected
Calls Made( PROPORTIONATE)
Calls Connected ( PROPORTIONATE)
100 Police Y 13 13 6 6101 Fire Y 13 13 6 6102 Ambulance N 6 0104 Health Information Helpline N 0 0108 Emergency and Disaster Management Helpline N 6 0138 All India Helpine for Passangers Y 13 13 6 6149 Public Road Transport Utility Service N 0 0181 Chief Minister Helpline N 6 0182 Indian Railway Security Helpline Y 13 13 6 61033 Road Accident Management Service N 0 0
1037Public Grievance Cell DoT Hq as 'Telecom Consumer Grievance Redressal Helpline'
N 6 0
1056 Emergency Medical Services N 0 0106X State of the Art Hospitals N 6 0

TRAI Audit Wireless Report-Kolkata Circle JAS Quarter-2016
169
1063 Public Grievance Cell DoT Hq N 6 01064 Anti Corruption Helpline N 0 01070 Relief Commission for Natural Calamities N 6 01071 Air Accident Helpline Y 13 13 6 61072 Rail Accident Helpline N 0 01073 Road Accident Helpline Y 13 13 6 61077 Control Room for District Collector N 0 01090 Call Alart ( Crime Branch) Y 13 13 6 61091 Women Helpline Y 13 13 6 61097 National AIDS Helpline to NACO Y 13 13 0 01099 Central Accident and Trauma Services (CATS) N 0 010580 Educationa & Vocational Guidance and Counselling N 0 010589 Mother and Child Tracking ( MCTH) N 0 010740 Central Pollution Control Board N 0 010741 Pollution Control Board N 0 01511 Police Related Service for all Metro Railway Project N 6 01512 Prevention of Crime in Railway Y 13 13 6 61514 National Career Service(NCS) N 6 015100 Free Legal Service Helpline N 6 0155304 Municipal Corporations N 6 0155214 Labour Helpline N 6 01903 Sashastra Seema Bal (SSB) Y 13 13 6 61909 National Do Not Call Registry Y 13 13 6 61912 Complaint of Electricity Y 13 13 6 61916 Drinking Water Supply N 6 01950 Election Commission of India Y 13 13 6 61965 Vigilance as Anti Corruption Helpline N 6 01323 IRCTC Railway e-Catering Services Y 13 13 6 6155350 Aviators Air Rescue Pvt. Ltd Y 13 13 6 6155256 Indian Airforce (IAF) N 6 0

TRAI Audit Wireless Report-Kolkata Circle JAS Quarter-2016
170
14444 Cash Kukt Bharat Abhiyan Helpline N 6 01906 Petroleum Industry Emergency Helpline Y 13 13 6 61517 Child Helpline N 6 01533 NDMC Citizen Facilitation Service to NDMC Y 13 13 6 61095 Traffic Control Helpline N 6 01079 Disaster Management Service N 0 0155226 Indian Airforce (IAF) Helpline Y 13 13 6 610582 Women and Child Trakicking Helpline Y 13 13 6 6155225 CISF Helpline N 6 01955 IVRS system on Call drop N 0 01922 Hon'l Prime Minister Mann ki Baat Y 13 13 6 614404 National Consumer Helpline Y 13 13 6 61800-313-1947 UIDAI Y 14 14 6 6155231 Helpline for Women Workers N 6 014441 National Informatics Centre (NIC) N 6 0MTS
Level 1 Number Type of Service WorkingNot Working
Calls MadeCalls Connected
Calls Made( PROPORTIONATE)
Calls Connected ( PROPORTIONATE)
100 Police Y 15 15 6 6101 Fire Y 13 13 6 6102 Ambulance Y 7 7 6 6104 Health Information Helpline N 0 0108 Emergency and Disaster Management Helpline N 6 0138 All India Helpine for Passangers N 6 0149 Public Road Transport Utility Service N 0 0181 Chief Minister Helpline N 6 0182 Indian Railway Security Helpline Y 22 22 6 61033 Road Accident Management Service N 0 0
1037Public Grievance Cell DoT Hq as 'Telecom Consumer Grievance Redressal Helpline'
N 6 0

TRAI Audit Wireless Report-Kolkata Circle JAS Quarter-2016
171
1056 Emergency Medical Services N 0 0106X State of the Art Hospitals N 6 01063 Public Grievance Cell DoT Hq N 6 01064 Anti Corruption Helpline N 0 01070 Relief Commission for Natural Calamities N 6 01071 Air Accident Helpline Y 5 5 6 61072 Rail Accident Helpline Y 5 5 0 01073 Road Accident Helpline Y 21 21 6 61077 Control Room for District Collector N 0 01090 Call Alart ( Crime Branch) Y 2 2 6 61091 Women Helpline N 6 01097 National AIDS Helpline to NACO N 0 01099 Central Accident and Trauma Services (CATS) N 0 010580 Educationa & Vocational Guidance and Counselling N 0 010589 Mother and Child Tracking ( MCTH) N 0 010740 Central Pollution Control Board N 0 010741 Pollution Control Board N 0 01511 Police Related Service for all Metro Railway Project N 6 01512 Prevention of Crime in Railway Y 19 19 6 61514 National Career Service(NCS) N 6 015100 Free Legal Service Helpline N 6 0155304 Municipal Corporations N 6 0155214 Labour Helpline N 6 01903 Sashastra Seema Bal (SSB) Y 13 13 6 61909 National Do Not Call Registry Y 23 23 6 61912 Complaint of Electricity Y 22 22 6 61916 Drinking Water Supply N 6 01950 Election Commission of India N 6 01965 Vigilance as Anti Corruption Helpline N 6 01323 IRCTC Railway e-Catering Services Y 26 26 6 6

TRAI Audit Wireless Report-Kolkata Circle JAS Quarter-2016
172
155350 Aviators Air Rescue Pvt. Ltd Y 7 7 6 6155256 Indian Airforce (IAF) N 6 014444 Cash Kukt Bharat Abhiyan Helpline N 6 01906 Petroleum Industry Emergency Helpline Y 20 20 6 61517 Child Helpline Y 17 17 6 61533 NDMC Citizen Facilitation Service to NDMC N 6 01095 Traffic Control Helpline N 6 01079 Disaster Management Service N 0 0155226 Indian Airforce (IAF) Helpline Y 4 4 6 610582 Women and Child Trakicking Helpline Y 4 4 6 6155225 CISF Helpline N 6 01955 IVRS system on Call drop N 0 01922 Hon'l Prime Minister Mann ki Baat Y 5 5 6 614404 National Consumer Helpline Y 20 20 6 61800-313-1947 UIDAI Y 25 25 6 6155231 Helpline for Women Workers N 6 014441 National Informatics Centre (NIC) N 6 0Reliance
Level 1 Number Type of Service WorkingNot Working
Calls MadeCalls Connected
Calls Made( PROPORTIONATE)
Calls Connected ( PROPORTIONATE)
100 Police Y 5 5 6 6101 Fire Y 4 4 6 6102 Ambulance N 6 0104 Health Information Helpline N 0 0108 Emergency and Disaster Management Helpline N 6 0138 All India Helpine for Passangers Y 4 4 6 6149 Public Road Transport Utility Service N 0 0181 Chief Minister Helpline N 6 0182 Indian Railway Security Helpline Y 7 7 6 61033 Road Accident Management Service N 0 0

TRAI Audit Wireless Report-Kolkata Circle JAS Quarter-2016
173
1037Public Grievance Cell DoT Hq as 'Telecom Consumer Grievance Redressal Helpline'
N 6 0
1056 Emergency Medical Services N 0 0106X State of the Art Hospitals N 6 01063 Public Grievance Cell DoT Hq N 6 01064 Anti Corruption Helpline N 0 01070 Relief Commission for Natural Calamities Y 7 7 6 61071 Air Accident Helpline Y 7 7 6 61072 Rail Accident Helpline N 0 01073 Road Accident Helpline Y 7 7 6 61077 Control Room for District Collector N 0 01090 Call Alart ( Crime Branch) Y 7 7 6 61091 Women Helpline Y 3 3 6 61097 National AIDS Helpline to NACO Y 7 7 0 01099 Central Accident and Trauma Services (CATS) N 0 010580 Educationa & Vocational Guidance and Counselling N 0 010589 Mother and Child Tracking ( MCTH) N 0 010740 Central Pollution Control Board N 0 010741 Pollution Control Board N 0 01511 Police Related Service for all Metro Railway Project N 6 01512 Prevention of Crime in Railway Y 8 8 6 61514 National Career Service(NCS) N 6 015100 Free Legal Service Helpline N 6 0155304 Municipal Corporations N 6 0155214 Labour Helpline N 6 01903 Sashastra Seema Bal (SSB) Y 7 7 6 61909 National Do Not Call Registry Y 7 7 6 61912 Complaint of Electricity Y 7 7 6 61916 Drinking Water Supply Y 7 7 6 61950 Election Commission of India Y 7 7 6 6
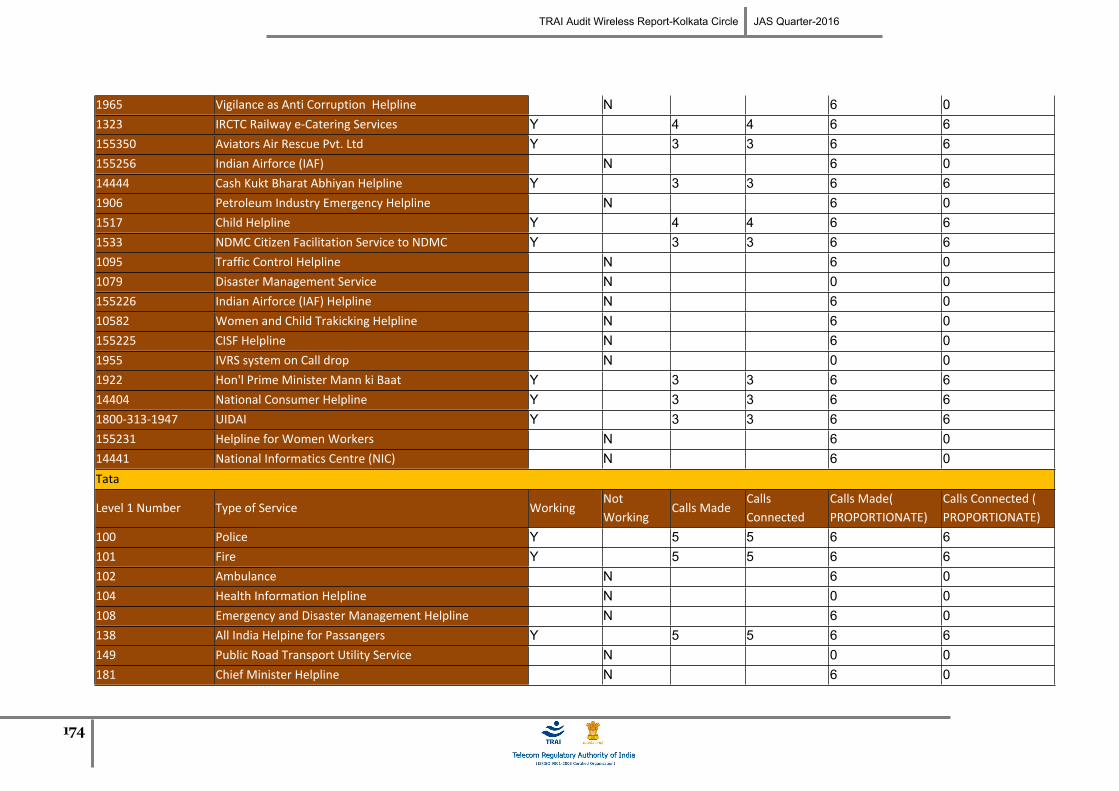
TRAI Audit Wireless Report-Kolkata Circle JAS Quarter-2016
174
1965 Vigilance as Anti Corruption Helpline N 6 01323 IRCTC Railway e-Catering Services Y 4 4 6 6155350 Aviators Air Rescue Pvt. Ltd Y 3 3 6 6155256 Indian Airforce (IAF) N 6 014444 Cash Kukt Bharat Abhiyan Helpline Y 3 3 6 61906 Petroleum Industry Emergency Helpline N 6 01517 Child Helpline Y 4 4 6 61533 NDMC Citizen Facilitation Service to NDMC Y 3 3 6 61095 Traffic Control Helpline N 6 01079 Disaster Management Service N 0 0155226 Indian Airforce (IAF) Helpline N 6 010582 Women and Child Trakicking Helpline N 6 0155225 CISF Helpline N 6 01955 IVRS system on Call drop N 0 01922 Hon'l Prime Minister Mann ki Baat Y 3 3 6 614404 National Consumer Helpline Y 3 3 6 61800-313-1947 UIDAI Y 3 3 6 6155231 Helpline for Women Workers N 6 014441 National Informatics Centre (NIC) N 6 0Tata
Level 1 Number Type of Service WorkingNot Working
Calls MadeCalls Connected
Calls Made( PROPORTIONATE)
Calls Connected ( PROPORTIONATE)
100 Police Y 5 5 6 6101 Fire Y 5 5 6 6102 Ambulance N 6 0104 Health Information Helpline N 0 0108 Emergency and Disaster Management Helpline N 6 0138 All India Helpine for Passangers Y 5 5 6 6149 Public Road Transport Utility Service N 0 0181 Chief Minister Helpline N 6 0

TRAI Audit Wireless Report-Kolkata Circle JAS Quarter-2016
175
182 Indian Railway Security Helpline Y 5 5 6 61033 Road Accident Management Service N 0 0
1037Public Grievance Cell DoT Hq as 'Telecom Consumer Grievance Redressal Helpline'
N 6 0
1056 Emergency Medical Services N 0 0106X State of the Art Hospitals N 6 01063 Public Grievance Cell DoT Hq N 6 01064 Anti Corruption Helpline N 0 01070 Relief Commission for Natural Calamities y 5 5 6 61071 Air Accident Helpline Y 5 5 6 61072 Rail Accident Helpline N 0 01073 Road Accident Helpline Y 5 5 6 61077 Control Room for District Collector N 0 01090 Call Alart ( Crime Branch) N 6 01091 Women Helpline N 6 01097 National AIDS Helpline to NACO Y 5 5 0 01099 Central Accident and Trauma Services (CATS) N 0 010580 Educationa & Vocational Guidance and Counselling N 0 010589 Mother and Child Tracking ( MCTH) N 0 010740 Central Pollution Control Board N 0 010741 Pollution Control Board N 0 01511 Police Related Service for all Metro Railway Project N 6 01512 Prevention of Crime in Railway Y 5 5 6 61514 National Career Service(NCS) N 6 015100 Free Legal Service Helpline Y 5 5 6 6155304 Municipal Corporations N 6 0155214 Labour Helpline N 6 01903 Sashastra Seema Bal (SSB) N 6 01909 National Do Not Call Registry Y 5 5 6 61912 Complaint of Electricity Y 5 5 6 6

TRAI Audit Wireless Report-Kolkata Circle JAS Quarter-2016
176
1916 Drinking Water Supply N 6 01950 Election Commission of India Y 5 0 6 61965 Vigilance as Anti Corruption Helpline N 6 01323 IRCTC Railway e-Catering Services Y 5 5 6 6155350 Aviators Air Rescue Pvt. Ltd Y 5 5 6 6155256 Indian Airforce (IAF) N 6 014444 Cash Kukt Bharat Abhiyan Helpline N 6 01906 Petroleum Industry Emergency Helpline Y 5 5 6 61517 Child Helpline N 6 01533 NDMC Citizen Facilitation Service to NDMC N 6 01095 Traffic Control Helpline N 6 01079 Disaster Management Service N 0 0155226 Indian Airforce (IAF) Helpline Y 5 5 6 610582 Women and Child Trakicking Helpline N 6 0155225 CISF Helpline N 6 01955 IVRS system on Call drop N 0 01922 Hon'l Prime Minister Mann ki Baat Y 5 5 6 614404 National Consumer Helpline Y 5 5 6 61800-313-1947 UIDAI Y 5 5 6 6155231 Helpline for Women Workers N 6 014441 National Informatics Centre (NIC) N 6 0Vodafone
Level 1 Number Type of Service WorkingNot Working
Calls MadeCalls Connected
Calls Made( PROPORTIONATE)
Calls Connected ( PROPORTIONATE)
100 Police Y 8 8 6 6101 Fire Y 9 9 6 6102 Ambulance Y 1 0 6 6104 Health Information Helpline N 0 0108 Emergency and Disaster Management Helpline N 6 0138 All India Helpine for Passangers Y 9 9 6 6

TRAI Audit Wireless Report-Kolkata Circle JAS Quarter-2016
177
149 Public Road Transport Utility Service N 0 0181 Chief Minister Helpline N 6 0182 Indian Railway Security Helpline Y 10 10 6 61033 Road Accident Management Service N 0 0
1037Public Grievance Cell DoT Hq as 'Telecom Consumer Grievance Redressal Helpline'
N 6 0
1056 Emergency Medical Services N 0 0106X State of the Art Hospitals Y 1 1 6 61063 Public Grievance Cell DoT Hq Y 1 0 6 61064 Anti Corruption Helpline N 0 01070 Relief Commission for Natural Calamities Y 1 1 6 61071 Air Accident Helpline Y 1 1 6 61072 Rail Accident Helpline N 0 01073 Road Accident Helpline Y 8 8 6 61077 Control Room for District Collector N 0 01090 Call Alart ( Crime Branch) Y 1 1 6 61091 Women Helpline N 6 01097 National AIDS Helpline to NACO Y 3 3 0 01099 Central Accident and Trauma Services (CATS) N 0 010580 Educationa & Vocational Guidance and Counselling N 0 010589 Mother and Child Tracking ( MCTH) N 0 010740 Central Pollution Control Board N 0 010741 Pollution Control Board N 0 01511 Police Related Service for all Metro Railway Project N 6 01512 Prevention of Crime in Railway Y 2 2 6 61514 National Career Service(NCS) N 6 015100 Free Legal Service Helpline Y 1 1 6 6155304 Municipal Corporations N 6 0155214 Labour Helpline Y 8 8 6 61903 Sashastra Seema Bal (SSB) Y 1 1 6 6

TRAI Audit Wireless Report-Kolkata Circle JAS Quarter-2016
178
1909 National Do Not Call Registry Y 8 8 6 61912 Complaint of Electricity Y 4 4 6 61916 Drinking Water Supply Y 1 0 6 61950 Election Commission of India Y 4 4 6 61965 Vigilance as Anti Corruption Helpline Y 3 3 6 61323 IRCTC Railway e-Catering Services Y 3 3 6 6155350 Aviators Air Rescue Pvt. Ltd Y 1 1 6 6155256 Indian Airforce (IAF) N 6 014444 Cash Kukt Bharat Abhiyan Helpline Y 1 0 6 61906 Petroleum Industry Emergency Helpline Y 4 4 6 61517 Child Helpline Y 6 6 6 61533 NDMC Citizen Facilitation Service to NDMC Y 3 3 6 61095 Traffic Control Helpline N 6 01079 Disaster Management Service N 0 0155226 Indian Airforce (IAF) Helpline Y 5 5 6 610582 Women and Child Trakicking Helpline N 6 0155225 CISF Helpline N 6 01955 IVRS system on Call drop N 0 01922 Hon'l Prime Minister Mann ki Baat Y 1 1 6 614404 National Consumer Helpline 6 01800-313-1947 UIDAI Y 3 3 6 6155231 Helpline for Women Workers N 6 014441 National Informatics Centre (NIC) Y 1 0 6 6
Data Source: Live calls made by auditors from operator’s network

TRAI Audit Wireless Report-Kolkata Circle JAS Quarter-2016
179
13.8 COUNTER DETAILS
Sl No. KPI Formula with Counter Description
1CSSR= (No of established Calls / No of Attempted Calls)%
No of established Calls = ([Assignment Requests]-([Failed Assignments (Signaling Channel)]+[Failed Assignments during MOC on the A Interface (Including Directed Retry)]+[Failed Assignments during MTC on the A Interface (Including Directed Retry)]+[Failed Assignments during Emergency Call on the A Interface (Including Directed Retry)] +[Failed Assignments during Call Re-establishment on the A Interface (Including Directed Retry)]+[Failed Mode Modify Attempts (MOC) (TCHF)]+[Failed Mode Modify Attempts (MTC) (TCHF)]+[Failed Mode Modify Attempts (Emergency Call) (TCHF)]+[Failed Mode Modify Attempts (Call Re-establishment) (TCHF)]+[Failed Mode Modify Attempts (MOC) (TCHH)]+[Failed Mode Modify Attempts (MTC) (TCHH)]+[Failed Mode Modify Attempts (Call Re-establishment) (TCHH)]))/No of Attempted Calls = ([Assignment Requests (Signaling Channel) (TCH)] + [Assignment Requests (Signaling Channel) (SDCCH)] + [Assignment Requests (TCHF Only)] + [Assignment Requests (TCHH Only)] + [Assignment Requests (TCHF Preferred, Channel Type Unchangeable)] + [Assignment Requests (TCHH Preferred, Channel Type Unchangeable)] + [Assignment Requests (TCHF or TCHH, Channel Type Unchangeable)] + [Assignment Requests (TCHF Preferred, Channel Type Changeable)] + [Assignment Requests (TCHH Preferred, Channel Type Changeable)] + [Assignment Requests (TCHF or TCHH, Channel Type Changeable)])
2SDCCH congestion= (SDCCH Failure/SDCCH attempts)%
SDCCH Failure= ([Channel Assignment Failures (All Channels Busy or Channels Unconfigured) in Immediate Assignment Procedure (SDCCH)] + [Failed Internal Intra-Cell Handovers (No Channel Available) (SDCCH)] + [Number of Unsuccessful Incoming Internal Inter-Cell Handovers (No Channel Available) (SDCCH)] + [Failed Incoming External Inter-Cell Handovers (No Channel Available) (SDCCH)])/SDCCH attempts = ([Channel Assignment Requests in Immediate Assignment Procedure (SDCCH)] + [Internal Intra-Cell Handover Requests (SDCCH)] + [Number of Incoming Internal Inter-Cell Handover Requests (SDCCH) (900/850/810-900/850/810)] + [Number of Incoming Internal Inter-Cell Handover Requests (SDCCH) (1800/1900-1800/1900)] + [Number of Incoming Internal Inter-Cell Handover Requests (SDCCH) (900/850/810-1800/1900)] + [Number of Incoming Internal Inter-Cell Handover Requests (SDCCH) (1800/1900-900/850/810)] + [Incoming External Inter-Cell Handover Requests (SDCCH) (900/850/810-900/850/810)] + [Incoming External Inter-Cell Handover Requests (SDCCH) (1800/1900-1800/1900)] + [Incoming External Inter-Cell Handover Requests (SDCCH) (900/850/810-1800/1900)] + [Incoming External Inter-Cell Handover Requests (SDCCH) (1800/1900-900/850/810)])
3 TCH congestion= (TCH Failures /TCH Attempts)%
TCH Failures= ((Failed TCH Seizures due to Busy TCH (Signaling Channel)+([Failed Assignments (First Assignment, No Channel Available in Assignment Procedure)]+[Failed Assignments (First Assignment, No Channel Available in Directed Retry Procedure)]+[Failed Assignments (Reconnection to Old Channels, No Channel Available in Assignment)]+[Failed Assignments (Reconnection to Old Channels, No Channel Available in Directed Retry)])/TCH Attempts = ([Assignment Requests (Signaling Channel) (TCH)] + [Assignment Requests (Signaling Channel) (SDCCH)] + [Assignment Requests (TCHF Only)] + [Assignment Requests (TCHH Only)] + [Assignment Requests (TCHF Preferred, Channel Type Unchangeable)] + [Assignment Requests (TCHH Preferred, Channel Type Unchangeable)] + [Assignment Requests (TCHF or TCHH, Channel Type Unchangeable)] + [Assignment Requests (TCHF Preferred, Channel Type Changeable)] + [Assignment Requests (TCHH Preferred, Channel Type Changeable)] + [Assignment Requests (TCHF or TCHH, Channel Type Changeable)])

TRAI Audit Wireless Report-Kolkata Circle JAS Quarter-2016
180
4
Call Drop Rate= (The total no of dropped calls*100)/Total no of calls successfully established (where traffic channel is allotted)
The total no of dropped calls= ([Call Drops on Radio Interface in Stable State (Traffic Channel)] + [Call Drops on Radio Interface in Handover State (Traffic Channel)] + [Call Drops Due to No MR from MS for a Long Time (Traffic Channel)] + [Call Drops due to Abis Terrestrial Link Failure (Traffic Channel)] + [Call Drops due to Equipment Failure (Traffic Channel)] + [Call Drops due to Forced Handover (Traffic Channel)] + [Call Drops due to local switching Start Failure] + [Call Drops due to Failures to Return to Normal Call from local switching])/Total no of calls successfully established (where traffic channel is allotted) = ([Assignment Requests]-([Failed Assignments (Signaling Channel)]+[Failed Assignments during MOC on the A Interface (Including Directed Retry)]+[Failed Assignments during MTC on the A Interface (Including Directed Retry)]+[Failed Assignments during Emergency Call on the A Interface (Including Directed Retry)] +[Failed Assignments during Call Re-establishment on the A Interface (Including Directed Retry)]+[Failed Mode Modify Attempts (MOC) (TCHF)]+[Failed Mode Modify Attempts (MTC) (TCHF)]+[Failed Mode Modify Attempts (Emergency Call) (TCHF)]+[Failed Mode Modify Attempts (Call Re-establishment) (TCHF)]+[Failed Mode Modify Attempts (MOC) (TCHH)]+[Failed Mode Modify Attempts (MTC) (TCHH)]+[Failed Mode Modify Attempts (Call Re-establishment) (TCHH)])
5
Call Drop Rate= (No of cells having call drop rate >3% during CBBH in a month*100)/Total no of cells in the licensed service area
Above formula with counters being used in CBBH.
6
Connection with good quality voice= (Connection with good quality voice/Total voice samples)%
Connection with good quality voice = ((Number of MRs on Downlink TCHF (Receive Quality Rank 0)+Number of MRs on Downlink TCHF (Receive Quality Rank 1)+Number of MRs on Downlink TCHF (Receive Quality Rank 2)+Number of MRs on Downlink TCHF (Receive Quality Rank 3)+Number of MRs on Downlink TCHF (Receive Quality Rank 4)+Number of MRs on Downlink TCHF (Receive Quality Rank 5)+Number of MRs on Downlink TCHH (Receive Quality Rank 0)+Number of MRs on Downlink TCHH (Receive Quality Rank 1)+Number of MRs on Downlink TCHH (Receive Quality Rank 2)+Number of MRs on Downlink TCHH (Receive Quality Rank 3)+Number of MRs on Downlink TCHH (Receive Quality Rank 4)+Number of MRs on Downlink TCHH (Receive Quality Rank 5)) /Total voice samples= ((Number of MRs on Downlink TCHF (Receive Quality Rank 0)+Number of MRs on Downlink TCHF (Receive Quality Rank 1)+Number of MRs on Downlink TCHF (Receive Quality Rank 2)+Number of MRs on Downlink TCHF (Receive Quality Rank 3)+Number of MRs on Downlink TCHF (Receive Quality Rank 4)+Number of MRs on Downlink TCHF (Receive Quality Rank 5)+Number of MRs on Downlink TCHF (Receive Quality Rank 6)+Number of MRs on Downlink TCHF (Receive Quality Rank 7)+Number of MRs on Downlink TCHH (Receive Quality Rank 0)+:Number of MRs on Downlink TCHH (Receive Quality Rank 1)+Number of MRs on Downlink TCHH (Receive Quality Rank 2)+Number of MRs on Downlink TCHH (Receive Quality Rank 3)+Number of MRs on Downlink TCHH (Receive Quality Rank 4)+Number of MRs on Downlink TCHH (Receive Quality Rank 5)+Number of MRs on Downlink TCHH (Receive Quality Rank 6)+Number of MRs on Downlink TCHH (Receive Quality Rank 7))

TRAI Audit Wireless Report-Kolkata Circle JAS Quarter-2016
181
13.8.1 ERICSSON
Ericsson provides network support to Vodafone, Aircel, BSNL, Reliance CDMA and Reliance GSM in the circle.
Sl No. KPI Ericsson
1 CSSR= (No of established Calls / No of Attempted Calls)% CSSR (No of established Calls / No of Attempted Calls)=(TCASSALL/TASSALL)*100
2 SDCCH congestion= (SDCCH Failure/SDCCH attempts)% SDCCH congestion (SDCCH Failure/SDCCH attempts)% = (CCONGS/CCALLS)*100
3 TCH congestion= (TCH Failures /TCH Attempts)% TCH congestion (TCH Failures /TCH Attempts)%= (CNRELCONG+TNRELCONG)/TASSALL)*100
4
Call Drop Rate= (The total no of dropped calls*100)/Total no of calls successfully established (where traffic channel is allotted)
Call Drop Rate (Total no dropped calls/No of established calls)%= (TNDROP)/TCASSALL*100
5
Call Drop Rate= (No of cells having call drop rate >3% during CBBH in a month*100)/Total no of cells in the licensed service area
Above formula with counters being used in CBBH.
6Connection with good quality voice= (Connection with good quality voice/Total voice samples)%
Connection with good quality voice (Connection with good quality voice samples 0-5 /Total voice samples)= 100 * (QUAL50DL + QUAL40DL + QUAL30DL + QUAL20DL + QUAL10DL + QUAL00DL) / (QUAL70DL + QUAL60DL + QUAL50DL + QUAL40DL + QUAL30DL + QUAL20DL + QUAL10DL + QUAL00DL)
Ericsson CountersCounter Counter Description
TCASSALL Number of assignment complete messages on TCH for all MS classes
TASSALL Number of first assignment attempts on TCH for all MS classes.
CNRELCONG Number of released connections on SDCCH due to TCH or Transcoder (TRA) congestion.
TNRELCONG Number of released TCH signalling connections due to transcoder resource congestion during immediate assignment on TCH
CCONGS Congestion counter for SDCCH. Stepped per congested allocation attempt.

TRAI Audit Wireless Report-Kolkata Circle JAS Quarter-2016
182
CCALLS Channel allocation attempt counter on SDCCH.
TNDROP The total number of dropped TCH Connections.
QUAL00DL Number of quality 0 reported on downlink.
QUAL10DL Number of quality 1 reported on downlink.
QUAL20DL Number of quality 2 reported on downlink.
QUAL30DL Number of quality 3 reported on downlink.
QUAL40DL Number of quality 4 reported on downlink.
QUAL50DL Number of quality 5 reported on downlink.
QUAL60DL Number of quality 6 reported on downlink.
QUAL70DL Number of quality 7 reported on downlink.
13.8.2 NSN (NOKIA SIEMENS NETWORKS)
NSN provides network support to Airtel in the circle.
Sl No.
KPI NSN
1CSSR= (No of established Calls / No of Attempted Calls)%
CSSR= 100-100*((SDCCH_BUSY_ATT)-(TCH_SEIZ_DUE_SDCCH_CON) + (SDCCH_RADIO_FAIL)+(SDCCH_RF_OLD_HO)+(SDCCH_USER_ACT)+(SDCCH_BCSU_RESET)+(SDCCH_NETW_ACT)+(SDCCH_BTS_FAIL)+(SDCCH_LAPD_FAIL)+ (BLCK_8I_NOM)/ {(CH_REQ_MSG_REC)+(PACKET_CH_REQ)}-{(GHOST_CCCH_RES)-(REJ_SEIZ_ATT_DUE_DIST)}
2SDCCH congestion= (SDCCH Failure/SDCCH attempts)%
SDCCH congestion = (sdcch_busy_att - .tch_seiz_due_sdcch_con)/{(CH_REQ_MSG_REC)+(PACKET_CH_REQ)}-{(GHOST_CCCH_RES)-(REJ_SEIZ_ATT_DUE_DIST)}
3TCH congestion= (TCH Failures /TCH Attempts)%
TCH congestion = BLCK_8I_NOM / {(TCH_NORM_SEIZ)+(MSC_I_SDCCH_TCH_AT)+(BSC_I_SDCCH_TCH_AT)}

TRAI Audit Wireless Report-Kolkata Circle JAS Quarter-2016
183
4
Call Drop Rate= (The total no of dropped calls*100)/Total no of calls successfully established (where traffic channel is allotted)
TCH Drop = ( drop_after_tch_assign)-(tch_re_est_release) / {(TCH_NORM_SEIZ)+(MSC_I_SDCCH_TCH_AT)+(BSC_I_SDCCH_TCH_AT)}
5
Call Drop Rate= (No of cells having call drop rate >3% during CBBH in a month*100)/Total no of cells in the licensed service area
Above formula with counters being used in CBBH.
6Connection with good quality voice= (Connection with good quality voice/Total voice samples)%
Connection with good quality voice= (FREQ_DL_QUAL0+FREQ_DL_QUAL1+FREQ_DL_QUAL2+FREQ_DL_QUAL3+FREQ_DL_QUAL4+FREQ_DL_QUAL5) / (FREQ_DL_QUAL0+FREQ_DL_QUAL1+FREQ_DL_QUAL2+FREQ_DL_QUAL3+FREQ_DL_QUAL4+FREQ_DL_QUAL5+FREQ_DL_QUAL6+FREQ_DL_QUAL7)
13.8.3 HUAWEI
Huawei provides network support to Idea, Tata GSM, Tata CDMA and MTS in the circle.
HUAWEISR .NO KPI HUAWEI FORMULA
1
CALL SETUP SUCCES (NUM) [Successful CS IS-95 Orig Call Setups + Successful CS IS-2000 Orig Call Setups + Successful CS IS-95 Term Call Setups + Successful CS IS-2000 Term Call Setups]([1157628567] + [1157628587] + [1157628568] + [1157628588] )
2CALL SETUP SUCCES (DEN) [CS IS-95 Orig Attempts + CS IS-2000 Orig Attempts + CS IS-95 Term Attempts + CS IS-2000 Term Attempts]
([1157628553] + [1157628573] + [1157628554] + [1157628574] )
3CALL SETUP SUCCESS RATE (%) CALL SETUP SUCCES (NUM) / CALL SETUP SUCCES (DEN) * 100\

TRAI Audit Wireless Report-Kolkata Circle JAS Quarter-2016
184
4
CALL DROP RATE (NUM)
[CS IS-95 Call Drops (Too many Erasure frames) + CS IS-2000 Call Drops (Too many Erasure frames) + CS IS-95 Call Drops (No reverse frame received) + CS IS-2000 Call Drops (No reverse frame received) + CS IS-95 Call Drops (Abis interface abnormal) + CS IS-2000 Call Drops (Abis interface abnormal) + CS IS-95 Call Drops (A2 interface abnormal) + CS IS-2000 Call Drops (A2 interface abnormal) + CS IS-95 Call Drops (HHO fail) + CS IS-2000 Call Drops (HHO fail) + CS IS-95 Call Drops (Other causes) + CS IS-2000 Call Drops (Other causes)]([1157628608] + [1157628614] + [1157628609] + [1157628615] + [1157628610] + [1157628616] + [1157628611] + [1157628617] + [1157628612] + [1157628618] + [1157628613] + [1157628619])
5
CALL DROP RATE(DEN)[Successful CS IS-95 Orig Call Setups + Successful CS IS-2000 Orig Call Setups + Successful CS IS-95 Term Call Setups + Successful CS IS-2000 Term Call Setups + CS IS-95 Successful Incoming Hard HOs + CS IS-2000 Successful Incoming Hard HOs] [1157628619]) x 100/([1157628567] + [1157628587] + [1157628568] + [1157628588] + [1157628569] + [1157628589]) ]
6 Call DROP Rate CALL DROP RATE (NUM) / CALL DROP RATE(DEN) * 100\
7
RF BLOCK RATE (NUM){[(TCH Assignment Requests-CS Orig-IS95[Times] + TCH Assignment Requests-CS Orig-IS2000[Times] + TCH Assignment Requests-CS Term-IS95[Times] + TCH Assignment Requests-CS Term-IS2000[Times]) - (Successful TCH Assignments-CS Orig-IS95[Times] + Successful TCH Assignments-CS Orig-IS2000[Times] + Successful TCH Assignments-CS Term-IS95[Times] + Successful TCH Assignments-CS Term-IS2000[Times] )]{[(1157628621 + 1157628628 + 1157628635+ 1157628642)
8
RF BLOCK RATE (DEN) [((TCH Assignment Requests-CS Orig-IS95[Times] + TCH Assignment Requests-CS Orig-IS2000[Times] + TCH Assignment Requests-CS Term-IS95[Times] + TCH Assignment Requests-CS Term-IS2000[Times]))]}[(1157628621 + 1157628628 + 1157628635+ 1157628642)]}
9 RF BLOCK RATE RF BLOCK RATE (NUM) / RF BLOCK RATE (DEN) *10010 Call Quality (RFER) CS Reverse Link Average FER of Carrier[%]

TRAI Audit Wireless Report-Kolkata Circle JAS Quarter-2016
185
13.9 BLOCK SCHEMATIC DIAGRAMS
13.9.1 ERICSSON
Ericsson provides network support to Vodafone, Aircel, BSNL, Reliance CDMA and Reliance GSM in the circle.
Ericsson
Mobile
BTS
BSS
MSC/GMSCHLR
AUC
SIR
OGW
Server
Data to Auditor
OSS/OMCR
Base Transceiver System
Base Station Sub System
7 Days Storage
BTSBTS

TRAI Audit Wireless Report-Kolkata Circle JAS Quarter-2016
186
13.9.2 NSN (NOKIA SIEMENS NETWORKS)
NSN provides network support to Airtel in the circle.
NSN
Mobile
BTS
BSS
MSC/GMSC
HLR
AUC
SIR
OGW
Storage/PM Application
Data to Auditor
OSS: Operating Sub System
Minimum 7 days storage
Base Transition System
Base Station Sub System
Performance Management

187
13.9.3 HUAWEI
Huawei provides network support to Idea, Tata GSM, Tata CDMA and MTS in the circle.
Huawei
7 days data available
Mobile
BTS
BSS
MSC/GMSC
Data to Auditor
OSS/OMCR: Operating Sub
System
Data Processing Server
Base Transition System
Base Station Sub System
Radio Related Reports
BTSBTS
Switch Reports

188
Benchmark Aircel Airtel BSNL Idea MTS Reliance CDMA Reliance GSM TATA CDMA TATA GSM Vodafone
Number of BTSs in the licensed service area 2407 2937 1277 2361 571 NS 1616 590 1779 2785
Sum of downtime of BTSs in a month (in hours) 1696 10 11028 3304 201 NS 18315 395 585 959
BTSs accumulated downtime (not available for service) ≤ 2% 0.10% 0.00% 1.16% 0.19% 0.05% NS 1.52% 0.09% 0.04% 0.05%
Number of BTSs having accumulated downtime >24 hours 2 0 23 7 0 NS 98 0 1 6
Worst affected BTSs due to downtime ≤ 2% 0.08% 0.00% 1.80% 0.30% 0.00% NS 6.06% 0.00% 0.06% 0.22%
Benchmark Aircel Airtel BSNL Idea MTS Reliance CDMA Reliance GSM TATA CDMA TATA GSM Vodafone
Number of BTSs in the licensed service area NA NA NA NA NA NA NA NA NA NA
Sum of downtime of BTSs in a month (in hours) NA NA NA NA NA NA NA NA NA NA
BTSs accumulated downtime (not available for service) ≤ 2% NA NA NA NA NA NS NA NA NA NA
Number of BTSs having accumulated downtime >24 hours NA NA NA NA NA NA NA NA NA NA
Worst affected BTSs due to downtime ≤ 2% NA NA NA NA NA NS NA NA NA NA
1. Network Availability
Audit Results for Network Availability- PMR data-January
Live Measurement Results for Network Availability- 3 Day live data-January
14 ANNEXURE – JANUARY -2G

TRAI Audit Wireless Report-Kolkata Circle JAS Quarter-2016
189
CSSR Benchmark Aircel Airtel BSNL Idea MTS Reliance CDMA Reliance GSM TATA CDMA TATA GSM Vodafone
CSSR ≥ 95% 98.10% 99.60% 99.28% 99.72% 99.90% NS 98.65% 99.24% 99.50% 99.53%
SDCCH/Paging channel congestion ≤ 1% 0.14% 0.03% 0.38% 0.05% NA NS 0.07% NA 0.02% 0.04%
TCH congestion ≤ 2% 0.04% 0.03% 0.08% 0.12% 0.00% NS 0.79% 0.16% 0.01% 0.47%
CSSR Benchmark Aircel Airtel BSNL Idea MTS Reliance CDMA Reliance GSM TATA CDMA TATA GSM Vodafone
CSSR ≥ 95% NA NA NA NA NA NA NA NA NA NA
SDCCH/Paging channel congestion ≤ 1% NA NA NA NA NA NA NA NA NA NA
TCH congestion ≤ 2% NA NA NA NA NA NA NA NA NA NA
CSSR Benchmark Aircel Airtel BSNL Idea MTS Reliance CDMA Reliance GSM TATA CDMA TATA GSM Vodafone
Total number of call attempts NA NA NA NA NA NS NA NA NA NA
Total number of successful calls established NA NA NA NA NA NS NA NA NA NA
CSSR ≥ 95% NA NA NA NA NA NS NA NA NA NA
%age blocked calls NA NA NA NA NA NS NA NA NA NA
Audit Results for CSSR, SDCCH and TCH congestion- PMR data-January
2. Connection Establishment (Accessibility)
Live measurement results for CSSR, SDCCH and TCH congestion- 3 Day Data-January
Drive test results for CSSR (Average of three drive tests) and blocked calls- Drive Test Data-January

TRAI Audit Wireless Report-Kolkata Circle JAS Quarter-2016
190
Call drop rate Benchmark Aircel Airtel BSNL Idea MTS Reliance CDMA Reliance GSM TATA CDMA TATA GSM Vodafone
Total number of calls established 59048283 96217245 34895160 55078512 7079230 NS NA 2943398 46086275 111109144
Total number of calls dropped 359860 616184 344064 155384 34653 NS 49661 9832 186020 806901
Call drop rate ≤ 2% 0.61% 0.64% 0.99% 0.28% 0.49% NS NA 0.33% 0.40% 0.73%
Total number of cells in the network 7214 8727 3561 7096 2195 NS 4847 1968 5288 7237
Total number of cells having more than 3% TCH 180 212 53 13 59 NS 17 58 61 200
Worst affected cells having more than 3% TCH ≤ 3% 2.50% 2.43% 1.49% 0.18% 2.69% NS 0.35% 2.95% 1.15% 2.76%
Call drop rate Benchmark Aircel Airtel BSNL Idea MTS Reliance CDMA Reliance GSM TATA CDMA TATA GSM Vodafone
Total number of calls established NA NA NA NA NA NA NA NA NA NA
Total number of calls dropped NA NA NA NA NA NA NA NA NA NA
Call drop rate ≤ 2% NA NA NA NA NA NS NA NA NA NA
Total number of cells in the network NA NA NA NA NA NA NA NA NA NA
Total number of cells having more than 3% TCH NA NA NA NA NA NA NA NA NA NA
Worst affected cells having more than 3% TCH ≤ 3% NA NA NA NA NA NS NA NA NA NA
Call drop rate Benchmark Aircel Airtel BSNL Idea MTS Reliance CDMA Reliance GSM TATA CDMA TATA GSM Vodafone
Total number of calls established NA NA NA NA NA NS NA NA NA NA
Total number of calls dropped NA NA NA NA NA NS NA NA NA NA
Call drop rate ≤ 2% NA NA NA NA NA NS NA NA NA NA
3. Connection Maintenance (Retainability)
Audit Results for Call drop rate and for number of cells having more than 3% TCH-PMR data-January
Live measurement results for Call drop rate and for number of cells having more than 3% TCH- 3 Day data-January
Drive test results for Call drop rate (Average of three drive tests) - Drive Test Data-January

TRAI Audit Wireless Report-Kolkata Circle JAS Quarter-2016
191
Voice quality Benchmark Aircel Airtel BSNL Idea MTS Reliance CDMA Reliance GSM TATA CDMA TATA GSM Vodafone
Total number of sample calls 12346045311 36847106517 6000 9079185895 68045 NS 7563165869 238950940 6507382856 17934586475
Total number of calls with good voice quality 12108186852 36234071248 5990 8907217615 67804 NS 7488864319 238103011 6425527580 17600022590
%age calls with good voice quality ≥ 95% 98.07% 98.34% 99.83% 98.11% 99.65% NS 99.02% 99.65% 98.74% 98.13%
Voice quality Benchmark Aircel Airtel BSNL Idea MTS Reliance CDMA Reliance GSM TATA CDMA TATA GSM Vodafone
Total number of sample calls NA NA NA NA NA NA NA NA NA NA
Total number of calls with good voice quality NA NA NA NA NA NA NA NA NA NA
%age calls with good voice quality ≥ 95% NA NA NA NA NA NS NA NA NA NA
Voice quality Benchmark Aircel Airtel BSNL Idea MTS Reliance CDMA Reliance GSM TATA CDMA TATA GSM Vodafone
Total number of sample calls NA NA NA NA NA NS NA NA NA NA
Total number of calls with good voice quality NA NA NA NA NA NS NA NA NA NA
%age calls with good voice quality ≥ 95% NA NA NA NA NA NS NA NA NA NA
4. Voice quality
Audit Results for Voice quality -PMR Data-January
Live measurement results for Voice quality-3 Day data-January
Drive test results for Voice quality (Average of three drive tests) - DT data-January

TRAI Audit Wireless Report-Kolkata Circle JAS Quarter-2016
192
POI congestion Benchmark Aircel Airtel BSNL Idea MTS Reliance CDMA Reliance GSM TATA CDMA TATA GSM Vodafone
Total number of working POIs 50 31 79 101 40 NS 29 42 30 45
No. of POIs not meeting benchmark 0 0 0 0 0 NS 0 0 0 0
Total Capacity of all POIs (A) - in erlangs 81658 82245 402051 77146 35731 NS 11877 21516 13617 210980
Traffic served for all POIs (B)- in erlangs 30106 42385 10701 39067 6857 NS 9454 7126 5143 115295
POI congestion ≤ 0.5% 0.00% 0.00% 0.00% 0.00% 0.00% NS 0.00% 0.00% 0.00% 0.00%
POI congestion Benchmark Aircel Airtel BSNL Idea MTS Reliance CDMA Reliance GSM TATA CDMA TATA GSM Vodafone
Total number of working POIs NA NA NA NA NA NA NA NA NA NA
No. of POIs not meeting benchmark NA NA NA NA NA NA NA NA NA NA
Total Capacity of all POIs (A) - in erlangs NA NA NA NA NA NA NA NA NA NA
Traffic served for all POIs (B)- in erlangs NA NA NA NA NA NA NA NA NA NA
POI congestion ≤ 0.5% NA NA NA NA NA NA NA NA NA NA
Live Measurement Results for POI Congestion- 3 Day data-January
Audit Results for POI Congestion- PMR data-January
5. POI Congestion

TRAI Audit Wireless Report-Kolkata Circle JAS Quarter-2016
193
15 ANNEXURE – FEBRUARY-2G
Benchmark Aircel Airtel BSNL Idea MTS Reliance CDMA Reliance GSM TATA CDMA TATA GSM Vodafone
Number of BTSs in the licensed service area
2400 2942 1280 2361 571 NS 1616 590 1780 2811
Sum of downtime of BTSs in a month (in hours)
938 99.21 13380 3580 73 NS 23102 130 523 410
BTSs accumulated downtime (not available for service)
≤ 2% 0.06% 0.01% 1.56% 0.23% 0.02% NA 2.13% 0.03% 0.04% 0.02%
Number of BTSs having accumulated downtime >24 hours
4 0 24 8 0 NS 165 0 0 1
Worst affected BTSs due to downtime ≤ 2% 0.17% 0.00% 1.88% 0.34% 0.00% NS 10.21% 0.00% 0.00% 0.04%
Benchmark Aircel Airtel BSNL Idea MTS Reliance CDMA Reliance GSM TATA CDMA TATA GSM Vodafone
Number of BTSs in the licensed service area
NA NA NA NA NA NS NA NA NA NA
Sum of downtime of BTSs in a month (in hours)
NA NA NA NA NA NS NA NA NA NA
BTSs accumulated downtime (not available for service)
≤ 2% NA NA NA NA NA NS NA NA NA NA
Number of BTSs having accumulated downtime >24 hours
NA NA NA NA NA NS NA NA NA NA
Worst affected BTSs due to downtime ≤ 2% NA NA NA NA NA NS NA NA NA NA
1. Network Availability
Audit Results for Network Availability- PMR data-February
Live Measurement Results for Network Availability- 3 Day live data-February

TRAI Audit Wireless Report-Kolkata Circle JAS Quarter-2016
194
CSSR Benchmark Aircel Airtel BSNL Idea MTS Reliance CDMA Reliance GSM TATA CDMA TATA GSM Vodafone
CSSR ≥ 95% 98.20% 99.67% 99.30% 99.72% 99.90% NS 94.86% 99.41% 99.49% 99.56%
SDCCH/Paging channel congestion ≤ 1% 0.17% 0.05% 0.26% 0.06% NA NS 0.13% NA 0.02% 0.04%
TCH congestion ≤ 2% 0.04% 0.04% 0.39% 0.09% 0.00% NS 0.42% 0.09% 0.02% 0.44%
CSSR Benchmark Aircel Airtel BSNL Idea MTS Reliance CDMA Reliance GSM TATA CDMA TATA GSM Vodafone
CSSR ≥ 95% NA NA NA NA NA NS NA NA NA NA
SDCCH/Paging channel congestion ≤ 1% NA NA NA NA NA NS NA NA NA NA
TCH congestion ≤ 2% NA NA NA NA NA NS NA NA NA NA
CSSR Benchmark Aircel Airtel BSNL Idea MTS Reliance CDMA Reliance GSM TATA CDMA TATA GSM Vodafone
Total number of call attempts NA NA NA NA NA NS NA NA NA NA
Total number of successful calls established
NA NA NA NA NA NS NA NA NA NA
CSSR ≥ 95% NA NA NA NA NA NS NA NA NA NA
%age blocked calls NA NA NA NA NA NS NA NA NA NA
Live measurement results for CSSR, SDCCH and TCH congestion- 3 Day Data-February
Drive test results for CSSR (Average of three drive tests) and blocked calls- Drive Test Data-February
Audit Results for CSSR, SDCCH and TCH congestion- PMR data-February
2. Connection Establishment (Accessibility)

TRAI Audit Wireless Report-Kolkata Circle JAS Quarter-2016
195
Call drop rate Benchmark Aircel Airtel BSNL Idea MTS Reliance CDMA Reliance GSM TATA CDMA TATA GSM Vodafone
Total number of calls established 54563511 93181023 N/A 53495212 6382481 NS NA 3373334 43874413 106502822
Total number of calls dropped 330807 668049 N/A 155044 29767 NS 50569 8677 153182 754580
Call drop rate ≤ 2% 0.61% 0.72% 0.67% 0.29% 0.47% NS NA 0.26% 0.35% 0.71%
Total number of cells in the network 7195 8749 3570 7098 2195 NS 4847 1968 5286 7316
Total number of cells having more than 3% TCH
166 209 102 17 60 NS 20 56 47 202
Worst affected cells having more than 3% TCH
≤ 3% 2.31% 2.39% 2.86% 0.24% 2.73% NS 0.41% 2.85% 0.89% 2.76%
Call drop rate Benchmark Aircel Airtel BSNL Idea MTS Reliance CDMA Reliance GSM TATA CDMA TATA GSM Vodafone
Total number of calls established NA NA NA NA NA NA NA NA NA NA
Total number of calls dropped NA NA NA NA NA NA NA NA NA NA
Call drop rate ≤ 2% NA NA NA NA NA NS NA NA NA NA
Total number of cells in the network NA NA NA NA NA NA NA NA NA NA
Total number of cells having more than 3% TCH
NA NA NA NA NA NA NA NA NA NA
Worst affected cells having more than 3% TCH
≤ 3% NA NA NA NA NA NS NA NA NA NA
Call drop rate Benchmark Aircel Airtel BSNL Idea MTS Reliance CDMA Reliance GSM TATA CDMA TATA GSM Vodafone
Total number of calls established NA NA NA NA NA NS NA NA NA NA
Total number of calls dropped NA NA NA NA NA NS NA NA NA NA
Call drop rate ≤ 2% NA NA NA NA NA NS NA NA NA NA
3. Connection Maintenance (Retainability)
Audit Results for Call drop rate and for number of cells having more than 3% TCH-PMR data-February
Live measurement results for Call drop rate and for number of cells having more than 3% TCH- 3 Day data-February
Drive test results for Call drop rate (Average of three drive tests) - Drive Test Data-February

TRAI Audit Wireless Report-Kolkata Circle JAS Quarter-2016
196
Voice quality Benchmark Aircel Airtel BSNL Idea MTS Reliance CDMA Reliance GSM TATA CDMA TATA GSM Vodafone
Total number of sample calls 11330153932 34628703126 N/A 8432583720 61460 NS 7168584746 233590703 6170427301 16777570766
Total number of calls with good voice quality
11108649621 34048848405 N/A 8268998594 61245 NS 7093974249 233026023 6093559772 16462297390
%age calls with good voice quality ≥ 95% 98.05% 98.33% 99.82% 98.06% 99.65% NS 98.96% 99.76% 98.75% 98.12%
Voice quality Benchmark Aircel Airtel BSNL Idea MTS Reliance CDMA Reliance GSM TATA CDMA TATA GSM Vodafone
Total number of sample calls NA NA NA NA NA NA NA NA NA NA
Total number of calls with good voice quality
NA NA NA NA NA NA NA NA NA NA
%age calls with good voice quality ≥ 95% NA NA NA NA NA NS NA NA NA NA
Voice quality Benchmark Aircel Airtel BSNL Idea MTS Reliance CDMA Reliance GSM TATA CDMA TATA GSM Vodafone
Total number of sample calls NA NA NA NA NA NS NA NA NA NA
Total number of calls with good voice quality
NA NA NA NA NA NS NA NA NA NA
%age calls with good voice quality ≥ 95% NA NA NA NA NA NS NA NA NA NA
4. Voice quality
Audit Results for Voice quality -PMR Data-February
Live measurement results for Voice quality-3 Day data-February
Drive test results for Voice quality (Average of three drive tests) - DT data-February

TRAI Audit Wireless Report-Kolkata Circle JAS Quarter-2016
197
POI congestion Benchmark Aircel Airtel BSNL Idea MTS Reliance CDMA Reliance GSM TATA CDMA TATA GSM Vodafone
Total number of working POIs 50 31 N/A 101 40 NS 29 42 30 45
No. of POIs not meeting benchmark 0 0 0 0 0 NS 0 0 0 0
Total Capacity of all POIs (A) - in erlangs 81768 83299 N/A 76680 35319 NS 11877 20330 13591 218028
Traffic served for all POIs (B)- in erlangs 30297 41052 N/A 41338 6862 NS 9659 7216 5263 122675
POI congestion ≤ 0.5% 0.00% 0.00% 0.00% 0.00% 0.00% NS 0.00% 0.00% 0.00% 0.00%
POI congestion Benchmark Aircel Airtel BSNL Idea MTS Reliance CDMA Reliance GSM TATA CDMA TATA GSM Vodafone
Total number of working POIs NA NA NA NA NA NA NA NA NA NA
No. of POIs not meeting benchmark NA NA NA NA NA NA NA NA NA NA
Total Capacity of all POIs (A) - in erlangs NA NA NA NA NA NA NA NA NA NA
Traffic served for all POIs (B)- in erlangs NA NA NA NA NA NA NA NA NA NA
POI congestion ≤ 0.5% NA NA NA NA NA NA NA NA NA NA
Live Measurement Results for POI Congestion- 3 Day data-February
Audit Results for POI Congestion- PMR data-February
5. POI Congestion

TRAI Audit Wireless Report-Kolkata Circle JAS Quarter-2016
198
16 ANNEXURE – MARCH-2G
Benchmark Aircel Airtel BSNL Idea MTS Reliance CDMA Reliance GSM TATA CDMA TATA GSM Vodafone
Number of BTSs in the licensed service area 2400 2934 1285 2362 571 NS 1616 590 1781 2830
Sum of downtime of BTSs in a month (in hours) 1156 24 16069 4074 297 NS 7105 821 1317 1064
BTSs accumulated downtime (not available for service) ≤ 2% 0.06% 0.00% 1.68% 0.23% 0.07% NA 0.59% 0.19% 0.10% 0.05%
Number of BTSs having accumulated downtime >24 hours 6 0 25 9 0 NS 31 0 4 10
Worst affected BTSs due to downtime ≤ 2% 0.25% 0.00% 1.95% 0.38% 0.00% NS 1.92% 0.00% 0.22% 0.35%
Benchmark Aircel Airtel BSNL Idea MTS Reliance CDMA Reliance GSM TATA CDMA TATA GSM Vodafone
Number of BTSs in the licensed service area 2400 2934 1285 2362 571 NS 1616 590 1781 2830
Sum of downtime of BTSs in a month (in hours) 175 161 616 393 71 NS 983 0 31 83
BTSs accumulated downtime (not available for service) ≤ 2% 0.10% 0.08% 0.67% 0.23% 0.17% NS 0.84% 0.00% 0.02% 0.04%
Number of BTSs having accumulated downtime >24 hours 1 0 3 6 0 NS 0 0 0 2
Worst affected BTSs due to downtime ≤ 2% 0.04% 0.00% 0.23% 0.25% 0.00% NS 0.00% 0.00% 0.00% 0.07%
1. Network Availability
Audit Results for Network Availability- PMR data-March
Live Measurement Results for Network Availability- 3 Day live data-March

TRAI Audit Wireless Report-Kolkata Circle JAS Quarter-2016
199
CSSR Benchmark Aircel Airtel BSNL Idea MTS Reliance CDMA Reliance GSM TATA CDMA TATA GSM Vodafone
CSSR ≥ 95% 98.30% 99.71% 99.31% 99.61% 99.87% NS 98.68% 99.36% 99.47% 99.58%
SDCCH/Paging channel congestion ≤ 1% 0.14% 0.06% 0.56% 0.05% NA NS 0.11% NA 0.05% 0.05%
TCH congestion ≤ 2% 0.07% 0.05% 1.78% 0.05% 0.00% NS 0.28% 0.15% 0.02% 0.42%
CSSR Benchmark Aircel Airtel BSNL Idea MTS Reliance CDMA Reliance GSM TATA CDMA TATA GSM Vodafone
CSSR ≥ 95% 98.67% 99.73% 98.69% 99.61% 99.90% NS 97.96% 99.52% 99.57% 99.74%
SDCCH/Paging channel congestion ≤ 1% 0.08% 0.05% 0.41% 0.05% NA NS 0.05% NA 0.04% 0.05%
TCH congestion ≤ 2% 0.01% 0.04% 1.84% 0.01% 0.00% NS 0.08% 0.02% 0.01% 0.26%
CSSR Benchmark Aircel Airtel BSNL Idea MTS Reliance CDMA Reliance GSM TATA CDMA TATA GSM Vodafone
Total number of call attempts NA NA NA NA NA NS NA NA NA NA
Total number of successful calls established NA NA NA NA NA NS NA NA NA NA
CSSR ≥ 95% NA NA NA NA NA NS NA NA NA NA
%age blocked calls NA NA NA NA NA NS NA NA NA NA
Live measurement results for CSSR, SDCCH and TCH congestion- 3 Day Data-March
Drive test results for CSSR (Average of three drive tests) and blocked calls- Drive Test Data-March
Audit Results for CSSR, SDCCH and TCH congestion- PMR data-March
2. Connection Establishment (Accessibility)

TRAI Audit Wireless Report-Kolkata Circle JAS Quarter-2016
200
Call drop rate Benchmark Aircel Airtel BSNL Idea MTS Reliance CDMA Reliance GSM TATA CDMA TATA GSM Vodafone
Total number of calls established 60269089 103348588 92323297 62110733 7058308 NS NA 3527460 47853532 120085011
Total number of calls dropped 360797 695958 1416226 172857 29372 NS 47913 8431 148741 847444
Call drop rate ≤ 2% 0.60% 0.67% 1.53% 0.28% 0.42% NS NA 0.24% 0.31% 0.71%
Total number of cells in the network 7197 8746 3587 7102 2195 NS 4847 1968 5294 7376
Total number of cells having more than 3% TCH 173 207 47 8 57 NS 21 53 45 199
Worst affected cells having more than 3% TCH ≤ 3% 2.40% 2.37% 1.31% 0.11% 2.61% NS 0.43% 2.69% 0.85% 2.70%
Call drop rate Benchmark Aircel Airtel BSNL Idea MTS Reliance CDMA Reliance GSM TATA CDMA TATA GSM Vodafone
Total number of calls established 74551434 10516107 17829170 77564491 8909051 NS NA 4293964 58830610 168269539
Total number of calls dropped 359291 69162 265053 171404 28606 NS 41291 12048 149916 951607
Call drop rate ≤ 2% 0.48% 0.66% 1.49% 0.22% 0.32% NS NA 0.28% 0.25% 0.57%
Total number of cells in the network 7197 8746 3587 7102 2195 NS 4847 1968 5288 7376
Total number of cells having more than 3% TCH 159 206 76 1 2 NS 2 46 35 208
Worst affected cells having more than 3% TCH ≤ 3% 2.21% 2.36% 2.12% 0.01% 0.08% NS 0.04% 2.34% 0.66% 2.82%
Call drop rate Benchmark Aircel Airtel BSNL Idea MTS Reliance CDMA Reliance GSM TATA CDMA TATA GSM Vodafone
Total number of calls established NA NA NA NA NA NS NA NA NA NA
Total number of calls dropped NA NA NA NA NA NS NA NA NA NA
Call drop rate ≤ 2% NA NA NA NA NA NS NA NA NA NA
3. Connection Maintenance (Retainability)
Audit Results for Call drop rate and for number of cells having more than 3% TCH-PMR data-March
Live measurement results for Call drop rate and for number of cells having more than 3% TCH- 3 Day data-March
Drive test results for Call drop rate (Average of three drive tests) - Drive Test Data-March

TRAI Audit Wireless Report-Kolkata Circle JAS Quarter-2016
201
Voice quality Benchmark Aircel Airtel BSNL Idea MTS Reliance CDMA Reliance GSM TATA CDMA TATA GSM Vodafone
Total number of sample calls 12782606631 37909305975 6000 9561630747 68045 NS 6942719547 255681303 6658327949 19064332195
Total number of calls with good voice quality 12539534432 37295870241 5986 9377914069 67708 NS 6872089326 255046080 6581051471 18700984902
%age calls with good voice quality ≥ 95% 98.10% 98.38% 99.77% 98.08% 99.50% NS 98.98% 99.75% 98.84% 98.09%
Voice quality Benchmark Aircel Airtel BSNL Idea MTS Reliance CDMA Reliance GSM TATA CDMA TATA GSM Vodafone
Total number of sample calls 15597312412 3881903850 600 10844362756 158040 NS 7991986750 347931316 8135169451 23387422731
Total number of calls with good voice quality 15373185937 3816758277 593 10665107331 156550 NS 7920697883 347076806 8066713044 22994228607
%age calls with good voice quality ≥ 95% 98.56% 98.32% 98.83% 98.35% 99.06% NS 99.11% 99.75% 99.16% 98.32%
Voice quality Benchmark Aircel Airtel BSNL Idea MTS Reliance CDMA Reliance GSM TATA CDMA TATA GSM Vodafone
Total number of sample calls NA NA NA NA NA NS NA NA NA NA
Total number of calls with good voice quality NA NA NA NA NA NS NA NA NA NA
%age calls with good voice quality ≥ 95% NA NA NA NA NA NS NA NA NA NA
4. Voice quality
Audit Results for Voice quality -PMR Data-March
Live measurement results for Voice quality-3 Day data-March
Drive test results for Voice quality (Average of three drive tests) - DT data-March

TRAI Audit Wireless Report-Kolkata Circle JAS Quarter-2016
202
POI congestion Benchmark Aircel Airtel BSNL Idea MTS Reliance CDMA Reliance GSM TATA CDMA TATA GSM Vodafone
Total number of working POIs 50 31 79 101 40 NS 29 42 30 45
No. of POIs not meeting benchmark 0 0 0 0 0 NS 0 0 0 0
Total Capacity of all POIs (A) - in erlangs 81851 87121 52656 75742 36684 NS 19024 20273 12970 220218
Traffic served for all POIs (B)- in erlangs 30571 41014 10910 43536 11184 NS 7209 6999 4695 126542
POI congestion ≤ 0.5% 0.00% 0.00% 0.00% 0.00% 0.00% NS 0.00% 0.00% 0.00% 0.00%
POI congestion Benchmark Aircel Airtel BSNL Idea MTS Reliance CDMA Reliance GSM TATA CDMA TATA GSM Vodafone
Total number of working POIs 50 31 79 102 40 NS 29 42 30 45
No. of POIs not meeting benchmark 0 0 0 0 0 NS 0 0 0 0
Total Capacity of all POIs (A) - in erlangs 81986 94616 52656 76641 35319 NS 19024 20070 12084 221433
Traffic served for all POIs (B)- in erlangs 16513 24636 11478 21557 6829 NS 6546 3892 2100 68069
POI congestion ≤ 0.5% 0.00% 0.00% 0.00% 0.00% 0.00% NS 0.00% 0.00% 0.00% 0.00%
Live Measurement Results for POI Congestion- 3 Day data-March
Audit Results for POI Congestion- PMR data-March
5. POI Congestion

TRAI Audit Wireless Report-Kolkata Circle JAS Quarter-2016
203
17 ANNEXURE – JANUARY -3G
Benchmark Aircel 3G Airtel 3G BSNL 3G Idea 3G Reliance 3G Vodafone 3G
(Number of Node Bs in the network in the licensed service area
1869 2508 775 1997 1351 2634
Sum of downtime (i.e. total outage time) of Node Bs 1529 9 7094 2002 2423 818
Node Bs downtime (not available for service) ≤ 2% 0.11% 0.00% 1.23% 0.13% 0.24% 0.04%
Number of Node Bs having accumulated downtime of >24 hours in a month
1 0 15 3 25 2
Worst affected Node Bs due to downtime ≤ 2% 0.05% 0.00% 1.94% 0.15% 1.85% 0.08%
Benchmark Aircel 3G Airtel 3G BSNL 3G Idea 3G Reliance 3G Vodafone 3G
(Number of Node Bs in the network in the licensed service area
NA NA NA NA NA NA
Sum of downtime (i.e. total outage time) of Node Bs NA NA NA NA NA NA
Node Bs downtime (not available for service) ≤ 2% NA NA NA NA NA NA
Number of Node Bs having accumulated downtime of >24 hours in a month
NA NA NA NA NA NA
Worst affected Node Bs due to downtime ≤ 2% NA NA NA NA NA NA
1. Network Availability
Audit Results for Network Availability- PMR data-January
Live Measurement Results for Network Availability- 3 Day live data-January

TRAI Audit Wireless Report-Kolkata Circle JAS Quarter-2016
204
Benchmark Aircel 3G Airtel 3G BSNL 3G Idea 3G Reliance 3G Vodafone 3G
CSSR ≥ 95% 99.67% 99.61% 97.09% 99.92% 99.93% 100.00%
RRC Congestion ≤ 1% 0.18% 0.00% 0.69% 0.0015% 0.05% 0.00%
Circuit Switched RAB Congestion ≤ 2% 0.01% 0.00% 1.32% 0.0016% 0.01% 0.00%
Benchmark Aircel 3G Airtel 3G BSNL 3G Idea 3G Reliance 3G Vodafone 3G
CSSR ≥ 95% NA NA NA NA NA NA
RRC Congestion ≤ 1% NA NA NA NA NA NA
Circuit Switched RAB Congestion ≤ 2% NA NA NA NA NA NA
CSSR Benchmark Aircel 3G Airtel 3G BSNL 3G Idea 3G Reliance 3G Vodafone 3G
Total number of RRC attempts (A) NA NA NA NA NA NA
Total number of RRC established (B) NA NA NA NA NA NA
Call setup success rate (B/A*100) ≥ 95% NA NA NA NA NA NA
%age blocked calls NA NA NA NA NA NA
Live measurement results for CSSR, RRC Congestion and Circuit Switched RAB Congestion- 3 Day Data-January
Drive test results for CSSR (Average of three drive tests) and blocked calls- Drive Test Data-January
Audit Results for CSSR, RRC Congestion and Circuit Switched RAB Congestion- PMR data-January
2. Connection Establishment (Accessibility)

TRAI Audit Wireless Report-Kolkata Circle JAS Quarter-2016
205
Benchmark Aircel 3G Airtel 3G BSNL 3G Idea 3G Reliance 3G Vodafone 3G
Total calls successfully established (A) (Number of voice RAB normally released)
12107801 19752366 156240949 8024130 8317478 39009667
Total calls dropped after establishment (B) (Number of voice RAB abnormally released)
33487 49317 2758607 15451 3412 97856
Call drop rate (B/A*100) ≤ 2% 0.28% 0.25% 1.77% 0.19% 0.04% 0.25%
Total no. of cells in the licensed service area (B) 5598 7635 1720 6074 3984 7803
No. of affected cells having CSV call drop rate >3% during (CBBH) in a month (A)
161 146 49 10 6 177
Worst affected cells having more than 3% Circuit switched voice drop rate (A/B*100)
≤ 3% 2.88% 1.91% 2.85% 0.16% 0.15% 2.27%
Benchmark Aircel 3G Airtel 3G BSNL 3G Idea 3G Reliance 3G Vodafone 3G
Total calls successfully established (A) (Number of voice RAB normally released)
NA NA NA NA NA NA
Total calls dropped after establishment (B) (Number of voice RAB abnormally released)
NA NA NA NA NA NA
Call drop rate (B/A*100) ≤ 2% NA NA NA NA NA NA
Total no. of cells in the licensed service area (B) NA NA NA NA NA NA
No. of affected cells having CSV call drop rate >3% during (CBBH) in a month (A)
NA NA NA NA NA NA
Worst affected cells having more than 3% Circuit switched voice drop rate (A/B*100)
≤ 3% NA NA NA NA NA NA
Call drop rate Benchmark Aircel 3G Airtel 3G BSNL 3G Idea 3G Reliance 3G Vodafone 3G
Total calls successfully established (A) (Number of voice RAB normally released)
NA NA NA NA NA NA
Total calls dropped after establishment (B) (Number of voice RAB abnormally released)
NA NA NA NA NA NA
Call drop rate (B/A*100) ≤ 2% NA NA NA NA NA NA
3. Connection Maintenance (Retainability)
Audit Results for Call drop rate and Worst affected cells having more than 3% Circuit switched voice drop rate -PMR data-January
Live measurement results for Call drop rate and Worst affected cells having more than 3% Circuit switched voice drop rate - 3 Day data-January
Drive test results for Call drop rate (Average of three drive tests) - Drive Test Data-January
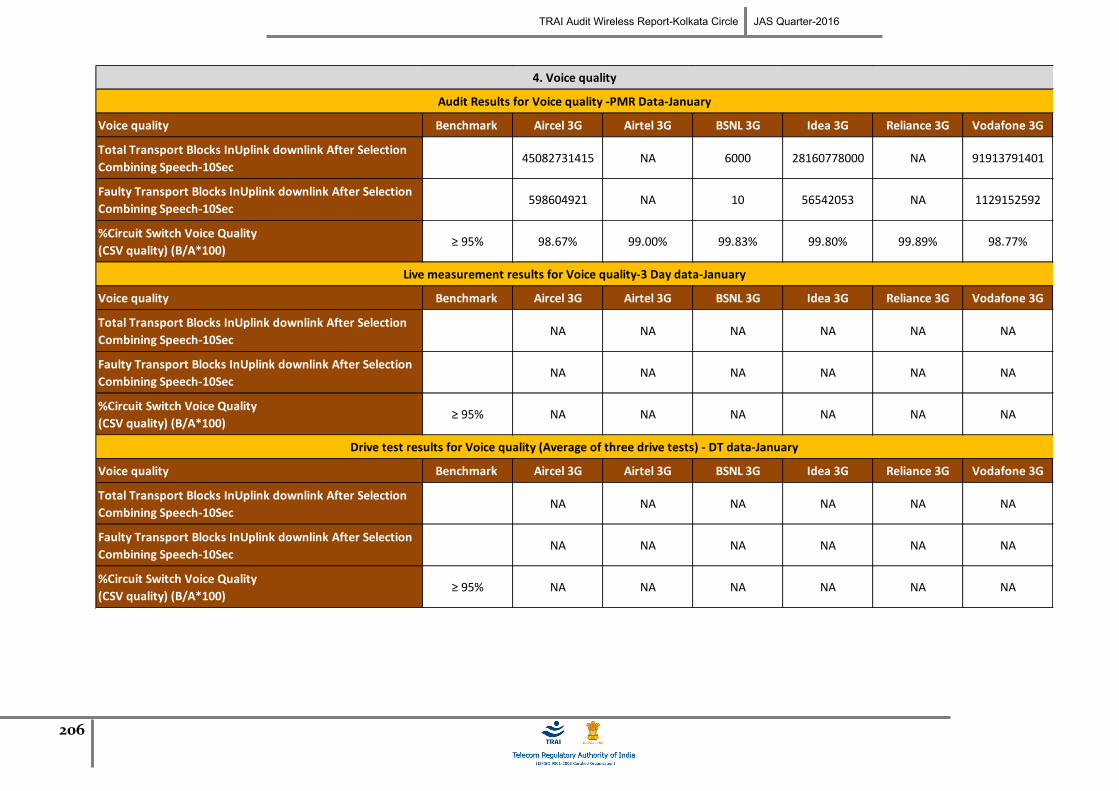
TRAI Audit Wireless Report-Kolkata Circle JAS Quarter-2016
206
Voice quality Benchmark Aircel 3G Airtel 3G BSNL 3G Idea 3G Reliance 3G Vodafone 3G
Total Transport Blocks InUplink downlink After Selection Combining Speech-10Sec
45082731415 NA 6000 28160778000 NA 91913791401
Faulty Transport Blocks InUplink downlink After Selection Combining Speech-10Sec
598604921 NA 10 56542053 NA 1129152592
%Circuit Switch Voice Quality(CSV quality) (B/A*100)
≥ 95% 98.67% 99.00% 99.83% 99.80% 99.89% 98.77%
Voice quality Benchmark Aircel 3G Airtel 3G BSNL 3G Idea 3G Reliance 3G Vodafone 3G
Total Transport Blocks InUplink downlink After Selection Combining Speech-10Sec
NA NA NA NA NA NA
Faulty Transport Blocks InUplink downlink After Selection Combining Speech-10Sec
NA NA NA NA NA NA
%Circuit Switch Voice Quality(CSV quality) (B/A*100)
≥ 95% NA NA NA NA NA NA
4. Voice quality
Audit Results for Voice quality -PMR Data-January
Live measurement results for Voice quality-3 Day data-January
Drive test results for Voice quality (Average of three drive tests) - DT data-January

TRAI Audit Wireless Report-Kolkata Circle JAS Quarter-2016
207
POI congestion Benchmark Aircel 3G Airtel 3G BSNL 3G Idea 3G Reliance 3G Vodafone 3G
Total number of working POIs 50 31 79 101 29 45
No. of POIs not meeting benchmark 0 0 1 0 0 0
Total Capacity of all POIs (A) - in erlangs 81658 82245 402051 77146 11877 210980
Traffic served for all POIs (B)- in erlangs 30106 42385 10701 39067 9454 115295
POI congestion ≤ 0.5% 0.00% 0.00% 0.00% 0.00% 0.00% 0.00%
POI congestion Benchmark Aircel 3G Airtel 3G BSNL 3G Idea 3G Reliance 3G Vodafone 3G
Total number of working POIs NA NA NA NA NA NA
No. of POIs not meeting benchmark NA NA NA NA NA NA
Total Capacity of all POIs (A) - in erlangs NA NA NA NA NA NA
Traffic served for all POIs (B)- in erlangs NA NA NA NA NA NA
POI congestion ≤ 0.5% NA NA NA NA NA NA
Live Measurement Results for POI Congestion- 3 Day data-January
Audit Results for POI Congestion- PMR data-January
5. POI Congestion

TRAI Audit Wireless Report-Kolkata Circle JAS Quarter-2016
208
18 ANNEXURE – FEBRUARY-3G
Benchmark Aircel 3G Airtel 3G BSNL 3G Idea 3G Reliance 3G Vodafone 3G
(Number of Node Bs in the network in the licensed service area 1868 2516 805 1997 1351 2661
Sum of downtime (i.e. total outage time) of Node Bs 755 16.11 7268 2276 2197 432
Node Bs downtime (not available for service) ≤ 2% 0.06% 0.00% 1.34% 0.17% 0.24% 0.02%
Number of Node Bs having accumulated downtime of >24 hours in a month
3 0 16 6 23 0
Worst affected Node Bs due to downtime ≤ 2% 0.16% 0.00% 1.99% 0.30% 1.70% 0.00%
Benchmark Aircel 3G Airtel 3G BSNL 3G Idea 3G Reliance 3G Vodafone 3G
(Number of Node Bs in the network in the licensed service area NA NA NA NA NA NA
Sum of downtime (i.e. total outage time) of Node Bs NA NA NA NA NA NA
Node Bs downtime (not available for service) ≤ 2% NA NA NA NA NA NA
Number of Node Bs having accumulated downtime of >24 hours in a month
NA NA NA NA NA NA
Worst affected Node Bs due to downtime ≤ 2% NA NA NA NA NA NA
1. Network Availability
Audit Results for Network Availability- PMR data-February
Live Measurement Results for Network Availability- 3 Day live data-February

TRAI Audit Wireless Report-Kolkata Circle JAS Quarter-2016
209
Benchmark Aircel 3G Airtel 3G BSNL 3G Idea 3G Reliance 3G Vodafone 3G
CSSR ≥ 95% 99.62% 99.62% 95.65% 99.91% 99.96% 100.00%
RRC Congestion ≤ 1% 0.20% 0.00% 0.73% 0.0017% 0.03% 0.00%
Circuit Switched RAB Congestion ≤ 2% 0.02% 0.00% 0.22% 0.0006% 0.02% 0.00%
Benchmark Aircel 3G Airtel 3G BSNL 3G Idea 3G Reliance 3G Vodafone 3G
CSSR ≥ 95% NA NA NA NA NA NA
RRC Congestion ≤ 1% NA NA NA NA NA NA
Circuit Switched RAB Congestion ≤ 2% NA NA NA NA NA NA
CSSR Benchmark Aircel 3G Airtel 3G BSNL 3G Idea 3G Reliance 3G Vodafone 3G
Total number of RRC attempts (A) NA NA NA NA NA NA
Total number of RRC established (B) NA NA NA NA NA NA
Call setup success rate (B/A*100) ≥ 95% NA NA NA NA NP NA
%age blocked calls NA NA NA NA NP NA
Audit Results for CSSR, RRC Congestion and Circuit Switched RAB Congestion- PMR data-February
2. Connection Establishment (Accessibility)
Live measurement results for CSSR, RRC Congestion and Circuit Switched RAB Congestion- 3 Day Data-February
Drive test results for CSSR (Average of three drive tests) and blocked calls- Drive Test Data-February

TRAI Audit Wireless Report-Kolkata Circle JAS Quarter-2016
210
Benchmark Aircel 3G Airtel 3G BSNL 3G Idea 3G Reliance 3G Vodafone 3G
Total calls successfully established (A) (Number of voice RAB normally released)
11254903 19481051 4665970 7363269 7487054 30458166
Total calls dropped after establishment (B) (Number of voice RAB abnormally released)
33425 47643 52092 12930 3356 86580
Call drop rate (B/A*100) ≤ 2% 0.30% 0.24% 1.12% 0.18% 0.04% 0.28%
Total no. of cells in the licensed service area (B) 5595 7657 1720 6075 3984 7883
No. of affected cells having CSV call drop rate >3% during (CBBH) in a month (A)
165 140 49 5 7 181
Worst affected cells having more than 3% Circuit switched voice drop rate (A/B*100)
≤ 3% 2.95% 1.83% 2.85% 0.08% 0.18% 2.30%
Benchmark Aircel 3G Airtel 3G BSNL 3G Idea 3G Reliance 3G Vodafone 3G
Total calls successfully established (A) (Number of voice RAB normally released)
NA NA NA NA NA NA
Total calls dropped after establishment (B) (Number of voice RAB abnormally released)
NA NA NA NA NA NA
Call drop rate (B/A*100) ≤ 2% NA NA NA NA NA NA
Total no. of cells in the licensed service area (B) NA NA NA NA NA NA
No. of affected cells having CSV call drop rate >3% during (CBBH) in a month (A)
NA NA NA NA NA NA
Worst affected cells having more than 3% Circuit switched voice drop rate (A/B*100)
≤ 3% NA NA NA NA NA NA
Call drop rate Benchmark Aircel 3G Airtel 3G BSNL 3G Idea 3G Reliance 3G Vodafone 3G
Total calls successfully established (A) (Number of voice RAB normally released)
NA NA NA NA NP NA
Total calls dropped after establishment (B) (Number of voice RAB abnormally released)
NA NA NA NA NP NA
Call drop rate (B/A*100) ≤ 2% NA NA NA NA NP NA
3. Connection Maintenance (Retainability)
Audit Results for Call drop rate and Worst affected cells having more than 3% Circuit switched voice drop rate -PMR data-February
Live measurement results for Call drop rate and Worst affected cells having more than 3% Circuit switched voice drop rate - 3 Day data-February
Drive test results for Call drop rate (Average of three drive tests) - Drive Test Data-February

TRAI Audit Wireless Report-Kolkata Circle JAS Quarter-2016
211
Voice quality Benchmark Aircel 3G Airtel 3G BSNL 3G Idea 3G Reliance 3G Vodafone 3G
Total Transport Blocks InUplink downlink After Selection Combining Speech-10Sec
40657961849 NA 6000 25272538000 NA 89132582847
Faulty Transport Blocks InUplink downlink After Selection Combining Speech-10Sec
538919492 NA 10 52122085 NA 946316498
%Circuit Switch Voice Quality(CSV quality) (B/A*100)
≥ 95% 98.67% 99.00% 99.83% 99.79% 99.89% 98.94%
Voice quality Benchmark Aircel 3G Airtel 3G BSNL 3G Idea 3G Reliance 3G Vodafone 3G
Total Transport Blocks InUplink downlink After Selection Combining Speech-10Sec
NA NA NA NA NA NA
Faulty Transport Blocks InUplink downlink After Selection Combining Speech-10Sec
NA NA NA NA NA NA
%Circuit Switch Voice Quality(CSV quality) (B/A*100)
≥ 95% NA NA NA NA NA NA
Voice quality Benchmark Aircel 3G Airtel 3G BSNL 3G Idea 3G Reliance 3G Vodafone 3G
Total Transport Blocks InUplink downlink After Selection Combining Speech-10Sec
NA NA NA NA NP NA
Faulty Transport Blocks InUplink downlink After Selection Combining Speech-10Sec
NA NA NA NA NP NA
%Circuit Switch Voice Quality(CSV quality) (B/A*100)
≥ 95% NA NA NA NA NP NA
4. Voice quality
Audit Results for Voice quality -PMR Data-February
Live measurement results for Voice quality-3 Day data-February
Drive test results for Voice quality (Average of three drive tests) - DT data-February

TRAI Audit Wireless Report-Kolkata Circle JAS Quarter-2016
212
POI congestion Benchmark Aircel 3G Airtel 3G BSNL 3G Idea 3G Reliance 3G Vodafone 3G
Total number of working POIs 50 31 79 101 29 45
No. of POIs not meeting benchmark 0 0 0 0 0 0
Total Capacity of all POIs (A) - in erlangs 81768 83299 402051 76680 11877 218028
Traffic served for all POIs (B)- in erlangs 30297 41052 10701 41338 9659 122675
POI congestion ≤ 0.5% 0.00% 0.00% 0.00% 0.00% 0.00% 0.00%
POI congestion Benchmark Aircel 3G Airtel 3G BSNL 3G Idea 3G Reliance 3G Vodafone 3G
Total number of working POIs NA NA NA NA NA NA
No. of POIs not meeting benchmark NA NA NA NA NA NA
Total Capacity of all POIs (A) - in erlangs NA NA NA NA NA NA
Traffic served for all POIs (B)- in erlangs NA NA NA NA NA NA
POI congestion ≤ 0.5% NA NA NA NA NA NA
Audit Results for POI Congestion- PMR data-February
5. POI Congestion
Live Measurement Results for POI Congestion- 3 Day data-February

TRAI Audit Wireless Report-Kolkata Circle JAS Quarter-2016
213
19 ANNEXURE – MARCH-3G
Benchmark Aircel 3G Airtel 3G BSNL 3G Idea 3G Reliance 3G Vodafone 3G
(Number of Node Bs in the network in the licensed service area 1868 2545 835 1997 1375 2679
Sum of downtime (i.e. total outage time) of Node Bs 880 11 8298 2508 3157 654
Node Bs downtime (not available for service) ≤ 2% 0.06% 0.00% 1.34% 0.17% 0.31% 0.03%
Number of Node Bs having accumulated downtime of >24 hours in a month
4 0 16 4 25 1
Worst affected Node Bs due to downtime ≤ 2% 0.21% 0.00% 1.92% 0.20% 1.82% 0.04%
Benchmark Aircel 3G Airtel 3G BSNL 3G Idea 3G Reliance 3G Vodafone 3G
(Number of Node Bs in the network in the licensed service area 1868 2545 835 1997 1375 2679
Sum of downtime (i.e. total outage time) of Node Bs 154 0 380 259 1159 44
Node Bs downtime (not available for service) ≤ 2% 0.11% 0.00% 0.63% 0.18% 1.17% 0.02%
Number of Node Bs having accumulated downtime of >24 hours in a month
1 0 2 4 0 0
Worst affected Node Bs due to downtime ≤ 2% 0.05% 0.00% 0.24% 0.20% 0.00% 0.00%
1. Network Availability
Audit Results for Network Availability- PMR data-March
Live Measurement Results for Network Availability- 3 Day live data-March

TRAI Audit Wireless Report-Kolkata Circle JAS Quarter-2016
214
Benchmark Aircel 3G Airtel 3G BSNL 3G Idea 3G Reliance 3G Vodafone 3G
CSSR ≥ 95% 99.53% 99.60% 95.99% 99.91% 99.98% 99.99%
RRC Congestion ≤ 1% 0.24% 0.00% 0.37% 0.0021% 0.02% 0.01%
Circuit Switched RAB Congestion ≤ 2% 0.08% 0.00% 0.67% 0.0011% 0.01% 0.01%
Benchmark Aircel 3G Airtel 3G BSNL 3G Idea 3G Reliance 3G Vodafone 3G
CSSR ≥ 95% 99.56% 99.59% 95.86% 99.90% 100.00% 100.00%
RRC Congestion ≤ 1% 0.21% 0.00% 0.36% 0.00% 0.01% 0.00%
Circuit Switched RAB Congestion ≤ 2% 0.03% 0.00% 0.71% 0.00% 0.00% 0.01%
CSSR Benchmark Aircel 3G Airtel 3G BSNL 3G Idea 3G Reliance 3G Vodafone 3G
Total number of RRC attempts (A) NA NA NA NA NA NA
Total number of RRC established (B) NA NA NA NA NA NA
Call setup success rate (B/A*100) ≥ 95% NA NA NA NA NA NA
%age blocked calls NA NA NA NA NA NA
Audit Results for CSSR, RRC Congestion and Circuit Switched RAB Congestion- PMR data-March
2. Connection Establishment (Accessibility)
Live measurement results for CSSR, RRC Congestion and Circuit Switched RAB Congestion- 3 Day Data-March
\

TRAI Audit Wireless Report-Kolkata Circle JAS Quarter-2016
215
Benchmark Aircel 3G Airtel 3G BSNL 3G Idea 3G Reliance 3G Vodafone 3G
Total calls successfully established (A) (Number of voice RAB normally released)
12293294 22893942 61020184 8772209 7455835 34974972
Total calls dropped after establishment (B) (Number of voice RAB abnormally released)
34214 58193 519332 15550 3712 95455
Call drop rate (B/A*100) ≤ 2% 0.28% 0.25% 0.85% 0.18% 0.05% 0.27%
Total no. of cells in the licensed service area (B) 5595 7752 2462 6077 4052 7931
No. of affected cells having CSV call drop rate >3% during (CBBH) in a month (A)
164 143 72 2 6 181
Worst affected cells having more than 3% Circuit switched voice drop rate (A/B*100)
≤ 3% 2.93% 1.84% 2.92% 0.03% 0.15% 2.28%
Benchmark Aircel 3G Airtel 3G BSNL 3G Idea 3G Reliance 3G Vodafone 3G
Total calls successfully established (A) (Number of voice RAB normally released)
15216006 2478162 2575225 11146709 9461966 55319706
Total calls dropped after establishment (B) (Number of voice RAB abnormally released)
45651 6704 14454 18368 3763 146121
Call drop rate (B/A*100) ≤ 2% 0.30% 0.27% 0.56% 0.16% 0.04% 0.26%
Total no. of cells in the licensed service area (B) 5595 7752 2462 6077 4052 7931
No. of affected cells having CSV call drop rate >3% during (CBBH) in a month (A)
155 150 20 4 5 187
Worst affected cells having more than 3% Circuit switched voice drop rate (A/B*100)
≤ 3% 2.77% 1.93% 0.81% 0.07% 0.12% 2.36%
Call drop rate Benchmark Aircel 3G Airtel 3G BSNL 3G Idea 3G Reliance 3G Vodafone 3G
Total calls successfully established (A) (Number of voice RAB normally released)
NA NA NA NA NA NA
Total calls dropped after establishment (B) (Number of voice RAB abnormally released)
NA NA NA NA NA NA
Call drop rate (B/A*100) ≤ 2% NA NA NA NA NA NA
3. Connection Maintenance (Retainability)
Audit Results for Call drop rate and Worst affected cells having more than 3% Circuit switched voice drop rate -PMR data-March
Live measurement results for Call drop rate and Worst affected cells having more than 3% Circuit switched voice drop rate - 3 Day data-March
Drive test results for Call drop rate (Average of three drive tests) - Drive Test Data-March

TRAI Audit Wireless Report-Kolkata Circle JAS Quarter-2016
216
Voice quality Benchmark Aircel 3G Airtel 3G BSNL 3G Idea 3G Reliance 3G Vodafone 3G
Total Transport Blocks InUplink downlink After Selection Combining Speech-10Sec
42238926967 NA 6000 29306885500 NA 103208749121
Faulty Transport Blocks InUplink downlink After Selection Combining Speech-10Sec
607401500 NA 14 64395856 NA 1105378231
%Circuit Switch Voice Quality(CSV quality) (B/A*100)
≥ 95% 98.56% 99.73% 99.77% 99.78% 99.89% 98.93%
Voice quality Benchmark Aircel 3G Airtel 3G BSNL 3G Idea 3G Reliance 3G Vodafone 3G
Total Transport Blocks InUplink downlink After Selection Combining Speech-10Sec
66044858004 21441607579 600 36626282500 NA 144414304782
Faulty Transport Blocks InUplink downlink After Selection Combining Speech-10Sec
1004415705 21384143085 591 81514119 NA 1571398698
%Circuit Switch Voice Quality(CSV quality) (B/A*100)
≥ 95% 98.48% 99.73% 98.50% 99.87% 99.89% 98.91%
Voice quality Benchmark Aircel 3G Airtel 3G BSNL 3G Idea 3G Reliance 3G Vodafone 3G
Total Transport Blocks InUplink downlink After Selection Combining Speech-10Sec
NA NA NA NA NA NA
Faulty Transport Blocks InUplink downlink After Selection Combining Speech-10Sec
NA NA NA NA NA NA
%Circuit Switch Voice Quality(CSV quality) (B/A*100)
≥ 95% NA NA NA NA NA NA
4. Voice quality
Audit Results for Voice quality -PMR Data-March
Live measurement results for Voice quality-3 Day data-March
Drive test results for Voice quality (Average of three drive tests) - DT data-March

TRAI Audit Wireless Report-Kolkata Circle JAS Quarter-2016
217
POI congestion Benchmark Aircel 3G Airtel 3G BSNL 3G Idea 3G Reliance 3G Vodafone 3G
Total number of working POIs 50 31 79 102 29 45
No. of POIs not meeting benchmark 0 0 1 0 0 0
Total Capacity of all POIs (A) - in erlangs 81851 87121 52656 75742 19024 220218
Traffic served for all POIs (B)- in erlangs 30571 41014 10910 43536 7209 126542
POI congestion ≤ 0.5% 0.00% 0.00% 0.00% 0.00% 0.00% 0.00%
POI congestion Benchmark Aircel 3G Airtel 3G BSNL 3G Idea 3G Reliance 3G Vodafone 3G
Total number of working POIs 50 31 79 102 29 45
No. of POIs not meeting benchmark 0 0 0 0 0 0
Total Capacity of all POIs (A) - in erlangs 81986 94616 52656 76641 19024 221433
Traffic served for all POIs (B)- in erlangs 16513 24636 11478 21557 6546 68069
POI congestion ≤ 0.5% 0.00% 0.00% 0.00% 0.00% 0.00% 0.00%
Audit Results for POI Congestion- PMR data-March
5. POI Congestion
Live Measurement Results for POI Congestion- 3 Day data-March

218
20 ABBREVIATIONS
Following terms/abbreviations have been used in this report. This section provides meaning of the abbreviations used in the report.
1. TRAI – Telecom Regulatory Authority of India
2. QoS – Quality of Service
3. JAS’16 – Refers to the quarter of JANUARY , FEBRUARY and MARCH 2016
4. IMRB – Refers to IMRB International, the audit agency for this report
5. SSA – Secondary Switching Area
6. NOC – Network Operation Center
7. OMC – Operations and Maintenance Center
8. MSC – Mobile Switching Center
9. PMR – Performance Monitoring Reports
10. TCBH – Time Consistent Busy Hour
11. CBBH - Cell Bouncing Busy Hour
12. BTS – Base Transceiver Station
13. CSSR – Call Setup Success Rate
14. TCH – Traffic Channel
15. SDCCH – Standalone Dedicated Control Channel
16. CDR – Call Drop Rate
17. FER – Frame Error Rate
18. SIM – Subscriber Identity Module
19. GSM – Global System for Mobile
20. CDMA – Code Division Multiple Access
21. NA – Not Applicable
22. NC – Non Compliance
23. POI – Point of Interconnection
24. IVR – Interactive Voice Response
25. STD – Standard Trunk Dialing
26. ISD – International Subscriber Dialing

219
TRAI REGIONAL OFFICE , KOLKATAQA BHAWAN, BLOCK-EP & GP
SECTOR-V, SALT LAKEKOLKATA-700091