Embed Size (px)
Citation preview

2012-0835.A20
Traffic Impact Study
Palmer PointeBarrington, Rhode Island
March 2016
Town of Barrington Planning Commission
317 Iron Horse WayProvidence, RI 02908
Approved by __________________________ License No. 7875Derek L. Hug, PE, PTOE
Prepared for:East Bay Community Development Corporation
150 Franklin StreetBristol, RI 02809
\\private\dfs\ProjectData\P2012\1033\A20\Traffic\TIS\TRAFFIC IMPACT STUDY-Palmer Pointe.docx i
Table of Contents
Traffic Impact StudyPalmer Pointe Development
Barrington, Rhode Island
Summary Sheet .......................................................................................................iii
1 Introduction .................................................................................................. 1
2 Existing Condition ........................................................................................ 12.1 Site of Development .............................................................................................. 12.2 Adjacent Roadway Network .................................................................................. 22.3 Study Area Intersections ....................................................................................... 32.4 Traffic Volumes, Speeds and Counts .................................................................... 4
3 No-Build Traffic Conditions .......................................................................... 53.1 Growth Rate........................................................................................................... 53.2 Other Developments ............................................................................................. 53.3 Planned Roadway Improvement Projects ............................................................. 5
4 Proposed Conditions ................................................................................... 54.1 Development ......................................................................................................... 54.2 Site Access and Circulation ................................................................................... 64.3 Trip Generation ..................................................................................................... 64.4 Trip Distribution ................................................................................................... 64.5 Build Volumes ....................................................................................................... 7
5 Analyses ....................................................................................................... 75.1 Crash Analysis ....................................................................................................... 75.2 Intersection Sight Distance Analysis .................................................................... 75.3 Intersection Capacity Analysis .............................................................................. 85.4 Queue Analysis ...................................................................................................... 9
6 Conclusions & Recommendations ........................................................... 10

\\private\dfs\ProjectData\P2012\1033\A20\Traffic\TIS\TRAFFIC IMPACT STUDY-Palmer Pointe.docx ii
Table of Contents(continued)
Traffic Impact StudyPalmer Pointe
Barrington, Rhode Island
Appendices End of Report
Appendix A - Tables
1. Peak Hour Site Generated Traffic Volumes2. Intersection Crash Data Summary3. Unsignalized Intersection Level of Service Summary4. AM Peak Hour Queue Length Summary5. PM Peak Hour Queue Length Summary
Appendix B - Figures
1. Site Location Map2. 2015 Existing Conditions3. Other Traffic Generators4. 2020 No-Build Conditions5. Site Generated Traffic Arrival/Departure Distribution6. Site Generated Traffic Volumes7. 2020 Build Conditions
Appendix C
Intersection Capacity Analysis Worksheets – AM Peak Hour
Appendix D
Intersection Capacity Analysis Worksheets – PM Peak Hour
Appendix E
Traffic Count Data

\\private\dfs\ProjectData\P2012\1033\A20\Traffic\TIS\TRAFFIC IMPACT STUDY-Palmer Pointe.docx iii
Summary SheetAs an aid to reviewers, this Summary Sheet has been included to outline the various study parametersutilized in this report. Although a full explanation of the study methodologies is included in the text ofthe report, this summary can serve as a useful reference for reviewers.
Applicant:East Bay Community Development Corporation
Site Acreage:9.85
Development Size/Type:Residential
Parking:83 spaces
Applications:Town of Barrington Planning Commission
Build Year:2020
No-Build Traffic Growth Factor:0.0%
Traffic Counts:Connecticut Counts LLC – December 22, 2015 (Turning Movement Counts)Connecticut Counts LLC – December 21-23, 2015 (Automatic Traffic Recorders)
Peak Hours Analyzed:AM Peak Hour – 7:30-8:30PM Peak Hour – 4:15-5:15
Expected Trip Generation:AM Peak Hour – 29 trips (10 entering 19 exiting)PM Peak Hour – 30 trips (19 entering 11 exiting)
Capacity Analysis:Technique – 2000 Highway Capacity ManualExecution – Synchro Professional Software, Version 9.0

\\private\dfs\ProjectData\P2012\1033\A20\Traffic\TIS\TRAFFIC IMPACT STUDY-Palmer Pointe.docx 1
1 IntroductionEast Bay Community Development Corporation proposes to develop a residential neighborhooddevelopment consisting of forty low- to moderate-income and two market rate homes. The PalmerPointe property extends eastward from Sowams Road to the Palmer River, on the site of the existingSowams Nursery, as shown in Figure No.1 of Appendix B. The low- to moderate-income homes will becomprised of thirteen multi-family units, made up of ten one-bedroom, sixteen two-bedroom andfourteen three-bedroom units. The expected full build-out year of the development, for the purposes ofthis study, is 2020.
Fuss & O’Neill has been retained to study the impact of the proposed development on traffic conditionsthroughout the adjacent roadway network. This report has been prepared to document the findings ofthe study and is being submitted to the Town of Barrington Planning and Commission.
2 Existing Condition
2.1 Site of Development
The proposed Palmer Pointe neighborhood will be a redevelopment of the existing Sowams Nursery onthe east side of Sowams Road in Barrington, RI. The property is identified as Lots 72, 72, 246, 248, 249and 263 on Barrington Assessor’s Plat28 and extends eastward from SowamsRoad to the Palmer River, with a totalarea of approximately 9.85 acres.Currently, the property is zonedResidential 25 (R-25). Existing siteaccess is via a driveway between twoexisting residences on Sowams Road.The proposed Red Maple Road (internalsite circulation) will approximatelyfollow the existing gravel road within theproperty. There is a single existingpermanent structure on the property,and a number of seasonal greenhouseshave traditionally been erected by theNursery. The predominant surroundingland use is residential properties.
Existing Site Driveway

\\private\dfs\ProjectData\P2012\1033\A20\Traffic\TIS\TRAFFIC IMPACT STUDY-Palmer Pointe.docx 2
2.2 Adjacent Roadway Network
The adjacent roadway network consists of the following roadways:
· Sowams Road· Kent Street· Route 114 (County Road)
Sowams Road is classified by RIDOT as a major/urban collector, and stretches from New MeadowRoad at its north end to Route 114 (County Road) at its south end, for a total length of approximately2.2 miles. This roadway provides one, 12-foot lane of travel in each direction, with 4-foot pavedshoulders, through a primarily residential area. Sowams School is located approximately a mile to thenorth of the proposed development. The posted speed limit on Sowams Road is 30 miles per hour formost of its length, except in the vicinity of the school, where the speed limit is 20 miles per hour.
The closest available mass transit consists of the RIPTA 60 Line, which includes a bus stop near thesouth end of Sowams Road on County Road. There are no pedestrian facilities provided on SowamsRoad in the study area. Sowams Road does intersect with the East Bay Bike Path located approximately150 feet north of County Road.
Kent Street is classified by RIDOT as a major/urban collector, and stretches from Sowams Road at itseast end to New Meadow Road to the west. This roadway provides one, 10-foot lane of travel in eachdirection, with 6-foot paved bike lanes along both shoulders. Land uses on Kent Street are primarilyresidential, with some commercial lots located at its east end and the Hampden Meadows School locatedat its west end. The posted speed limit on Kent Street is 25 miles per hour, and 20 miles per hour in thevicinity of the school.
There is no mass transit available on Kent Street. A concrete sidewalk is provided along the southernside of the street, from end to end.
Route 114 (County Road) is classified by RIDOT as a principal arterial, and stretches from Route 195at its northern end to the City of Newport at the southern end. In the vicinity of the study area, thisroadway provides one, 12-foot lane of travel in each direction, with 8-foot paved shoulders. Land useson County Road within the study area are primarily residential, with commercial buildings located at thebridges at either end of the study area. The posted speed limit on County Road is 35 miles per hour tothe west and 30 miles per hour to the east.
There is a regular RIPTA bus line on County Road through the study area (60 Line – Providence toNewport). Concrete sidewalks are provided on both the north and south sides of County Road withinthe study area.

\\private\dfs\ProjectData\P2012\1033\A20\Traffic\TIS\TRAFFIC IMPACT STUDY-Palmer Pointe.docx 3
2.3 Study Area Intersections
The following study area intersections were reviewed:
· Sowams Road at Site Drive· Sowams Road at Kent Street· Sowams Road at Route 114 (County Road)
Sowams Road at the Site Drive is a three-way tee intersection, with Sowams Road comprising thenorth and south legs and the site drive comprising the eastern leg. The site drive is STOP controlled,while the two Sowams Road approaches are free. The eastern leg of this intersection is a single, sharedleft/right turn lane westbound and a single lane eastbound. Sowams Road provides a single lane oftraffic in each direction, with paved shoulders.
No pedestrian facilities are provided at this intersection.
Sowams Road at Kent Street is an offset, four-way intersection, with Oak Grove Avenue providingthe westbound leg, approximately fifteen feet offset to the north of Kent Street and controlled by aSTOP sign, with a single lane of travel in each direction. The eastbound, STOP-controlled Kent Streetapproach to the intersection provides a single shared through/right-/left-turn lane for motorizedvehicles along with a single, four-foot bike lane (in each direction). The northbound and southbound
approaches to this intersection areuncontrolled and both consist of asingle lane of travel in each directionwith 2-foot shoulders. No designatedbike lanes are provided on SowamsRoad.
Pedestrian crossings are provided onthe Kent Street leg and on thenorthern Sowams Road leg. There areno pedestrian facilities (sidewalks,ramps) located on the southernSowams Road or Oak Grove Avenuelegs of the intersection, though thereis a sidewalk and pedestrian ramplocated on the southwest corner ofthe intersection, along Kent Street.
Sowams Road at Route 114 (County Road) is a three-way, tee intersection with the southboundSowams Road approach STOP-controlled and the two County Road approaches free. The SowamsRoad leg of the intersection consists of a single lane of travel in each direction with two-foot shoulders.The lanes are separated by a teardrop-shaped, raised median island. The southbound lane is wide enoughto function as two lanes, able to accommodate both right-and left-turning traffic side-by-side.Observations of the intersection operation indicate that this approach is currently used in this fashion.
Kent Street approaching Sowams Road

\\private\dfs\ProjectData\P2012\1033\A20\Traffic\TIS\TRAFFIC IMPACT STUDY-Palmer Pointe.docx 4
County Road legs to thisintersection both provide a singletravel lane in each direction withnarrow paved shoulders.
Sidewalks are provided on allapproaches to this intersection,although the Sowams Roadsidewalks terminate beforereaching the East Bay Bike Pathcrossing, located approximately100 feet north of the intersection.A crosswalk is provided across thewestern leg of County Road.
2.4 Traffic Volumes,Speeds and Counts
The greatest potential for traffic impact on the roadway network by the proposed development willoccur during the AM and PM peak hours, the periods when commuter and/or residential developmentrelated trips are at their highest levels. In order to determine the traffic impact of the proposeddevelopment on adjacent street traffic, representatives of Fuss & O’Neill, Inc. conducted AM and PMpeak hour manual turning movement counts on December 22, 2015 at the three intersections in thestudy area. The traffic count data collected indicates that the AM peak hour of traffic is 7:30 to 8:30 andthe PM peak hour is 4:15 to 5:15. These peak hours were subsequently analyzed for impacts. Theexisting traffic volumes for these peak hours are shown in Figure No. 2 of Appendix B.
In order to determine the existing traffic volumes and speeds on Sowams Road at the proposeddevelopment, Automatic Traffic Recorders (ATRs) were installed in the vicinity of the site drive, fromDecember 21 to December 23, 2015. From the data collected by these ATRs, it was determined thatexisting traffic patterns are similar in both the northbound and southbound directions. The 85 th
percentile speed (the speed at which 85% of vehicles travel at or below) was determined to be 40 milesper hour in the northbound direction and 39 miles per hour in the southbound direction, with a meanspeed of 35 mph and 34 mph, respectively.
The Rhode Island Department of Transportation has conducted traffic counts on Sowams Road to thenorth of the site, near Christine Drive, and determined the Average Annual Daily Traffic (AADT) to beapproximately 2,700 vehicles per day. The ATR data obtained in the vicinity of the site drive shows anAverage Daily Traffic (ADT) of 3,745 vehicles, based on the 48 hours of data collection. This data alsoshows that the directional distribution of daily traffic on Sowams Road is approximately equal. Copies ofthe ATR traffic data have been included in Appendix E of this report.
Sowams Road at the East Bay Bike Path approaching Route 114 (CountyRoad)

\\private\dfs\ProjectData\P2012\1033\A20\Traffic\TIS\TRAFFIC IMPACT STUDY-Palmer Pointe.docx 5
3 No-Build Traffic Conditions
3.1 Background Growth Rate
Upon consultation with the Town of Barrington Planning Department, and the Rhode Island StatewidePlanning Program’s (RISPP) Technical Paper 162, the 2015 existing traffic volumes were not expandedthe 2020 design year to account for normal traffic growth in the study area. Note that both the Town’sPlanning Department and the RISPP technical paper suggested a growth rate of -0.8% for Barringtonover this period. For the purpose of this study we are conservatively proposing maintaining trips at asteady rate.
3.2 Other Developments
Fuss & O’Neill contacted both the Towns of Barrington and Warren Planning offices to identify anyother significant pending or approved developments having site related traffic in the study area. Whilethere are no significant pending developments in the Town of Barrington, there is a proposedredevelopment of the former American Tourister complex located just across the Palmer River in theTown of Warren. This development will be phased, with a proposed 190 residential units and 76,339square feet commercial space constructed during the first phase and an additional 100 residential unitsand 17,500 square feet of commercial space constructed during the second. For the purpose of thisstudy it will be assumed that the full buildout of the American Tourister complex will occur prior to the2020 study design year.
Traffic volumes from these developments were added to the 2015 traffic volumes to obtain the 2020No-Build traffic volumes which are defined as design year traffic without the proposed development.These projected No-Build traffic volumes are shown in Figure No. 3 of Appendix B.
3.3 Planned Roadway ImprovementProjects
There are currently no planned roadway improvement projects within the study area.
4 Proposed Conditions
4.1 Development
The proposed Palmer Pointe neighborhood will consist of 40 low- to moderate-income and two marketrate homes. The forty low- to moderate-income homes will be provided in eleven multi-residencebuildings, with a mix of ten one bedroom units, sixteen two bedroom units and fourteen three bedroomunits.
Off-street parking will provide seventy-one spaces in six separate parking lots, with an additional twelveon-street parking spaces provided along Red Maple Road in recessed bays, for a total of eighty-three

\\private\dfs\ProjectData\P2012\1033\A20\Traffic\TIS\TRAFFIC IMPACT STUDY-Palmer Pointe.docx 6
spaces, of which two spaces will be handicapped-accessible. An additional two buildings will be includedin the development. One of these buildings will be contain laundry and maintenance facilities and theother will contain the development office/personnel.
4.2 Site Access and Circulation
Site access is proposed to be provided on the east side of Sowams Road at the location of the currentgreenhouse driveway, and would consist of a single eleven-foot lane of travel in each direction. Thisaccess roadway continues into the development as a loop, providing access to individual apartments andto the parking lots throughout the development. A total of six parking lots are provided within thedevelopment, in addition to recessed, on-street parking. All parking lot exits, as well as the site drive atSowams Road, are proposed to be STOP-sign controlled.
4.3 Trip Generation
Trip generation estimates were determined using the Ninth Edition of the Institute of TransportationEngineers’ publication Trip Generation. This publication is an industry-accepted resource for determiningtrip generation. The most appropriate land use code for the proposed development is “RentalTownhouse” (Land Use Code 224) since the proposed units are rentals with four or fewer units perbuilding. However, there is very little data for this land use code. Closely-related codes 220 (Apartment)and 230 (Residential Condominium/Townhouse) were also researched as potential sources fordetermining the trip generation for this development. The Rental Townhouse code, which had thehighest trip generation characteristics of the three codes, was used to produce a conservatively high tripgeneration estimate.
Based on this data, the proposed development is expected to generate approximately 29 trips during theweekday morning peak hour, with approximately 10 vehicles entering and 19 vehicles exiting. Thedevelopment can also be expected to generate approximately 30 trips during the weekday afternoonpeak hour, with approximately 19 vehicles entering and 11 vehicles exiting. A summary of the peak hourtrip generation information for the proposed facility is provided in Table 1 of Appendix A.
4.4 Trip Distribution
The distribution of traffic entering and exiting the proposed site was applied to the road network basedon the existing regional traffic distributions and the layout of the adjacent roadway network. During thepeak hours, the following arrival distributions of traffic are anticipated:
· 55% to/from the north on Sowams Road; 10% to/from Kent Street and 45% to/from SowamsRoad north of Kent Street
· 45% to/from the south on Sowams Road; 10% to/from County Road from the west and 35%to/from County Road from the east
A study area arrival/departure distribution for the new site-generated traffic traveling to and from theproject site is shown in Figure No. 4 of Appendix B.

\\private\dfs\ProjectData\P2012\1033\A20\Traffic\TIS\TRAFFIC IMPACT STUDY-Palmer Pointe.docx 7
4.5 Build Volumes
The site-generated traffic was distributed to the roadway system based on the arrival/departuredistributions with the results shown in Figure No. 5 of Appendix B. These volumes were then added tothe No-Build volumes to yield the year 2020 peak hour Build traffic volumes shown in Figure No. 6 ofAppendix B.
5 Analyses
5.1 Crash Analysis
Crash data was gathered from Town of Barrington Police Department for Sowams Road within thestudy area.
The records were gathered for the most recent 3 years of available data, 2013 through 2015. A summaryof the crash data per intersection and roadway segment is provided in Table 2 of Appendix A. Copies ofthe crash data records can be provided upon request. There were no recorded crashes at the intersectionof Sowams Road and Kent Street, or between that intersection and County Road, on Sowams Road.The intersection of Sowams Road and County Road averaged three crashes per year, with the majorityof the crashes involving rear end crashes on County Road (4), and angle-right angle crashes (3) due tovehicles on Sowams Road pulling into traffic on County Road. Three other crashes involved a singlemotorcycle (1) and a rear-to-side crash (1) due to snowy conditions on County Road. Of all of the abovecrashes, only one resulted in bodily injury (driver of the single motorcycle). Due to the existing trafficvolumes and geometry at this intersection, the frequency and severity of these crashes are notconsidered to be abnormal.
5.2 Intersection Sight DistanceAnalysis
Fuss & O'Neill also looked at the available intersection sight distance at the proposed site accesslocation in accordance with standards set forth by the American Association of State Highway andTransportation Officials (AASHTO). When discussing sight distance at an intersection, the availablesight distance will be compared to two sets of sight distance standards: stopping sight distance (SSD)and intersection sight distance (ISD).
The purpose of providing sight distance at an intersection is to allow drivers of stopped vehicles to viewoncoming vehicles and decide when to enter or cross the traffic stream. If the available sight distance isat least equal to the appropriate SSD for the intersecting road, then drivers can anticipate and avoidcollisions. However, to enhance traffic operation, additional sight distance is desirable. The ISDstandard provides enough sight distance for a vehicle to enter the traffic stream without forcing majorroad drivers to slow to less than 70 percent of their initial speed.

\\private\dfs\ProjectData\P2012\1033\A20\Traffic\TIS\TRAFFIC IMPACT STUDY-Palmer Pointe.docx 8
Looking to the right (north) from thesite driveway the available sightdistance was observed to beapproximately 840 feet, with utilitypole #21-1 being the limiting factor.Looking to the left (south), sightdistance is limited to 315 feet by thetrunk of a large maple tree in front ofhouse #91.
The speed limit on Sowams Road is30 miles per hour, with observedspeeds of approximately 35 miles perhour. Based on a design speed of 35miles per hour, the distance requiredto meet the SSD standard is 250 feet.Therefore the minimum sight distance
required to avoid collisions is met in both directions. The sight distance looking to the north is ample tomeet the more stringent ISD standard of 390 feet, but the sight distance to the south is just shy of theISD standard of 335 feet.
Removal of the maple tree in front of #91 Sowams Road would allow the sight distance looking to thesouth to meet both SSD and ISD standards, as the resulting sight distance would be extended toapproximately 520 feet. However, East Bay Community Development Corporation does not controlthis property. Removal of the tree would require an easement or purchase of part or all of the property.Since Sowams Road is typically not congested, we believe safe operations can be maintained alongSowams Road with the current sight distance.
5.3 Intersection Capacity Analysis
Capacity analyses for unsignalized intersections were conducted using Synchro Professional Software,version 9.0.
In discussing intersection capacity analyses results, the terms are used to describe the operatingcondition of the road or intersection. These two terms are volume to capacity ratio (v/c) and level ofservice (LOS).
The v/c ratio is a ratio of the volume of traffic using an intersection to the total capacity of theintersection (the maximum number of vehicles that can utilize the intersection during an hour). Atunsignalized intersections, the v/c ratio is typically used to describe the percentage of capacity utilizedby per approach lane where one or more legal movements must yield or stop for oncoming traffic.
LOS is a measure of the delay experienced by vehicles at an intersection. LOS is rated on a scale from Ato F, with A describing a condition of very low delay (less than 10 seconds per vehicle), and F describinga condition where delays will exceed 50 seconds per vehicle for unsignalized intersections. Delay is
Site Drive looking south

\\private\dfs\ProjectData\P2012\1033\A20\Traffic\TIS\TRAFFIC IMPACT STUDY-Palmer Pointe.docx 9
described as a measure of driver discomfort, frustration, fuel consumption, and lost travel time.Therefore, intersections with longer delay times are less acceptable to most drivers.
These definitions for v/c ratio and LOS, as well as the methodology for conducting signalized andunsignalized intersection capacity analyses, are taken from the “2000 Highway Capacity Manual”published by the Transportation Research Board.
In discussing two-way stop controlled unsignalized intersection capacity analyses, LOS is used toprovide a description of the delay and operational characteristics of individual lanes or lane groupswhere one or more legal movements require stopping or yielding to oncoming traffic. Vehicles in lanesor lane groups where no legal movement requires stopping or yielding to oncoming traffic do notexperience delay, therefore they are not rated with a level of service.
Using the above referenced methodologies, AM and PM peak hour capacity analyses were conducted atthe following unsignalized intersections:
· Sowams Road at the Site Drive· Sowams Road at Kent Street· Sowams Road at Route 114 (County Road)
Table No. 3 of Appendix A presents a summary of the levels of service at the unsignalized intersections,for both No-Build and Build Conditions traffic volumes. Copies of the analysis worksheets can befound in Appendices C and D, for the AM and PM peak hours respectively.
The determination of the traffic impact from the proposed development is made through a comparisonof the No-Build condition LOS (without the proposed development) versus the Build condition LOS(with the proposed development).
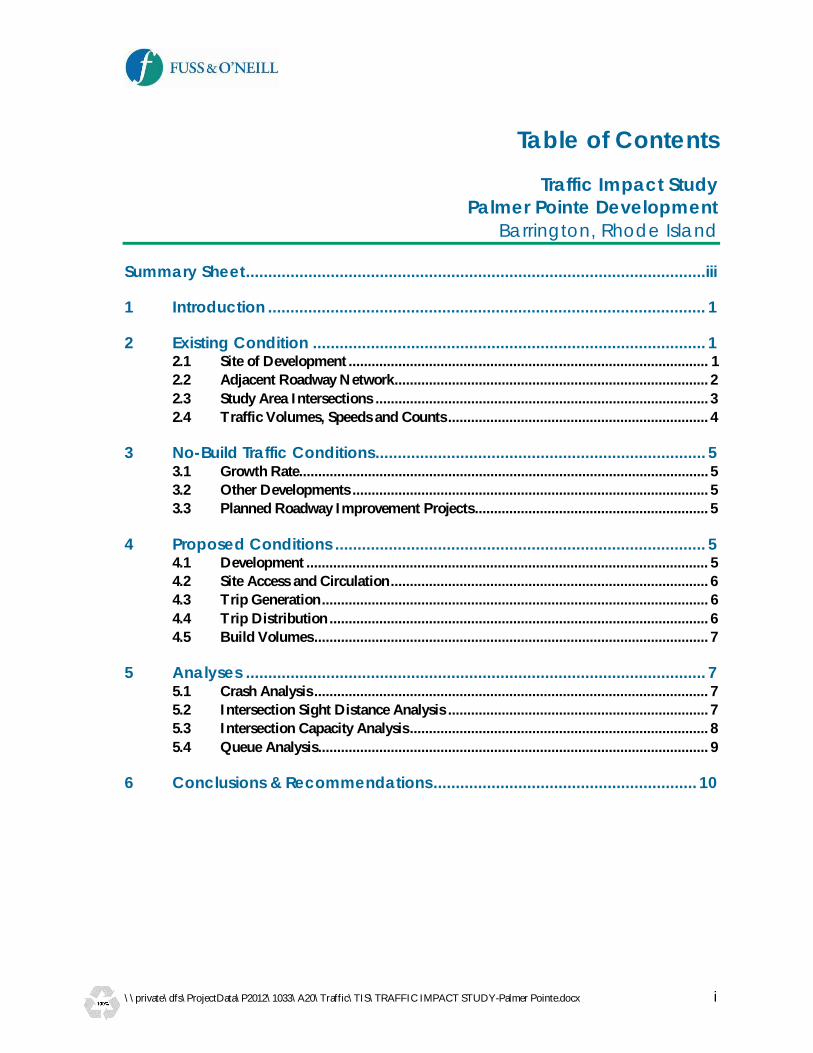
At all three intersections, levels of service remained unchanged between the 2020 No-Build and Buildconditions. The intersections at Kent Street and the Site Drive are anticipated to operate at LOS B andLOS A, respectively. However, the intersection of Sowams Road and County Road exhibit LOS Fconditions for the southbound, left turning traffic. The much higher traffic volumes on County Roadcause a significant delay for this approach, as left-turning vehicles must wait for a break in the traffic onCounty Road in both directions before continuing eastbound. The analyses show that this left turnmovement is currently over capacity, and significantly so during the afternoon peak hour. However, thecapacity analysis does indicate that this development will have very little impact on the extent to whichthis movement is over capacity.
5.4 Queue Analysis
No-Build and Build Condition 95th percentile (design) queue lengths were reviewed at each intersectionin the study area. The 95th percentile (design) vehicle queue lengths represent the maximum queuelengths that can be expected at each of the critical approach lanes of the study area intersections. Thequeue lengths are provided in the Synchro capacity analysis worksheets, which are located in Appendices

\\private\dfs\ProjectData\P2012\1033\A20\Traffic\TIS\TRAFFIC IMPACT STUDY-Palmer Pointe.docx 10
C and D. Tables 5 and 6 of Appendix A provide a summary of the queue lengths for the critical lanes ateach intersection.
The Synchro analyses indicate that none of the study intersection approaches will exhibit substantiallyincreased queue lengths. The No-Build queues at the southbound left turn approach on Sowams Roadare approximately 155 feet during the morning peak hour and 260 feet during the afternoon peak hour.The addition of the proposed site-generated traffic is expected to increase these queues byapproximately 15 feet, or less than one car length, during the peak hours.
6 Conclusions & RecommendationsThe purpose of preparing a traffic impact study is to identify the impact of the proposed development’ssite generated traffic. The study efforts have indicated that the proposed development will generate 29new entering and exiting trips in the AM peak hour, and 30 new entering and exiting trips in the PMpeak hour.
The levels of service at the three study area intersections are expected to remain the same with theaddition of site-generated traffic through the neighboring roadway network. A slight increase in delaysassociated with this traffic can be expected at the Sowams Road intersection with County Road, whichintersection already exhibits considerable delays in the existing condition. While full-day counts were notconducted for this intersection, based on the peak hour traffic volumes, it seems unlikely that thisintersection would meet the eight-hour traffic volume warrants for a signal to be approved by RIDOTand installed at the intersection.
Both the number and severity of crashes within the study area are not abnormal for the existing trafficvolumes and intersection geometry on the neighboring roadway network.
Adequate sight distance is available from the site driveway in both directions on Sowams Road, thoughit is slightly constrained by an existing tree to the south of the site. Since Sowams Road is typically notcongested, we believe safe operations can be maintained along Sowams Road with the current sightdistance.
Based on the results of the foregoing analysis, it is the professional opinion of Fuss & O'Neill, Inc. thatthe proposed development, along with the recommendations outlined above, (if any) will not have asignificant impact to traffic operations within the study area.

\\private\dfs\ProjectData\P2012\1033\A20\Traffic\TIS\TRAFFIC IMPACT STUDY-Palmer Pointe.docx
Appendix A
Tables

\\private\dfs\ProjectData\P2012\1033\A20\Traffic\TIS\TRAFFIC IMPACT STUDY-Palmer Pointe.docx
Table 1
Peak Hour Site Generated Traffic VolumesPalmer PointeBarrington, RI
42 Unit Residential Development Total Trips Trips Entering Trips ExitingAM Peak Hour 29 10 19
PM Peak Hour 30 19 11Note: Trip generation based on Rate per Land use Code 224 (Rental Townhouse), as published in TripGeneration, 9th Edition, 2012.

\\private\dfs\ProjectData\P2012\1033\A20\Traffic\TIS\TRAFFIC IMPACT STUDY-Palmer Pointe.docx
Table 2
Intersection Crash Data SummaryPalmer PointeBarrington, RI
Intersections/Road SegmentsCrashes Per Year
2013 2014 2015 Average/Year
Sowams Road at Route 114 (County Road)* 0 5 4 3
Sowams Road Between County Road and Kent Street 0 0 0 0
Sowams Road at Kent Street* 0 0 0 0*Values indicated are number of crashes within 200 feet of each intersection during time period shown. Data provided by the Town of Barrington Police Department.

\\private\dfs\ProjectData\P2012\1033\A20\Traffic\TIS\TRAFFIC IMPACT STUDY-Palmer Pointe.docx
Table 3
Unsignalized Intersection Level of Service SummaryPalmer PointeBarrington, RI
Two-Way Stop Controlled Intersections(Critical Movements)
2020 AMPeak Hour
2020 PMPeak Hour
No-Build Build No-Build Build
Sowams Road at Kent Street
Eastbound Left Turn B/0.28 B/0.29 B/0.06 B/0.07
Westbound Left Turn B/0.07 B/0.07 B/0.04 B/0.04
Sowams Road at Site Drive
Westbound Left Turn N/A A/0.03 N/A A/0.02
Southbound Left Turn N/A A/0.00 N/A A/0.01
Sowams Road at County Road
Southbound Left Turn F/1.04 F/1.11 F/1.67 F/1.75
Southbound Right Turn C/0.14 C/0.15 C/0.10 C/0.11
Eastbound Left Turn A/0.07 A/0.07 A/0.05 A/0.05*Values indicated are critical movement Level of Service (LOS)/v/c Ratio

\\private\dfs\ProjectData\P2012\1033\A20\Traffic\TIS\TRAFFIC IMPACT STUDY-Palmer Pointe.docx
Table 4
AM Peak Hour Queue Length SummaryPalmer PointeBarrington, RI
Intersection Approach Lane2020
No-Build Queue2020
Build QueueAvailableStorage
Sowams Road at Kent Street EastboundWestboundNorthboundSouthbound
30 Feet5 Feet5 Feet5 Feet
30 Feet5 Feet5 Feet5 Feet
250 Feet100 Feet250 Feet250 Feet
Sowams Road at Site Drive WestboundNorthboundSouthbound
N/AN/AN/A
5 Feet0 Feet0 Feet
100 Feet250 Feet250 Feet
Sowams Road at County Road EastboundWestbound
Southbound LeftSouthbound Right
5 Feet0 Feet
155 Feet10 Feet
5 Feet0 Feet
170 Feet15 Feet
250 Feet250 Feet500 Feet50 Feet
NOTE: Values indicated represent 95th percentile (design) vehicle queue lengths. Values are rounded to the nearest 5 feet.

\\private\dfs\ProjectData\P2012\1033\A20\Traffic\TIS\TRAFFIC IMPACT STUDY-Palmer Pointe.docx
Table 5
PM Peak Hour Queue Length SummaryPalmer PointeBarrington, RI
Intersection Approach Lane2020
No-Build Queue2020
Build QueueAvailableStorage
Sowams Road at Kent Street EastboundWestboundNorthboundSouthbound
5 Feet5 Feet0 Feet0 Feet
5 Feet5 Feet0 Feet0 Feet
250 Feet100 Feet250 Feet250 Feet
Sowams Road at Site Drive WestboundNorthboundSouthbound
N/AN/AN/A
0 Feet0 Feet0 Feet
100 Feet250 Feet250 Feet
Sowams Road at County Road EastboundWestbound
Southbound LeftSouthbound Right
5 Feet0 Feet
260 Feet10 Feet
5 Feet0 Feet
275 Feet10 Feet
250 Feet250 Feet500 Feet50 Feet
NOTE: Values indicated represent 95th percentile (design) vehicle queue lengths. Values are rounded to the nearest 5 feet.

\\private\dfs\ProjectData\P2012\1033\A20\Traffic\TIS\TRAFFIC IMPACT STUDY-Palmer Pointe.docx
Appendix B
Figures

PROJ. No.:
DATE:
MS
V
IE
W:
LA
YE
R S
TA
TE
:
SCALE:
DATUM:
VERT.:
HORZ.:
VERT.:
HORZ.:
File P
ath: J:\D
WG
\P
2012\1033\A
20\C
ivil\P
lan\20121033A
20_LO
C01_U
SG
S.dw
g Layout: F
IG
UR
E 1
P
lotted: F
ri, F
ebruary 26, 2016 - 2:09 P
M U
ser: kpariseau
Plotter: D
WG
T
O P
DF
(M
ER
GE
).P
C3
C
TB
F
ile: F
O.S
TB
20121033.A20
MARCH 2016
EAST BAY COMMUNITY DEVELOPMENT
SITE LOCATION MAPPALMER POINTE NEIGHBORHOOD
BARRINGTON RHODE ISLAND
1" = 1500'
317 IRON HORSE WAY, SUITE 204PROVIDENCE, RI 02908401.861.3070www.fando.com
SITELOCATION
SITE LOCATION
CORPORATION

XX(XX) = WEEKDAY MORNING PEAK HOUR (WEEKDAY PM PEAK HOUR)
KENT
STREET
ROUTE 114
(COUNTY ROAD)
SO
WAM
S RO
AD
SITE
DRIVE
OAK GROVE
AVENUE
SO
WAM
S
RO
AD
146 HARTFORD ROADMANCHESTER, CONNECTICUT 06040860.646.2469www.fando.com
File P
ath: J:\D
WG
\P
2012\1033\A
20\C
ivil\T
raffic F
igures\20121033A
20_T
VF
01.dw
g Layout: F
IG
. 2 - E
XIS
TIN
G P
lotted: F
ri, F
ebruary 26, 2016 - 2:06 P
M U
ser: K
AT
HE
RIN
E P
AR
IS
EA
U

XX(XX) = WEEKDAY MORNING PEAK HOUR (WEEKDAY PM PEAK HOUR)
KENT
STREET
ROUTE 114
(COUNTY ROAD)
SO
WAM
S RO
AD
SITE
DRIVE
OAK GROVE
AVENUE
SO
WAM
S
RO
AD
File P
ath: J:\D
WG
\P
2012\1033\A
20\C
ivil\T
raffic F
igures\20121033A
20_T
VF
01.dw
g Layout: F
IG
. 3 - O
TH
ER
G
EN
P
lotted: F
ri, F
ebruary 26, 2016 - 2:04 P
M U
ser: K
AT
HE
RIN
E P
AR
IS
EA
U
146 HARTFORD ROADMANCHESTER, CONNECTICUT 06040860.646.2469www.fando.com

XX(XX) = WEEKDAY MORNING PEAK HOUR (WEEKDAY PM PEAK HOUR)
KENT
STREET
ROUTE 114
(COUNTY ROAD)
SO
WAM
S RO
AD
SITE
DRIVE
OAK GROVE
AVENUE
SO
WAM
S
RO
AD
146 HARTFORD ROADMANCHESTER, CONNECTICUT 06040860.646.2469www.fando.com
File P
ath: J:\D
WG
\P
2012\1033\A
20\C
ivil\T
raffic F
igures\20121033A
20_T
VF
01.dw
g Layout: F
IG
. 4 - B
AC
KG
RO
UN
D P
lotted: F
ri, F
ebruary 26, 2016 - 2:02 P
M U
ser: K
AT
HE
RIN
E P
AR
IS
EA
U

XX(XX) = ENTERING TRAFFIC (EXITING TRAFFIC)
KENT
STREET
ROUTE 114
(COUNTY ROAD)
SO
WAM
S RO
AD
SITE
DRIVE
OAK GROVE
AVENUE
SO
WAM
S
RO
AD
146 HARTFORD ROADMANCHESTER, CONNECTICUT 06040860.646.2469www.fando.com
File P
ath: J:\D
WG
\P
2012\1033\A
20\C
ivil\T
raffic F
igures\20121033A
20_T
VF
01.dw
g Layout: F
IG
. 5 - D
IS
TR
IB
UT
IO
N P
lotted: F
ri, F
ebruary 26, 2016 - 2:07 P
M U
ser: K
AT
HE
RIN
E P
AR
IS
EA
U

SITE GENERATED TRAFFIC VOLUMES
ENTER EXIT TOTAL
MORNING
10 19 29
AFTERNOON
19 11 30
XX(XX) = WEEKDAY MORNING PEAK HOUR (WEEKDAY PM PEAK HOUR)
KENT
STREET
ROUTE 114
(COUNTY ROAD)
SO
WAM
S RO
AD
SITE
DRIVE
OAK GROVE
AVENUE
SO
WAM
S
RO
AD
146 HARTFORD ROADMANCHESTER, CONNECTICUT 06040860.646.2469www.fando.com
File P
ath: J:\D
WG
\P
2012\1033\A
20\C
ivil\T
raffic F
igures\20121033A
20_T
VF
01.dw
g Layout: F
IG
. 6 - T
RIP
G
EN
P
lotted: F
ri, F
ebruary 26, 2016 - 2:07 P
M U
ser: K
AT
HE
RIN
E P
AR
IS
EA
U

XX(XX) = WEEKDAY MORNING PEAK HOUR (WEEKDAY PM PEAK HOUR)
KENT
STREET
ROUTE 114
(COUNTY ROAD)
SO
WAM
S RO
AD
SITE
DRIVE
OAK GROVE
AVENUE
SO
WAM
S
RO
AD
146 HARTFORD ROADMANCHESTER, CONNECTICUT 06040860.646.2469www.fando.com
File P
ath: J:\D
WG
\P
2012\1033\A
20\C
ivil\T
raffic F
igures\20121033A
20_T
VF
01.dw
g Layout: F
IG
. 7 - C
OM
BIN
ED
P
lotted: F
ri, F
ebruary 26, 2016 - 2:02 P
M U
ser: K
AT
HE
RIN
E P
AR
IS
EA
U

\\private\dfs\ProjectData\P2012\1033\A20\Traffic\TIS\TRAFFIC IMPACT STUDY-Palmer Pointe.docx
Appendix C
Intersection Capacity Analysis WorksheetsAM Peak Hour

HCM Unsignalized Intersection Capacity Analysis Palmer Pointe1: Sowams Road & Kent Street/Oak Grove Avenue AM No-Build
Fuss & O'Neill - KAP Synchro 9 ReportF:\P2012\1033\A20\Traffic\Synchro\AM Background.syn Page 1
Movement EBL EBT EBR WBL WBT WBR NBL NBT NBR SBL SBT SBRLane ConfigurationsTraffic Volume (veh/h) 104 19 21 8 12 19 20 144 19 11 96 71Future Volume (Veh/h) 104 19 21 8 12 19 20 144 19 11 96 71Sign Control Stop Stop Free FreeGrade 0% 0% 0% 0%Peak Hour Factor 0.92 0.92 0.92 0.92 0.92 0.92 0.92 0.92 0.92 0.92 0.92 0.92Hourly flow rate (vph) 113 21 23 9 13 21 22 157 21 12 104 77PedestriansLane Width (ft)Walking Speed (ft/s)Percent BlockageRight turn flare (veh)Median type None NoneMedian storage veh)Upstream signal (ft)pX, platoon unblockedvC, conflicting volume 406 388 142 412 416 168 181 178vC1, stage 1 conf volvC2, stage 2 conf volvCu, unblocked vol 406 388 142 412 416 168 181 178tC, single (s) 7.1 6.5 6.2 7.1 6.5 6.2 4.1 4.1tC, 2 stage (s)tF (s) 3.5 4.0 3.3 3.5 4.0 3.3 2.2 2.2p0 queue free % 78 96 97 98 97 98 98 99cM capacity (veh/h) 522 533 905 511 514 877 1394 1398
Direction, Lane # EB 1 WB 1 NB 1 SB 1Volume Total 157 43 200 193Volume Left 113 9 22 12Volume Right 23 21 21 77cSH 558 643 1394 1398Volume to Capacity 0.28 0.07 0.02 0.01Queue Length 95th (ft) 29 5 1 1Control Delay (s) 14.0 11.0 1.0 0.5Lane LOS B B A AApproach Delay (s) 14.0 11.0 1.0 0.5Approach LOS B B
Intersection SummaryAverage Delay 5.0Intersection Capacity Utilization 36.5% ICU Level of Service AAnalysis Period (min) 15

HCM Unsignalized Intersection Capacity Analysis Palmer Pointe2: Sowams Road & Site Drive AM No-Build
Fuss & O'Neill - KAP Synchro 9 ReportF:\P2012\1033\A20\Traffic\Synchro\AM Background.syn Page 2
Movement WBL WBR NBT NBR SBL SBTLane ConfigurationsTraffic Volume (veh/h) 0 0 148 0 0 125Future Volume (Veh/h) 0 0 148 0 0 125Sign Control Stop Free FreeGrade 0% 0% 0%Peak Hour Factor 0.92 0.92 0.92 0.92 0.92 0.92Hourly flow rate (vph) 0 0 161 0 0 136PedestriansLane Width (ft)Walking Speed (ft/s)Percent BlockageRight turn flare (veh)Median type None NoneMedian storage veh)Upstream signal (ft)pX, platoon unblockedvC, conflicting volume 297 161 161vC1, stage 1 conf volvC2, stage 2 conf volvCu, unblocked vol 297 161 161tC, single (s) 6.4 6.2 4.1tC, 2 stage (s)tF (s) 3.5 3.3 2.2p0 queue free % 100 100 100cM capacity (veh/h) 694 884 1418
Direction, Lane # WB 1 NB 1 SB 1Volume Total 0 161 136Volume Left 0 0 0Volume Right 0 0 0cSH 1700 1700 1418Volume to Capacity 0.00 0.09 0.00Queue Length 95th (ft) 0 0 0Control Delay (s) 0.0 0.0 0.0Lane LOS AApproach Delay (s) 0.0 0.0 0.0Approach LOS A
Intersection SummaryAverage Delay 0.0Intersection Capacity Utilization 11.1% ICU Level of Service AAnalysis Period (min) 15
HCM Unsignalized Intersection Capacity Analysis Palmer Pointe3: County Road (Rt 114) & Sowams Road AM No-Build
Fuss & O'Neill - KAP Synchro 9 ReportF:\P2012\1033\A20\Traffic\Synchro\AM Background.syn Page 3
Movement EBL EBT WBT WBR SEL SERLane ConfigurationsTraffic Volume (veh/h) 47 662 776 101 87 44Future Volume (Veh/h) 47 662 776 101 87 44Sign Control Free Free StopGrade 0% 0% 0%Peak Hour Factor 0.92 0.92 0.92 0.92 0.92 0.92Hourly flow rate (vph) 51 720 843 110 95 48PedestriansLane Width (ft)Walking Speed (ft/s)Percent BlockageRight turn flare (veh)Median type None NoneMedian storage veh)Upstream signal (ft)pX, platoon unblockedvC, conflicting volume 953 1720 898vC1, stage 1 conf volvC2, stage 2 conf volvCu, unblocked vol 953 1720 898tC, single (s) 4.1 6.4 6.2tC, 2 stage (s)tF (s) 2.2 3.5 3.3p0 queue free % 93 0 86cM capacity (veh/h) 721 91 338
Direction, Lane # EB 1 WB 1 SE 1 SE 2Volume Total 771 953 95 48Volume Left 51 0 95 0Volume Right 0 110 0 48cSH 721 1700 91 338Volume to Capacity 0.07 0.56 1.04 0.14Queue Length 95th (ft) 6 0 155 12Control Delay (s) 1.9 0.0 189.2 17.4Lane LOS A F CApproach Delay (s) 1.9 0.0 131.5Approach LOS F
Intersection SummaryAverage Delay 10.8Intersection Capacity Utilization 85.0% ICU Level of Service EAnalysis Period (min) 15

HCM Unsignalized Intersection Capacity Analysis Palmer Pointe1: Sowams Road & Kent Street/Oak Grove Avenue AM Build
Fuss & O'Neill - KAP Synchro 9 ReportF:\P2012\1033\A20\Traffic\Synchro\AM Combined.syn Page 1
Movement EBL EBT EBR WBL WBT WBR NBL NBT NBR SBL SBT SBRLane ConfigurationsTraffic Volume (veh/h) 104 19 22 8 12 19 22 153 19 11 101 71Future Volume (Veh/h) 104 19 22 8 12 19 22 153 19 11 101 71Sign Control Stop Stop Free FreeGrade 0% 0% 0% 0%Peak Hour Factor 0.92 0.92 0.92 0.92 0.92 0.92 0.92 0.92 0.92 0.92 0.92 0.92Hourly flow rate (vph) 113 21 24 9 13 21 24 166 21 12 110 77PedestriansLane Width (ft)Walking Speed (ft/s)Percent BlockageRight turn flare (veh)Median type None NoneMedian storage veh)Upstream signal (ft)pX, platoon unblockedvC, conflicting volume 424 408 148 432 436 176 187 187vC1, stage 1 conf volvC2, stage 2 conf volvCu, unblocked vol 424 408 148 432 436 176 187 187tC, single (s) 7.1 6.5 6.2 7.1 6.5 6.2 4.1 4.1tC, 2 stage (s)tF (s) 3.5 4.0 3.3 3.5 4.0 3.3 2.2 2.2p0 queue free % 78 96 97 98 97 98 98 99cM capacity (veh/h) 506 519 898 494 501 867 1387 1387
Direction, Lane # EB 1 WB 1 NB 1 SB 1Volume Total 158 43 211 199Volume Left 113 9 24 12Volume Right 24 21 21 77cSH 544 629 1387 1387Volume to Capacity 0.29 0.07 0.02 0.01Queue Length 95th (ft) 30 5 1 1Control Delay (s) 14.3 11.1 1.0 0.5Lane LOS B B A AApproach Delay (s) 14.3 11.1 1.0 0.5Approach LOS B B
Intersection SummaryAverage Delay 5.0Intersection Capacity Utilization 37.8% ICU Level of Service AAnalysis Period (min) 15

HCM Unsignalized Intersection Capacity Analysis Palmer Pointe2: Sowams Road & Site Drive AM Build
Fuss & O'Neill - KAP Synchro 9 ReportF:\P2012\1033\A20\Traffic\Synchro\AM Combined.syn Page 2
Movement WBL WBR NBT NBR SBL SBTLane ConfigurationsTraffic Volume (veh/h) 8 11 148 4 6 125Future Volume (Veh/h) 8 11 148 4 6 125Sign Control Stop Free FreeGrade 0% 0% 0%Peak Hour Factor 0.92 0.92 0.92 0.92 0.92 0.92Hourly flow rate (vph) 9 12 161 4 7 136PedestriansLane Width (ft)Walking Speed (ft/s)Percent BlockageRight turn flare (veh)Median type None NoneMedian storage veh)Upstream signal (ft)pX, platoon unblockedvC, conflicting volume 313 163 165vC1, stage 1 conf volvC2, stage 2 conf volvCu, unblocked vol 313 163 165tC, single (s) 6.4 6.2 4.1tC, 2 stage (s)tF (s) 3.5 3.3 2.2p0 queue free % 99 99 100cM capacity (veh/h) 676 882 1413
Direction, Lane # WB 1 NB 1 SB 1Volume Total 21 165 143Volume Left 9 0 7Volume Right 12 4 0cSH 780 1700 1413Volume to Capacity 0.03 0.10 0.00Queue Length 95th (ft) 2 0 0Control Delay (s) 9.7 0.0 0.4Lane LOS A AApproach Delay (s) 9.7 0.0 0.4Approach LOS A
Intersection SummaryAverage Delay 0.8Intersection Capacity Utilization 21.5% ICU Level of Service AAnalysis Period (min) 15

HCM Unsignalized Intersection Capacity Analysis Palmer Pointe3: County Road (Rt 114) & Sowams Road AM Build
Fuss & O'Neill - KAP Synchro 9 ReportF:\P2012\1033\A20\Traffic\Synchro\AM Combined.syn Page 3
Movement EBL EBT WBT WBR SEL SERLane ConfigurationsTraffic Volume (veh/h) 48 662 776 104 93 46Future Volume (Veh/h) 48 662 776 104 93 46Sign Control Free Free StopGrade 0% 0% 0%Peak Hour Factor 0.92 0.92 0.92 0.92 0.92 0.92Hourly flow rate (vph) 52 720 843 113 101 50PedestriansLane Width (ft)Walking Speed (ft/s)Percent BlockageRight turn flare (veh)Median type None NoneMedian storage veh)Upstream signal (ft)pX, platoon unblockedvC, conflicting volume 956 1724 900vC1, stage 1 conf volvC2, stage 2 conf volvCu, unblocked vol 956 1724 900tC, single (s) 4.1 6.4 6.2tC, 2 stage (s)tF (s) 2.2 3.5 3.3p0 queue free % 93 0 85cM capacity (veh/h) 719 91 337
Direction, Lane # EB 1 WB 1 SE 1 SE 2Volume Total 772 956 101 50Volume Left 52 0 101 0Volume Right 0 113 0 50cSH 719 1700 91 337Volume to Capacity 0.07 0.56 1.11 0.15Queue Length 95th (ft) 6 0 171 13Control Delay (s) 1.9 0.0 213.0 17.5Lane LOS A F CApproach Delay (s) 1.9 0.0 148.3Approach LOS F
Intersection SummaryAverage Delay 12.7Intersection Capacity Utilization 86.1% ICU Level of Service EAnalysis Period (min) 15

\\private\dfs\ProjectData\P2012\1033\A20\Traffic\TIS\TRAFFIC IMPACT STUDY-Palmer Pointe.docx
Appendix D
Intersection Capacity Analysis WorksheetsPM Peak Hour
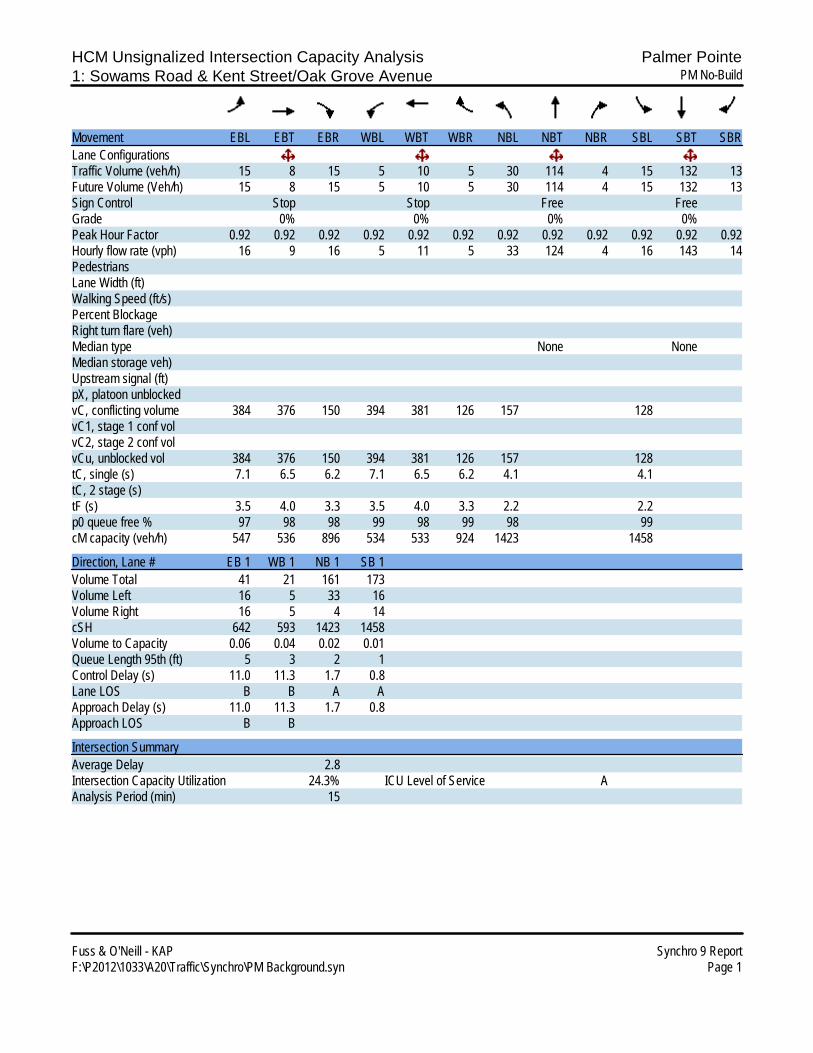
HCM Unsignalized Intersection Capacity Analysis Palmer Pointe1: Sowams Road & Kent Street/Oak Grove Avenue PM No-Build
Fuss & O'Neill - KAP Synchro 9 ReportF:\P2012\1033\A20\Traffic\Synchro\PM Background.syn Page 1
Movement EBL EBT EBR WBL WBT WBR NBL NBT NBR SBL SBT SBRLane ConfigurationsTraffic Volume (veh/h) 15 8 15 5 10 5 30 114 4 15 132 13Future Volume (Veh/h) 15 8 15 5 10 5 30 114 4 15 132 13Sign Control Stop Stop Free FreeGrade 0% 0% 0% 0%Peak Hour Factor 0.92 0.92 0.92 0.92 0.92 0.92 0.92 0.92 0.92 0.92 0.92 0.92Hourly flow rate (vph) 16 9 16 5 11 5 33 124 4 16 143 14PedestriansLane Width (ft)Walking Speed (ft/s)Percent BlockageRight turn flare (veh)Median type None NoneMedian storage veh)Upstream signal (ft)pX, platoon unblockedvC, conflicting volume 384 376 150 394 381 126 157 128vC1, stage 1 conf volvC2, stage 2 conf volvCu, unblocked vol 384 376 150 394 381 126 157 128tC, single (s) 7.1 6.5 6.2 7.1 6.5 6.2 4.1 4.1tC, 2 stage (s)tF (s) 3.5 4.0 3.3 3.5 4.0 3.3 2.2 2.2p0 queue free % 97 98 98 99 98 99 98 99cM capacity (veh/h) 547 536 896 534 533 924 1423 1458
Direction, Lane # EB 1 WB 1 NB 1 SB 1Volume Total 41 21 161 173Volume Left 16 5 33 16Volume Right 16 5 4 14cSH 642 593 1423 1458Volume to Capacity 0.06 0.04 0.02 0.01Queue Length 95th (ft) 5 3 2 1Control Delay (s) 11.0 11.3 1.7 0.8Lane LOS B B A AApproach Delay (s) 11.0 11.3 1.7 0.8Approach LOS B B
Intersection SummaryAverage Delay 2.8Intersection Capacity Utilization 24.3% ICU Level of Service AAnalysis Period (min) 15

HCM Unsignalized Intersection Capacity Analysis Palmer Pointe2: Sowams Road & Site Drive PM No-Build
Fuss & O'Neill - KAP Synchro 9 ReportF:\P2012\1033\A20\Traffic\Synchro\PM Background.syn Page 2
Movement WBL WBR NBT NBR SBL SBTLane ConfigurationsTraffic Volume (veh/h) 0 0 133 0 0 152Future Volume (Veh/h) 0 0 133 0 0 152Sign Control Stop Free FreeGrade 0% 0% 0%Peak Hour Factor 0.92 0.92 0.92 0.92 0.92 0.92Hourly flow rate (vph) 0 0 145 0 0 165PedestriansLane Width (ft)Walking Speed (ft/s)Percent BlockageRight turn flare (veh)Median type None NoneMedian storage veh)Upstream signal (ft)pX, platoon unblockedvC, conflicting volume 310 145 145vC1, stage 1 conf volvC2, stage 2 conf volvCu, unblocked vol 310 145 145tC, single (s) 6.4 6.2 4.1tC, 2 stage (s)tF (s) 3.5 3.3 2.2p0 queue free % 100 100 100cM capacity (veh/h) 682 902 1437
Direction, Lane # WB 1 NB 1 SB 1Volume Total 0 145 165Volume Left 0 0 0Volume Right 0 0 0cSH 1700 1700 1437Volume to Capacity 0.00 0.09 0.00Queue Length 95th (ft) 0 0 0Control Delay (s) 0.0 0.0 0.0Lane LOS AApproach Delay (s) 0.0 0.0 0.0Approach LOS A
Intersection SummaryAverage Delay 0.0Intersection Capacity Utilization 11.3% ICU Level of Service AAnalysis Period (min) 15

HCM Unsignalized Intersection Capacity Analysis Palmer Pointe3: County Road (Rt 114) & Sowams Road PM No-Build
Fuss & O'Neill - KAP Synchro 9 ReportF:\P2012\1033\A20\Traffic\Synchro\PM Background.syn Page 3
Movement EBL EBT WBT WBR SEL SERLane ConfigurationsTraffic Volume (veh/h) 30 789 851 103 110 28Future Volume (Veh/h) 30 789 851 103 110 28Sign Control Free Free StopGrade 0% 0% 0%Peak Hour Factor 0.92 0.92 0.92 0.92 0.92 0.92Hourly flow rate (vph) 33 858 925 112 120 30PedestriansLane Width (ft)Walking Speed (ft/s)Percent BlockageRight turn flare (veh)Median type None NoneMedian storage veh)Upstream signal (ft)pX, platoon unblockedvC, conflicting volume 1037 1905 981vC1, stage 1 conf volvC2, stage 2 conf volvCu, unblocked vol 1037 1905 981tC, single (s) 4.1 6.4 6.2tC, 2 stage (s)tF (s) 2.2 3.5 3.3p0 queue free % 95 0 90cM capacity (veh/h) 670 72 303
Direction, Lane # EB 1 WB 1 SE 1 SE 2Volume Total 891 1037 120 30Volume Left 33 0 120 0Volume Right 0 112 0 30cSH 670 1700 72 303Volume to Capacity 0.05 0.61 1.67 0.10Queue Length 95th (ft) 4 0 259 8Control Delay (s) 1.4 0.0 452.6 18.2Lane LOS A F CApproach Delay (s) 1.4 0.0 365.7Approach LOS F
Intersection SummaryAverage Delay 27.0Intersection Capacity Utilization 78.6% ICU Level of Service DAnalysis Period (min) 15

HCM Unsignalized Intersection Capacity Analysis Palmer Pointe1: Sowams Road & Kent Street/Oak Grove Avenue PM Build
Fuss & O'Neil - KAP Synchro 9 ReportF:\P2012\1033\A20\Traffic\Synchro\PM Combined.syn Page 1
Movement EBL EBT EBR WBL WBT WBR NBL NBT NBR SBL SBT SBRLane ConfigurationsTraffic Volume (veh/h) 15 8 17 5 10 5 31 119 4 15 141 13Future Volume (Veh/h) 15 8 17 5 10 5 31 119 4 15 141 13Sign Control Stop Stop Free FreeGrade 0% 0% 0% 0%Peak Hour Factor 0.92 0.92 0.92 0.92 0.92 0.92 0.92 0.92 0.92 0.92 0.92 0.92Hourly flow rate (vph) 16 9 18 5 11 5 34 129 4 16 153 14PedestriansLane Width (ft)Walking Speed (ft/s)Percent BlockageRight turn flare (veh)Median type None NoneMedian storage veh)Upstream signal (ft)pX, platoon unblockedvC, conflicting volume 402 393 160 414 398 131 167 133vC1, stage 1 conf volvC2, stage 2 conf volvCu, unblocked vol 402 393 160 414 398 131 167 133tC, single (s) 7.1 6.5 6.2 7.1 6.5 6.2 4.1 4.1tC, 2 stage (s)tF (s) 3.5 4.0 3.3 3.5 4.0 3.3 2.2 2.2p0 queue free % 97 98 98 99 98 99 98 99cM capacity (veh/h) 533 524 885 517 521 919 1411 1452
Direction, Lane # EB 1 WB 1 NB 1 SB 1Volume Total 43 21 167 183Volume Left 16 5 34 16Volume Right 18 5 4 14cSH 637 580 1411 1452Volume to Capacity 0.07 0.04 0.02 0.01Queue Length 95th (ft) 5 3 2 1Control Delay (s) 11.1 11.4 1.7 0.7Lane LOS B B A AApproach Delay (s) 11.1 11.4 1.7 0.7Approach LOS B B
Intersection SummaryAverage Delay 2.7Intersection Capacity Utilization 25.2% ICU Level of Service AAnalysis Period (min) 15

HCM Unsignalized Intersection Capacity Analysis Palmer Pointe2: Sowams Road & Site Drive PM Build
Fuss & O'Neil - KAP Synchro 9 ReportF:\P2012\1033\A20\Traffic\Synchro\PM Combined.syn Page 2
Movement WBL WBR NBT NBR SBL SBTLane ConfigurationsTraffic Volume (veh/h) 5 6 133 8 11 152Future Volume (Veh/h) 5 6 133 8 11 152Sign Control Stop Free FreeGrade 0% 0% 0%Peak Hour Factor 0.92 0.92 0.92 0.92 0.92 0.92Hourly flow rate (vph) 5 7 145 9 12 165PedestriansLane Width (ft)Walking Speed (ft/s)Percent BlockageRight turn flare (veh)Median type None NoneMedian storage veh)Upstream signal (ft)pX, platoon unblockedvC, conflicting volume 338 150 154vC1, stage 1 conf volvC2, stage 2 conf volvCu, unblocked vol 338 150 154tC, single (s) 6.4 6.2 4.1tC, 2 stage (s)tF (s) 3.5 3.3 2.2p0 queue free % 99 99 99cM capacity (veh/h) 652 897 1426
Direction, Lane # WB 1 NB 1 SB 1Volume Total 12 154 177Volume Left 5 0 12Volume Right 7 9 0cSH 775 1700 1426Volume to Capacity 0.02 0.09 0.01Queue Length 95th (ft) 1 0 1Control Delay (s) 9.7 0.0 0.6Lane LOS A AApproach Delay (s) 9.7 0.0 0.6Approach LOS A
Intersection SummaryAverage Delay 0.6Intersection Capacity Utilization 27.0% ICU Level of Service AAnalysis Period (min) 15

HCM Unsignalized Intersection Capacity Analysis Palmer Pointe3: County Road (Rt 114) & Sowams Road PM Build
Fuss & O'Neil - KAP Synchro 9 ReportF:\P2012\1033\A20\Traffic\Synchro\PM Combined.syn Page 3
Movement EBL EBT WBT WBR SEL SERLane ConfigurationsTraffic Volume (veh/h) 32 789 851 109 114 29Future Volume (Veh/h) 32 789 851 109 114 29Sign Control Free Free StopGrade 0% 0% 0%Peak Hour Factor 0.92 0.92 0.92 0.92 0.92 0.92Hourly flow rate (vph) 35 858 925 118 124 32PedestriansLane Width (ft)Walking Speed (ft/s)Percent BlockageRight turn flare (veh)Median type None NoneMedian storage veh)Upstream signal (ft)pX, platoon unblockedvC, conflicting volume 1043 1912 984vC1, stage 1 conf volvC2, stage 2 conf volvCu, unblocked vol 1043 1912 984tC, single (s) 4.1 6.4 6.2tC, 2 stage (s)tF (s) 2.2 3.5 3.3p0 queue free % 95 0 89cM capacity (veh/h) 667 71 301
Direction, Lane # EB 1 WB 1 SE 1 SE 2Volume Total 893 1043 124 32Volume Left 35 0 124 0Volume Right 0 118 0 32cSH 667 1700 71 301Volume to Capacity 0.05 0.61 1.75 0.11Queue Length 95th (ft) 4 0 273 9Control Delay (s) 1.5 0.0 486.9 18.4Lane LOS A F CApproach Delay (s) 1.5 0.0 390.8Approach LOS F
Intersection SummaryAverage Delay 29.8Intersection Capacity Utilization 80.4% ICU Level of Service DAnalysis Period (min) 15

\\private\dfs\ProjectData\P2012\1033\A20\Traffic\TIS\TRAFFIC IMPACT STUDY-Palmer Pointe.docx
Appendix E
Traffic Count Data

Connecticut Counts LLCKensington, Connecticut 06037
(860) 828-1693 File Name : 13856Site Code : 13856Start Date : 12/22/2015Page No : 1
Sowams Road at Kent St/Oak Grove AveBarrington, Rhode Island
Groups Printed- Unshifted - Bank 1 - Bank 2Sowams Road
From NorthOak Grove Avenue
From EastSowams Road
From SouthKent StreetFrom West
Start Time Right Thru Left Peds App. Total Right Thru Left Peds App. Total Right Thru Left Peds App. Total Right Thru Left Peds App. Total Int. Total
07:00 AM 9 9 0 0 18 2 1 0 0 3 0 21 1 0 22 3 0 1 0 4 4707:15 AM 5 22 0 1 28 1 1 0 0 2 0 47 4 1 52 2 0 3 0 5 8707:30 AM 4 14 2 0 20 3 0 0 0 3 4 37 3 0 44 6 2 10 0 18 8507:45 AM 5 30 3 1 39 8 2 3 0 13 3 41 4 0 48 1 5 31 1 38 138
Total 23 75 5 2 105 14 4 3 0 21 7 146 12 1 166 12 7 45 1 65 357
08:00 AM 35 30 3 0 68 4 3 0 0 7 3 40 7 0 50 3 2 46 0 51 17608:15 AM 27 22 3 0 52 4 7 5 0 16 9 26 6 0 41 11 10 17 0 38 14708:30 AM 7 20 1 0 28 8 4 9 0 21 12 31 10 0 53 8 2 15 0 25 12708:45 AM 6 16 0 0 22 3 1 5 0 9 7 17 6 0 30 7 1 8 0 16 77
Total 75 88 7 0 170 19 15 19 0 53 31 114 29 0 174 29 15 86 0 130 527
Grand Total 98 163 12 2 275 33 19 22 0 74 38 260 41 1 340 41 22 131 1 195 884Apprch % 35.6 59.3 4.4 0.7 44.6 25.7 29.7 0 11.2 76.5 12.1 0.3 21 11.3 67.2 0.5
Total % 11.1 18.4 1.4 0.2 31.1 3.7 2.1 2.5 0 8.4 4.3 29.4 4.6 0.1 38.5 4.6 2.5 14.8 0.1 22.1Unshifted 96 159 12 2 269 33 19 22 0 74 38 257 40 1 336 41 22 131 1 195 874
% Unshifted
Bank 1 0 2 0 0 2 0 0 0 0 0 0 0 0 0 0 0 0 0 0 0 2% Bank 1 0 1.2 0 0 0.7 0 0 0 0 0 0 0 0 0 0 0 0 0 0 0 0.2
Bank 2 2 2 0 0 4 0 0 0 0 0 0 3 1 0 4 0 0 0 0 0 8% Bank 2 2 1.2 0 0 1.5 0 0 0 0 0 0 1.2 2.4 0 1.2 0 0 0 0 0 0.9

Connecticut Counts LLCKensington, Connecticut 06037
(860) 828-1693 File Name : 13856Site Code : 13856Start Date : 12/22/2015Page No : 2
Sowams RoadFrom North
Oak Grove AvenueFrom East
Sowams RoadFrom South
Kent StreetFrom West
Start Time Right Thru Left Peds App. Total Right Thru Left Peds App. Total Right Thru Left Peds App. Total Right Thru Left Peds App. Total Int. Total
Peak Hour Analysis From 07:00 AM to 08:45 AM - Peak 1 of 1Peak Hour for Entire Intersection Begins at 07:45 AM
07:45 AM 5 30 3 1 39 8 2 3 0 13 3 41 4 0 48 1 5 31 1 38 13808:00 AM 35 30 3 0 68 4 3 0 0 7 3 40 7 0 50 3 2 46 0 51 17608:15 AM 27 22 3 0 52 4 7 5 0 16 9 26 6 0 41 11 10 17 0 38 14708:30 AM 7 20 1 0 28 8 4 9 0 21 12 31 10 0 53 8 2 15 0 25 127Total Volume 74 102 10 1 187 24 16 17 0 57 27 138 27 0 192 23 19 109 1 152 588% App. Total 39.6 54.5 5.3 0.5 42.1 28.1 29.8 0 14.1 71.9 14.1 0 15.1 12.5 71.7 0.7
PHF .529 .850 .833 .250 .688 .750 .571 .472 .000 .679 .563 .841 .675 .000 .906 .523 .475 .592 .250 .745 .835
Sowams Road
Ke
nt
Str
ee
t O
ak G
rove
Ave
nu
e
Sowams Road
Right74
Thru102
Left10
Peds1
InOut Total271 187 458
Rig
ht
24
T
hru1
6
Le
ft17
P
ed
s0
Ou
tT
ota
lIn
56
5
7
11
3
Left27
Thru138
Right27
Peds0
Out TotalIn142 192 334
Le
ft1
09
T
hru1
9
Rig
ht
23
P
ed
s1
To
tal
Ou
tIn
11
7
15
2
26
9
Peak Hour Begins at 07:45 AM UnshiftedBank 1Bank 2
Peak Hour Data
North

Connecticut Counts LLCKensington, Connecticut 06037
(860) 828-1693 File Name : 13856Site Code : 13856Start Date : 12/22/2015Page No : 3
Sowams RoadFrom North
Oak Grove AvenueFrom East
Sowams RoadFrom South
Kent StreetFrom West
Start Time Right Thru Left Peds App. Total Right Thru Left Peds App. Total Right Thru Left Peds App. Total Right Thru Left Peds App. Total Int. Total
Peak Hour Analysis From 07:00 AM to 08:45 AM - Peak 1 of 1Peak Hour for Each Approach Begins at:
07:45 AM 07:45 AM 07:15 AM 07:45 AM
+0 mins. 5 30 3 1 39 8 2 3 0 13 0 47 4 1 52 1 5 31 1 38+15 mins. 35 30 3 0 68 4 3 0 0 7 4 37 3 0 44 3 2 46 0 51+30 mins. 27 22 3 0 52 4 7 5 0 16 3 41 4 0 48 11 10 17 0 38+45 mins. 7 20 1 0 28 8 4 9 0 21 3 40 7 0 50 8 2 15 0 25Total Volume 74 102 10 1 187 24 16 17 0 57 10 165 18 1 194 23 19 109 1 152% App. Total 39.6 54.5 5.3 0.5 42.1 28.1 29.8 0 5.2 85.1 9.3 0.5 15.1 12.5 71.7 0.7
PHF .529 .850 .833 .250 .688 .750 .571 .472 .000 .679 .625 .878 .643 .250 .933 .523 .475 .592 .250 .745
Sowams Road
Ke
nt
Str
ee
t O
ak G
rove
Ave
nu
e
Sowams Road
Right74
Thru102
Left10
Peds1
In - Peak Hour: 07:45 AM187
Rig
ht
24
T
hru1
6
Le
ft17
P
ed
s0
In - P
ea
k Ho
ur: 0
7:4
5 A
M5
7
Left18
Thru165
Right10
Peds1
In - Peak Hour: 07:15 AM194
Le
ft1
09
T
hru1
9
Rig
ht
23
P
ed
s1
In -
Pe
ak
Ho
ur:
07
:45
AM
15
2
UnshiftedBank 1Bank 2
Peak Hour Data
North

Connecticut Counts LLCKensington, Connecticut 06037
(860) 828-1693 File Name : 13857Site Code : 13857Start Date : 12/22/2015Page No : 1
Sowams Road at Kent St/Oak Grove AveBarrington, Rhode Island
Groups Printed- Unshifted - Bank 1 - Bank 2Sowams Road
From NorthOak Grove Avenue
From EastSowams Road
From SouthKent StreetFrom West
Start Time Right Thru Left Peds App. Total Right Thru Left Peds App. Total Right Thru Left Peds App. Total Right Thru Left Peds App. Total Int. Total
04:00 PM 0 31 0 0 31 1 1 1 0 3 4 28 7 0 39 3 2 3 0 8 8104:15 PM 4 41 3 0 48 2 3 1 0 6 0 22 6 0 28 0 1 6 0 7 8904:30 PM 2 26 3 0 31 1 1 0 0 2 0 28 7 0 35 4 3 5 0 12 8004:45 PM 1 24 3 0 28 0 3 1 0 4 3 37 11 0 51 4 2 2 0 8 91
Total 7 122 9 0 138 4 8 3 0 15 7 115 31 0 153 11 8 16 0 35 341
05:00 PM 6 41 6 0 53 2 3 3 0 8 1 27 6 0 34 7 2 2 0 11 10605:15 PM 3 33 1 0 37 3 3 2 0 8 5 25 1 0 31 7 2 2 0 11 8705:30 PM 5 30 0 0 35 2 4 4 0 10 2 32 5 0 39 6 0 3 0 9 9305:45 PM 2 45 0 0 47 0 0 3 0 3 1 29 11 0 41 8 2 4 0 14 105
Total 16 149 7 0 172 7 10 12 0 29 9 113 23 0 145 28 6 11 0 45 391
Grand Total 23 271 16 0 310 11 18 15 0 44 16 228 54 0 298 39 14 27 0 80 732Apprch % 7.4 87.4 5.2 0 25 40.9 34.1 0 5.4 76.5 18.1 0 48.8 17.5 33.8 0
Total % 3.1 37 2.2 0 42.3 1.5 2.5 2 0 6 2.2 31.1 7.4 0 40.7 5.3 1.9 3.7 0 10.9Unshifted 23 271 16 0 310 11 18 15 0 44 16 228 54 0 298 39 14 25 0 78 730
% Unshifted
Bank 1 0 0 0 0 0 0 0 0 0 0 0 0 0 0 0 0 0 0 0 0 0% Bank 1 0 0 0 0 0 0 0 0 0 0 0 0 0 0 0 0 0 0 0 0 0
Bank 2 0 0 0 0 0 0 0 0 0 0 0 0 0 0 0 0 0 2 0 2 2% Bank 2 0 0 0 0 0 0 0 0 0 0 0 0 0 0 0 0 0 7.4 0 2.5 0.3

Connecticut Counts LLCKensington, Connecticut 06037
(860) 828-1693 File Name : 13857Site Code : 13857Start Date : 12/22/2015Page No : 2
Sowams RoadFrom North
Oak Grove AvenueFrom East
Sowams RoadFrom South
Kent StreetFrom West
Start Time Right Thru Left Peds App. Total Right Thru Left Peds App. Total Right Thru Left Peds App. Total Right Thru Left Peds App. Total Int. Total
Peak Hour Analysis From 04:00 PM to 05:45 PM - Peak 1 of 1Peak Hour for Entire Intersection Begins at 05:00 PM
05:00 PM 6 41 6 0 53 2 3 3 0 8 1 27 6 0 34 7 2 2 0 11 10605:15 PM 3 33 1 0 37 3 3 2 0 8 5 25 1 0 31 7 2 2 0 11 8705:30 PM 5 30 0 0 35 2 4 4 0 10 2 32 5 0 39 6 0 3 0 9 9305:45 PM 2 45 0 0 47 0 0 3 0 3 1 29 11 0 41 8 2 4 0 14 105Total Volume 16 149 7 0 172 7 10 12 0 29 9 113 23 0 145 28 6 11 0 45 391% App. Total 9.3 86.6 4.1 0 24.1 34.5 41.4 0 6.2 77.9 15.9 0 62.2 13.3 24.4 0
PHF .667 .828 .292 .000 .811 .583 .625 .750 .000 .725 .450 .883 .523 .000 .884 .875 .750 .688 .000 .804 .922
Sowams Road
Ke
nt
Str
ee
t O
ak G
rove
Ave
nu
e
Sowams Road
Right16
Thru149
Left7
Peds0
InOut Total131 172 303
Rig
ht7
Th
ru10
L
eft1
2
Pe
ds0
Ou
tT
ota
lIn
22
2
9
51
Left23
Thru113
Right9
Peds0
Out TotalIn189 145 334
Le
ft11
T
hru
6
Rig
ht
28
P
ed
s0
To
tal
Ou
tIn
49
4
5
94
Peak Hour Begins at 05:00 PM UnshiftedBank 1Bank 2
Peak Hour Data
North

Connecticut Counts LLCKensington, Connecticut 06037
(860) 828-1693 File Name : 13857Site Code : 13857Start Date : 12/22/2015Page No : 3
Sowams RoadFrom North
Oak Grove AvenueFrom East
Sowams RoadFrom South
Kent StreetFrom West
Start Time Right Thru Left Peds App. Total Right Thru Left Peds App. Total Right Thru Left Peds App. Total Right Thru Left Peds App. Total Int. Total
Peak Hour Analysis From 04:00 PM to 05:45 PM - Peak 1 of 1Peak Hour for Each Approach Begins at:
05:00 PM 04:45 PM 04:45 PM 05:00 PM
+0 mins. 6 41 6 0 53 0 3 1 0 4 3 37 11 0 51 7 2 2 0 11+15 mins. 3 33 1 0 37 2 3 3 0 8 1 27 6 0 34 7 2 2 0 11+30 mins. 5 30 0 0 35 3 3 2 0 8 5 25 1 0 31 6 0 3 0 9+45 mins. 2 45 0 0 47 2 4 4 0 10 2 32 5 0 39 8 2 4 0 14Total Volume 16 149 7 0 172 7 13 10 0 30 11 121 23 0 155 28 6 11 0 45% App. Total 9.3 86.6 4.1 0 23.3 43.3 33.3 0 7.1 78.1 14.8 0 62.2 13.3 24.4 0
PHF .667 .828 .292 .000 .811 .583 .813 .625 .000 .750 .550 .818 .523 .000 .760 .875 .750 .688 .000 .804
Sowams Road
Ke
nt
Str
ee
t O
ak G
rove
Ave
nu
e
Sowams Road
Right16
Thru149
Left7
Peds0
In - Peak Hour: 05:00 PM172
Rig
ht7
Th
ru13
L
eft10
P
ed
s0
In - P
ea
k Ho
ur: 0
4:4
5 P
M3
0
Left23
Thru121
Right11
Peds0
In - Peak Hour: 04:45 PM155
Le
ft11
T
hru
6
Rig
ht
28
P
ed
s0
In -
Pe
ak
Ho
ur:
05
:00
PM
45
UnshiftedBank 1Bank 2
Peak Hour Data
North

Connecticut Counts LLCKensington, Connecticut 06037
(860) 828-1693 File Name : 13858Site Code : 13858Start Date : 12/22/2015Page No : 1
Sowams Road at Country RoadBarrington, Rhode Island
Groups Printed- Unshifted - Bank 1 - Bank 2Sowams Road
From NorthCountry Road
From East From SouthCountry Road
From WestStart Time Right Thru Left Peds App. Total Right Thru Left Peds App. Total Right Thru Left Peds App. Total Right Thru Left Peds App. Total Int. Total
07:00 AM 12 0 13 0 25 21 129 0 0 150 0 0 0 0 0 0 104 6 0 110 28507:15 AM 17 0 19 0 36 35 164 0 0 199 0 0 0 0 0 0 111 6 1 118 35307:30 AM 9 1 23 0 33 35 161 0 0 196 0 0 0 0 0 0 161 16 0 177 40607:45 AM 17 0 17 0 34 25 231 0 0 256 0 0 0 0 0 0 176 11 0 187 477
Total 55 1 72 0 128 116 685 0 0 801 0 0 0 0 0 0 552 39 1 592 1521
08:00 AM 5 0 21 0 26 14 153 0 0 167 0 0 0 0 0 0 114 7 0 121 31408:15 AM 13 0 26 0 39 27 165 0 0 192 0 0 0 0 0 0 170 13 0 183 41408:30 AM 10 0 24 0 34 15 139 0 0 154 0 0 0 0 0 0 117 5 0 122 31008:45 AM 15 0 14 0 29 13 165 0 0 178 0 0 0 0 0 0 104 3 0 107 314
Total 43 0 85 0 128 69 622 0 0 691 0 0 0 0 0 0 505 28 0 533 1352
Grand Total 98 1 157 0 256 185 1307 0 0 1492 0 0 0 0 0 0 1057 67 1 1125 2873Apprch % 38.3 0.4 61.3 0 12.4 87.6 0 0 0 0 0 0 0 94 6 0.1
Total % 3.4 0 5.5 0 8.9 6.4 45.5 0 0 51.9 0 0 0 0 0 0 36.8 2.3 0 39.2Unshifted 91 1 156 0 248 183 1276 1018
% Unshifted 92.9 100 99.4 0 96.9 98.9 97.6 0 0 97.8 0 0 0 0 0 0 96.3 94 100 96.2 97.1Bank 1 4 0 0 0 4 0 13 0 0 13 0 0 0 0 0 0 20 1 0 21 38
% Bank 1 4.1 0 0 0 1.6 0 1 0 0 0.9 0 0 0 0 0 0 1.9 1.5 0 1.9 1.3Bank 2 3 0 1 0 4 2 18 0 0 20 0 0 0 0 0 0 19 3 0 22 46
% Bank 2 3.1 0 0.6 0 1.6 1.1 1.4 0 0 1.3 0 0 0 0 0 0 1.8 4.5 0 2 1.6

Connecticut Counts LLCKensington, Connecticut 06037
(860) 828-1693 File Name : 13858Site Code : 13858Start Date : 12/22/2015Page No : 2
Sowams RoadFrom North
Country RoadFrom East From South
Country RoadFrom West
StartTime
Right Thru Left Peds App. Total Right Thru Left Peds App. Total Right Thru Left Peds App. Total Right Thru Left Peds App. Total Int. Total
Peak Hour Analysis From 07:00 AM to 08:45 AM - Peak 1 of 1Peak Hour for Entire Intersection Begins at 07:30 AM
07:30 AM 9 1 23 0 33 35 161 0 0 196 0 0 0 0 0 0 161 16 0 177 40607:45 AM 17 0 17 0 34 25 231 0 0 256 0 0 0 0 0 0 176 11 0 187 47708:00 AM 5 0 21 0 26 14 153 0 0 167 0 0 0 0 0 0 114 7 0 121 31408:15 AM 13 0 26 0 39 27 165 0 0 192 0 0 0 0 0 0 170 13 0 183 414Total Volume 44 1 87 0 132 101 710 0 0 811 0 0 0 0 0 0 621 47 0 668 1611% App. Total 33.3 0.8 65.9 0 12.5 87.5 0 0 0 0 0 0 0 93 7 0
PHF .647 .250 .837 .000 .846 .721 .768 .000 .000 .792 .000 .000 .000 .000 .000 .000 .882 .734 .000 .893 .844
Sowams Road
Co
un
try
Ro
ad
Co
un
try Ro
ad
Right44
Thru1
Left87
Peds0
InOut Total148 132 280
Rig
ht
10
1
Th
ru7
10
L
eft0
P
ed
s0
Ou
tT
ota
lIn
70
8
81
1
15
19
Left0
Thru0
Right0
Peds0
Out TotalIn1 0 1
Le
ft47
T
hru62
1
Rig
ht0
Pe
ds0
To
tal
Ou
tIn
75
4
66
8
14
22
Peak Hour Begins at 07:30 AM UnshiftedBank 1Bank 2
Peak Hour Data
North

Connecticut Counts LLCKensington, Connecticut 06037
(860) 828-1693 File Name : 13858Site Code : 13858Start Date : 12/22/2015Page No : 3
Sowams RoadFrom North
Country RoadFrom East From South
Country RoadFrom West
StartTime
Right Thru Left Peds App. Total Right Thru Left Peds App. Total Right Thru Left Peds App. Total Right Thru Left Peds App. Total Int. Total
Peak Hour Analysis From 07:00 AM to 08:45 AM - Peak 1 of 1Peak Hour for Each Approach Begins at:
07:45 AM 07:15 AM 07:00 AM 07:30 AM
+0 mins. 17 0 17 0 34 35 164 0 0 199 0 0 0 0 0 0 161 16 0 177+15 mins. 5 0 21 0 26 35 161 0 0 196 0 0 0 0 0 0 176 11 0 187+30 mins. 13 0 26 0 39 25 231 0 0 256 0 0 0 0 0 0 114 7 0 121+45 mins. 10 0 24 0 34 14 153 0 0 167 0 0 0 0 0 0 170 13 0 183Total Volume 45 0 88 0 133 109 709 0 0 818 0 0 0 0 0 0 621 47 0 668% App. Total 33.8 0 66.2 0 13.3 86.7 0 0 0 0 0 0 0 93 7 0
PHF .662 .000 .846 .000 .853 .779 .767 .000 .000 .799 .000 .000 .000 .000 .000 .000 .882 .734 .000 .893
Sowams Road
Co
un
try
Ro
ad
Co
un
try Ro
ad
Right45
Thru0
Left88
Peds0
In - Peak Hour: 07:45 AM133
Rig
ht
10
9
Th
ru7
09
L
eft0
P
ed
s0
In - P
ea
k Ho
ur: 0
7:1
5 A
M8
18
Left0
Thru0
Right0
Peds0
In - Peak Hour: 07:00 AM0
Le
ft47
T
hru62
1
Rig
ht0
Pe
ds0
In -
Pe
ak
Ho
ur:
07
:30
AM
66
8
UnshiftedBank 1Bank 2
Peak Hour Data
North

Connecticut Counts LLCKensington, Connecticut 06037
(860) 828-1693 File Name : 13859Site Code : 13859Start Date : 12/22/2015Page No : 1
Sowams Road at Country RoadBarrington, Rhode Island
Groups Printed- Unshifted - Bank 1 - Bank 2Sowams Road
From NorthCountry Road
From East From SouthCountry Road
From WestStart Time Right Thru Left Peds App. Total Right Thru Left Peds App. Total Right Thru Left Peds App. Total Right Thru Left Peds App. Total Int. Total
04:00 PM 11 0 31 0 42 31 152 0 0 183 0 0 0 0 0 0 199 7 0 206 43104:15 PM 5 0 30 0 35 21 190 0 0 211 0 0 0 0 0 0 156 7 0 163 40904:30 PM 5 0 20 0 25 23 201 0 0 224 0 0 0 0 0 0 176 9 0 185 43404:45 PM 8 0 19 0 27 33 187 0 0 220 0 0 0 0 0 0 161 5 0 166 413
Total 29 0 100 0 129 108 730 0 0 838 0 0 0 0 0 0 692 28 0 720 1687
05:00 PM 10 0 41 1 52 26 176 0 0 202 0 0 0 0 0 0 193 9 0 202 45605:15 PM 13 0 21 0 34 20 163 0 0 183 0 0 0 0 0 0 159 5 0 164 38105:30 PM 6 0 22 0 28 17 163 1 0 181 0 0 0 0 0 0 162 9 0 171 38005:45 PM 10 0 29 0 39 19 156 0 0 175 0 0 0 0 0 0 169 8 0 177 391
Total 39 0 113 1 153 82 658 1 0 741 0 0 0 0 0 0 683 31 0 714 1608
Grand Total 68 0 213 1 282 190 1388 1 0 1579 0 0 0 0 0 0 1375 59 0 1434 3295Apprch % 24.1 0 75.5 0.4 12 87.9 0.1 0 0 0 0 0 0 95.9 4.1 0
Total % 2.1 0 6.5 0 8.6 5.8 42.1 0 0 47.9 0 0 0 0 0 0 41.7 1.8 0 43.5Unshifted 68 0 212 1 281 190 1373 1351
% Unshifted 100 0 99.5 100 99.6 100 98.9 0 0 99 0 0 0 0 0 0 98.3 100 0 98.3 98.8Bank 1 0 0 1 0 1 0 4 0 0 4 0 0 0 0 0 0 9 0 0 9 14
% Bank 1 0 0 0.5 0 0.4 0 0.3 0 0 0.3 0 0 0 0 0 0 0.7 0 0 0.6 0.4Bank 2 0 0 0 0 0 0 11 1 0 12 0 0 0 0 0 0 15 0 0 15 27
% Bank 2 0 0 0 0 0 0 0.8 100 0 0.8 0 0 0 0 0 0 1.1 0 0 1 0.8

Connecticut Counts LLCKensington, Connecticut 06037
(860) 828-1693 File Name : 13859Site Code : 13859Start Date : 12/22/2015Page No : 2
Sowams RoadFrom North
Country RoadFrom East From South
Country RoadFrom West
StartTime
Right Thru Left Peds App. Total Right Thru Left Peds App. Total Right Thru Left Peds App. Total Right Thru Left Peds App. Total Int. Total
Peak Hour Analysis From 04:00 PM to 05:45 PM - Peak 1 of 1Peak Hour for Entire Intersection Begins at 04:15 PM
04:15 PM 5 0 30 0 35 21 190 0 0 211 0 0 0 0 0 0 156 7 0 163 40904:30 PM 5 0 20 0 25 23 201 0 0 224 0 0 0 0 0 0 176 9 0 185 43404:45 PM 8 0 19 0 27 33 187 0 0 220 0 0 0 0 0 0 161 5 0 166 41305:00 PM 10 0 41 1 52 26 176 0 0 202 0 0 0 0 0 0 193 9 0 202 456Total Volume 28 0 110 1 139 103 754 0 0 857 0 0 0 0 0 0 686 30 0 716 1712% App. Total 20.1 0 79.1 0.7 12 88 0 0 0 0 0 0 0 95.8 4.2 0
PHF .700 .000 .671 .250 .668 .780 .938 .000 .000 .956 .000 .000 .000 .000 .000 .000 .889 .833 .000 .886 .939
Sowams Road
Co
un
try
Ro
ad
Co
un
try Ro
ad
Right28
Thru0
Left110
Peds1
InOut Total133 139 272
Rig
ht
10
3
Th
ru7
54
L
eft0
P
ed
s0
Ou
tT
ota
lIn
79
6
85
7
16
53
Left0
Thru0
Right0
Peds0
Out TotalIn0 0 0
Le
ft30
T
hru68
6
Rig
ht0
Pe
ds0
To
tal
Ou
tIn
78
2
71
6
14
98
Peak Hour Begins at 04:15 PM UnshiftedBank 1Bank 2
Peak Hour Data
North

Connecticut Counts LLCKensington, Connecticut 06037
(860) 828-1693 File Name : 13859Site Code : 13859Start Date : 12/22/2015Page No : 3
Sowams RoadFrom North
Country RoadFrom East From South
Country RoadFrom West
StartTime
Right Thru Left Peds App. Total Right Thru Left Peds App. Total Right Thru Left Peds App. Total Right Thru Left Peds App. Total Int. Total
Peak Hour Analysis From 04:00 PM to 05:45 PM - Peak 1 of 1Peak Hour for Each Approach Begins at:
05:00 PM 04:15 PM 04:00 PM 04:00 PM
+0 mins. 10 0 41 1 52 21 190 0 0 211 0 0 0 0 0 0 199 7 0 206+15 mins. 13 0 21 0 34 23 201 0 0 224 0 0 0 0 0 0 156 7 0 163+30 mins. 6 0 22 0 28 33 187 0 0 220 0 0 0 0 0 0 176 9 0 185+45 mins. 10 0 29 0 39 26 176 0 0 202 0 0 0 0 0 0 161 5 0 166Total Volume 39 0 113 1 153 103 754 0 0 857 0 0 0 0 0 0 692 28 0 720% App. Total 25.5 0 73.9 0.7 12 88 0 0 0 0 0 0 0 96.1 3.9 0
PHF .750 .000 .689 .250 .736 .780 .938 .000 .000 .956 .000 .000 .000 .000 .000 .000 .869 .778 .000 .874
Sowams Road
Co
un
try
Ro
ad
Co
un
try Ro
ad
Right39
Thru0
Left113
Peds1
In - Peak Hour: 05:00 PM153
Rig
ht
10
3
Th
ru7
54
L
eft0
P
ed
s0
In - P
ea
k Ho
ur: 0
4:1
5 P
M8
57
Left0
Thru0
Right0
Peds0
In - Peak Hour: 04:00 PM0
Le
ft28
T
hru69
2
Rig
ht0
Pe
ds0
In -
Pe
ak
Ho
ur:
04
:00
PM
72
0
UnshiftedBank 1Bank 2
Peak Hour Data
North

Page 1 Sowans Road at Sowans Nursery DriveBarrington, Rhode Island
Site Code: 3810
Station ID:
Latitude: 0' 0.000 Undefined
Connecticut Counts LLC63 Sugar Maple Lane
Kensington, Connecticut 06037(860) 828-1693
NorthboundStart 1 16 21 26 31 36 41 46 51 56 61 66 71 76 85th 95thTime 15 20 25 30 35 40 45 50 55 60 65 70 75 999 Total Percent Percent
12/21/15 * * * * * * * * * * * * * * * * *01:00 * * * * * * * * * * * * * * * * *02:00 * * * * * * * * * * * * * * * * *03:00 * * * * * * * * * * * * * * * * *04:00 * * * * * * * * * * * * * * * * *05:00 * * * * * * * * * * * * * * * * *06:00 * * * * * * * * * * * * * * * * *07:00 * * * * * * * * * * * * * * * * *08:00 * * * * * * * * * * * * * * * * *09:00 * * * * * * * * * * * * * * * * *10:00 * * * * * * * * * * * * * * * * *11:00 * * * * * * * * * * * * * * * * *
12 PM * * * * * * * * * * * * * * * * *13:00 0 0 2 9 56 45 14 0 1 0 0 0 0 0 127 39 4214:00 0 1 6 24 44 49 19 0 1 0 0 0 0 0 144 40 4315:00 0 0 0 17 58 57 15 4 1 0 0 0 0 0 152 40 4416:00 0 0 1 6 54 65 14 1 0 0 0 0 0 0 141 39 4217:00 0 1 2 17 55 50 9 2 0 0 0 0 0 0 136 39 4218:00 0 0 0 10 40 34 15 2 0 0 0 0 0 0 101 40 4319:00 0 0 1 9 26 26 7 0 0 0 0 0 0 0 69 39 4220:00 0 0 0 5 26 20 3 0 1 0 0 0 0 0 55 38 4021:00 0 0 0 7 14 15 4 0 0 0 0 0 0 0 40 39 4122:00 0 0 2 2 1 6 0 1 0 0 0 0 0 0 12 39 3923:00 0 0 1 1 6 2 0 0 0 0 0 0 0 0 10 35 36Total 0 2 15 107 380 369 100 10 4 0 0 0 0 0 987
Percent 0.0% 0.2% 1.5% 10.8% 38.5% 37.4% 10.1% 1.0% 0.4% 0.0% 0.0% 0.0% 0.0% 0.0% AM Peak
Vol. PM Peak 14:00 14:00 14:00 15:00 16:00 14:00 15:00 13:00 15:00
Vol. 1 6 24 58 65 19 4 1 152

Page 2 Sowans Road at Sowans Nursery DriveBarrington, Rhode Island
Site Code: 3810
Station ID:
Latitude: 0' 0.000 Undefined
Connecticut Counts LLC63 Sugar Maple Lane
Kensington, Connecticut 06037(860) 828-1693
NorthboundStart 1 16 21 26 31 36 41 46 51 56 61 66 71 76 85th 95thTime 15 20 25 30 35 40 45 50 55 60 65 70 75 999 Total Percent Percent
12/22/15 0 0 0 0 0 2 0 0 0 0 0 0 0 0 2 * *01:00 0 0 1 0 2 3 2 0 0 0 0 0 0 0 8 39 3902:00 0 0 0 0 0 2 1 0 0 0 0 0 0 0 3 * *03:00 0 0 0 0 0 0 0 0 0 0 0 0 0 0 0 * *04:00 0 0 0 0 2 1 1 0 0 0 0 0 0 0 4 * *05:00 0 0 0 3 5 5 1 0 0 0 0 0 0 0 14 38 4006:00 0 0 2 3 12 10 2 0 0 0 0 0 0 0 29 38 4007:00 1 2 5 24 54 56 13 3 0 0 0 0 0 0 158 39 4208:00 0 0 2 9 42 51 9 1 0 0 0 0 0 0 114 39 4209:00 0 0 4 9 35 43 8 1 0 0 0 0 0 0 100 39 4210:00 0 0 6 12 45 51 13 3 0 0 0 0 0 0 130 40 4311:00 0 1 2 14 39 49 25 1 0 0 0 0 0 0 131 41 43
12 PM 0 0 4 7 55 70 16 3 0 0 0 0 0 0 155 40 4313:00 0 0 0 9 66 43 8 0 0 0 0 0 0 0 126 38 4114:00 0 0 4 15 47 65 19 1 0 0 0 0 0 0 151 40 4315:00 1 3 4 20 60 41 12 1 0 0 0 0 0 0 142 39 4116:00 0 0 2 15 70 61 8 1 0 0 0 0 0 0 157 38 4117:00 0 0 2 16 69 41 6 0 0 0 0 0 0 0 134 38 4018:00 0 0 2 15 46 38 2 2 0 0 0 1 0 0 106 38 4019:00 0 3 4 12 30 26 6 0 0 0 0 0 0 0 81 39 4120:00 0 0 0 8 29 7 9 0 0 0 0 0 0 0 53 40 4321:00 0 0 0 7 13 14 3 0 0 0 0 0 0 0 37 38 4122:00 0 0 0 0 7 3 4 0 0 0 0 0 0 0 14 41 4323:00 0 0 2 1 1 4 1 0 1 0 0 0 0 0 10 39 39Total 2 9 46 199 729 686 169 17 1 0 0 1 0 0 1859
Percent 0.1% 0.5% 2.5% 10.7% 39.2% 36.9% 9.1% 0.9% 0.1% 0.0% 0.0% 0.1% 0.0% 0.0% AM Peak 07:00 07:00 10:00 07:00 07:00 07:00 11:00 07:00 07:00
Vol. 1 2 6 24 54 56 25 3 158 PM Peak 15:00 15:00 12:00 15:00 16:00 12:00 14:00 12:00 23:00 18:00 16:00
Vol. 1 3 4 20 70 70 19 3 1 1 157

Page 3 Sowans Road at Sowans Nursery DriveBarrington, Rhode Island
Site Code: 3810
Station ID:
Latitude: 0' 0.000 Undefined
Connecticut Counts LLC63 Sugar Maple Lane
Kensington, Connecticut 06037(860) 828-1693
NorthboundStart 1 16 21 26 31 36 41 46 51 56 61 66 71 76 85th 95thTime 15 20 25 30 35 40 45 50 55 60 65 70 75 999 Total Percent Percent
12/23/15 0 0 0 2 3 2 1 0 0 0 0 0 0 0 8 34 3401:00 0 0 0 0 0 1 0 0 0 0 0 0 0 0 1 * *02:00 0 0 0 0 0 2 1 0 0 0 0 0 0 0 3 * *03:00 0 0 0 0 0 0 0 0 0 0 0 0 0 0 0 * *04:00 0 0 0 0 1 1 1 0 0 0 0 0 0 0 3 * *05:00 0 0 0 2 4 3 0 0 0 0 0 0 0 0 9 36 3706:00 0 1 3 7 13 12 0 2 0 0 0 0 0 0 38 37 3907:00 0 0 1 4 28 40 15 1 0 0 0 0 0 0 89 40 4308:00 0 0 1 8 35 45 18 3 0 0 0 0 0 0 110 41 4409:00 0 0 1 8 39 59 16 1 0 0 0 0 0 0 124 40 4310:00 0 0 0 6 46 51 24 3 0 0 0 0 0 0 130 41 4411:00 0 0 2 10 35 50 25 4 3 0 0 0 0 0 129 42 46
12 PM 0 0 0 7 61 56 28 1 0 0 0 0 0 0 153 41 4313:00 1 1 2 7 22 42 6 3 0 0 0 0 0 0 84 40 4414:00 * * * * * * * * * * * * * * * * *15:00 * * * * * * * * * * * * * * * * *16:00 * * * * * * * * * * * * * * * * *17:00 * * * * * * * * * * * * * * * * *18:00 * * * * * * * * * * * * * * * * *19:00 * * * * * * * * * * * * * * * * *20:00 * * * * * * * * * * * * * * * * *21:00 * * * * * * * * * * * * * * * * *22:00 * * * * * * * * * * * * * * * * *23:00 * * * * * * * * * * * * * * * * *Total 1 2 10 61 287 364 135 18 3 0 0 0 0 0 881
Percent 0.1% 0.2% 1.1% 6.9% 32.6% 41.3% 15.3% 2.0% 0.3% 0.0% 0.0% 0.0% 0.0% 0.0% AM Peak 06:00 06:00 11:00 10:00 09:00 11:00 11:00 11:00 10:00
Vol. 1 3 10 46 59 25 4 3 130 PM Peak 13:00 13:00 13:00 12:00 12:00 12:00 12:00 13:00 12:00
Vol. 1 1 2 7 61 56 28 3 153 Total 3 13 71 367 1396 1419 404 45 8 0 0 1 0 0 3727
Percent 0.1% 0.3% 1.9% 9.8% 37.5% 38.1% 10.8% 1.2% 0.2% 0.0% 0.0% 0.0% 0.0% 0.0% 15th Percentile : 29 MPH50th Percentile : 35 MPH85th Percentile : 40 MPH95th Percentile : 43 MPH
Stats 10 MPH Pace Speed : 31-40 MPH
Number in Pace : 2564Percent in Pace : 68.8%
Number of Vehicles > 30 MPH : 3142Percent of Vehicles > 30 MPH : 84.3%
Mean Speed(Average) : 35 MPH

Page 4 Sowans Road at Sowans Nursery DriveBarrington, Rhode Island
Site Code: 3810
Station ID:
Latitude: 0' 0.000 Undefined
Connecticut Counts LLC63 Sugar Maple Lane
Kensington, Connecticut 06037(860) 828-1693
SouthboundStart 1 16 21 26 31 36 41 46 51 56 61 66 71 76 85th 95thTime 15 20 25 30 35 40 45 50 55 60 65 70 75 999 Total Percent Percent
12/21/15 * * * * * * * * * * * * * * * * *01:00 * * * * * * * * * * * * * * * * *02:00 * * * * * * * * * * * * * * * * *03:00 * * * * * * * * * * * * * * * * *04:00 * * * * * * * * * * * * * * * * *05:00 * * * * * * * * * * * * * * * * *06:00 * * * * * * * * * * * * * * * * *07:00 * * * * * * * * * * * * * * * * *08:00 * * * * * * * * * * * * * * * * *09:00 * * * * * * * * * * * * * * * * *10:00 * * * * * * * * * * * * * * * * *11:00 * * * * * * * * * * * * * * * * *
12 PM * * * * * * * * * * * * * * * * *13:00 0 0 1 12 43 48 12 2 0 0 0 0 0 0 118 39 4314:00 3 1 8 21 63 54 2 1 0 0 0 0 0 0 153 37 3915:00 2 1 5 19 74 58 10 2 0 0 0 0 0 0 171 38 4116:00 0 0 2 24 53 55 11 1 0 0 0 0 0 0 146 39 4117:00 0 2 3 17 53 51 6 0 0 0 0 0 0 0 132 38 4018:00 0 1 2 11 61 44 6 2 0 0 0 0 0 0 127 38 4119:00 0 0 0 10 36 32 8 1 0 0 0 0 0 0 87 39 4220:00 0 0 0 7 25 24 6 2 0 0 0 0 0 0 64 40 4321:00 0 0 1 4 13 23 4 1 0 0 0 0 0 0 46 40 4222:00 0 1 0 7 6 9 2 0 0 0 0 0 0 0 25 38 4023:00 0 0 1 1 3 5 1 0 0 0 0 0 0 0 11 39 40Total 5 6 23 133 430 403 68 12 0 0 0 0 0 0 1080
Percent 0.5% 0.6% 2.1% 12.3% 39.8% 37.3% 6.3% 1.1% 0.0% 0.0% 0.0% 0.0% 0.0% 0.0% AM Peak
Vol. PM Peak 14:00 17:00 14:00 16:00 15:00 15:00 13:00 13:00 15:00
Vol. 3 2 8 24 74 58 12 2 171
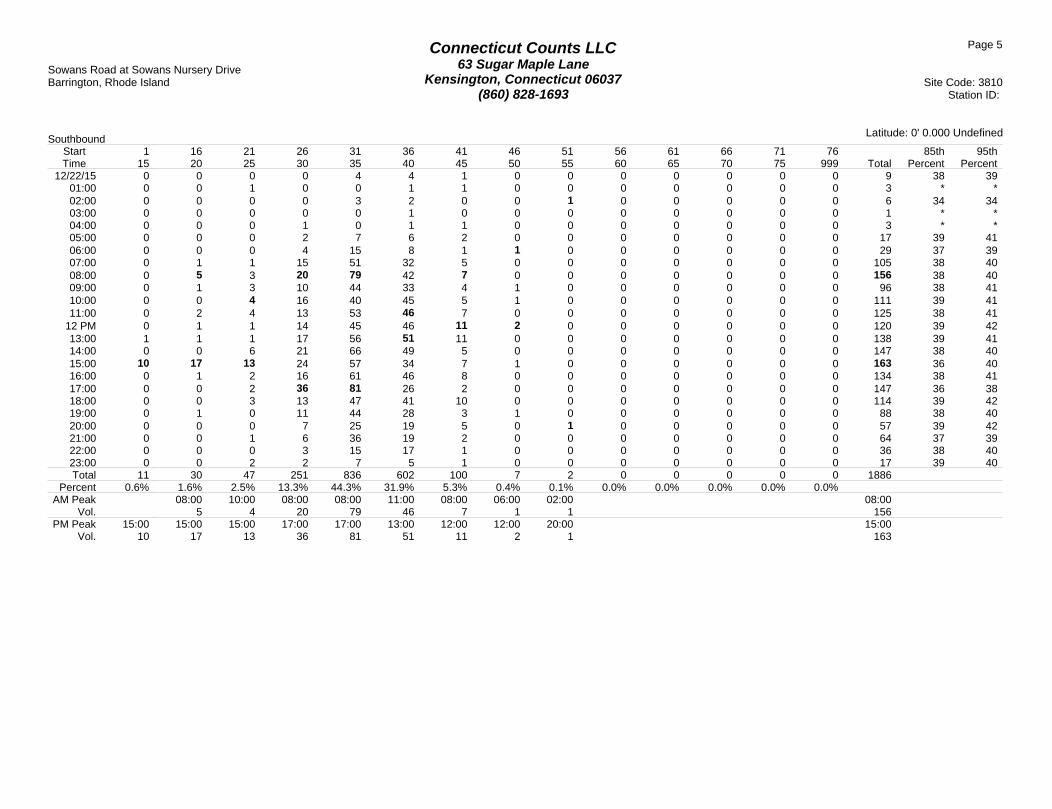
Page 5 Sowans Road at Sowans Nursery DriveBarrington, Rhode Island
Site Code: 3810
Station ID:
Latitude: 0' 0.000 Undefined
Connecticut Counts LLC63 Sugar Maple Lane
Kensington, Connecticut 06037(860) 828-1693
SouthboundStart 1 16 21 26 31 36 41 46 51 56 61 66 71 76 85th 95thTime 15 20 25 30 35 40 45 50 55 60 65 70 75 999 Total Percent Percent
12/22/15 0 0 0 0 4 4 1 0 0 0 0 0 0 0 9 38 3901:00 0 0 1 0 0 1 1 0 0 0 0 0 0 0 3 * *02:00 0 0 0 0 3 2 0 0 1 0 0 0 0 0 6 34 3403:00 0 0 0 0 0 1 0 0 0 0 0 0 0 0 1 * *04:00 0 0 0 1 0 1 1 0 0 0 0 0 0 0 3 * *05:00 0 0 0 2 7 6 2 0 0 0 0 0 0 0 17 39 4106:00 0 0 0 4 15 8 1 1 0 0 0 0 0 0 29 37 3907:00 0 1 1 15 51 32 5 0 0 0 0 0 0 0 105 38 4008:00 0 5 3 20 79 42 7 0 0 0 0 0 0 0 156 38 4009:00 0 1 3 10 44 33 4 1 0 0 0 0 0 0 96 38 4110:00 0 0 4 16 40 45 5 1 0 0 0 0 0 0 111 39 4111:00 0 2 4 13 53 46 7 0 0 0 0 0 0 0 125 38 41
12 PM 0 1 1 14 45 46 11 2 0 0 0 0 0 0 120 39 4213:00 1 1 1 17 56 51 11 0 0 0 0 0 0 0 138 39 4114:00 0 0 6 21 66 49 5 0 0 0 0 0 0 0 147 38 4015:00 10 17 13 24 57 34 7 1 0 0 0 0 0 0 163 36 4016:00 0 1 2 16 61 46 8 0 0 0 0 0 0 0 134 38 4117:00 0 0 2 36 81 26 2 0 0 0 0 0 0 0 147 36 3818:00 0 0 3 13 47 41 10 0 0 0 0 0 0 0 114 39 4219:00 0 1 0 11 44 28 3 1 0 0 0 0 0 0 88 38 4020:00 0 0 0 7 25 19 5 0 1 0 0 0 0 0 57 39 4221:00 0 0 1 6 36 19 2 0 0 0 0 0 0 0 64 37 3922:00 0 0 0 3 15 17 1 0 0 0 0 0 0 0 36 38 4023:00 0 0 2 2 7 5 1 0 0 0 0 0 0 0 17 39 40Total 11 30 47 251 836 602 100 7 2 0 0 0 0 0 1886
Percent 0.6% 1.6% 2.5% 13.3% 44.3% 31.9% 5.3% 0.4% 0.1% 0.0% 0.0% 0.0% 0.0% 0.0% AM Peak 08:00 10:00 08:00 08:00 11:00 08:00 06:00 02:00 08:00
Vol. 5 4 20 79 46 7 1 1 156 PM Peak 15:00 15:00 15:00 17:00 17:00 13:00 12:00 12:00 20:00 15:00
Vol. 10 17 13 36 81 51 11 2 1 163
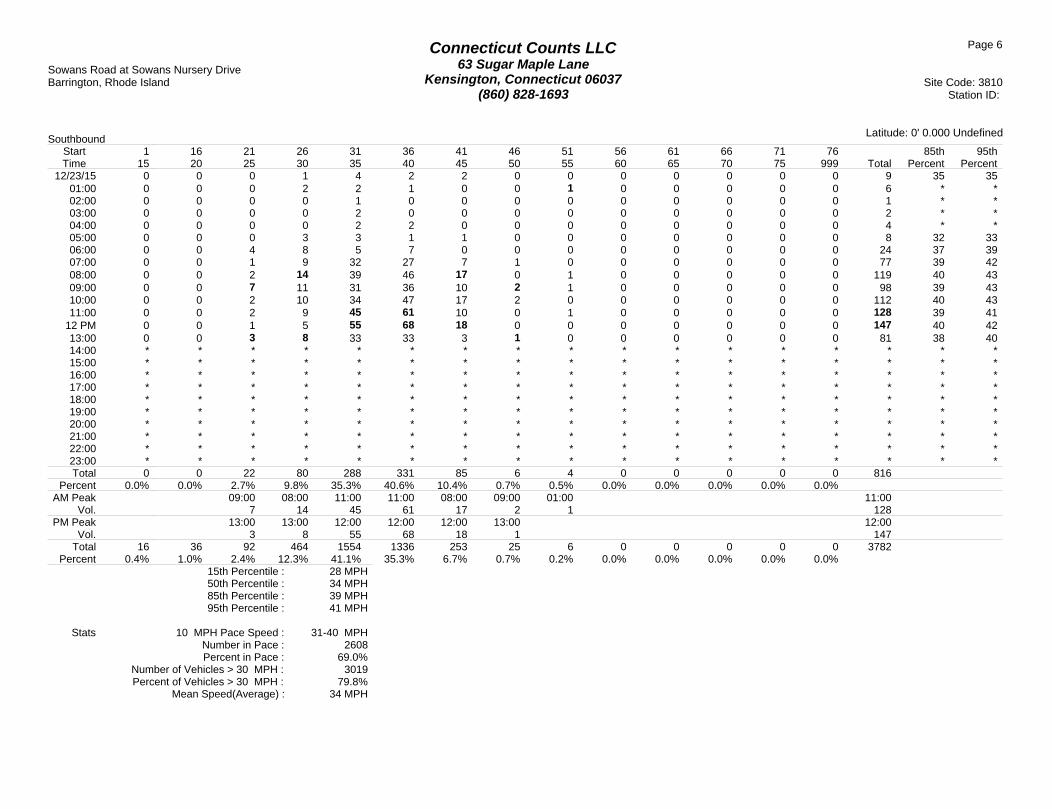
Page 6 Sowans Road at Sowans Nursery DriveBarrington, Rhode Island
Site Code: 3810
Station ID:
Latitude: 0' 0.000 Undefined
Connecticut Counts LLC63 Sugar Maple Lane
Kensington, Connecticut 06037(860) 828-1693
SouthboundStart 1 16 21 26 31 36 41 46 51 56 61 66 71 76 85th 95thTime 15 20 25 30 35 40 45 50 55 60 65 70 75 999 Total Percent Percent
12/23/15 0 0 0 1 4 2 2 0 0 0 0 0 0 0 9 35 3501:00 0 0 0 2 2 1 0 0 1 0 0 0 0 0 6 * *02:00 0 0 0 0 1 0 0 0 0 0 0 0 0 0 1 * *03:00 0 0 0 0 2 0 0 0 0 0 0 0 0 0 2 * *04:00 0 0 0 0 2 2 0 0 0 0 0 0 0 0 4 * *05:00 0 0 0 3 3 1 1 0 0 0 0 0 0 0 8 32 3306:00 0 0 4 8 5 7 0 0 0 0 0 0 0 0 24 37 3907:00 0 0 1 9 32 27 7 1 0 0 0 0 0 0 77 39 4208:00 0 0 2 14 39 46 17 0 1 0 0 0 0 0 119 40 4309:00 0 0 7 11 31 36 10 2 1 0 0 0 0 0 98 39 4310:00 0 0 2 10 34 47 17 2 0 0 0 0 0 0 112 40 4311:00 0 0 2 9 45 61 10 0 1 0 0 0 0 0 128 39 41
12 PM 0 0 1 5 55 68 18 0 0 0 0 0 0 0 147 40 4213:00 0 0 3 8 33 33 3 1 0 0 0 0 0 0 81 38 4014:00 * * * * * * * * * * * * * * * * *15:00 * * * * * * * * * * * * * * * * *16:00 * * * * * * * * * * * * * * * * *17:00 * * * * * * * * * * * * * * * * *18:00 * * * * * * * * * * * * * * * * *19:00 * * * * * * * * * * * * * * * * *20:00 * * * * * * * * * * * * * * * * *21:00 * * * * * * * * * * * * * * * * *22:00 * * * * * * * * * * * * * * * * *23:00 * * * * * * * * * * * * * * * * *Total 0 0 22 80 288 331 85 6 4 0 0 0 0 0 816
Percent 0.0% 0.0% 2.7% 9.8% 35.3% 40.6% 10.4% 0.7% 0.5% 0.0% 0.0% 0.0% 0.0% 0.0% AM Peak 09:00 08:00 11:00 11:00 08:00 09:00 01:00 11:00
Vol. 7 14 45 61 17 2 1 128 PM Peak 13:00 13:00 12:00 12:00 12:00 13:00 12:00
Vol. 3 8 55 68 18 1 147 Total 16 36 92 464 1554 1336 253 25 6 0 0 0 0 0 3782
Percent 0.4% 1.0% 2.4% 12.3% 41.1% 35.3% 6.7% 0.7% 0.2% 0.0% 0.0% 0.0% 0.0% 0.0% 15th Percentile : 28 MPH50th Percentile : 34 MPH85th Percentile : 39 MPH95th Percentile : 41 MPH
Stats 10 MPH Pace Speed : 31-40 MPH
Number in Pace : 2608Percent in Pace : 69.0%
Number of Vehicles > 30 MPH : 3019Percent of Vehicles > 30 MPH : 79.8%
Mean Speed(Average) : 34 MPH
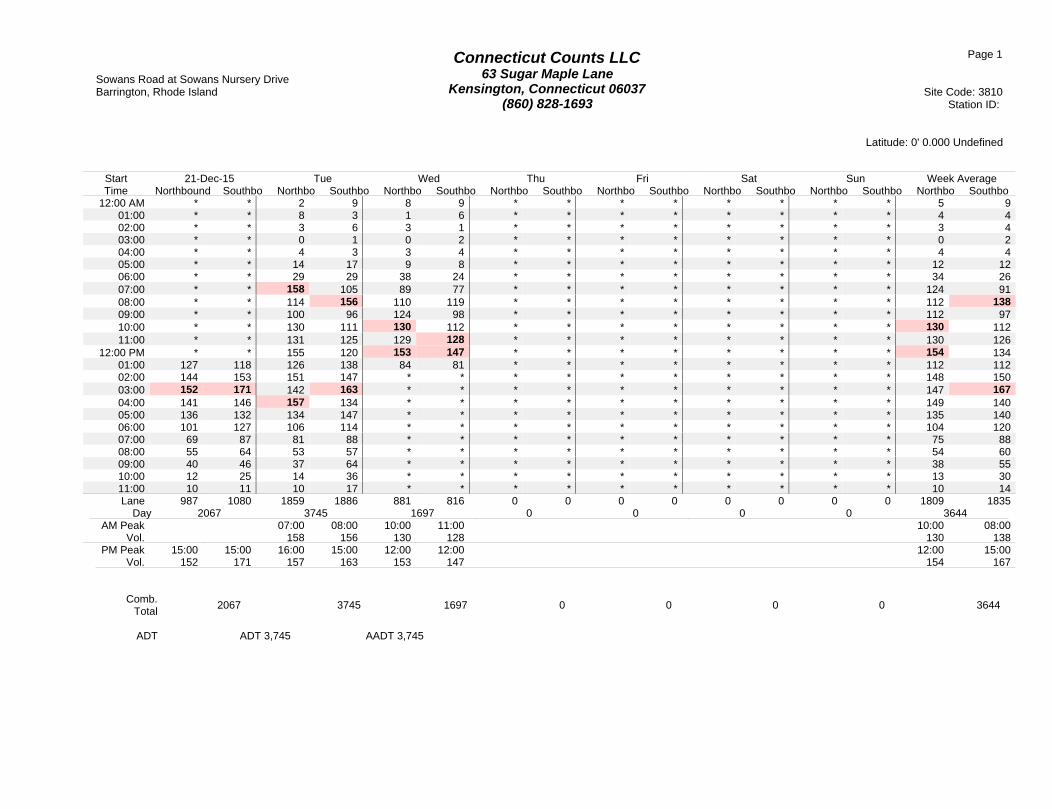
Page 1 Sowans Road at Sowans Nursery DriveBarrington, Rhode Island
Site Code: 3810
Station ID:
Latitude: 0' 0.000 Undefined
Connecticut Counts LLC63 Sugar Maple Lane
Kensington, Connecticut 06037(860) 828-1693
Start 21-Dec-15 Tue Wed Thu Fri Sat Sun Week AverageTime Northbound Southbo Northbo Southbo Northbo Southbo Northbo Southbo Northbo Southbo Northbo Southbo Northbo Southbo Northbo Southbo
12:00 AM * * 2 9 8 9 * * * * * * * * 5 901:00 * * 8 3 1 6 * * * * * * * * 4 402:00 * * 3 6 3 1 * * * * * * * * 3 403:00 * * 0 1 0 2 * * * * * * * * 0 204:00 * * 4 3 3 4 * * * * * * * * 4 405:00 * * 14 17 9 8 * * * * * * * * 12 1206:00 * * 29 29 38 24 * * * * * * * * 34 2607:00 * * 158 105 89 77 * * * * * * * * 124 9108:00 * * 114 156 110 119 * * * * * * * * 112 13809:00 * * 100 96 124 98 * * * * * * * * 112 9710:00 * * 130 111 130 112 * * * * * * * * 130 11211:00 * * 131 125 129 128 * * * * * * * * 130 126
12:00 PM * * 155 120 153 147 * * * * * * * * 154 13401:00 127 118 126 138 84 81 * * * * * * * * 112 11202:00 144 153 151 147 * * * * * * * * * * 148 15003:00 152 171 142 163 * * * * * * * * * * 147 16704:00 141 146 157 134 * * * * * * * * * * 149 14005:00 136 132 134 147 * * * * * * * * * * 135 14006:00 101 127 106 114 * * * * * * * * * * 104 12007:00 69 87 81 88 * * * * * * * * * * 75 8808:00 55 64 53 57 * * * * * * * * * * 54 6009:00 40 46 37 64 * * * * * * * * * * 38 5510:00 12 25 14 36 * * * * * * * * * * 13 3011:00 10 11 10 17 * * * * * * * * * * 10 14Lane 987 1080 1859 1886 881 816 0 0 0 0 0 0 0 0 1809 1835
Day 2067 3745 1697 0 0 0 0 3644AM Peak 07:00 08:00 10:00 11:00 10:00 08:00
Vol. 158 156 130 128 130 138PM Peak 15:00 15:00 16:00 15:00 12:00 12:00 12:00 15:00
Vol. 152 171 157 163 153 147 154 167
Comb.Total
2067 3745 1697 0 0 0 0 3644
ADT ADT 3,745 AADT 3,745