Embed Size (px)
Citation preview

U.P.B. Sci. Bull., Series C, Vol. 75, Iss. 2, 2013 ISSN 2286 – 3540
TRAFFIC FLOW DETECTION USING LAB VIEW VIDEO PROCESSING TECHNIQUES
Răzvan GHIŢĂ1, Ana Maria Nicoleta MOCOFAN2
This project highlights the role played by traffic video detection, using example techniques like templates (or mask images) and edge detection. These techniques are rarely used for detection of moving objects and therefore using them in road traffic flow detection represents a challenge. We developed a software application which has the advantage that it can determine the degree of occupation of a traffic link at certain hours.
The main advantage of our software application consists of its versatility. The software is capable of making a centralized video detection by removing, in this way, the need of dedicated producer equipment.
Keywords: video, template, edge, kernel, peak, curve-fitting
1. Introduction
An accurate data acquisition from the traffic junctions represents a goal to achieve for all the traffic detection systems that are used today around the world. A couple of different traffic detection techniques are available. These techniques are classified as intrusive techniques, non-intrusive and off-road technologies. The inductive loops, the most used sensors around the world in the last decades, are among the most accurate. But despite this advantage they have a couple of drawbacks like the traffic interruption during installation and maintenance, inflexibility and a high error rate in certain circumstances like bad weather [1].
In these conditions, the non-intrusive technologies become very useful. The specialists tried to integrate sensors like radars, video processing and magnetic detectors to overcome the lacks of the inductive loops. Almost all non-intrusive detectors have advantages over the traditional ones but their rate of success is greatly reduced by their “immaturity” and lack of experience in the field [2]. One of the newest non-intrusive technologies is represented by the video processing. It appeared in 1970’s in USA. Between 1970 and 1980 several countries like U.K, Germany, France and Sweden tried to develop this technology [3]. 1 PhD student, Depart. for Telematics and Electronics in Transports, Faculty of Transports,
University POLITEHNICA of Bucharest, Romania, e-mail: [email protected] 2 PhD student, Depart. for Telematics and Electronics in Transports, Faculty of Transports,
University POLITEHNICA of Bucharest, Romania, e-mail: [email protected]

182 Răzvan Ghiţă, Ana Maria Nicoleta Mocofan
Meanwhile the video traffic detectors have developed from the PC expansion boards to completely separated units dedicated for this process. The traffic video techniques have now a great advantage. They have the capacity to monitor a higher number of traffic lanes; they are flexible and feed a rich data stream into the traffic management system. Also, after years of research, the cost of this technology has been greatly reduced and the field experience greatly enhanced [3].
The authors’ contribution consists of developing the algorithm and the software solution for a better traffic video detection and management. In the end, the software application will have the advantage of eliminating the need of using the video producer dedicated boards, by feeding the detection results directly into the urban traffic management software.
The video detection techniques, presented in this paper, will be used, according to their efficiency and precision, to compile a software that will be able to detect traffic flow in real-time and also to feed the resulted data into different intelligent traffic management systems.
The images are captured and processed using the Lab View programming language. The vehicles entering the region of interest will be automatically counted. The traffic flow will be measured and, this way, it will be optimized with the aid of the traffic lights signal control. In the same time, a database containing the traffic flow data for each day and hour can be saved for future optimizing operations.
The two video detection methods presented in the following chapters comprise of one straight forward method and another that uses additional signal processing techniques like peak detection and square curve fitting.
2. Vehicle detection using an image template dynamic database
The first video detection method uses image templates to identify different types of vehicles that are passing through the region of interest and also their number. To accomplish this goal, a certain Lab View function must be used. This function is called “IMAQ Find Pattern” and its role is to search a predefined image (a template) into the main frame where the detection process takes place.
Using the extraction of the templates that correspond with certain vehicle types a database can be created. Later in the process, the templates stored in this database can be fitted with the objects found in the region of interest assigned to the video stream by the programmer. The template detection function is presented in Fig.1.

Traffic flow detection using lab view video processing techniques 183
Fig. 1. Template detection function [4].
The “Template” terminal represents a reference to the image that has to be detected during the detection process. The terminal can be connected to a function that feeds the template into the process. Using a couple of templates and connecting them to a larger number of similar functions it can be created a database which contains different types of vehicles. The size of this database can be determined only by the existent number of vehicle types or by the utility of this information (the relevant vehicle types are trucks, small vehicles or buses). This method allows the application to provide information like the total number of vehicles that are passing through the region of interest and also can provide a better classification of the vehicle types which leads to a better estimation of the vehicle length.
The “Search Rect” field specifies the rectangular area which hosts the region of interest.
The “Settings” field represents a cluster that defines the template localization algorithm and the information that is overlapped on the resulting image. In this situation we have two cases: shift invariant – searches for the template in the image and implies that the image is not rotated with more than 4 degrees, rotation invariant – searches for the template without any restrictions concerning the template rotation [4].
The field that feeds the information forward in the process represents the number of fittings which resulted after applying the algorithm.
In Fig.2 we can see the video processing method which uses the image template and contains the presented function.
Fig. 2. Template detection procedure.

184 Răzvan Ghiţă, Ana Maria Nicoleta Mocofan
At each step of the execution loop the function returns at the exit a value representing the number of fittings in the current frame. For incrementing this value and provide the total number of vehicles a shift register is used. The template extraction from the original image is suggested in Fig.3. As we can see, different types of vehicles are identified in the same time.
Fig. 3. The extracted templates can form a database.
After fitting the templates with the original video stream frame, which is transmitted from the field, we can determine the overall number of vehicles. The equations needed for this process are shown below.
0
n
i ii
Y X=
= ∑ (1)
10 1
n n
i i i ji j i
T Y Y X X−= = −
= + = +∑ ∑ (2)
Where, “Yi” represents the number of vehicles (all types of vehicles) that
are detected after one step. Xi represents the number of vehicles after one step, for each type of vehicle (“i” represents the type of vehicle).
“T” represents the overall number of vehicles after all steps have been executed, and for all types of vehicles. This is the final value provided by the application. In Fig.4 the software procedure can be visualized.
Traffic flow detection using lab view video processing techniques 185
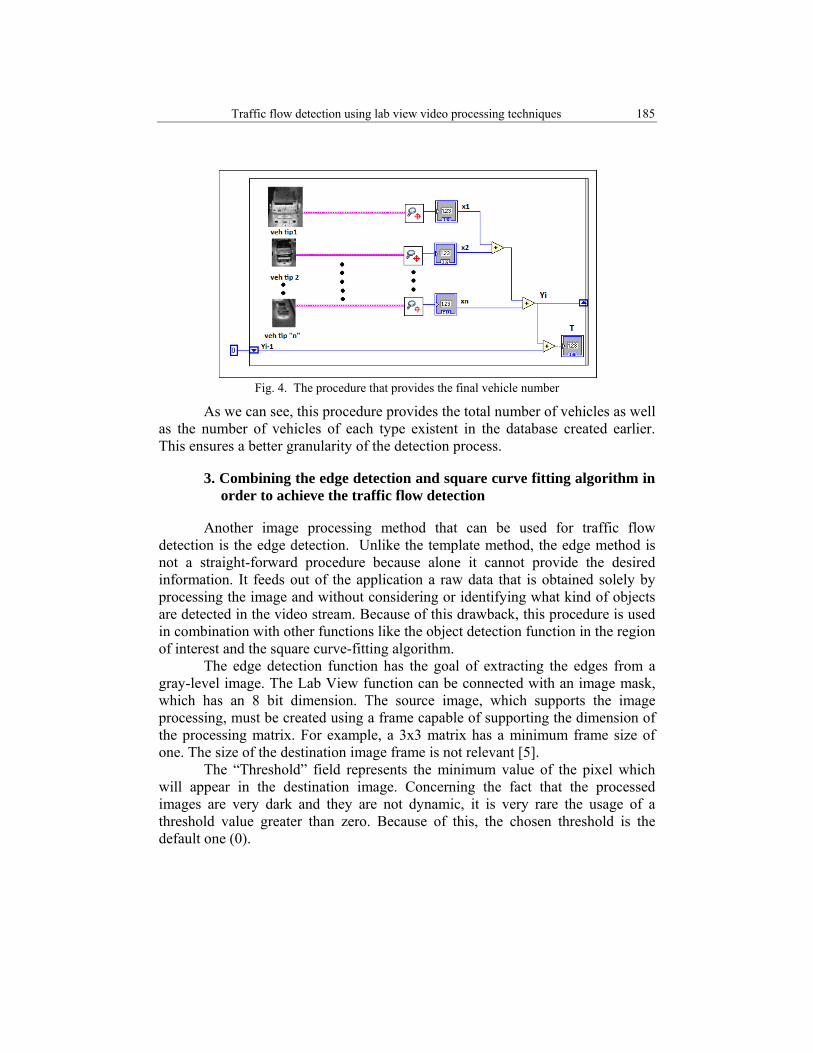
Fig. 4. The procedure that provides the final vehicle number
As we can see, this procedure provides the total number of vehicles as well as the number of vehicles of each type existent in the database created earlier. This ensures a better granularity of the detection process.
3. Combining the edge detection and square curve fitting algorithm in order to achieve the traffic flow detection
Another image processing method that can be used for traffic flow detection is the edge detection. Unlike the template method, the edge method is not a straight-forward procedure because alone it cannot provide the desired information. It feeds out of the application a raw data that is obtained solely by processing the image and without considering or identifying what kind of objects are detected in the video stream. Because of this drawback, this procedure is used in combination with other functions like the object detection function in the region of interest and the square curve-fitting algorithm.
The edge detection function has the goal of extracting the edges from a gray-level image. The Lab View function can be connected with an image mask, which has an 8 bit dimension. The source image, which supports the image processing, must be created using a frame capable of supporting the dimension of the processing matrix. For example, a 3x3 matrix has a minimum frame size of one. The size of the destination image frame is not relevant [5].
The “Threshold” field represents the minimum value of the pixel which will appear in the destination image. Concerning the fact that the processed images are very dark and they are not dynamic, it is very rare the usage of a threshold value greater than zero. Because of this, the chosen threshold is the default one (0).
186 Răzvan Ghiţă, Ana Maria Nicoleta Mocofan
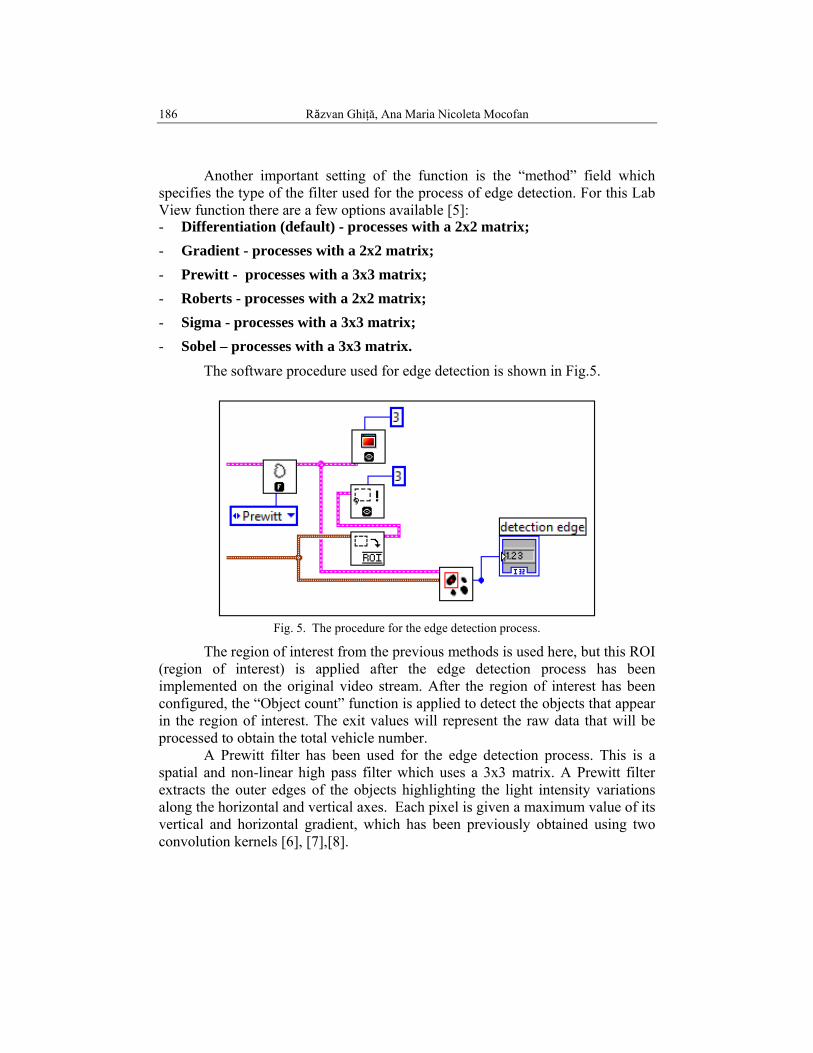
Another important setting of the function is the “method” field which specifies the type of the filter used for the process of edge detection. For this Lab View function there are a few options available [5]: - Differentiation (default) - processes with a 2x2 matrix; - Gradient - processes with a 2x2 matrix; - Prewitt - processes with a 3x3 matrix; - Roberts - processes with a 2x2 matrix; - Sigma - processes with a 3x3 matrix; - Sobel – processes with a 3x3 matrix.
The software procedure used for edge detection is shown in Fig.5.
Fig. 5. The procedure for the edge detection process.
The region of interest from the previous methods is used here, but this ROI (region of interest) is applied after the edge detection process has been implemented on the original video stream. After the region of interest has been configured, the “Object count” function is applied to detect the objects that appear in the region of interest. The exit values will represent the raw data that will be processed to obtain the total vehicle number.
A Prewitt filter has been used for the edge detection process. This is a spatial and non-linear high pass filter which uses a 3x3 matrix. A Prewitt filter extracts the outer edges of the objects highlighting the light intensity variations along the horizontal and vertical axes. Each pixel is given a maximum value of its vertical and horizontal gradient, which has been previously obtained using two convolution kernels [6], [7],[8].

Traffic flow detection using lab view video processing techniques 187
1 0 11 0 11 0 1
⎡− ⎤⎢ ⎥−⎢ ⎥⎢ ⎥− ⎦⎣
(3)
1 1 1
0 0 01 1 1
⎡− − − ⎤⎢ ⎥⎢ ⎥⎢ ⎥⎦⎣
(4)
If K(i,j) represents the intensity of the K pixel which has the coordinates
(i,j), the pixel intensities that surrounds K(i,j) can be arranged in the following way (for a 3x3 matrix)[9]:
( 1, 1) ( , 1) ( 1, 1)
( 1, ) ( , ) ( 1, )
( 1, 1) ( , 1) ( 1, 1)
i j i j i j
i j i j i j
i j i j i j
K K KK K K
K K K
− − − + −
− +
− + + + +
(5)
Considering the matrix (5) and the two Prewitt kernels we can define
the following equation: K i,j max |K i 1,j‐1 ‐K i‐1,j‐1 K i 1,j ‐K i‐1,j K i 1,j 1 ‐K i‐1,j 1 |,
|K i‐1,j 1 ‐K i‐1,j‐1 K i,j 1 ‐K i,j‐1 K i 1,j 1 ‐K i 1,j‐1 | (6)
Fig. 6. The video stream before (left) and after (right) processing.
The video stream, processed using the Prewitt Filter, is presented in Fig.6 and will be fed into the “IMAQ Count Objects” virtual instrument shown in Fig.7.

188 Răzvan Ghiţă, Ana Maria Nicoleta Mocofan
Fig. 7. IMAQ “Count Objects” virtual instrument [10].
This instrument is used to locate and measure the objects (particles of the image) found into a rectangular area. For achieving this goal a threshold is defined. The threshold is applied on the pixel intensities to detach the objects from the image background.
The image fed into this virtual instrument is transformed into a gray level image.
The “Settings” field allows the definition of certain parameters used for the detection process. In this way it is possible to ignore the objects touching the edges of the region of interest, the objects that have a smaller size compared with the defined size or the objects bigger than a pre-established level. Also we have the option of choosing whether the bright or dark objects will be detected [10]. For this particular case the bright object detection has been chosen.
The values provided by this virtual instrument are the object of peak detection algorithm that will provide the total number of the vehicles.
Fig. 8. The values generated by the „count objects” VI.
The peak detection algorithm is applied on the values presented in Fig.8 to determine the traffic flow volume. The Prewitt filter helps to provide a set of more homogeneous values, making the detection process easier this way.
The peak detection will have a defined dimension of 3 and a threshold value of 12. With these settings only the peaks that have a value equal or greater than 12 will be detected. In Fig.8 we can see the threshold applied to these values.
The peak detection algorithm uses a square curve fitting method to determine the location and the number of peaks present in a signal. The chart in Fig.9 illustrates the fitting of a 6 degree polynomial curve that was fitted on the values.

Traffic flow detection using lab view video processing techniques 189
Fig. 9. Fitting a 6 degree polynomial over the obtained values.
Concerning the fact that the fitting function of Excel is limited to a 6 degree polynomial, the fitting of a greater polynomial (8 degree) is made using the Lab View programming language peak detection function presented in Fig.10. This curve defines better the values resulted earlier in the detection process.
Fig. 10. The peak detection function [10].
The equations defining the two curves are shown below:
190 Răzvan Ghiţă, Ana Maria Nicoleta Mocofan
10 6 8 5 6 4 25 7 2 0.054 1.165 0.872y e x e x e x x x− − −= − − − + − (7) 12 8 10 7 7 6 6 51.65 6.6 1.03 7.8y e x e x e x e x− − − −= − + − + 4 4 3 3 4 2 5 92.91 4.27 4.66 3.25 3.65e x e x e x e x e− − − − −− + + + + (8)
Despite the capability of fitting an 8 degree polynomial, the peak detection
algorithm will use the square curve fitting method.
The drawbacks of this method consist of the incapability to provide the vehicle classification information. Thereby only the total number of the vehicles is provided for the traffic management system.
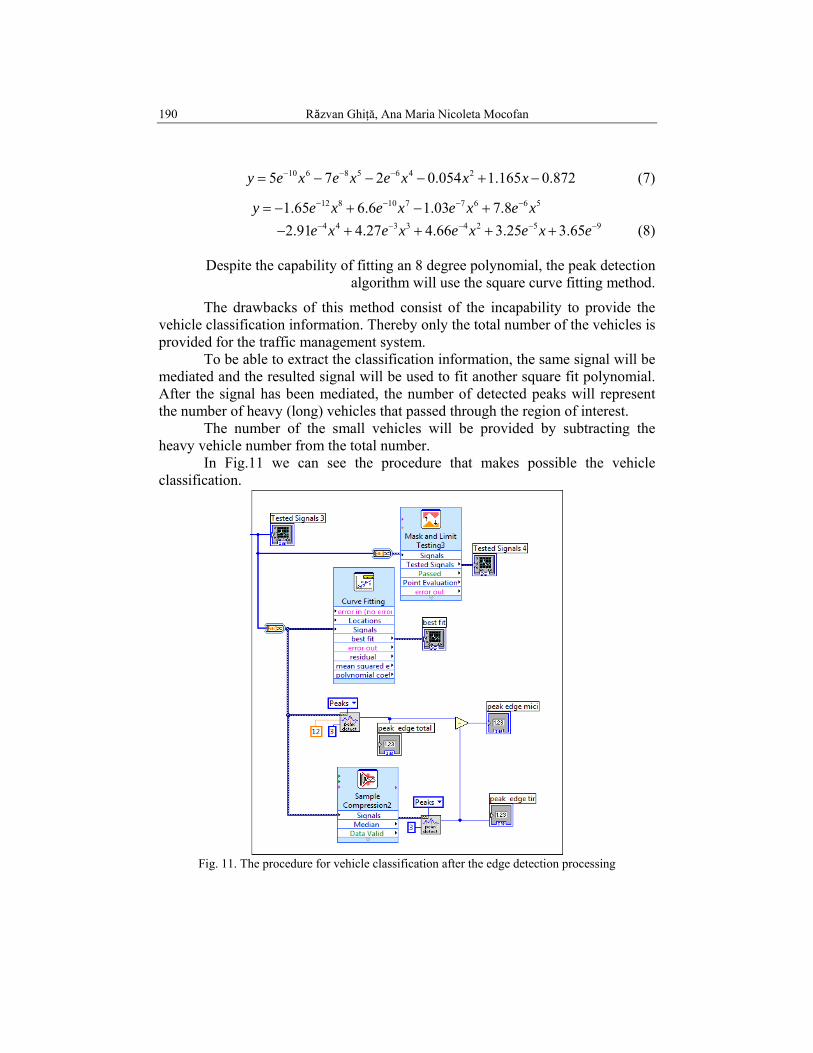
To be able to extract the classification information, the same signal will be mediated and the resulted signal will be used to fit another square fit polynomial. After the signal has been mediated, the number of detected peaks will represent the number of heavy (long) vehicles that passed through the region of interest.
The number of the small vehicles will be provided by subtracting the heavy vehicle number from the total number.
In Fig.11 we can see the procedure that makes possible the vehicle classification.
Fig. 11. The procedure for vehicle classification after the edge detection processing

Traffic flow detection using lab view video processing techniques 191
4. Conclusions
The authors propose the developing of an efficient traffic video detection algorithm, capable of reducing the costs needed for implementing such a system. In order to achieve this, a couple of video processing methods have been developed and tested in order to obtain a higher efficiency.
The video processing and the necessary programming were performed using a Lab View 7.1 programming language with a Lab View Run-time module version 8.6 and an IMAQ Vision module version 6.1.
It is clear that the two video traffic detection methods presented in the upper paragraphs are using different technologies, which implies different benefits and drawbacks.
The first processing method, the template video processing, is a straightforward method that feeds the desired information (the number of vehicles) directly at the exit of the virtual instrument. This fact saves resources, processing power and also valuable time. Also, another benefit is represented by the granular classification of the road vehicles that can be provided for the traffic management system. With this classification, a better approximation of the road space occupied by the vehicle at a line stop is possible.
The database containing the types of vehicles is a dynamic database that can be enriched by the user, at a level desired by him or at a level that keeps this granulation process more practical.
The second video detection method is more elaborate and combines the edge detection, Prewitt filter, count objects function, peak detection and square curve fitting to obtain the total number of vehicles. This is not a straightforward method because it needs a chain of video processing functions and mathematical algorithms to obtain the final information. Also this method cannot provide a granular classification without an algorithm that subtracts the heavy vehicle number from the total number of vehicles to obtain the small vehicle number. The heavy vehicle number is obtained after a signal mediation process and another peak detection process.
The results show that the edge detection method presented in the third chapter outperforms the template image method which, despite its better classification capability, is not able to perform the congestion detection. Also, the edge detection method has a good curve-fitting statistical factor, when we consider the entire set o values resulted from the image manipulation (Fig.9). The image template method has an unranked statistical factor because it does not use the curve fitting algorithm.
The further research work will include the integration of these methods with a couple of night detection algorithms and also the development of a proper

192 Răzvan Ghiţă, Ana Maria Nicoleta Mocofan
communication topology capable of integrating these traffic flow detection algorithms.
Acknowledgements The work has been funded by the Operational Programme Human
Resources Development 2007-2013 of the Romanian Ministry of Labour, Family and Social Protection through the Financial Agreement POSDRU/107/1.5/S/76813.
R E F E R E N C E S
[1] Dr. Peter T. Martin, Uqi Feng, Xiaodong Wang, Detector Technology Evaluation, Mountain-Plains Consortium, November 2003
[2] Marius Minea, Florin Domnel Grafu – „Telematică în Transporturi ,no�iuni fundamentale şi aplica�ii” (Telematics in transport, applications and fundamental principles), Matrixrom, Bucharest, 2007.
[3] Luz Elena Y. Mimbela and Lawrence A. Klein. A Summary of Vehicle Detection and Surveillance Technologies used in Intelligent Transportation Systems, the Vehicle Detector Clearinghouse, New Mexico State University, Fall 2000
[4] NI Vision 2009 for LabVIEW Help, Edition Date: June 2009 [5] National Instruments, Imaq Vision for G, Iunie 1997. [6] Jain A. K., Fundamentals of Digital Image Processing, Prentice Hall, 1989. [7] Russ J. C., The Image Processing, Third Edition. CRC, Springer, IEEE Press, 1999. [8] Frank Y. Shih, Image processing and pattern recognition, IEEE Press, 2010 [9] Thomas Klinger, Image Processing with LabView, 11 Iunie 2003 [10] NI Vision 2010 for LabVIEW Help, Edition Date: June 2010.


![Vehicle License Plate Detection: A Surveylicense plate using image processing technologies [17]. LPR is used in various traffic applications, such as dynamic traffic control emergency](https://img.dokumen.tips/doc/110x75/5ec7d115cc408c7a5355965e/vehicle-license-plate-detection-a-survey-license-plate-using-image-processing-technologies.jpg)