Embed Size (px)
Citation preview

Traffic and Transport Assessment
Sorrento Ferry Terminal CG150265
Prepared for Searoad Ferries
15 December 2016
Traffic and Transport Assessment Sorrento Ferry Terminal
15 December 2016 Cardno ii
Document Information
Prepared for Searoad Ferries
Project Name Sorrento Ferry Terminal
File Reference CG150265REP001F01JPM.docx
Job Reference CG150265
Date 15 December 2016
Contact Information
Cardno Victoria Pty Ltd
Trading as Cardno
ABN 47 106 610 913
Level 4
501 Swanston Street
Melbourne
Victoria 3000 Australia
Telephone: (03) 8415 7777
Facsimile: (03) 8415 7788
International: +61 3 8415 7777
www.cardno.com
Document Control
Version Date Author Author Initials
Reviewer Reviewer Initials
F01 15/12/16 Sam Mulligan SM John-Paul Maina JPM
D02 10/08/16 Sam Mulligan - John-Paul Maina -
D01 15/09/15 Luke Richardson - John-Paul Maina -
© Cardno. Copyright in the whole and every part of this document belongs to Cardno and may not be used, sold, transferred, copied or reproduced in whole or in part in any manner or form or in or on any media to any person other than by agreement with Cardno.
This document is produced by Cardno solely for the benefit and use by the client in accordance with the terms of the engagement. Cardno does not and shall not assume any responsibility or liability whatsoever to any third party arising out of any use or reliance by any third party on the content of this document.

Traffic and Transport Assessment Sorrento Ferry Terminal
15 December 2016 Cardno iii
Table of Contents
1 Introduction 6
2 Existing Conditions 6
2.1 Site Location and Layout 6
2.2 Existing Operation 8
2.3 Site Accessibility 9
2.3.1 Vehicles 9
2.3.2 Pedestrians 9
2.3.3 Cyclists 9
2.3.4 Public Transport 9
2.4 Surrounding Road Network and Intersections 12
2.4.1 Roads 12
2.4.2 Intersections 17
2.5 Draft Vehicle and Pedestrian Strategy Report 21
2.6 Existing Traffic Conditions 22
2.6.1 Traffic Volumes 22
2.6.2 Vehicle Queue Lengths – Southern Esplanade Approach to Sorrento Ferry Terminal 25
2.6.3 Pedestrian & Cyclist Volumes 26
2.6.4 Existing Intersection Operation 28
2.6.5 Existing Car Park Occupancy 31
3 Proposal 33
4 Traffic Considerations 34
4.1 General 34
4.2 Anticipated Future Volumes 34
4.2.1 Redistributed Traffic 34
4.2.2 Circulating Traffic 34
4.3 Anticipated Future Intersection Operating Conditions 36
4.4 Recommendations 38
5 Parking Considerations 38
5.1 Provision 38
5.2 Design 38
6 Public Transport 39
6.1 Design Considerations 39
6.2 Potential Service Changes 39
6.3 Impact of Terminal Access Redesign 40
7 Pedestrians 41
8 Review of Vehicle and Pedestrian Strategy Against Proposal 44
8.1.1 Esplanade / Sorrento Ferry Terminal 44
8.1.2 Point Nepean Road / Esplanade 44
8.1.3 Hotham Road / Point Nepean Road 45
8.1.4 Point Nepean Road / Ocean Beach Road / Constitution Hill Road 47
9 Conclusions 48

Traffic and Transport Assessment Sorrento Ferry Terminal
15 December 2016 Cardno iv
Appendices
Appendix A Car Park Occupancy Survey Results
Appendix B Functional Layout Concept – Esplanade / Ferry Terminal
Appendix C Functional Layout Concept – Point Nepean Rd / Hotham Rd
Appendix D Pedestrian Crossing Facility Selection Tool
Tables
Table 2-1 Ferry Timetable – Sorrento Ferry Terminal 8
Table 2-2 Recommendations: Draft Vehicle and Pedestrian Strategy Report for Policemans Point – Esplanade Precinct, Sorrento 21
Table 2-3 Rating of Degrees of Saturation 29
Table 2-4 Existing Intersection Operation – Esplanade / Sorrento Ferry Terminal 30
Table 2-5 Existing Intersection Operation – Esplanade / Point Nepean Road 30
Table 2-6 Existing Intersection Operation – Point Nepean Road / Ocean Beach Road / Constitution Hill Road 30
Table 2-7 Existing Intersection Operation – Point Nepean Road / Hotham Road 30
Table 4-1 Future Operation – Esplanade / Sorrento Ferry Terminal 36
Table 4-2 Future Operation – Esplanade / Point Nepean Road 37
Table 4-3 Future Operation – Point Nepean Road / Ocean Beach Road / Constitution Hill Road 37
Table 4-4 Future Operation – Point Nepean Road / Hotham Road 37
Table 4-5 Future Operation – Esplanade / Ferry Terminal Access 37
Table 8-1 Future Intersection Operation – Point Nepean Road / Hotham Road - Roundabout 46
Table 8-2 Future Intersection Operation Sunday Peak – Point Nepean Road / Ocean Beach Road / Constitution Hill Road - Roundabout 47
Figures
Figure 2-1 Site Location 6
Figure 2-2 Existing Site Layout Aerial 7
Figure 2-3 Vehicle Access Plan 10
Figure 2-4 Pedestrian Access Plan 11
Figure 2-5 Aerial View of the Esplanade in the Vicinity of the Site 12
Figure 2-6 Aerial View of Hotham Road in the Vicinity of the Site 13
Figure 2-7 Aerial View of Point Nepean Road in the Vicinity of the Site 14
Figure 2-8 Aerial View of Ocean Beach Road in the Vicinity of the Site 15
Figure 2-9 Aerial View of Constitution Hill Road in the Vicinity of the Site 16
Figure 2-10 Esplanade / Ferry Terminal Intersection Aerial 17
Figure 2-11 Esplanade / Point Nepean Road Intersection Aerial 18
Figure 2-12 Hotham Road / Point Nepean Road Intersection Aerial 19
Figure 2-13 Point Nepean Road / Ocean Beach Road / Constitution Hill Road Intersection Aerial 20
Figure 2-14 Sunday Peak Hour Traffic Volumes – Sorrento Ferry Terminal and Surrounds 22
Figure 2-15 Saturday Peak Hour Traffic Volumes – Sorrento Ferry Terminal and Surrounds 23

Traffic and Transport Assessment Sorrento Ferry Terminal
15 December 2016 Cardno v
Figure 2-16 Composite Peak Hour Traffic Volumes – Sorrento Ferry Terminal and Surrounds 24
Figure 2-17 Vehicle Queue Length – Southern Esplanade Approach to Sorrento Ferry Terminal – Sunday 5 April 2015 (Easter Sunday) 25
Figure 2-18 Pedestrian and Cyclist Count Locations 26
Figure 2-19 Pedestrian Movement Profile – Sorrento Ferry Terminal – Sunday 5 April 2015 (Easter Sunday) 27
Figure 2-20 Cyclist Profile – Sorrento Ferry Terminal – Sunday 5 April 2015 (Easter Sunday) 27
Figure 2-21 Saturday Peak Hour Pedestrian Volumes – Sorrento Ferry Terminal and Surrounds 28
Figure 2-22 Car Parking Survey Map 31
Figure 2-23 Car Parking Profile – Sunday 5 April 2015 (Easter Sunday) 32
Figure 3-1 Proposed Reconfiguration of Esplanade / Ferry Terminal Intersection 33
Figure 4-1 Anticipated Changes to Traffic Distribution – Esplanade / Ferry Terminal 35
Figure 4-2 Anticipated Changes to Traffic Distribution – Greater Precinct 35
Figure 4-3 Anticipated Future Peak Period Traffic Volumes 36
Figure 6-1 Proposed Bus Stop Location 39
Figure 7-1 Proposed Pedestrian Path Routes 41

Traffic and Transport Assessment Sorrento Ferry Terminal
15 December 2016 Cardno 6
1 Introduction
Cardno has been engaged by Searoad Ferries to undertake a review of the traffic, transport and parking
implications as a result of the proposed reconfiguration of the access arrangements to the Sorrento Ferry
Terminal.
In the course of preparing this assessment:
> The subject site and its environs have been inspected;
> Traffic and parking data collected and analysed;
> Functional layout plans prepared – in consultation with relevant stakeholders;
> Consideration given to the historical draft vehicle and pedestrian strategy report prepared for Mornington
Peninsula Shire; and
> Reference made to relevant standards and design guidelines.
Our opinions with respect to the proposal follow.
2 Existing Conditions
2.1 Site Location and Layout
The Sorrento Ferry Terminal is located on the east side of the Esplanade in Sorrento, at the southern end of
the Port Phillip Bay, as shown in Figure 2-1.
Figure 2-1 Site Location
The Sorrento Ferry Terminal includes a vehicle boarding area, a vehicle alighting area, the Sorrento Pier and
the Sorrento Pier Car Park. An aerial of the existing site layout is provided in Figure 2-2 overleaf.
Surrounding land use is a mixture of residential, commercial and recreational in nature. Of particular note,
the Sorrento Historic Park, Hotel Sorrento and a Police Station are located to the west of the terminal, whilst
the Sorrento Neighbourhood Activity Centre (NAC) is located approximately 400 metres to the southwest of
the site.
Sorrento Ferry Terminal

Traffic and Transport Assessment Sorrento Ferry Terminal
15 December 2016 Cardno 7
Figure 2-2 Existing Site Layout Aerial
Vehicle Boarding Area
Vehicle Alighting Area
Sorrento Pier
Sorrento Pier Car Park

Traffic and Transport Assessment Sorrento Ferry Terminal
15 December 2016 Cardno 8
2.2 Existing Operation
The Queenscliff – Sorrento Ferry is operated by Searoad Ferries and links the Bellarine Peninsula with the
Mornington Peninsula.
The ferry takes both foot passengers and vehicles on board, with vehicle boarding and alighting areas
provided as shown in Figure 2-2.
The ferry takes approximately 45 minutes, with a ferry departing Queenscliff every hour between 6:00am and
6:00pm and a ferry departing Sorrento every hour between 7:00am and 6:00pm. It is noted that the 6:00am
ferry from Queenscliff does not take vehicles.
An additional service operates at 7:00pm from both Queenscliff and Sorrento during high peak periods which
include:
> Every day between 26 December – 31 January,
> Throughout February on weekends only (Friday, Saturday and Sunday); and
> Labour Day and Easter long weekends.
A summary of the timetable at the Sorrento Ferry Terminal is provided in Table 2-1.
Table 2-1 Ferry Timetable – Sorrento Ferry Terminal
Arrivals Departures
6:45am1 7:00am
7:45am 8:00am
8:45am 9:00am
9:45am 10:00am
10:45am 11:00am
11:45am 12:00pm
12:45pm 1:00pm
1:45pm 2:00pm
2:45pm 3:00pm
3:45pm 4:00pm
4:45pm 5:00pm
5:45pm 6:00pm
6:45pm 7:00pm2
7:45pm2
1. Service does not take vehicles
2. Operates every day between 26 December – 31 January, throughout February on weekends only (Friday, Saturday and Sunday) and
on Labour Day and Easter long weekends.
Where tickets have not been booked online, Searoad Ferries recommends the following to their clients:
> Arrive 15 – 20 minutes prior to departure on a typical day; or
> Arrive 30 – 40 minutes prior to departure during the busy period between 26 December – 31 January and
the Easter weekend to book tickets.
Traffic and Transport Assessment Sorrento Ferry Terminal
15 December 2016 Cardno 9
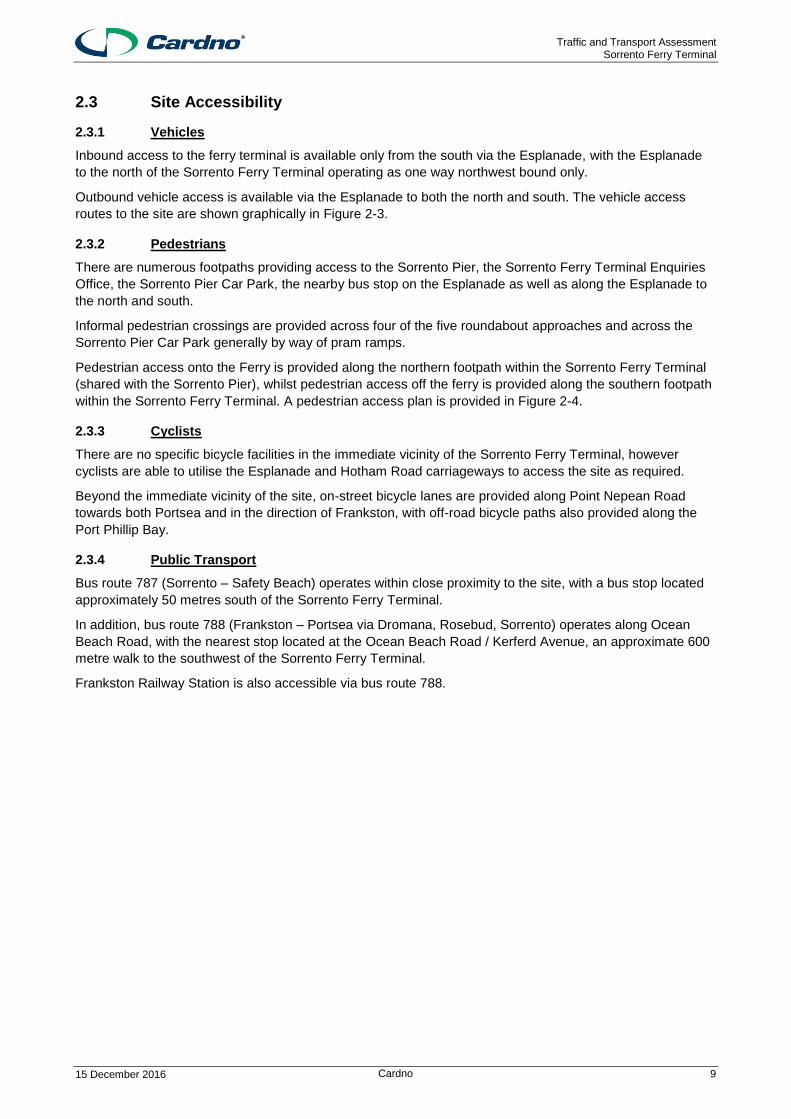
2.3 Site Accessibility
2.3.1 Vehicles
Inbound access to the ferry terminal is available only from the south via the Esplanade, with the Esplanade
to the north of the Sorrento Ferry Terminal operating as one way northwest bound only.
Outbound vehicle access is available via the Esplanade to both the north and south. The vehicle access
routes to the site are shown graphically in Figure 2-3.
2.3.2 Pedestrians
There are numerous footpaths providing access to the Sorrento Pier, the Sorrento Ferry Terminal Enquiries
Office, the Sorrento Pier Car Park, the nearby bus stop on the Esplanade as well as along the Esplanade to
the north and south.
Informal pedestrian crossings are provided across four of the five roundabout approaches and across the
Sorrento Pier Car Park generally by way of pram ramps.
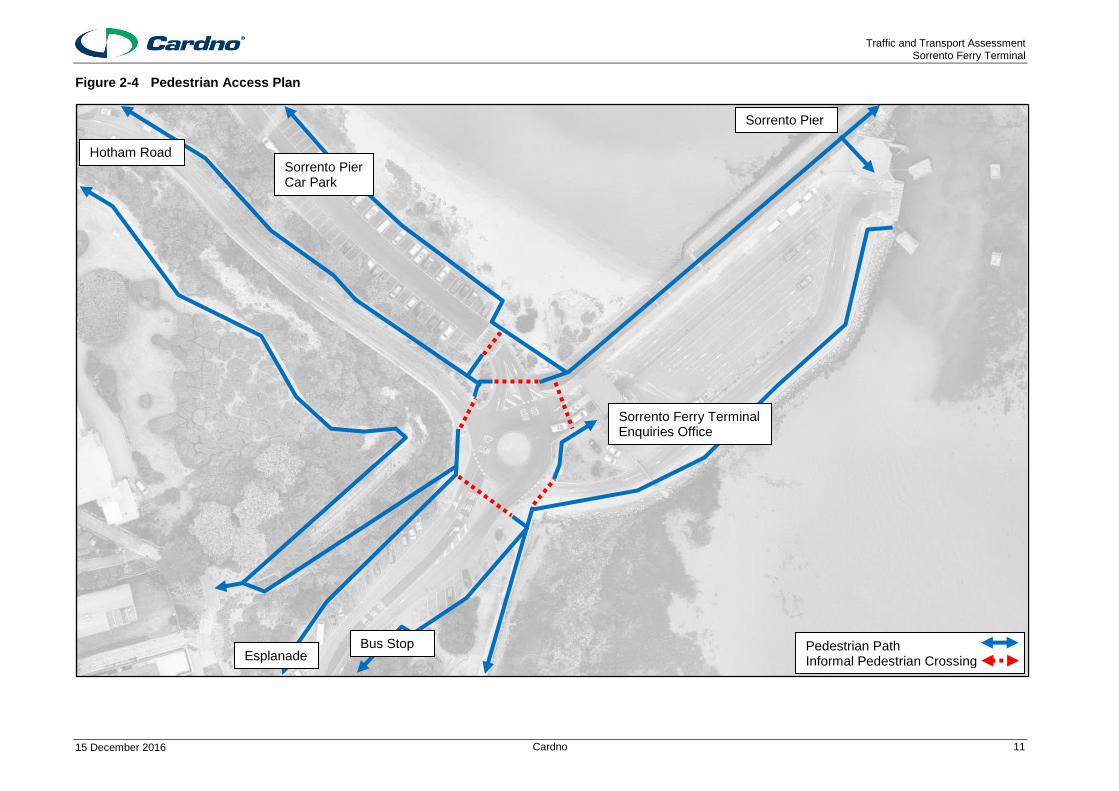
Pedestrian access onto the Ferry is provided along the northern footpath within the Sorrento Ferry Terminal
(shared with the Sorrento Pier), whilst pedestrian access off the ferry is provided along the southern footpath
within the Sorrento Ferry Terminal. A pedestrian access plan is provided in Figure 2-4.
2.3.3 Cyclists
There are no specific bicycle facilities in the immediate vicinity of the Sorrento Ferry Terminal, however
cyclists are able to utilise the Esplanade and Hotham Road carriageways to access the site as required.
Beyond the immediate vicinity of the site, on-street bicycle lanes are provided along Point Nepean Road
towards both Portsea and in the direction of Frankston, with off-road bicycle paths also provided along the
Port Phillip Bay.
2.3.4 Public Transport
Bus route 787 (Sorrento – Safety Beach) operates within close proximity to the site, with a bus stop located
approximately 50 metres south of the Sorrento Ferry Terminal.
In addition, bus route 788 (Frankston – Portsea via Dromana, Rosebud, Sorrento) operates along Ocean
Beach Road, with the nearest stop located at the Ocean Beach Road / Kerferd Avenue, an approximate 600
metre walk to the southwest of the Sorrento Ferry Terminal.
Frankston Railway Station is also accessible via bus route 788.

Traffic and Transport Assessment Sorrento Ferry Terminal
15 December 2016 Cardno 10
Figure 2-3 Vehicle Access Plan
Esplanade
Hotham Road
Point Nepean Road
Ocean Beach Road Point Nepean Road
Hotham Road
Sorrento Ferry Terminal
Inbound Vehicle Routes Outbound Vehicle Routes
Esplanade
Traffic and Transport Assessment Sorrento Ferry Terminal
15 December 2016 Cardno 11
Figure 2-4 Pedestrian Access Plan
Sorrento Pier
Sorrento Pier Car Park
Hotham Road
Esplanade Bus Stop
Sorrento Ferry Terminal Enquiries Office
Pedestrian Path Informal Pedestrian Crossing

Traffic and Transport Assessment Sorrento Ferry Terminal
15 December 2016 Cardno 12
2.4 Surrounding Road Network and Intersections
2.4.1 Roads
2.4.1.1 Esplanade
The Esplanade is aligned generally in a north-south direction, extending north from Point Nepean Road and
past the Sorrento Ferry Terminal, before continuing as Hotham Road.
South of the Ferry Terminal, the Esplanade generally operates with a single traffic lane in each direction,
with intermittent angle and parallel parking provided along both sides, clear of traffic.
North of the Ferry Terminal, the Esplanade operates as one way northwest bound only, with a single traffic
lane. An aerial view of the Esplanade in the vicinity of the site is provided in Figure 2-5.
Figure 2-5 Aerial View of the Esplanade in the Vicinity of the Site
Esplanade
Esplanade Sorrento Ferry Terminal

Traffic and Transport Assessment Sorrento Ferry Terminal
15 December 2016 Cardno 13
2.4.1.2 Hotham Road
Hotham Road is aligned generally in an east-west direction, extending west as the continuation of the
Esplanade in Sorrento to Back Beach Road in Portsea.
In the vicinity of the site, Hotham Road operates with a varying cross section.
Between The Esplanade and Austin Avenue, Hotham Road operates as one way westbound only, with a
single traffic lane and intermittent parallel and angle parking provided along both sides, clear of traffic.
Between Austin Avenue and Point Nepean Road, Hotham Road operates with a single traffic lane in each
direction, with intermittent formal and informal angle parking permitted on both sides, clear of traffic and a
small section of angle parking within a central median.
West of Point Nepean Road, Hotham Road operates with a single traffic lane in each direction, with parallel
parking permitted alongside both kerbs, clear of traffic.
An aerial view of Hotham Road in the vicinity of the site is provided in Figure 2-6.
Figure 2-6 Aerial View of Hotham Road in the Vicinity of the Site
Point Nepean Road
Hotham Road
Hotham Road
Austin Avenue
Traffic and Transport Assessment Sorrento Ferry Terminal
15 December 2016 Cardno 14
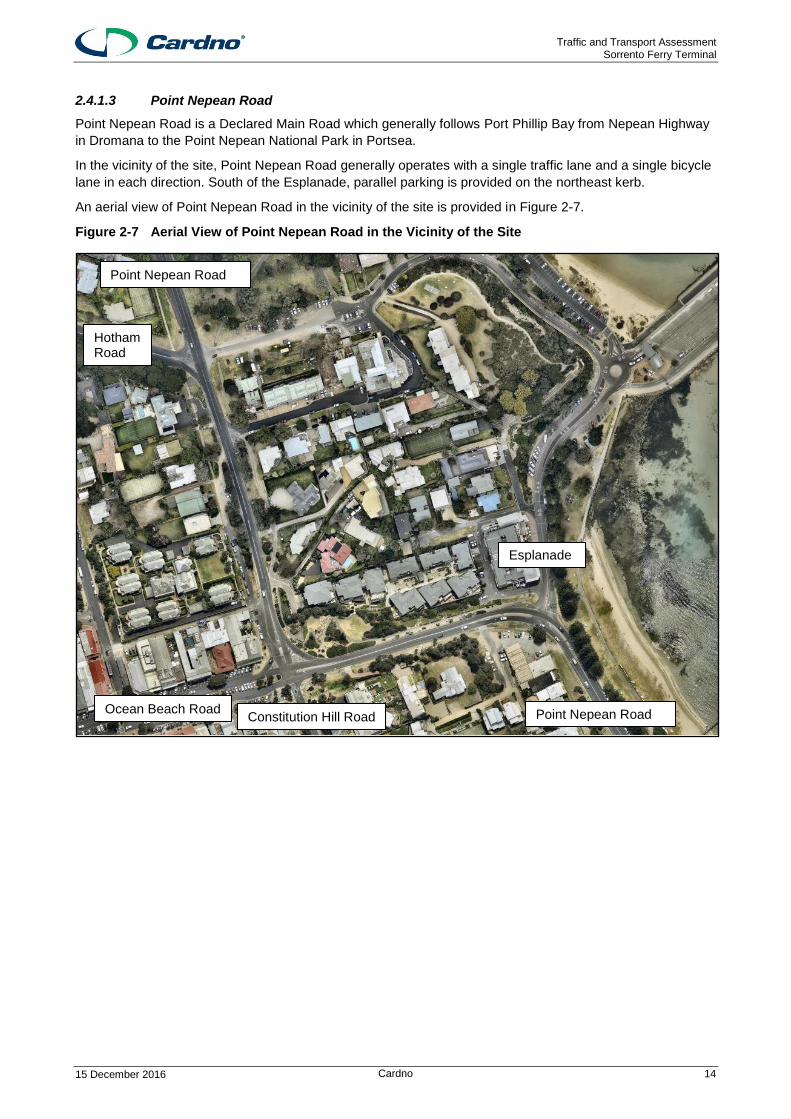
2.4.1.3 Point Nepean Road
Point Nepean Road is a Declared Main Road which generally follows Port Phillip Bay from Nepean Highway
in Dromana to the Point Nepean National Park in Portsea.
In the vicinity of the site, Point Nepean Road generally operates with a single traffic lane and a single bicycle
lane in each direction. South of the Esplanade, parallel parking is provided on the northeast kerb.
An aerial view of Point Nepean Road in the vicinity of the site is provided in Figure 2-7.
Figure 2-7 Aerial View of Point Nepean Road in the Vicinity of the Site
Point Nepean Road
Point Nepean Road
Ocean Beach Road
Esplanade
Constitution Hill Road
Hotham Road
Traffic and Transport Assessment Sorrento Ferry Terminal
15 December 2016 Cardno 15
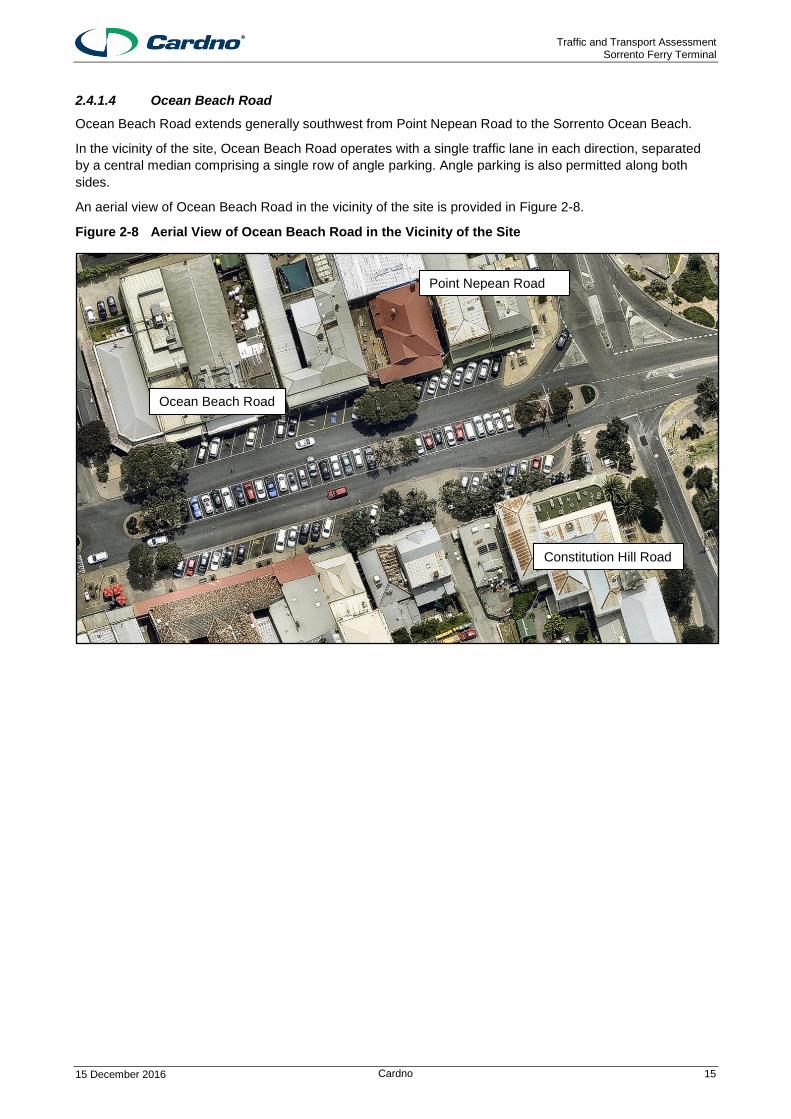
2.4.1.4 Ocean Beach Road
Ocean Beach Road extends generally southwest from Point Nepean Road to the Sorrento Ocean Beach.
In the vicinity of the site, Ocean Beach Road operates with a single traffic lane in each direction, separated
by a central median comprising a single row of angle parking. Angle parking is also permitted along both
sides.
An aerial view of Ocean Beach Road in the vicinity of the site is provided in Figure 2-8.
Figure 2-8 Aerial View of Ocean Beach Road in the Vicinity of the Site
Ocean Beach Road
Constitution Hill Road
Point Nepean Road

Traffic and Transport Assessment Sorrento Ferry Terminal
15 December 2016 Cardno 16
2.4.1.5 Constitution Hill Road
Constitution Hill Road is a local road which generally extends north-south between Point Nepean Road and
Coppin Road.
In the vicinity of the site, Constitution Hill Road operates with a single traffic lane in each direction.
Intermittent angle parking is provided on the west side, with parallel parking permitted on the east kerb.
An aerial view of Constitution Hill Road in the vicinity of the site is provided in Figure 2-9.
Figure 2-9 Aerial View of Constitution Hill Road in the Vicinity of the Site
Constitution Hill Road
Ocean Beach Road
Traffic and Transport Assessment Sorrento Ferry Terminal
15 December 2016 Cardno 17
2.4.2 Intersections
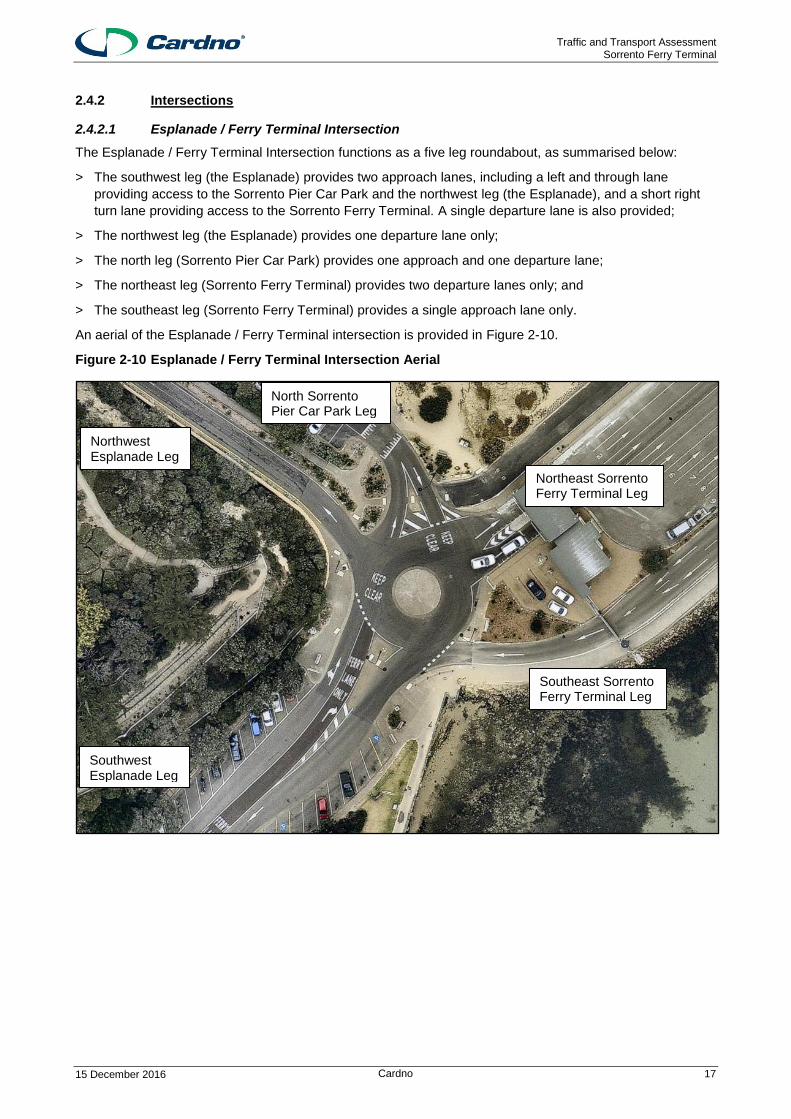
2.4.2.1 Esplanade / Ferry Terminal Intersection
The Esplanade / Ferry Terminal Intersection functions as a five leg roundabout, as summarised below:
> The southwest leg (the Esplanade) provides two approach lanes, including a left and through lane
providing access to the Sorrento Pier Car Park and the northwest leg (the Esplanade), and a short right
turn lane providing access to the Sorrento Ferry Terminal. A single departure lane is also provided;
> The northwest leg (the Esplanade) provides one departure lane only;
> The north leg (Sorrento Pier Car Park) provides one approach and one departure lane;
> The northeast leg (Sorrento Ferry Terminal) provides two departure lanes only; and
> The southeast leg (Sorrento Ferry Terminal) provides a single approach lane only.
An aerial of the Esplanade / Ferry Terminal intersection is provided in Figure 2-10.
Figure 2-10 Esplanade / Ferry Terminal Intersection Aerial
Southwest Esplanade Leg
Northwest Esplanade Leg
North Sorrento Pier Car Park Leg
Northeast Sorrento Ferry Terminal Leg
Southeast Sorrento Ferry Terminal Leg

Traffic and Transport Assessment Sorrento Ferry Terminal
15 December 2016 Cardno 18
2.4.2.2 Esplanade / Point Nepean Road Intersection
The Esplanade / Point Nepean Road intersection is a ‘Stop’ controlled T-intersection, with priority provided to
Point Nepean Road. The three legs of the intersection are summarised as follows:
> The south leg (Point Nepean Road) comprises a through lane and a short right turn deceleration lane on
approach and a single departure lane;
> The west leg (Point Nepean Road) comprises a through lane and a short left turn deceleration lane on
approach and a single departure lane; and
> The north leg (the Esplanade) comprises a left turn lane and a right turn lane on approach and a single
departure lane.
An aerial of the Esplanade / Point Nepean Road intersection is provided in Figure 2-11.
Figure 2-11 Esplanade / Point Nepean Road Intersection Aerial
South Point Nepean Road Leg
West Point Nepean Road Leg
North Esplanade Leg

Traffic and Transport Assessment Sorrento Ferry Terminal
15 December 2016 Cardno 19
2.4.2.3 Hotham Road / Point Nepean Road Intersection
The Hotham Road / Point Nepean Road intersection is a ‘Give Way’ controlled cross intersection, with
priority provided to Point Nepean Road. All four legs comprise a single lane both on approach and departure.
An aerial of the Hotham Road / Point Nepean Road intersection is provided in Figure 2-12.
Figure 2-12 Hotham Road / Point Nepean Road Intersection Aerial
South Point Nepean Road Leg
North Point Nepean Road Leg
West Hotham Road Leg
East Hotham Road Leg
Traffic and Transport Assessment Sorrento Ferry Terminal
15 December 2016 Cardno 20
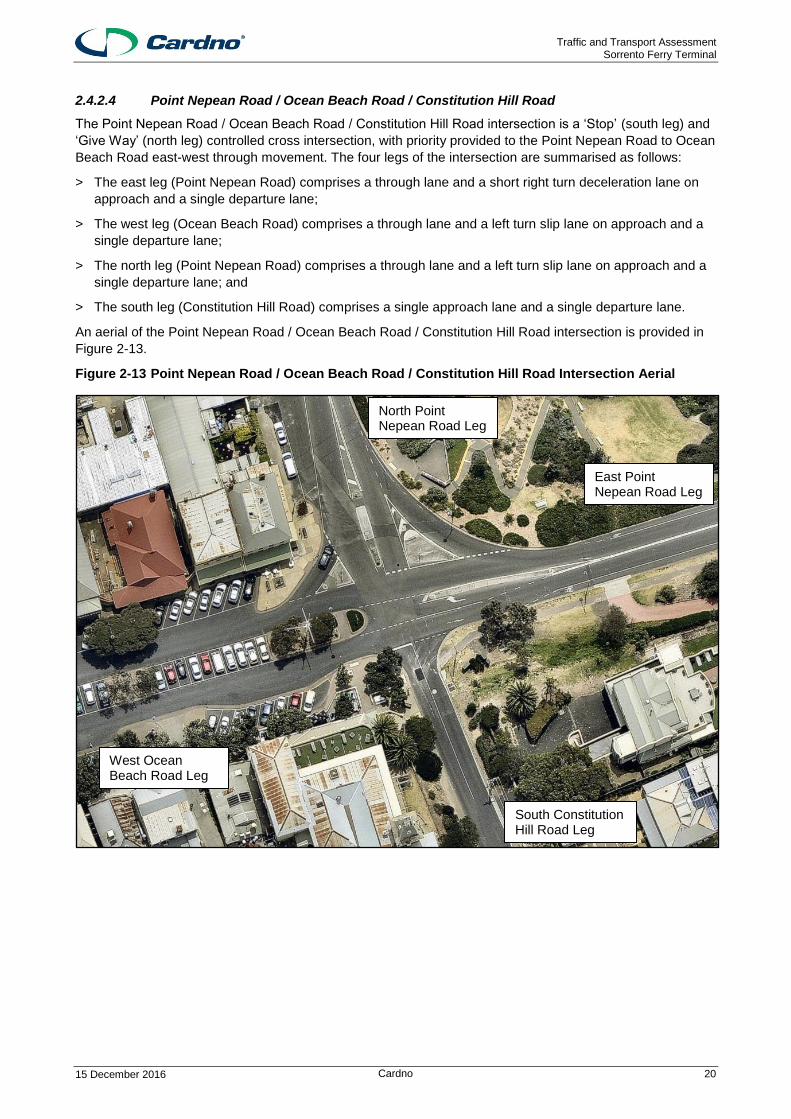
2.4.2.4 Point Nepean Road / Ocean Beach Road / Constitution Hill Road
The Point Nepean Road / Ocean Beach Road / Constitution Hill Road intersection is a ‘Stop’ (south leg) and
‘Give Way’ (north leg) controlled cross intersection, with priority provided to the Point Nepean Road to Ocean
Beach Road east-west through movement. The four legs of the intersection are summarised as follows:
> The east leg (Point Nepean Road) comprises a through lane and a short right turn deceleration lane on
approach and a single departure lane;
> The west leg (Ocean Beach Road) comprises a through lane and a left turn slip lane on approach and a
single departure lane;
> The north leg (Point Nepean Road) comprises a through lane and a left turn slip lane on approach and a
single departure lane; and
> The south leg (Constitution Hill Road) comprises a single approach lane and a single departure lane.
An aerial of the Point Nepean Road / Ocean Beach Road / Constitution Hill Road intersection is provided in
Figure 2-13.
Figure 2-13 Point Nepean Road / Ocean Beach Road / Constitution Hill Road Intersection Aerial
East Point Nepean Road Leg
North Point Nepean Road Leg
West Ocean Beach Road Leg
South Constitution Hill Road Leg

Traffic and Transport Assessment Sorrento Ferry Terminal
15 December 2016 Cardno 21
2.5 Draft Vehicle and Pedestrian Strategy Report
The Draft Vehicle and Pedestrian Strategy Report for Policemans Point – Esplanade Precinct, Sorrento, was
prepared for the Mornington Peninsula Shire by Leigh Hale Consulting Services Pty Ltd in 2001 in response
to community concerns relating to traffic and pedestrian movements within the Esplanade Precinct.
Key issues reviewed included:
> Congestion along the Esplanade from Point Nepean Road to the Ferry Terminal;
> Pedestrian access and control; and
> Operation of intersections and traffic flow.
Of particular relevance to this report, the Vehicle and Pedestrian Strategy Report set out a number of
recommendations in relation to intersections near the Sorrento Ferry Terminal.
A summary of the recommendations and their status is provided as Table 2-2.
Table 2-2 Recommendations: Draft Vehicle and Pedestrian Strategy Report for Policemans Point – Esplanade Precinct, Sorrento
Recommendation Status
Esplanade / Sorrento Ferry Terminal
Construction of a roundabout to reduce confusion and improve traffic flows Complete
Introduction of pedestrian crossings to improve pedestrian safety Complete
Point Nepean Road / Esplanade:
Increase storage length for the right turn lane on Point Nepean Road into the Esplanade; Outstanding
Improved left turn slip lane for vehicles coming out of the Esplanade into Point Nepean Road Outstanding
Introduce pedestrian crossing approximately 60 metres east of the intersection Partially Complete
Provide both right turn and left turn lanes (into Point Nepean Road) in the Esplanade for approximately 50 metres;
Partially Complete
Introduce a centre protection median in Point Nepean Road for right turning vehicles from the Esplanade
Complete
Introduce a keep clear zone in Point Nepean Road to allow for turning movements in and out of the Esplanade during interrupted heavy traffic flow in Point Nepean Road
Outstanding
Interactive signs in Point Nepean Road providing advice to drivers on ferry availability to redirect vehicles away from the Esplanade congestion at peak times and reduce unnecessary queueing
Outstanding
Hotham Road / Point Nepean Road:
Redirect traffic headed to a number of key destinations in Portsea along Hotham Road in lieu of Point Nepean Road
Outstanding
Construction of a roundabout for speed control as well as flexibility for the additional turning traffic Outstanding
Point Nepean Road / Ocean Beach Road / Constitution Hill Road:
Construction of a roundabout to improve safety. Outstanding

Traffic and Transport Assessment Sorrento Ferry Terminal
15 December 2016 Cardno 22
2.6 Existing Traffic Conditions
2.6.1 Traffic Volumes
Full turning movement counts were undertaken on Sunday 5 April 2015 (Easter Sunday) between 10:00am –
7:00pm at the following key intersections:
> Esplanade / Ferry Terminal;
> Esplanade / Point Nepean Road;
> Hotham Road / Point Nepean Road; and
> Point Nepean Road / Ocean Beach Road / Constitution Hill Road.
Easter Sunday was chosen as the survey day due to it typically being the busiest day of the year for the
Sorrento Ferry Terminal. The overall network peak occurred between 11:15am – 12:15pm. It is noted that
the peak for the Esplanade / Ferry Terminal intersection also occurred between 11:15am – 12:15pm.
Figure 2-14 summarises the Sunday peak vehicle period for the Sorrento Ferry Terminal and Surrounds.
Figure 2-14 Sunday Peak Hour Traffic Volumes – Sorrento Ferry Terminal and Surrounds
Additional full turning movement surveys were undertaken by Mornington Peninsula Shire Council on
Saturday 16 January 2016 between 10:00am – 5:00pm at the following key intersections:
> Esplanade / Ferry Terminal;
> Esplanade / Point Nepean Road; and
> Point Nepean Road / Ocean Beach Road / Constitution Hill Road.
The vehicle movement peak for the above intersections occurred between 12:00pm – 1:00pm.

Traffic and Transport Assessment Sorrento Ferry Terminal
15 December 2016 Cardno 23
Figure 2-15 summarises the peak Saturday vehicle peak period for the Sorrento Ferry Terminal and
Surrounds.
Figure 2-15 Saturday Peak Hour Traffic Volumes – Sorrento Ferry Terminal and Surrounds
It is noted that whilst the volumes are broadly similar, there are a number of movements for which a
significant variance was observed.
In the interest of undertaking a robust assessment, a composite picture of peak hour traffic volumes was
prepared.
This composite picture has been developed by taking the highest volumes for each peak period movement
from the December and January survey and is provided as Figure 2-16 overleaf. These volumes will be used
as the base traffic volumes for analysis.

Traffic and Transport Assessment Sorrento Ferry Terminal
15 December 2016 Cardno 24
Figure 2-16 Composite Peak Hour Traffic Volumes – Sorrento Ferry Terminal and Surrounds

Traffic and Transport Assessment Sorrento Ferry Terminal
15 December 2016 Cardno 25
2.6.2 Vehicle Queue Lengths – Southern Esplanade Approach to Sorrento Ferry Terminal
In conjunction with the turning movement counts discussed in Section 2.6.1, a vehicle queue length survey
was also undertaken in 5 minute windows on Sunday 5 April 2015 (Easter Sunday) between 10:00am –
7:00pm along the Southern Esplanade approach at the Esplanade / Ferry Terminal roundabout.
Vehicle queues generally peaked in the 15 – 20 minute window prior to the departure of a ferry, with a
maximum vehicle queue of 17 vehicles observed between 11:45am – 11:50am.
A profile of the vehicle queues across the day is provided in Figure 2-17.
Figure 2-17 Vehicle Queue Length – Southern Esplanade Approach to Sorrento Ferry Terminal – Sunday 5 April 2015 (Easter Sunday)
0
2
4
6
8
10
12
14
16
18
10
:00
10
:20
10
:40
11
:00
11
:20
11
:40
12
:00
12
:20
12
:40
13
:00
13
:20
13
:40
14
:00
14
:20
14
:40
15
:00
15
:20
15
:40
16
:00
16
:20
16
:40
17
:00
17
:20
17
:40
18
:00
18
:20
18
:40
Vehicle Queue Length

Traffic and Transport Assessment Sorrento Ferry Terminal
15 December 2016 Cardno 26
2.6.3 Pedestrian & Cyclist Volumes
In addition to the abovementioned traffic volume and queue length surveys, counts were also undertaken in
15 minute windows on Sunday 5 April 2015 (Easter Sunday) between 10:00am – 7:00pm of pedestrians and
bicycles accessing the Sorrento Ferry Terminal.
Counts were undertaken on the northern footpath along the Sorrento Ferry Terminal (which provides access
onto the ferry and is shared with the Sorrento Pier) and the southern footpath along the Sorrento Ferry
Terminal (which provides access off the ferry), as shown in Figure 2-18.
Figure 2-18 Pedestrian and Cyclist Count Locations
Peak pedestrian numbers typically occurred in the 15 minute window between the arrival of a ferry from
Queenscliff and the departure of a ferry to Sorrento, with a maximum number of 393 pedestrian movements
occurring in a 15 minute window between 11:45am – 12:00pm.
This included 130 pedestrian movements on the northern footpath and 263 pedestrian movements on the
southern footpath.
Across an hour window, there was a maximum of 719 pedestrian movements, occurring between 11:15am –
12:15pm. This included 389 pedestrian movements on the northern footpath and 330 pedestrian movements
on the southern footpath.
Cyclists were minimal and sporadic in nature, with a maximum of 8 cyclists accessing the Ferry in a 15
minute window between 10:45am – 11:00am. This included 5 cyclists on the northern footpath and 3 cyclists
on the southern footpath.
Across an hour window, there was a maximum of 11 cyclists accessing the Ferry, occurring between
10:00am – 11:00am and 10:15am – 11:15am. This included 6 cyclists on the northern footpath and 5 cyclists
on the southern footpath.
North Footpath (shared with Sorrento Pier)
South Footpath

Traffic and Transport Assessment Sorrento Ferry Terminal
15 December 2016 Cardno 27
The pedestrian movement and cyclist profiles are provided in Figure 2-19 and Figure 2-20 respectively
Figure 2-19 Pedestrian Movement Profile – Sorrento Ferry Terminal – Sunday 5 April 2015 (Easter Sunday)
Figure 2-20 Cyclist Profile – Sorrento Ferry Terminal – Sunday 5 April 2015 (Easter Sunday)
0
50
100
150
200
250
300
350
400
450
Northern Footpath Southern Footpath Total
0
1
2
3
4
5
6
7
8
9
Northern Footpath Southern Footpath Total

Traffic and Transport Assessment Sorrento Ferry Terminal
15 December 2016 Cardno 28
In addition to the above surveys, the Morning Peninsula Shire undertook pedestrian traffic surveys at the
intersections of:
> Esplanade / Ferry Terminal;
> Esplanade / Point Nepean Road; and
> Point Nepean Road / Ocean Beach Road / Constitution Hill Road.
The data revealed that peak pedestrian movements peaked between 2:00pm – 3:00pm. Figure 2-21
summarises the peak pedestrian peak period, and the associated vehicular traffic at that time.
Figure 2-21 Saturday Peak Hour Pedestrian Volumes – Sorrento Ferry Terminal and Surrounds
2.6.4 Existing Intersection Operation
To assess the operation of the existing intersection, we have used the composite traffic movement data as
presented in Figure 2-16 to analyse the operation of the following intersections:
> Esplanade / Ferry Terminal;
> Esplanade / Point Nepean Road;
> Point Nepean Road / Ocean Beach Road / Constitution Hill Road; and
> Hotham Road / Point Nepean Road (2015 data only available).
These intersections have been analysed using SIDRA. This computer package, originally developed by the
Australian Road Research Board, provides information about the capacity of an intersection in terms of a
range of parameters, as described below:
Traffic and Transport Assessment Sorrento Ferry Terminal
15 December 2016 Cardno 29
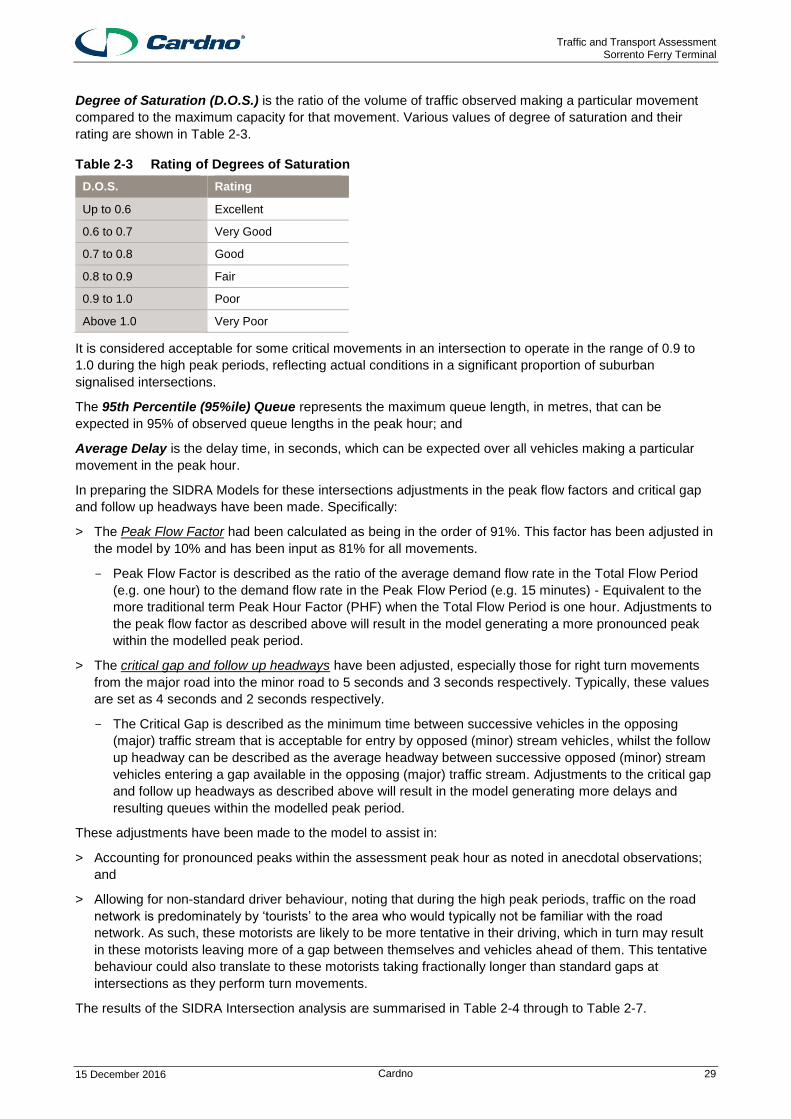
Degree of Saturation (D.O.S.) is the ratio of the volume of traffic observed making a particular movement
compared to the maximum capacity for that movement. Various values of degree of saturation and their
rating are shown in Table 2-3.
Table 2-3 Rating of Degrees of Saturation
D.O.S. Rating
Up to 0.6 Excellent
0.6 to 0.7 Very Good
0.7 to 0.8 Good
0.8 to 0.9 Fair
0.9 to 1.0 Poor
Above 1.0 Very Poor
It is considered acceptable for some critical movements in an intersection to operate in the range of 0.9 to
1.0 during the high peak periods, reflecting actual conditions in a significant proportion of suburban
signalised intersections.
The 95th Percentile (95%ile) Queue represents the maximum queue length, in metres, that can be
expected in 95% of observed queue lengths in the peak hour; and
Average Delay is the delay time, in seconds, which can be expected over all vehicles making a particular
movement in the peak hour.
In preparing the SIDRA Models for these intersections adjustments in the peak flow factors and critical gap
and follow up headways have been made. Specifically:
> The Peak Flow Factor had been calculated as being in the order of 91%. This factor has been adjusted in
the model by 10% and has been input as 81% for all movements.
- Peak Flow Factor is described as the ratio of the average demand flow rate in the Total Flow Period
(e.g. one hour) to the demand flow rate in the Peak Flow Period (e.g. 15 minutes) - Equivalent to the
more traditional term Peak Hour Factor (PHF) when the Total Flow Period is one hour. Adjustments to
the peak flow factor as described above will result in the model generating a more pronounced peak
within the modelled peak period.
> The critical gap and follow up headways have been adjusted, especially those for right turn movements
from the major road into the minor road to 5 seconds and 3 seconds respectively. Typically, these values
are set as 4 seconds and 2 seconds respectively.
- The Critical Gap is described as the minimum time between successive vehicles in the opposing
(major) traffic stream that is acceptable for entry by opposed (minor) stream vehicles, whilst the follow
up headway can be described as the average headway between successive opposed (minor) stream
vehicles entering a gap available in the opposing (major) traffic stream. Adjustments to the critical gap
and follow up headways as described above will result in the model generating more delays and
resulting queues within the modelled peak period.
These adjustments have been made to the model to assist in:
> Accounting for pronounced peaks within the assessment peak hour as noted in anecdotal observations;
and
> Allowing for non-standard driver behaviour, noting that during the high peak periods, traffic on the road
network is predominately by ‘tourists’ to the area who would typically not be familiar with the road
network. As such, these motorists are likely to be more tentative in their driving, which in turn may result
in these motorists leaving more of a gap between themselves and vehicles ahead of them. This tentative
behaviour could also translate to these motorists taking fractionally longer than standard gaps at
intersections as they perform turn movements.
The results of the SIDRA Intersection analysis are summarised in Table 2-4 through to Table 2-7.
Traffic and Transport Assessment Sorrento Ferry Terminal
15 December 2016 Cardno 30
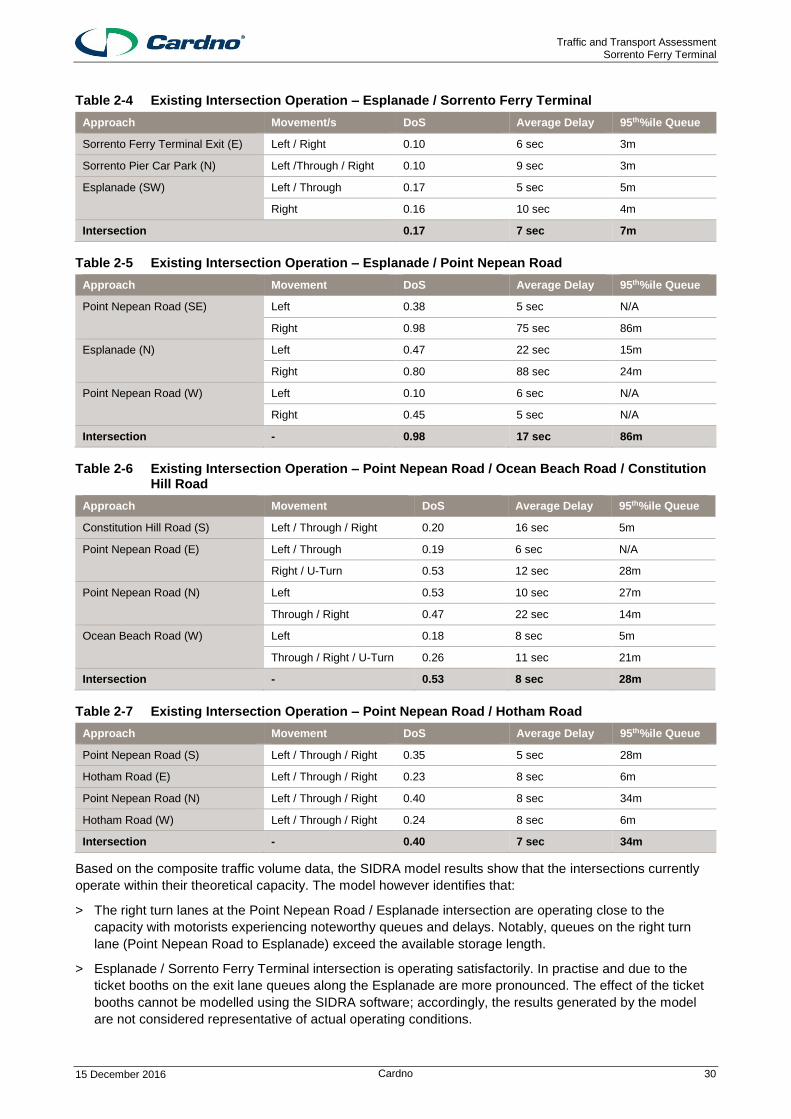
Table 2-4 Existing Intersection Operation – Esplanade / Sorrento Ferry Terminal
Approach Movement/s DoS Average Delay 95th%ile Queue
Sorrento Ferry Terminal Exit (E) Left / Right 0.10 6 sec 3m
Sorrento Pier Car Park (N) Left /Through / Right 0.10 9 sec 3m
Esplanade (SW) Left / Through 0.17 5 sec 5m
Right 0.16 10 sec 4m
Intersection 0.17 7 sec 7m
Table 2-5 Existing Intersection Operation – Esplanade / Point Nepean Road
Approach Movement DoS Average Delay 95th%ile Queue
Point Nepean Road (SE) Left 0.38 5 sec N/A
Right 0.98 75 sec 86m
Esplanade (N) Left 0.47 22 sec 15m
Right 0.80 88 sec 24m
Point Nepean Road (W) Left 0.10 6 sec N/A
Right 0.45 5 sec N/A
Intersection - 0.98 17 sec 86m
Table 2-6 Existing Intersection Operation – Point Nepean Road / Ocean Beach Road / Constitution Hill Road
Approach Movement DoS Average Delay 95th%ile Queue
Constitution Hill Road (S) Left / Through / Right 0.20 16 sec 5m
Point Nepean Road (E) Left / Through 0.19 6 sec N/A
Right / U-Turn 0.53 12 sec 28m
Point Nepean Road (N) Left 0.53 10 sec 27m
Through / Right 0.47 22 sec 14m
Ocean Beach Road (W) Left 0.18 8 sec 5m
Through / Right / U-Turn 0.26 11 sec 21m
Intersection - 0.53 8 sec 28m
Table 2-7 Existing Intersection Operation – Point Nepean Road / Hotham Road
Approach Movement DoS Average Delay 95th%ile Queue
Point Nepean Road (S) Left / Through / Right 0.35 5 sec 28m
Hotham Road (E) Left / Through / Right 0.23 8 sec 6m
Point Nepean Road (N) Left / Through / Right 0.40 8 sec 34m
Hotham Road (W) Left / Through / Right 0.24 8 sec 6m
Intersection - 0.40 7 sec 34m
Based on the composite traffic volume data, the SIDRA model results show that the intersections currently
operate within their theoretical capacity. The model however identifies that:
> The right turn lanes at the Point Nepean Road / Esplanade intersection are operating close to the
capacity with motorists experiencing noteworthy queues and delays. Notably, queues on the right turn
lane (Point Nepean Road to Esplanade) exceed the available storage length.
> Esplanade / Sorrento Ferry Terminal intersection is operating satisfactorily. In practise and due to the
ticket booths on the exit lane queues along the Esplanade are more pronounced. The effect of the ticket
booths cannot be modelled using the SIDRA software; accordingly, the results generated by the model
are not considered representative of actual operating conditions.
Traffic and Transport Assessment Sorrento Ferry Terminal
15 December 2016 Cardno 31
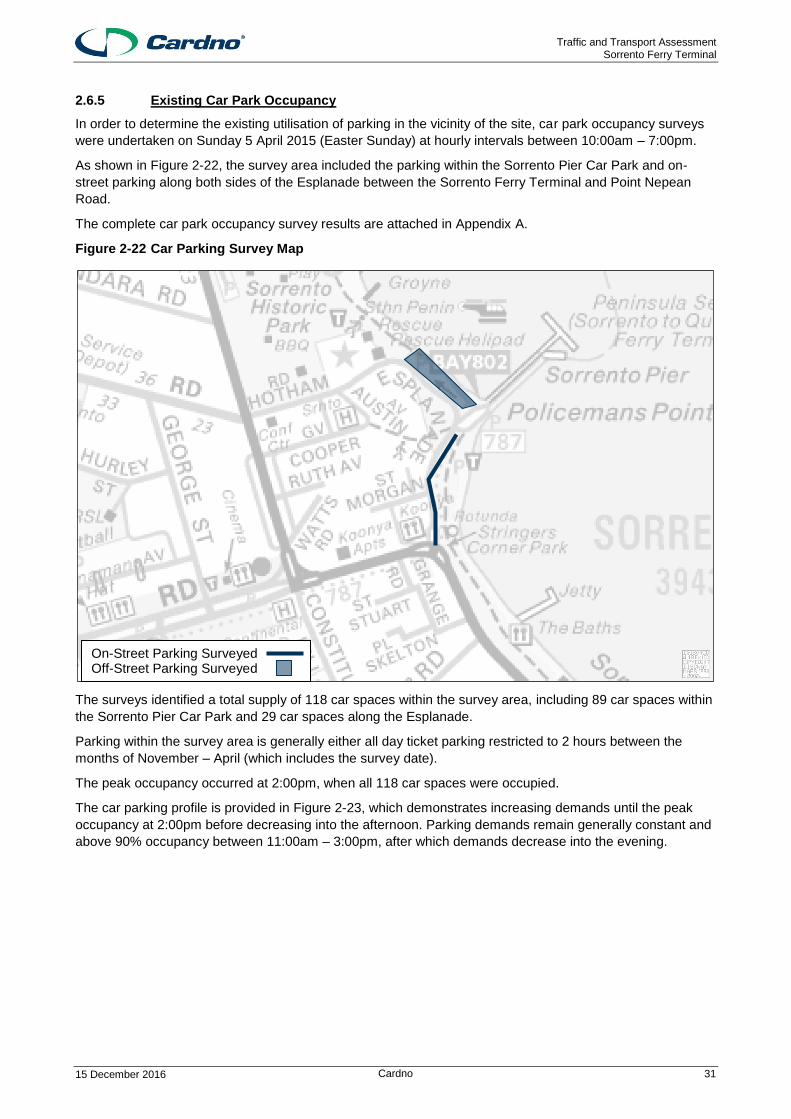
2.6.5 Existing Car Park Occupancy
In order to determine the existing utilisation of parking in the vicinity of the site, car park occupancy surveys
were undertaken on Sunday 5 April 2015 (Easter Sunday) at hourly intervals between 10:00am – 7:00pm.
As shown in Figure 2-22, the survey area included the parking within the Sorrento Pier Car Park and on-
street parking along both sides of the Esplanade between the Sorrento Ferry Terminal and Point Nepean
Road.
The complete car park occupancy survey results are attached in Appendix A.
Figure 2-22 Car Parking Survey Map
The surveys identified a total supply of 118 car spaces within the survey area, including 89 car spaces within
the Sorrento Pier Car Park and 29 car spaces along the Esplanade.
Parking within the survey area is generally either all day ticket parking restricted to 2 hours between the
months of November – April (which includes the survey date).
The peak occupancy occurred at 2:00pm, when all 118 car spaces were occupied.
The car parking profile is provided in Figure 2-23, which demonstrates increasing demands until the peak
occupancy at 2:00pm before decreasing into the afternoon. Parking demands remain generally constant and
above 90% occupancy between 11:00am – 3:00pm, after which demands decrease into the evening.
On-Street Parking Surveyed Off-Street Parking Surveyed

Traffic and Transport Assessment Sorrento Ferry Terminal
15 December 2016 Cardno 32
Figure 2-23 Car Parking Profile – Sunday 5 April 2015 (Easter Sunday)
118
74
118
40
0
20
40
60
80
100
120
140
Supply Occupancy
Traffic and Transport Assessment Sorrento Ferry Terminal
15 December 2016 Cardno 33
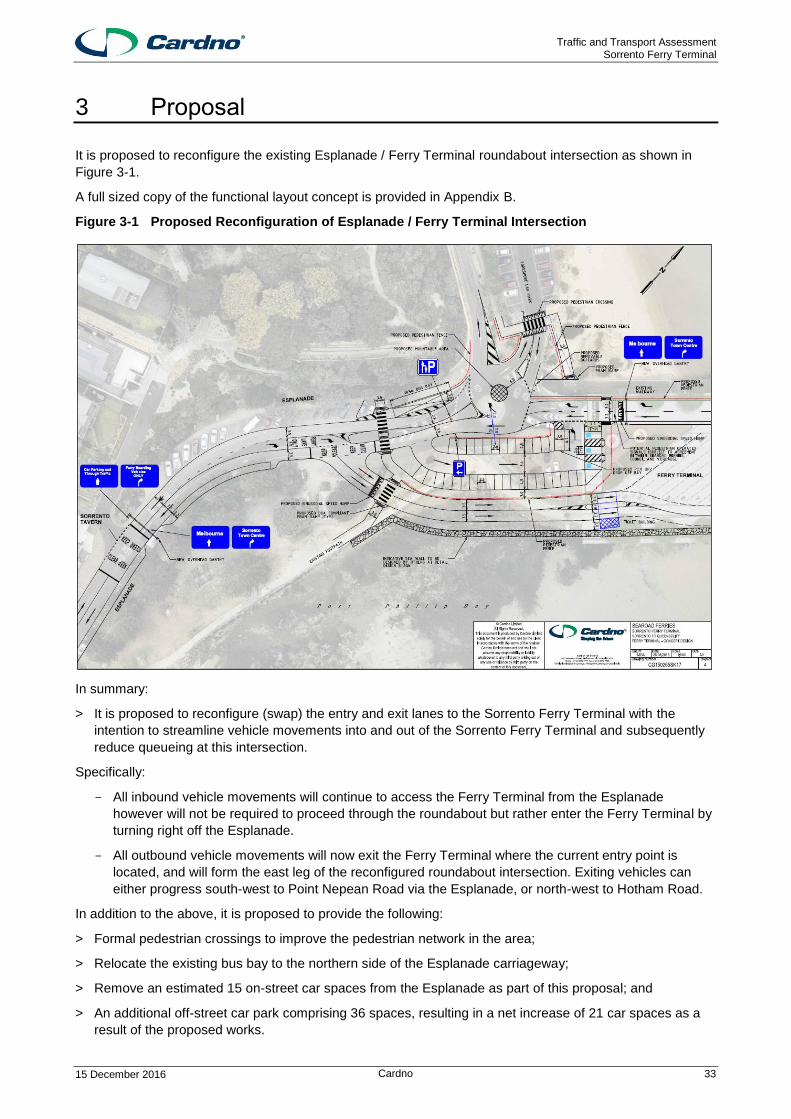
3 Proposal
It is proposed to reconfigure the existing Esplanade / Ferry Terminal roundabout intersection as shown in
Figure 3-1.
A full sized copy of the functional layout concept is provided in Appendix B.
Figure 3-1 Proposed Reconfiguration of Esplanade / Ferry Terminal Intersection
In summary:
> It is proposed to reconfigure (swap) the entry and exit lanes to the Sorrento Ferry Terminal with the
intention to streamline vehicle movements into and out of the Sorrento Ferry Terminal and subsequently
reduce queueing at this intersection.
Specifically:
- All inbound vehicle movements will continue to access the Ferry Terminal from the Esplanade
however will not be required to proceed through the roundabout but rather enter the Ferry Terminal by
turning right off the Esplanade.
- All outbound vehicle movements will now exit the Ferry Terminal where the current entry point is
located, and will form the east leg of the reconfigured roundabout intersection. Exiting vehicles can
either progress south-west to Point Nepean Road via the Esplanade, or north-west to Hotham Road.
In addition to the above, it is proposed to provide the following:
> Formal pedestrian crossings to improve the pedestrian network in the area;
> Relocate the existing bus bay to the northern side of the Esplanade carriageway;
> Remove an estimated 15 on-street car spaces from the Esplanade as part of this proposal; and
> An additional off-street car park comprising 36 spaces, resulting in a net increase of 21 car spaces as a
result of the proposed works.

Traffic and Transport Assessment Sorrento Ferry Terminal
15 December 2016 Cardno 34
4 Traffic Considerations
4.1 General
The proposal merely seeks to reconfigure access arrangements to and from the Sorrento Ferry Terminal,
and as a direct consequence of these geometric modifications, the relocation of an existing bus stop.
These geometric modifications are expected to have a significant positive impact to the operation of the
Esplanade / Ferry Terminal intersection, by removing the ingress volumes to the terminal from this
intersection and with it, removing the queuing and delay issues that have been a regular feature along the
Esplanade during high peak periods.
Noting that the traffic generation at the ferry terminal is a function of vehicles boarding and disembarking the
ferry and walk on passengers entering and exiting parking areas, the proposed changes in themselves are
not expected to result in an increase in traffic to and from the Sorrento Terminal.
It is however hoped that there will be some redistribution of traffic exiting the Sorrento Ferry Terminal with a
marginally higher proportion of traffic expected to use Hotham Road, and a corresponding reduction in traffic
volumes using the Esplanade.
Accordingly, the impacts of this proposal to the border road network are expected to be minimal.
4.2 Anticipated Future Volumes
4.2.1 Redistributed Traffic
Due to the proposed change of direction of the entry and exit points to the Ferry Terminal, the proposal will
result in minimal redistribution of existing traffic volumes exiting the Sorrento Ferry Terminal.
At present:
> ~15% of vehicles (13) exiting the terminal travel northbound along Hotham Road towards Point Nepean
Road; and
> ~85% of vehicles (69) exiting the terminal travel southbound along the Esplanade towards Point Nepean
Road.
At the Point Nepean Road / Esplanade Intersection
> ~35% of vehicles (65) turn right towards the Sorrento Commercial Centre; and
> ~75% of vehicles (121) turn left, and travel southbound along Point Nepean Road.
Based on the above it is estimated that of the 69 vehicles that exit the terminal and travel southbound along
the Esplanade that 24 of these vehicles then turn right at the Point Nepean Road / Esplanade Intersection
and proceed towards the Sorrento Commercial Centre.
For the purpose of this assessment, it is anticipated that with the intervention of signage at the Esplanade /
Ferry Terminal Intersection that 50% of these vehicles could be diverted towards Hotham Road. This
equates to 12 vehicle movements.
4.2.2 Circulating Traffic
Motorists seeking to access the new car park will need to travel to the Esplanade / Ferry Terminal
Intersection and perform a U-turn before accessing the car park. On exit these motorists will feed into the
eastern leg of the roundabout before departing either via Hotham Road or the Esplanade.
To assist with quantifying the amount of traffic that is likely to be generated into and out of this car park,
reference is made to the traffic generation profile of the Sorrento pier car park. The Pier car park has 89
spaces and during the peak period the car park generates 154 vehicle movements (82 outbound and 72
inbound). This equates to a rate of 1.7 vehicle movements per car space, with traffic broadly speaking evenly
distributed between ingress and egress.
Traffic and Transport Assessment Sorrento Ferry Terminal
15 December 2016 Cardno 35
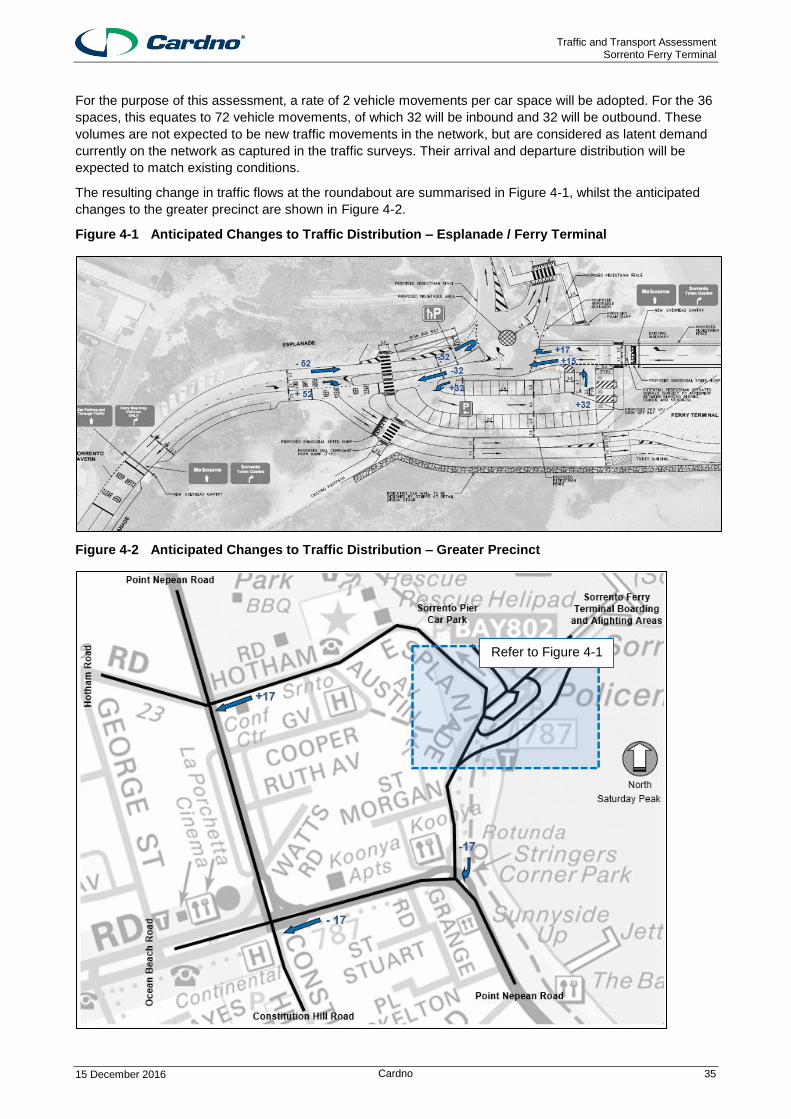
For the purpose of this assessment, a rate of 2 vehicle movements per car space will be adopted. For the 36
spaces, this equates to 72 vehicle movements, of which 32 will be inbound and 32 will be outbound. These
volumes are not expected to be new traffic movements in the network, but are considered as latent demand
currently on the network as captured in the traffic surveys. Their arrival and departure distribution will be
expected to match existing conditions.
The resulting change in traffic flows at the roundabout are summarised in Figure 4-1, whilst the anticipated
changes to the greater precinct are shown in Figure 4-2.
Figure 4-1 Anticipated Changes to Traffic Distribution – Esplanade / Ferry Terminal
Figure 4-2 Anticipated Changes to Traffic Distribution – Greater Precinct
Refer to Figure 4-1

Traffic and Transport Assessment Sorrento Ferry Terminal
15 December 2016 Cardno 36
The anticipated future traffic volumes are shown in Figure 4-3.
Figure 4-3 Anticipated Future Peak Period Traffic Volumes
4.3 Anticipated Future Intersection Operating Conditions
A results of the SIDRA assessment of the critical intersections based on the anticipated volumes shown in
Figure 4-3 are provided in Table 4-1 to Table 4-4. It is noted that the proposed concept layout has been
adopted for the SIDRA model of the Esplanade / Sorrento Ferry Terminal intersection.
Table 4-1 Future Operation – Esplanade / Sorrento Ferry Terminal
Approach Movement/s Degree of Saturation
Average Delay 95th%ile Queue
Sorrento Ferry Terminal Exit (NE) Through 0.08 6 sec 3m
Right 0.04 9 sec 1m
Sorrento Pier Car Park (N) Through / Right 0.09 8 sec 3m
Esplanade (SW) Left / Through / Right 0.27 7 sec 10m
Intersection - 0.27 7 sec 10m
Traffic and Transport Assessment Sorrento Ferry Terminal
15 December 2016 Cardno 37
Table 4-2 Future Operation – Esplanade / Point Nepean Road
Approach Movement DoS Average Delay 95th%ile Queue
Point Nepean Road (SE) Left 0.38 5 sec N/A
Right 0.98 75 sec 86m
Esplanade (N) Left 0.47 22 sec 15m
Right 0.60 63 sec 15m
Point Nepean Road (W) Left 0.10 6 sec N/A
Right 0.45 5 sec N/A
Intersection - 0.98 16 sec 86m
Table 4-3 Future Operation – Point Nepean Road / Ocean Beach Road / Constitution Hill Road
Approach Movement DoS Average Delay 95th%ile Queue
Constitution Hill Road (S) Left / Through / Right 0.20 15 sec 5m
Point Nepean Road (E) Left / Through 0.18 6 sec N/A
Right / U-Turn 0.53 12 sec 28m
Point Nepean Road (N) Left 0.53 10 sec 27m
Through / Right 0.46 21 sec 14m
Ocean Beach Road (W) Left 0.18 8 sec 5m
Through / Right / U-Turn 0.26 11 sec 21m
Intersection - 0.53 8 sec 28m
Table 4-4 Future Operation – Point Nepean Road / Hotham Road
Approach Movement DoS Average Delay 95th%ile Queue
Point Nepean Road (S) Left / Through / Right 0.35 5 sec 28m
Hotham Road (E) Left / Through / Right 0.26 8 sec 7m
Point Nepean Road (N) Left / Through / Right 0.40 8 sec 34m
Hotham Road (W) Left / Through / Right 0.24 8 sec 7m
Intersection - 0.40 7 sec 34m
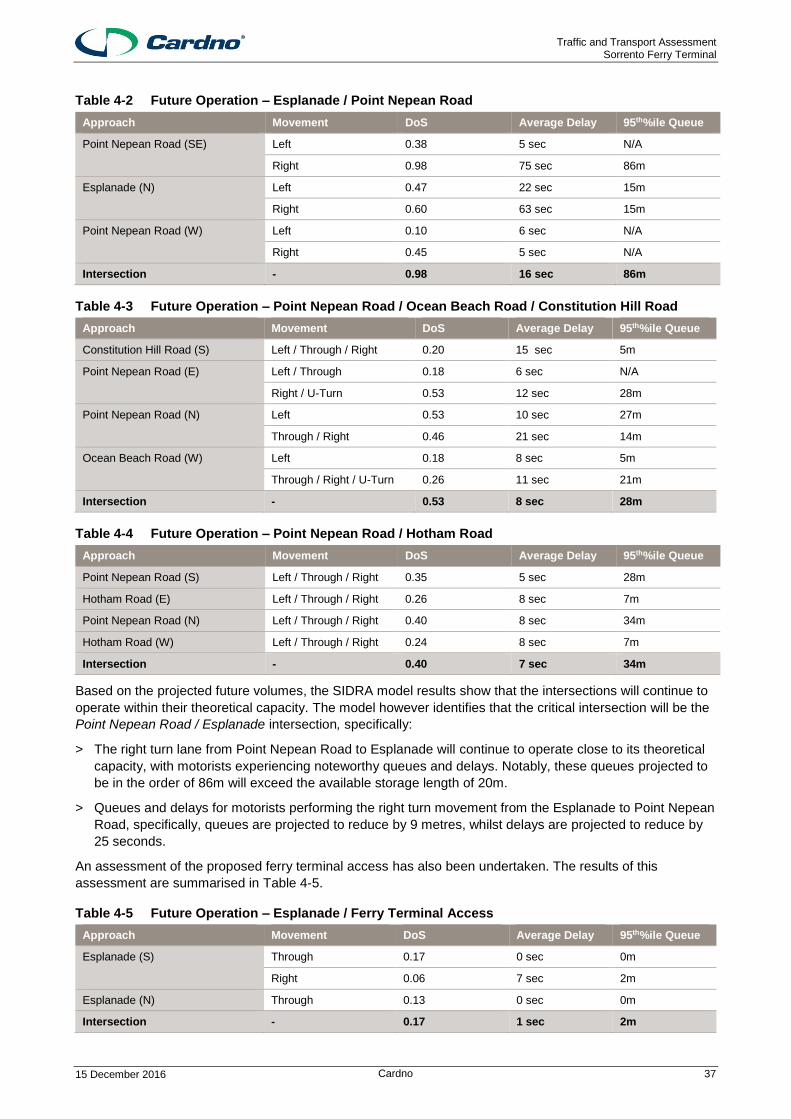
Based on the projected future volumes, the SIDRA model results show that the intersections will continue to
operate within their theoretical capacity. The model however identifies that the critical intersection will be the
Point Nepean Road / Esplanade intersection, specifically:
> The right turn lane from Point Nepean Road to Esplanade will continue to operate close to its theoretical
capacity, with motorists experiencing noteworthy queues and delays. Notably, these queues projected to
be in the order of 86m will exceed the available storage length of 20m.
> Queues and delays for motorists performing the right turn movement from the Esplanade to Point Nepean
Road, specifically, queues are projected to reduce by 9 metres, whilst delays are projected to reduce by
25 seconds.
An assessment of the proposed ferry terminal access has also been undertaken. The results of this
assessment are summarised in Table 4-5.
Table 4-5 Future Operation – Esplanade / Ferry Terminal Access
Approach Movement DoS Average Delay 95th%ile Queue
Esplanade (S) Through 0.17 0 sec 0m
Right 0.06 7 sec 2m
Esplanade (N) Through 0.13 0 sec 0m
Intersection - 0.17 1 sec 2m

Traffic and Transport Assessment Sorrento Ferry Terminal
15 December 2016 Cardno 38
The analysis shows that this intersection will operate satisfactorily with no material queues or delays.
Importantly and unlike the existing arrangements, the ticket booths will be setback about 84 metres from the
Esplanade, and will have the benefit of two lanes on approach. This arrangement results in a capacity to
have 24 vehicles queued clear of the Esplanade.
The queue surveys summarised in Section 2.6.2 revealed maximum vehicle queues of 17 vehicles.
Accordingly, the design delivers adequate queuing capacity to cater for current peak queues, clear of the
Esplanade carriageway. This design will ensure that the Esplanade will operate unencumbered during high
peak periods.
4.4 Recommendations
As revealed by the preceding analysis, the proposed reconfiguration of access and egress arrangements to
and from the Sorrento Ferry Terminal will have no adverse impacts on the surrounding road network.
The reconfiguration will however contribute positively to the safe and efficient movement of traffic along the
Esplanade, by removing queues from the Esplanade carriageway that have historically affected the efficient
movement of traffic. These queues are to be accommodated away from the Esplanade carriageway, with
sufficient capacity provided to cater for peak demand queues.
The analysis has revealed that the downstream intersection of Point Nepean Road / Esplanade is currently
operating with limited right turn capacity for the Point Nepean Road to Esplanade movement.
This is a historic concern that was flagged in the Draft Vehicle and Pedestrian Strategy Report in response to
community concerns relating to traffic and pedestrian movements within the Esplanade Precinct.
The report recommended amongst other items that Council should:
> Increase storage length for the right turn lane on Point Nepean Road into the Esplanade;
Our assessment confirms that this recommendation remains valid, and that the Responsible Authority should
act to address this capacity constraint in the network.
5 Parking Considerations
5.1 Provision
As discussed in Section 3, the proposal will result in a net increase of 21 car spaces compared with existing
conditions.
The parking surveys showed that during the high peak periods, parking opportunities in the vicinity of the
ferry terminal are at a premium. The resulting increase of parking will assist with absorbing latent demand. A
positive outcome for the locality, and visitors to the area.
5.2 Design
The proposed car parking spaces are design to meet the design requirements set out in Clause 52.06-8 of
the Mornington Peninsula Planning Scheme and AS2890.6-2009. Specifically:
> Perpendicular spaces (90 degree) are designed at a width of 2.6m, length of 4.9m long and accessed via
a 6.4m aisle.
> Parallel spaces are designed at a length of 6.7m and width of 3.0m.
> The disabled spaces are designed to satisfy the requirements of AS2890.6, and are provided at 2.4m with
an adjacent similar width shared zone and 5.4m long.

Traffic and Transport Assessment Sorrento Ferry Terminal
15 December 2016 Cardno 39
6 Public Transport
6.1 Design Considerations
The reconfiguration of the access points to the Ferry Terminal will require the relocation of the existing bus
stop that services Route 787 (Sorrento - Safety Beach), from the southbound carriageway to a location on
the northbound carriageway at the approach to the redesigned roundabout, as illustrated in Figure 6-1.
Figure 6-1 Proposed Bus Stop Location
The bus stop has been designed to cater for up to an 18m articulated bus, however the use of this bus
configuration will be restricted on account of limitations in the roundabout design to cater for a U-turn
manoeuvre for this bus type.
If such a bus were to be used, the bus would need to proceed onto Hotham Road and then onto the broader
road network via Point Nepean Road.
Discussion with PTV have been progressed regarding the relocation of the bus stop and the limitations of the
design to cater for unrestricted access for 18m articulated buses.
PTV have considered the design and its limitation and have approved the relocation of the bus stop.
6.2 Potential Service Changes
As part of discussions with PTV we understand that PTV are investigating a proposal that whilst subject to
community consultation, business case and budget approval, contemplates the following:
> Re-route bus Route 787, with this service no longer servicing the ferry terminal;
> Double the number of buses on the Bus Route 788, and use smaller buses on this route. The service is
then to split at the Sorrento end, with a routed service serving the ferry terminal every 40 minutes.
The above changes would result in an increase in the number of bus services that serve the ferry terminal,
noting that currently Route 787 runs about 6 services on a weekday, reducing to about 2 services on a
weekend.
The PTV proposal will result in more services to the terminal on a more regular basis.
Proposed
Bus Bay
Existing
Bus Bay
Traffic and Transport Assessment Sorrento Ferry Terminal
15 December 2016 Cardno 40
6.3 Impact of Terminal Access Redesign
The reconfiguration of the terminal access points will contribute positively to the safe and efficient movement
of traffic along the Esplanade, by removing queues from the Esplanade Carriageway that have historically
affected the efficient movement of traffic. These queues are to be accommodated away from the Esplanade
carriageway, with sufficient capacity provided to cater for peak demand queues.
This outcome will assist with ensuring that the bus services to and from the Esplanade precinct are able to
access and depart efficiently and with minimal delay.
Notwithstanding these benefits, our analysis has revealed that the downstream intersection of Point Nepean
Road / Esplanade is currently operating with limited right turn capacity for the Point Nepean Road to
Esplanade movement.
From a public transport perspective, increasing the right turn lane capacity will assist in managing queues
along Point Nepean Road, which in turn will assist with reducing delays to bus services on the road network,
as well as improving ease of access to the Esplanade Precinct.

Traffic and Transport Assessment Sorrento Ferry Terminal
15 December 2016 Cardno 41
7 Pedestrians
The redesign of the terminal access points will result in modifications to pedestrian paths to and from the
Ferry Terminal and Pier.
The design seeks to remove pedestrian movements from the roundabout, and by so doing address safety
concerns relating to pedestrians walking uncontrolled and in an undefined manner through the roundabout.
To achieve this outcome, the design includes the following features:
> Locates crossing points away from the roundabout; and
> Introduces pedestrian fencing to guide pedestrians to the designated crossing points.
A total of 4 crossing points are proposed with 3 of these crossing points to be designated as Zebra
Crossings, with pedestrians afforded priority over motor vehicles. The 4th crossing, located at the exit from
the ferry terminal is contemplated as a traditional crossing point i.e. vehicles will have priority over
pedestrians.
The nominated pedestrian path routes are illustrated in Figure 7-1.
Figure 7-1 Proposed Pedestrian Path Routes
The decision to design the 4th crossing as a standard crossing in lieu of a Zebra Crossing is informed by
capacity and operational considerations. These are discussed below:
> The surveys have shown that during high peak periods that a considerable number of pedestrians are
projected to traverse this crossing, especially during the critical 15 minute period after the ferry docks at
the terminal.
- It is estimated that during these 15 minute periods in the order of 690 pedestrians will traverse this
crossing with destinations to and origins from the terminal and the pier / foreshore.
> The effect of affording priority to pedestrians at this location will be detrimental to the efficient operation of
the ferry. Specifically:
- The ferry service has 15 minutes to unload passengers and motor vehicles that have arrived from
Queenscliff, before boarding passengers and motor vehicles that are travelling to Queenscliff;

Traffic and Transport Assessment Sorrento Ferry Terminal
15 December 2016 Cardno 42
- The ferry has a carrying capacity of about 80 vehicles, with surveys showing that during the peak
period, up to 69 motor vehicles were accommodated within the ferry from Queenscliff to Sorrento;
- Affording priority to pedestrians at the 4th crossing would require vehicles disembarking from the ferry
to queue and wait for the pedestrian demand to subside. A resulting queue of between 69 – 80
vehicles would result. Taking an average vehicle length of 7 meters per vehicle this queue would
extend for between 483 metres – 560 metres.
- The proposed exit from the terminal is designed with two lanes, and when measured from the
proposed crossing point will afford a queuing area of about 100 metres on each lane to the ferry. A
total queuing capacity of 200 metres is therefore afforded in the design.
- The expected queue of between 483 metres – 560 metres cannot be accommodated within the
available storage of 200 metres. These queues would affect the ability for vehicles to board the ferry.
This in turn would result in detrimental effects to the operation of the ferry service.
Whilst the same considerations apply in assessing the impact of a Zebra Crossing at the entry point to the
ferry terminal, it is considered that the impact of a Zebra Crossing at the entry location would be less intense.
We note that motorist are advised to arrive 30 – 40 minutes prior to departure during the busy period
between 26 December – 31 January and the Easter weekend to book tickets, thus avoiding the peak
pedestrian activity period.
To assist with determining the appropriateness of the proposed treatment of the 4th pedestrian crossing,
reference has been made to The Austroads Australasian Pedestrian Crossing Facility Selection Tool.
This Pedestrian Crossing Facility Selection Tool is intended to help practitioners select an appropriate
pedestrian crossing facility for a particular location based on walkability, safety and economic outcomes. The
tool is based on literature, and analytical and behavioural research coupled with a number of mathematical
models.
With respect to the application of this tool to this unique circumstance, it acknowledged that the tool has
limitations and is developed to assess and provide outputs based on hourly operational variables. In this
instance the critical operational variable is the 15 minute period after the ferry docks.
To account for this limitation in the model, the following variables have been adopted:
> Inputs as they relate to vehicle volumes from the ferry terminal have revised upwards by a factor of 4
during the assessment period. Accordingly, during the assessment peak hour 320 vehicles are modelled,
with these volumes coded as flowing uninterrupted.
> Inputs for pedestrian volumes across the ferry terminal exit have been revised upwards by a factor of 4
during the sensitive assessment period. Accordingly, during the assessment peak hour 2,760 pedestrians
are coded into the model.
Based on the above parameters, and the geometric characteristics of the crossing point, the model suggests
that the use of a Zebra Crossing treatment would not be appropriate.
The model however suggest that the use of Traffic Signals would be an option.
The Pedestrian Crossing Facility Selection Tool allows options to be compared from the perspective of
perceived delay, safety and level of service. The tool also calculates the Benefit to Cost Ratio of the various
options to assist with decision making.
In coding the model for likely operational parameters of signals, the signals have been coded as pedestrian
activated signals, with a delay of 15 minutes (900 seconds). This delay is factored into the coding to reflect
views advanced by Council and VicRoads that the signals could be coded to give vehicular priority during the
peak 15 minute period.
The perceived delay, safety and level of service outputs of this model are presented overleaf, with a detailed
copy of results provided as Appendix D.

Traffic and Transport Assessment Sorrento Ferry Terminal
15 December 2016 Cardno 43
A comparison between the proposed arrangement and one that includes signals shows that
> Perceived Delay: The proposed arrangement will deliver an outcome that has a significantly better
perceived delay rating than the signals option.
> Perceived Safety: The signals option will deliver a marginally better perceived rating when compared
with the proposed arrangement.
> Pedestrian Level of Service: Both options deliver a comparable level of service.
It is considered that on balance, an option that incorporates traffic signals does not delivered a significant
benefit when compared to the current arrangement. As such, an investment in signals would in our view, be
unwarranted. This view is confirmed by the Benefit to Cost Ratio calculated by the Model. The signal option
has a BCR score of - 919.7
Given the foregoing, it is considered that the conflict between pedestrians and motorist should be best
managed by a combination of signage and traffic management personnel on an as need basis especially
during the high peak periods.
The use of traffic management personnel would ensure that an appropriate balance is made between
efficiency and safety based on the circumstances on the day.

Traffic and Transport Assessment Sorrento Ferry Terminal
15 December 2016 Cardno 44
8 Review of Vehicle and Pedestrian Strategy Against Proposal
8.1.1 Esplanade / Sorrento Ferry Terminal
The recommendations of the Vehicle and Pedestrian Strategy for the Esplanade / Sorrento Ferry Terminal
as discussed in Section 2.5 appear to have been implemented since the study was prepared in 2001.
As discussed in the preceding sections, the proposal is considered to be a superior outcome with respect to
both traffic flows and pedestrian safety when compared with the existing roundabout.
8.1.2 Point Nepean Road / Esplanade
8.1.2.1 Increased Right Turn Lane Length on Point Nepean Road
The existing right turn lane on Point Nepean Road is approximately 20 metres long.
Based on the projected future volumes, the SIDRA model results show that the intersection will continue to
operate within its theoretical capacity, and identifies the critical movement at this intersection as being the
right turn lane from Point Nepean Road to Esplanade.
The model indicates that during the high peak periods, motorists will experience queues in the order of 86m.
These queues will exceed the available storage length of 20m.
Our assessment confirms that this recommendation remains valid, and that the Responsible Authority should
act to address this capacity constraint in the network.
Specifically:
> Noting that Point Nepean Road Operates as a 60 kilometre per hour road, the AustRoads Guide to Road
Design – Part 4A: Unsignalised and Signalised Intersections requires a turn lane length of 55 metres for
deceleration purposes. The turn lane should therefore be extended to provide as a minimum a 55m right
turn lane.
8.1.2.2 Improved Left Turn Slip Lane from the Esplanade
The existing left turn lane is currently stop controlled, with clear views of eastbound vehicles on Point
Nepean Road well in excess of the requirements of AustRoads Guide to Road Design – Part 4A.
Slip lanes are typically a feature of signalised intersections which allows a vehicle to turn left by giving way to
oncoming vehicles, despite the signal for the approach being red.
In the instance of an unsignalised T-intersection, the construction of a slip lane is not considered to provide
any additional benefits with regards to traffic safety or operation. Indeed, this position has been confirmed by
the SIDRA analysis that shows that the Esplanade will operate satisfactorily with motorists experiencing
manageable queues and delays.
It is therefore our view that this recommendation is no longer valid.
8.1.2.3 Introduction of Pedestrian Crossing 60 Metres East of the Intersection
An informal pedestrian crossing appears to have been implemented to the immediate east of the intersection
by way of a pedestrian cut through.
Noting the recommendation to increase the length of the right tune lane on Point Nepean Road to provide a
minimum 55 metre right turn lane, this recommendation remains valid.
Traffic and Transport Assessment Sorrento Ferry Terminal
15 December 2016 Cardno 45
8.1.2.4 Increase Length of Right and Left Turn Lanes in the Esplanade to 50 Metres
The existing right and left turn lanes in the Esplanade are currently approximately 20 metres in length.
The SIDRA analysis that shows that the Esplanade will operate satisfactorily with motorists experiencing
manageable queues and delays, with queues of up to 63 metres projected for the right turn movement, and
22 metres for the left turn movement.
These queues can be comfortably accommodated within the existing geometrical design of the approach
without affecting up stream intersections along the Esplanade.
8.1.2.5 Introduction of Centre Protection Median in Point Nepean Road
A centre protection median appears to have been installed in Point Nepean Road at this intersection.
8.1.2.6 Introduction of a keep clear zone in Point Nepean Road
A keep clear zone in Point Nepean Road would be intended to benefit vehicles departing from the Esplanade
to Point Nepean Road. Considering the location of upstream and downstream intersections relative to the
Point Nepean Road / Esplanade intersection, the keep clear zone would be primarily of benefit to the right
turn movements from the Esplanade.
The keep clear zone would therefore need to be introduced on the westbound carriageway to benefit this
movement.
To take advantage of this keep clear zone, motorists turning right from the Esplanade to Point Nepean Road
would need to give priority to southbound traffic along Point Nepean Road and to right turning traffic from
Point Nepean Road to the Esplanade.
The right turn lane from Point Nepean Road to the Esplanade is well utilised during the peak periods. It then
follows that should a keep clear on Point Nepean Road be introduced that motorists turning right from the
Esplanade to Point Nepean Road would not be able to enjoy its benefits on account of having to give priority
to right turn traffic from Point Nepean Road to the Esplanade.
Based on the foregoing, the introduction of a keep clear zone is not considered necessary, and if introduced
will deliver minimal if any improvements to the road network.
8.1.2.7 Interactive Signs on Point Nepean Road
Provision of an interactive sign on Point Nepean Road as recommended by the Vehicle and Pedestrian
Strategy is acceptable. Interactive signs would assist with communicating changes to road conditions which
would be a benefit to all road users.
We note that to be effective the signs would need to be simple so as not to distract drivers and result in
vehicles slowing down to review all the information, noting the primary purpose of Point Nepean Road as a
vehicle thoroughfare.
The sign would require VicRoads approval.
8.1.3 Hotham Road / Point Nepean Road
8.1.3.1 Redirect Certain Traffic from Point Nepean Road to Hotham Road
Point Nepean Road and Hotham Road are the two key east-west routes between Sorrento and Portsea
which run parallel to each other (approximately 1.2 kilometres apart) further to the west of Sorrento.
Given the separation between the two roads, it is considered likely that drivers already choose the road
which provides the quickest route to their destination, which for any of the landmarks on the south side of the
peninsula (such as the Portsea Surf Beach, London Bridge, Mornington Peninsula National Park) is Hotham
Road.
For tourists who are unfamiliar with the area, signage could be installed at the intersection to direct them to
the relevant landmarks.

Traffic and Transport Assessment Sorrento Ferry Terminal
15 December 2016 Cardno 46
8.1.3.2 Construction of a Roundabout
As discussed in Section 4.2, the Point Nepean Road / Hotham Road intersection is anticipated to operate
within its theoretical capacity with minimal queues and delays anticipated.
A summary of the anticipated future operation of the intersection against the anticipated operation if a
roundabout was constructed as assessed by SIDRA and is presented in Table 8-1.
Table 8-1 Future Intersection Operation – Point Nepean Road / Hotham Road - Roundabout
Approach Movement Anticipated Future Conditions Anticipated Future Conditions - Roundabout
Degree of Saturation
Average Delay
95th%ile Queue
Degree of Saturation
Average Delay
95th%ile Queue
Point Nepean Road (S) Left
0.35 5 sec 28m
0.42 5 sec 24m
Through 0.42 5 sec 24m
Right 0.42 11 sec 24m
Hotham Road (E) Left
0.26 8 sec 7m
0.24 7 sec 11m
Through 0.24 7 sec 11m
Right 0.24 12 sec 11m
Point Nepean Road (N) Left
0.40 8 sec 34m
0.33 4 sec 18m
Through 0.33 5 sec 18m
Right 0.33 10 sec 18m
Hotham Road (W) Left
0.24 8 sec 7m
0.19 6 sec 9m
Through 0.19 6 sec 9m
Right 0.19 12 sec 9m
Review of Table 8-1 indicates that both layouts would be anticipated to operate satisfactorily, however
marginal improvements in queues and delays are projected for a roundabout layout.
Given the relatively low volumes turning in and out of Hotham Road and the relatively low opposing volumes
on Point Nepean Road, it is considered that there are significant opportunities for vehicles to turn in and out
of Hotham Road, with minimal impact to the operation of the intersection.
In this regard, construction of a roundabout is not considered to be necessary in terms of intersection
operation and in fact could be considered detrimental to the operation of the intersection as it takes priority
away from Point Nepean Road which is the main road with the highest volumes.
Notwithstanding the above, roundabouts are generally a favourable outcome for cross intersections from a
safety perspective as they reduce confusion.
Review of Crash Stats data indicates there has been one crash in the five financial years to 30 June 2013 at
this intersection, which involved a through vehicle on Point Nepean Road crashing into a vehicle turning right
into Hotham Road.
It is acknowledged that the construction of a roundabout at this intersection would reduce confusion and
have a positive effect on safety, however based on the foregoing, there does not appear to be a pattern of
safety concerns at the intersection and in light of the existing layout being considered to provide better
operation.
Notwithstanding the above, it is understood that Council’s preference is to construct a roundabout at this
location to improve safety. As such, a concept functional layout plan has been prepared and is attached in
Appendix C.
It is noted that the proposed roundabout location is located on excessive grades above the recommended
limits for a roundabout and as such Point Nepean Road would need to be regraded to the recommended
limits. This will require the scope of work area to be larger than that shown on the plan. The plan would also
require VicRoads input and approval, noting that Point Nepean Road is a Declared Main Road.

Traffic and Transport Assessment Sorrento Ferry Terminal
15 December 2016 Cardno 47
8.1.4 Point Nepean Road / Ocean Beach Road / Constitution Hill Road
8.1.4.1 Construction of a Roundabout
As discussed in Section 4.2, the Point Nepean Road / Ocean Beach Road / Constitution Hill Road
intersection is anticipated to operate within its theoretical capacity, with manageable queues and delays
anticipated.
A summary of the anticipated future operation of the intersection against the anticipated operation if a
roundabout was constructed as assessed by SIDRA is presented in Table 8-2.
Table 8-2 Future Intersection Operation Sunday Peak – Point Nepean Road / Ocean Beach Road / Constitution Hill Road - Roundabout
Approach Movement Anticipated Future Conditions Anticipated Future Conditions - Roundabout
Degree of Saturation
Average Delay
95th%ile Queue
Degree of Saturation
Average Delay
95th%ile Queue
Constitution Hill Road (S) Left
0.20 15 sec 5m
0.04 7 sec 2m
Through 0.04 7 sec 2m
Right 0.04 13 sec 2m
Point Nepean Road (E) Left 0.18 6 sec N/A
0.41 5 sec 25m
Through 0.41 5 sec 25m
Right 0.53 12 sec 28m
0.41 10 sec 25m
U-Turn 0.41 13 sec 25m
Point Nepean Road (N) Left 0.53 10 sec 27m 0.51 6 sec 32m
Through 0.46 21 sec 14m
0.51 6 sec 32m
Right 0.51 12 sec 32m
Ocean Beach Road (W) Left 0.18 8 sec 5m 0.40 6 sec 23m
Through
0.26 11 sec 21m
0.40 6 sec 23m
Right 0.40 12 sec 23m
U-Turn 0.40 13 sec 23m
Review of Table 8-2 indicates that both layouts would be anticipated to operate satisfactorily, however slight
improvements in queues and delays are projected for a roundabout layout.
It is understood that the primary concerns in relation to the operation of this intersection are:
> Vehicles turning right from the east leg (Point Nepean Road) to the north leg (Point Nepean Road)
queuing back past the length of the turn lane and blocking through vehicles.
> Vehicles undertaking a U-turn causing confusion and holding up eastbound vehicles on Ocean Beach
Road.
> Safety concerns relating to confusion at the intersection and limited sight distance for vehicles turning
right from the east leg (Point Nepean Road) to the north leg (Point Nepean Road).
In consideration of the above concerns, it is accepted that a roundabout would assist with addressing the
stated concerns. Subject to funding, the option to convert this intersection into a roundabout remains valid.

Traffic and Transport Assessment Sorrento Ferry Terminal
15 December 2016 Cardno 48
9 Conclusions
It is proposed to reconfigure the existing Esplanade / Ferry Terminal intersection as shown in the preceding
report and as attached in Appendix B. Based on the foregoing assessment, it is concluded that the proposal
is a favourable outcome for the following reasons:
> The proposal is not expected to have a significant impact on the operation of the surrounding road
network and is expected to reduce queueing at the Esplanade / Sorrento Ferry Terminal intersection;
> The proposal results in an overall increase to parking provision in the vicinity of the site;
> The proposal results in improved pedestrian accessibility and safety;
> The proposal is not expected to have any impact on the operation of bus services; and
> It is considered that mitigating works at other intersections in the vicinity of the site are not necessary as a
result of this proposal.

Traffic and Transport Assessment Sorrento Ferry Terminal
15 December 2016 Cardno 49
Sorrento Ferry Terminal
APPENDIX
A CAR PARK OCCUPANCY SURVEY RESULTS
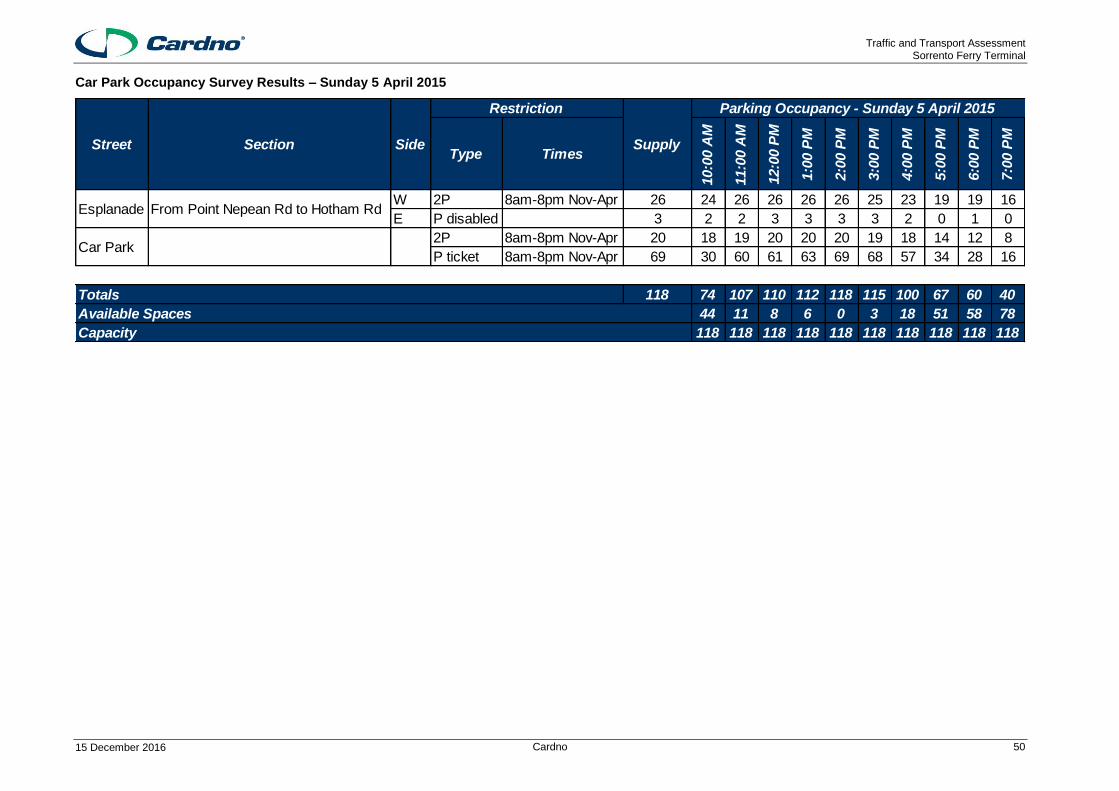
Traffic and Transport Assessment Sorrento Ferry Terminal
15 December 2016 Cardno 50
Car Park Occupancy Survey Results – Sunday 5 April 2015
Type Times
10:0
0 A
M
11:0
0 A
M
12:0
0 P
M
1:0
0 P
M
2:0
0 P
M
3:0
0 P
M
4:0
0 P
M
5:0
0 P
M
6:0
0 P
M
7:0
0 P
M
W 2P 8am-8pm Nov-Apr 26 24 26 26 26 26 25 23 19 19 16
E P disabled 3 2 2 3 3 3 3 2 0 1 0
2P 8am-8pm Nov-Apr 20 18 19 20 20 20 19 18 14 12 8
P ticket 8am-8pm Nov-Apr 69 30 60 61 63 69 68 57 34 28 16
118 74 107 110 112 118 115 100 67 60 40
44 11 8 6 0 3 18 51 58 78
118 118 118 118 118 118 118 118 118 118Capacity
From Point Nepean Rd to Hotham Rd
Car Park
Esplanade
Supply
Parking Occupancy - Sunday 5 April 2015
Totals
Available Spaces
Street Section Side
Restriction

Traffic and Transport Assessment Sorrento Ferry Terminal
15 December 2016 Cardno 51
Sorrento Ferry Terminal
APPENDIX
B FUNCTIONAL LAYOUT CONCEPT – ESPLANADE / FERRY TERMINAL

DROP OFF BAY PROPOSED PICK UP/
SizeScale
Drawing Number Revision
DateDatum
chris.sanstoupet
BY:
content of this document.
any use or reliance by third party on the
whatsoever to any third party arising out of
assume any responsibility or liability
Cardno Limited does not and shall not
in accordance with the terms of the retainer.
solely for the benefit of and use by the client
This document is produced by Cardno Limited
All Rights Reserved.
Cardno Limited©
®
CA
D File:O:\D
RATR
AFF\2015\C
G150265\Dra
wings\C
G150265S
K17.dgn
DATE P
LO
TTE
D:22/11/2016
5:34:23 P
M
Port Phillip Bay
FO
RES
HO
RE C
AR P
AR
K
ESPLANADE
ESPLA
NA
DE
FERRY TERMINALThrough Traffic
Car Parking and
ONLY
Vehicles
Ferry Boarding
TAVERN
SORRENTO
A31:500
4
SORRENTO FERRY TERMINAL
SORRENTO TO QUEENSCLIFF
FERRY TERMINAL - CONCEPT DESIGN
CG150265SK17
26.08.2016MGA3.5
3.5
3.5
EXIS
TING
FOOT
PATH
3.8
3.8
2.3
NEW OVERHEAD GANTRY
DESIGN STAGE. DESIGNED BY OTHERS AT DETAILINDICATIVE SEA WALL TO BE
(TY
P)
2.4
(TYP)
5.4
3.0
SEAROAD FERRIES
3.2
3.2
3.0
3.9
19.5m
BUS BAY
FENCEPEDESTRIAN PROPOSED
NEW OVERHEAD GANTRY
Melbourne Town Centre
Sorrento
(E)
7.0
(E)
4.0
PRAM RAMP (TYP.)PROPOSED DDA COMPLIANT
PROPOSED SINUSODIAL SPEED HUMP
PROPOSED SINUSODIAL SPEED HUMP
Melbourne Town Centre
Sorrento
WALKWAYEXISTING
3.0
4.9
6.4
4.9
2.6
3.6
PROPOSED PEDESTRIAN FENCE
PROPOSED PEDESTRIAN CROSSING
3.0
BOLLARDSREMOVABLEPROPOSED
PROPOSED PEDESTRIAN FENCE
PROPOSED MOUNTABLE AREA
COUNCIL AND VICROADS).BETWEEN SEAROAD FERRIES, SIGNALS (SUBJECT TO AGREEMENT POTENTIAL PEDESTRIAN OPERATED
FENCEPEDESTRIAN PROPOSED
2.6
3.0
3.0
6.7
PRAM RAMPPROPOSED
6.0
Email: [email protected] Web: www.cardno.com.au/victoria
Phone (+61 3) 8415 7777 Fax (+61 3) 8415 7788
501 Swanston Street, Melbourne, VIC Australia 3000
ABN: 47 106 610 913
3.5
3.5
TICKET BUILDING
3.2
1.83.2
3.0
KEEP
CLEAR
FERRY
LANE
ONLY
CLEAR
KEEP
KEEP
CLEAR KEEP
CLEAR
Traffic and Transport Assessment Sorrento Ferry Terminal
15 December 2016 Cardno 52
Sorrento Ferry Terminal
APPENDIX
C FUNCTIONAL LAYOUT CONCEPT – POINT NEPEAN RD / HOTHAM RD
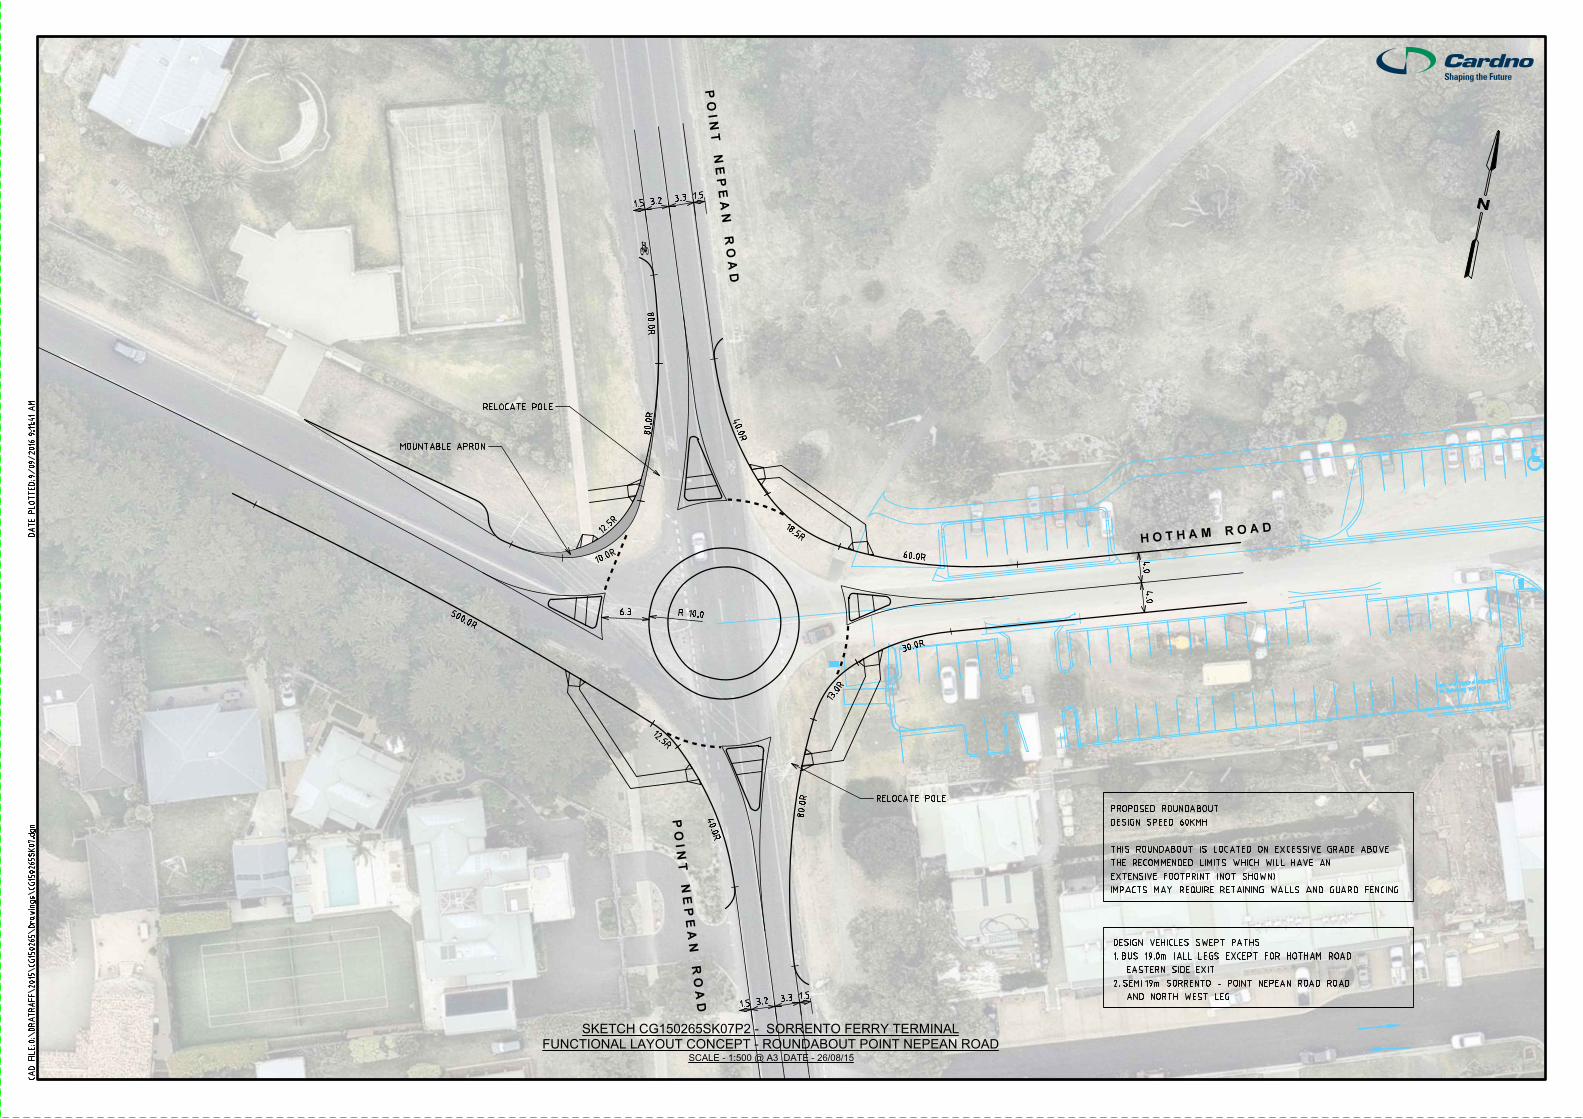
to Retaining wall
Kerb and Channel adja
cent
9/09/2016
9:11:41
AM
DA
TE P
LO
TT
ED:
CA
D FIL
E:O:\
DR
AT
RA
FF\2015\
CG15
0265\
Dra
win
gs\
CG15
0265S
K07.d
gn
SCALE - 1:500 @ A3 DATE - 26/08/15
SKETCH CG150265SK07P2 - SORRENTO FERRY TERMINAL
1.53.33.21.5
1.53.33.21.5
4.0
4.0
H O T H A M R O A
D
P O I N
T N
E P E A N R
O A D
P O I N
T N
E P E A N R
O A D
10.0R
IMPACTS MAY REQUIRE RETAINING WALLS AND GUARD FENCING
EXTENSIVE FOOTPRINT (NOT SHOWN)
THE RECOMMENDED LIMITS WHICH WILL HAVE AN
THIS ROUNDABOUT IS LOCATED ON EXCESSIVE GRADE ABOVE
DESIGN SPEED 60KMH
PROPOSED ROUNDABOUT
6.3
RELOCATE POLE
RELOCATE POLE
18.5R
40.0
R
60.0R
30.0R
13.0
R
80.0
R
40.0
R
12.5R
500.0R
10.0R
12.5
R
80.0
R
80.0
R
FUNCTIONAL LAYOUT CONCEPT - ROUNDABOUT POINT NEPEAN ROAD
MOUNTABLE APRON
AND NORTH WEST LEG
2. SEMI 19m SORRENTO - POINT NEPEAN ROAD ROAD
EASTERN SIDE EXIT
1. BUS 19.0m (ALL LEGS EXCEPT FOR HOTHAM ROAD
DESIGN VEHICLES SWEPT PATHS

Traffic and Transport Assessment Sorrento Ferry Terminal
15 December 2016 Cardno 53
Sorrento Ferry Terminal
APPENDIX
D OUTPUTS: PEDESTRIAN CROSSING FACILITY SELECTION TOOL

Australasian Pedestrian Crossing Facility Selection Tool• View help tips by hovering over the help icon ( ) • Request help or report a problem• See the Quickstart guide or User guide • Print page
Project name: Sorrento Ferry Terminal
Project location: Sorrento
Option/assessment number:
Date of assessment: 14/12/2016
Site informationJurisdiction: Victoria
Midblock or intersection? Midblock
Physical/environmental variablesNumber of flow directions: 1
Parking/shoulder: No
Pedestrian visibility: 100 metres
Direction 1Flow: Right to Left
Trafficked lanes: 2
Crossing distance: 6.4 metres
Operational variablesPosted speed limit: 30 km/h
Approach speed (85th percentile): 30 km/h
Traffic volume (AADT): 3840 veh/day
Peak sensitive pedestrian volume: 2760 ped/hr
Peak nonsensitive pedestrian volume: 2760 ped/hr
Estimated daily pedestrian volume: 33120 ped/day
Average vehicle occupancy: 1.2 pers/veh
Direction 1Flow type: Uninterrupted
Peak vehicle volume: 320 veh/hr
Site layout diagram
Overall site characteristicsTotal crossing distance:
6.4 metres
Total peak hourly vehicle flow:
320 veh/hr
Estimated pedestrian crossing time:
5.8 seconds
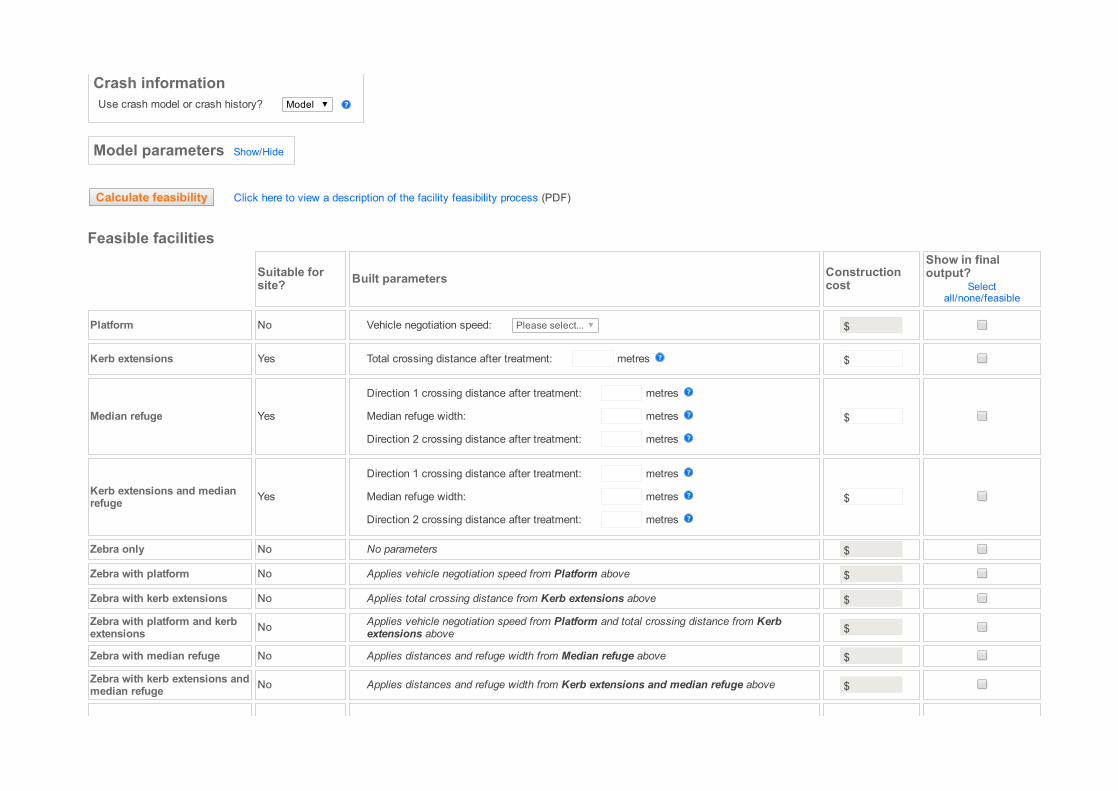
Crash informationUse crash model or crash history? Model
Model parameters Show/Hide
Calculate feasibility Click here to view a description of the facility feasibility process (PDF)
Feasible facilities
Suitable forsite? Built parameters Construction
cost
Show in finaloutput?
Selectall/none/feasible
Platform No Vehicle negotiation speed: Please select...
Kerb extensions Yes Total crossing distance after treatment: metres
Median refuge Yes
Direction 1 crossing distance after treatment: metres
Median refuge width: metres
Direction 2 crossing distance after treatment: metres
Kerb extensions and medianrefuge Yes
Direction 1 crossing distance after treatment: metres
Median refuge width: metres
Direction 2 crossing distance after treatment: metres
Zebra only No No parameters
Zebra with platform No Applies vehicle negotiation speed from Platform above
Zebra with kerb extensions No Applies total crossing distance from Kerb extensions above
Zebra with platform and kerbextensions No Applies vehicle negotiation speed from Platform and total crossing distance from Kerb
extensions above
Zebra with median refuge No Applies distances and refuge width from Median refuge above
Zebra with kerb extensions andmedian refuge No Applies distances and refuge width from Kerb extensions and median refuge above
$
$
$
$
$
$
$
$
$
$

Signals Yes
Signals activated by pedestrian call button? Yes
Delay before green pedestrian phase: 900 seconds
Pedestrian walk + clearance time: 2700 seconds
Pedestrian platoon size: 2760 peds
270000
Signals with kerb extensions Yes Applies parameters from Signals and total crossing distance from Kerb extensions above
Grade separation Maybe N/a
Calculate assessment
Automatically calculate when inputs are updated?
Facility assessmentSuitable for site? Pedestrian delay Vehicle delay Predicted crash rate CSD ASD SISD
No facility 4 sec 0 sec 0.06 /year 53 m 22 m 47 m
Signals Yes 451 sec 1014 sec 0.03 /year 53 m 22 m 47 m
Perceiveddelay
Perceivedsafety
PedestrianLOS
Pedestrian delaycost
Pedestrian delaysaving
Vehicle delaycost
Crashcost
Safetysaving
Total benefits BCR
No facility B C C $ 1,769,000 $ 77,000
Signals F B C $ 206,952,000 $ 205,183,000 $ 43,174,000 $ 42,000 $ 34,000 $ 248,322,000 919.7
Notes
DisclaimerThis tool is a freely provided by Austroads and Abley Transportation Consultants Limited. The tool is intended to help practitioners select an appropriate pedestrian crossing facility for a particularlocation. The tool is based on literature, and analytical and behavioural research coupled with a number of mathematical models. Its development is detailed in the Austroads report Development ofthe Pedestrian Facility Selection Tool. As with all mathematical models care must be taken to understand input limitations and background assumptions when interpreting the outputs. The tool doesnot replace professional engineering or planning advice and neither Austroads nor Abley Transportation Consultants Limited accept any responsibility regarding the tool. While we have endeavoured to
$
$
$
ensure the information output by the tool is appropriate, we make no representations or warranties of any kind about the completeness, accuracy, reliability, suitability or availability with respect to theoutputs. Any reliance you place on such information is strictly at your own risk and it is your responsibility to check all information output by the tool.
Version: 1.1.0