Embed Size (px)
Citation preview
1
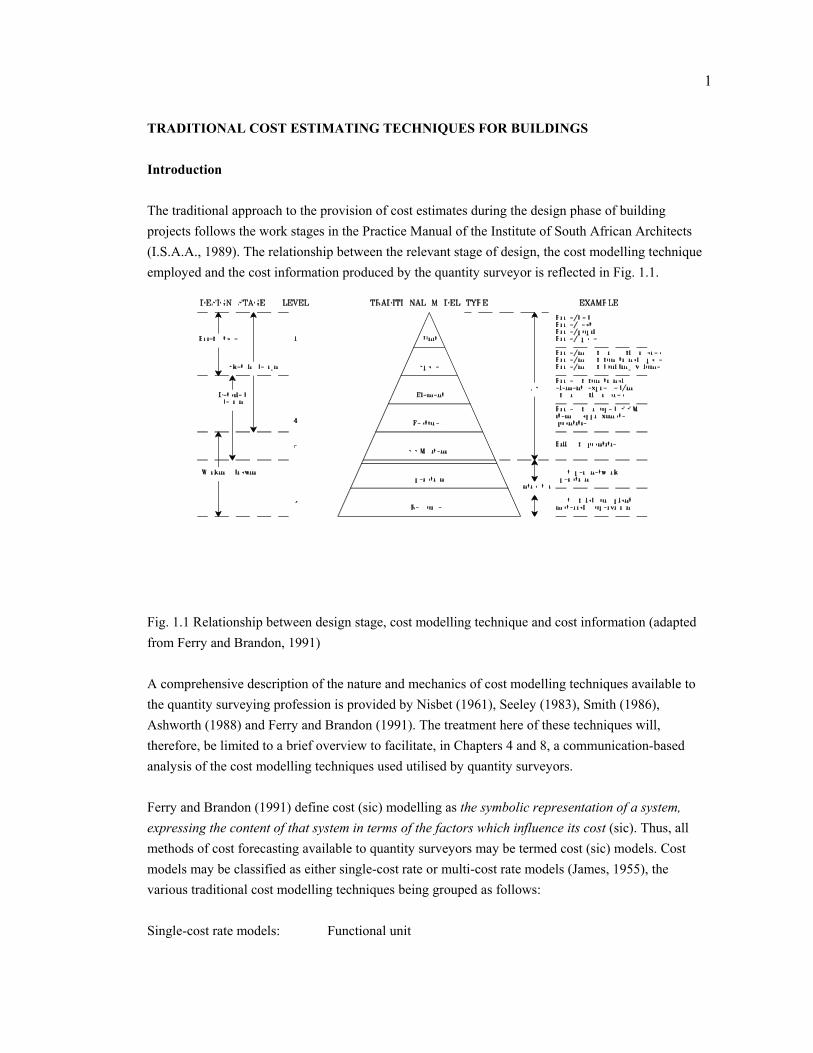
TRADITIONAL COST ESTIMATING TECHNIQUES FOR BUILDINGS Introduction The traditional approach to the provision of cost estimates during the design phase of building projects follows the work stages in the Practice Manual of the Institute of South African Architects (I.S.A.A., 1989). The relationship between the relevant stage of design, the cost modelling technique employed and the cost information produced by the quantity surveyor is reflected in Fig. 1.1.
Fig. 1.1 Relationship between design stage, cost modelling technique and cost information (adapted from Ferry and Brandon, 1991) A comprehensive description of the nature and mechanics of cost modelling techniques available to the quantity surveying profession is provided by Nisbet (1961), Seeley (1983), Smith (1986), Ashworth (1988) and Ferry and Brandon (1991). The treatment here of these techniques will, therefore, be limited to a brief overview to facilitate, in Chapters 4 and 8, a communication-based analysis of the cost modelling techniques used utilised by quantity surveyors. Ferry and Brandon (1991) define cost (sic) modelling as the symbolic representation of a system, expressing the content of that system in terms of the factors which influence its cost (sic). Thus, all methods of cost forecasting available to quantity surveyors may be termed cost (sic) models. Cost models may be classified as either single-cost rate or multi-cost rate models (James, 1955), the various traditional cost modelling techniques being grouped as follows: Single-cost rate models: Functional unit

2
Superficial (floor) area Cubic Storey enclosure
Multi-cost rate methods: Approximate quantities
Elemental forecasting Comparative forecasting and interpolation Non-traditional cost models Pricing of bills of quantities.
Bills of quantities, whilst strictly speaking not usually considered as cost modelling techniques applicable to the design phase, are included above as they are employed in the prediction of the lowest tender cost during the technical documentation and approvals stage of the procurement process. Single-cost rate models Functional unit method This method should be regarded as a method for facilitating comparisons rather than a method of cost forecasting per se (Nisbet, 1961), and is applicable as the basis for establishing a budget cost at the inception stage of the project. The method seeks to allocate a cost to each functional accommodation unit of the particular building. The unit cost rate is normally derived from an analysis of the unit prices of a number of similar buildings. Examples of typical functional units would include the cost per pupil-place for a school, the cost per seat for cinemas and the cost per bed for hospitals. Clearly, allowance should be made for variations in design, specification, form of construction and other variables likely to impact on the cost of the building (Smith, 1986). According to Nisbet (1961) and Seeley (1983), this method loses much of its value as a method of cost forecasting if it is used on individual buildings, not only because of the design economics considerations mentioned above, but principally on account of the lack of definition concerning the accommodation to be provided for each unit. Unless these differences can be itemised and quantified, this method provides no more than a very rough indication of (budget) cost. There exists an absence of rules for measurement, and it is advisable that the cost of external works be excluded from the cost forecast for the building. Data required for the computation of a cost forecast utilising this method would comprise the total cost of similar buildings (suitably adjusted for time) and the number of units to be accommodated.

3
The method's advantages of providing a simple method of comparison, of being a convenient form of stating a cost limit or budget, and of being suitable for long-term forecasts of the cost of very similar buildings (e.g., a programme of schools), are outweighed by its lack of suitability for cost forecasting of individual buildings. Superficial (floor) area method The application of cost rates per unit of superficial area to the building area of a proposed project is based on the derivation and use of data from completed projects, and is suitable for application during the inception, appraisal and definition, and design concept stages of the building procurement process. The building area is the sum total of the areas measured at each covered floor level over the external walls or lines of the vertical structure or, where applicable, the centre line of party walls between buildings (A.S.A.Q.S., 1982). The calculation of building area is measured over all internal walls and partitions, internal staircases, lift shafts and ducts, covered porches and balconies, but excludes any allowance for external steps, roof overhangs, internal open areas and small projections. Where sections of the building vary substantially with regard to such items as methods of construction and quality of finishes, the total building area can be sub-divided into appropriate sections, thus permitting the application of appropriate cost rates to relevant building areas. Provision can also be made for separate functional areas e.g., kitchen areas, office areas and laboratory areas. The data requirements of this model include the cost rates per superficial area of similar buildings (sub-divided into the appropriate level of detail), and the extent and specification of the different types of accommodation to be provided. The advantages of this system may be considered to be its: ease of application; relatedness to accommodation; use by the architect in the preparation of initial sketch designs; and ability to cater for differences in size, specification and construction. Major disadvantages are that this system does not permit easy adjustment for: differences in plan shape (wall to floor ratio); the concentration of internal divisions; the extent of plumbing, mechanical and electrical installations; and the vertical elements of a building (i.e., storey height and total building height). Lump sum allowances need to be made for external works, piling and other facets of work not related to the building area. In applying historic superficial cost rates (suitably adjusted for time), the main consideration is the required degree of homogeneity in the selection of comparable buildings, and the definition of this homogeneity (Flanagan, 1980). Cubic method
4
The cubic method is a single-cost rate model based upon the cost per cubic metre (volume) of the building, and is mainly applicable to the appraisal and definition stage of the project. The measurement of the volume of the building is obtained by the application of measurement rules prescribed by the Royal Institute of British Architects (R.I.B.A., 1954). As with the superficial method, where different sections of a building relate to different functions and specification, these differing parts can be measured and priced separately. This method was derived to overcome the perceived inadequacy of the superficial method with respect to the vertical elements of the building. The successful application of this method depends almost entirely on data derived from an almost identical building, as adjustments for differences in shape, storey height and total height have to be assessed by inspection and judgement. The data required for the application of this method include outline or sketch plans from which the volumes may be calculated, outline specifications for the various different sections of the building, and cost rates per cubic metre for previous projects (together with the relevant plans, elevations, and specification). The advantage of this method lies solely in the ease of application, and is outweighed by the disadvantages. These disadvantages include: the absence of a standard unit (which in turn complicates comparisons); prices are unrelated to those parts of the building generating them; and adjustments are extremely difficult to make in respect of differences in plan shape, size, storey height, total height, construction and specification. These differences give rise to wide variations in cubic rates (Seeley, 1983). Furthermore, a cost per cubic metre of building is difficult to justify to clients and architects alike, and is useless in assisting the architect in the design process. Again, lump sum adjustments would need to be made for considerations such as piling, external works and lifts. Flanagan (1980), in an investigation of the relationship between cost per cubic metre, building height and cost per superficial area, found the only statistically significant correlation coefficient to be that between cost per square metre and cost per cubic metre (0,8813). Indeed, the correlation coefficient between storey height and cost per cubic metre, and total height and cost per cubic metre, was 0,0901 and 0,0403 respectively, dispelling any notion that the cubic method is sensitive to height. Storey enclosure method The storey enclosure method of cost forecasting was developed in response to dissatisfaction with the cubic method of cost forecasting. Strictly speaking, it is not exclusively a single-cost method of forecasting. It was devised by the Wilderness Cost Study Group of the Quantity Surveying Division of the Royal Institution of Chartered Surveyors, and reported by James (1954). The method is dependent on the availability of drawings, and consequently can only be used during the design
5
concept and design development stages. The method is said to be an improvement on the cubic method of cost forecasting as it makes explicit allowance for plan shape, total floor area, the vertical position of the floor areas (via the use of greater multiplication factors for higher floors), storey height, and the additional cost of floor areas below ground level. However, whilst able to forecast the cost of the structure and its finishes, this method makes no allowance for site works, the additional cost of more expensive foundations than those normally associated with the type of building, mechanical and engineering services, the additional cost of circular work, and features such as balconies. The storey enclosure method basically consists of measuring the superficial areas of the external walls, floor and ceiling (vertical and horizontal planes) which enclose each storey of the building. These measurements are then adjusted in accordance with a prescribed set of rules to make explicit allowance for the above-mentioned factors of plan shape, etc. The resultant storey enclosure area is then multiplied by a storey enclosure cost (derived from analyses of historical projects) to produce the cost for the proposed project. An adaptation of the storey enclosure system of cost forecasting was developed in the United States of America (Diehl, 1967). Essentially the same as its British counterpart, this method varies in that it takes account of the superficial area of the internal divisions. This results in a complexity ratio of external and internal areas to gross superficial area. Results obtained from the application of this approach appeared to be more promising than those of the British method (Flanagan, 1980). The Department of Public Works and Land Affairs (P.W.D.) (formerly known as the Department of Public Works) in South Africa produced a variation of the private sector storey enclosure cost forecasting system for use in public sector contracts within their control. Their system (P.W.D., 1972) was based on the use of a single tariff which is applied in proportion to the horizontal and vertical elements of the building. The application of the tariff to the various `elements' is known as factorisation. The tariff is determined by a formula derived from the measured and priced bills of quantities for a quasi-house, the formula containing twenty-two representative items with quantities adjusted to maintain the relationships between trades and sub-sections. By repricing the formula with the rates from accepted tenders the tariff may be updated to assist in assessing fluctuations in building prices for the revision of the forecast. This adaptation of the storey enclosure method was itself superseded by an adaptation of the elemental forecasting system in 1988. Brooker (1985), in an examination of the P.W.D. (storey enclosure) cost forecasting system, concluded that despite its rigorous structure and complexity, the technique served the requirements of the P.W.D. well, namely, by providing a uniform method of estimating for projects under its control and to assist in the monitoring of price levels over time. In essence, the model is only suitable for application to a small range of public sector projects.

6
Louw (1956), citing the findings of James (1954), stated that in a comparison of the forecasting ability of the superficial area method, the cubic method and the storey enclosure method, through an analysis of eighty-six tenders for new buildings, the storey enclosure method showed an improvement over the other two methodologies in every instance. Flanagan (1980) places these results in perspective, however, stating that as the storey enclosure method uses more than one rate, it is not surprising that this technique performs rather better than the single-cost rate methods. There is no evidence in the literature of similar comparative analyses in South Africa. The data requirements of this system are: the outline drawings indicating the shape, size and height of the building; and the price rates of previous projects calculated in accordance with the prescribed formula. The advantages of this method lie in the speed of application and the fact that the method makes some allowance for the shape, size and height of buildings. The major disadvantage, revolving largely around the fact that the cost data are largely an abstraction unrelated to the process of cost generation, is that it is extremely difficult to adjust the price rates for differences in specification and quality standards. This disadvantage, together with the fact that it is not easily understood by architects and clients and excludes items often accounting for a substantial portion of the total cost, resulted in a less than enthusiastic reception from practitioners in the United Kingdom (Flanagan, 1980). Apart from the work of Brooker (1985), the literature reveals no evidence of the extent of the use of this method in South Africa. These shortcomings are exacerbated given the high degree of variability associated with factors such as foundation price rates (Beeston, 1975), the lack of a linear relationship between cost and height (Flanagan and Norman, 1978) and the variability of basement costs (Flanagan, 1980). These problems stem from using data from dissimilar projects. Multi-cost rate models Research by Bragg (1974), Bennett and Barnes (1979), Stevens (1983) and Morrison (1983) indicates that forecasting accuracy is improved by increasing the number of items in the forecast. Stevens (1983), in investigating the relationship between the cumulative cost of a forecast and the cumulative number of items in the forecast, and the relationship between forecasting error and the number of items in the forecast, concluded that as much as 90% of cost may lie in only 23% of items in bills of quantities. Moreover, the accuracy of cost forecasts improves as the number of sub-forecasts increases (but is subject to the law of diminishing returns). Research by Harmer (1983) and Seymour (1984) supports the Pareto-type relationship between cost and number of items expounded above. Furthermore, overall estimating accuracy is diminished when cost is concentrated in a few items (Stevens, 1983). These results support the findings of Skinner (1982).

7
The above principles are the underlying tenets of multi-cost forecasting models, namely, that forecasting accuracy is improved by increasing the number of measurable items in the forecast. In addition, these methodologies permit the quantity surveyor to exercise professional judgement (to take cognisance of the effect of design considerations) in the allocation of individual cost rates. Approximate quantities method This method of cost forecasting is considered by Seeley (1983) to be the most reliable of the methods available to the quantity surveyor, by virtue of it being based on the normal method of preparing and pricing bills of quantities. Its very nature makes it reliant on adequate drawings and specification, a requirement that cannot always be met, and certainly not at the inception stage. There are no formal rules of measurement as the degree of detail depends on the amount of design information available, the format resembling an abbreviated bills of quantities. Measurements are usually to within the nearest 150 mm, and are deemed to be inclusive of all labour-only items. The forecast is priced using composite price rates derived from historical price rates obtained from an analysis of previous projects. For example, the items of Rhinoboard ceiling, ceiling brandering, internal cement plaster to soffits, and internal paint to plastered ceilings would be measured and priced as one composite item. Adjustments to the price rates derived from historical projects would have to be made in respect of differences in the preliminaries, location, specification and inflation. Brook (1972) attempted to simplify the approximate quantities method by using factored price rates as a means of facilitating analysis of the price implications of alternative designs. This approach was also investigated by the Property Services Agency (P.S.A., 1977) in the United Kingdom. This forecasting model is used primarily during the design concept and design development stages, and is ideally suited (in terms of the amount of information available) to the latter stages of design. Indeed, Nisbet (1961) contends that during the design development stage `it is the only acceptable method of estimating'. It is claimed that this is the most widespread method used in practice in the United Kingdom (Morrison and Stevens, 1980; Bowen, 1980). No evidence in the published literature could be found regarding its prominence in South Africa. Data required for the application of this method includes sketch plans or preliminary working drawings, specification details (provided or assumed), and current prices from historical projects. The cost of specialist and non-typical work has to be forecast separately. The advantages of using this system may be summarised as: the reliability of the system; permissible subdivision of the forecast to assist the architect with the design process; and the fact that adjustments are comparatively easy to make in respect of differing specifications, shape, size and height. The major disadvantages lie in: the time required to produce this type of forecast; its incompatibility with the elemental sub-divisions of a building; the amount of information required for its application; and

8
its questionable relevance to procurement systems where bills of quantities do not form the basis of the documentation i.e., its late stage of application. Elemental cost forecasting method The elemental cost forecasting method was originally developed from attempts at producing an elemental cost analysis system for purposes of comparison, the idea being to assist in the explanation of cost differences in buildings in quantitative and qualitative terms. This method of cost forecasting is mainly applicable during the design concept and design development stages of design. The basic tenet of the system is the sub-division of the building into functional elements and components, an element being defined as that part of a building that always performs the same function irrespective of its construction or specification, and a component as a sub-division of an element. Examples of elements would include foundations, roof, structural frame and external envelope. Using the element `external envelope' as an example, the components of this element would include walls, finishings (external), windows, doors and curtain walling. Flexibility exists in that users are able to combine or sub-divide elements (components) as necessitated by the nature of the work. The South African method of elemental cost forecasting and analysis is based on the British `Standard Form of Cost Analysis' issued by the Royal Institution of Chartered Surveyors, but the grouping of elements and components (sub-elements) differs. The rules of measurement are laid down in the `Guide to Elemental Cost Analysis' (A.S.A.Q.S., 1982), second edition, issued by the Association of South african Quantity Surveyors. Elements are expressed both as a cost per square metre of gross (horizontal) superficial building area (elemental rate) and as an elemental unit rate which relates the cost of the element to the quantity factor of that element. Clearly, the sub-division of the cost forecast into functional elements facilitates cost exploration and the adjustment of elemental and component cost rates for differences in design, specification and time. The Department of Public Works and Land Affairs (P.W.D.) in South Africa again produced a variation of the private sector forecasting system for use in public sector contracts within their control. The P.W.D. method of elemental forecasting (reference QS57E and QS58E) is far more complex than the private sector counterpart, employs a slightly different set of elements and components, and appears to be an amalgamation of the elemental and storey enclosure methods - involving the use of factors and tariffs. The same twenty-two representative items as utilised in their storey enclosure method are used in their version of the elemental system. Interestingly, this same set of items is used by the Bureau for Economic Research, University of Stellenbosch in the compilation of the `Building Cost Index'.

9
The problem of method familiarity is compounded by the fact that not all government departments adopt this system. The South African Post Office (formerly the Department of Posts and Telecommunications), for instance, permits private sector quantity surveyors to utilise the private sector format. The data requirements of this system rely on cost analyses of buildings of similar function, outline drawings for the calculation of quantity factors, and specification details. The advantages of this method lie in its ease of application and the fact that cost comparisons to the elements and components of other buildings are possible. It is easily understood, and can assist the architect in the formulation of the design. Disadvantages associated with this system are the time required for its preparation, the cost data requirements and the skill needed for the adjustment of rates. Comparative forecasting and interpolation methods The comparative method of cost forecasting takes the cost of a similar type of building as the basis, and then makes cost adjustments for differences in constructional methods and specification. To facilitate the process of adjustment and the evaluation of alternatives, it is advisable to compile a schedule of related work to a square metre of finished work for a whole range of alternatives. The application of differing combinations of rates should be applied with caution, however, as elements do not function in isolation and the effect of interdependence should not be ignored (Seeley, 1983). This method would be applicable during the design development stage for the pricing of design options. The interpolation method is a variant of the comparative method whereby, at the inception, appraisal and design concept stages of the design, a forecast of cost may be produced by interpolating a cost per square metre rate from a schedule of superficial rates derived from analyses of similar buildings. This method is essentially one of intuitive interpolation. Non-traditional cost models The term `cost modelling' was originally associated with non-traditional forms of cost modelling, the development of which has largely resided in academic institutions (Bowen and Edwards, 1985), despite general terminological applicability. According to Flanagan (1980), models may be distinguished as descriptive, predictive, explorative or planning in nature. The vast majority of non-traditional forms of cost forecasting models developed to date consist of mathematical predictive models, by virtue of their use of mathematical symbols in the representation of reality. Mathematical models generally consist of two components: data which service the needs of the model; and an algorithm for the manipulation of the data. Mathematical models, in turn, consist of four sub-types, namely, equation systems, statistical techniques, simulation and computer algorithms (Flanagan, 1980).

10
The first two types of mathematical predictive models have hitherto dominated the field of non-traditional cost models available to the quantity surveyor (Ashworth, 1981). This is not to say that the other two forms of non-traditional models have not been developed; they have, but their availability to practitioners is very limited, if non existent. The nature and development of these more `academic' forms of non-traditional cost modelling will be discussed in Chapter 8. Ferry and Brandon (1991) describe cost equation systems as causal or empirical models, stating that in many ways these are merely refinements of traditional forecasting techniques. The mechanics underlying the development of these causal models are the expression of the building in algebraic terms, the assigning of values to the algebraic terms, and the application of cost coefficients to produce a cost forecast. Morrison (1983) employed such an equation-based method in the development of a cost forecasting model for emulating the system in which quantity surveyors produce their cost forecasts. For example, the cost of the reinforced concrete foundation bases to a rectangular framed structure could be represented by Cost of bases = [(L/BL)+1] * [(W/BW)+1] *CFn
where; L = length of framed structure
W = width of framed structure
BL = average bay size in one direction
BW = average bay size in the other direction
CFn = the cost factor per base. In a similar vein, algebraic equations could be constructed for all the other components of the building. The flexibility of the system is said to be its major advantage, permitting the evaluation of alternative conceptual design options prior to the commencement of the detailed design. The disadvantages of this system lie in the lack of universal application, the choice of an appropriate cost factor and the difficulties inherent in representing complex buildings in algebraic terms. The application of differential calculus to the mathematical expression of buildings has been utilised for layout optimisation purposes (Bathurst and Butler, 1973). During the 1970's and the first half of the following decade regression models emerged as a popular technique. Research in this field includes the work of Tregenza (1972), Kouskoulas and Koehn (1974), McCaffer (1975), Reynolds (1978, 1980), Flanagan and Norman (1978) and Bowen (1982a, 1984). Models are not confined to the appraisal of the total cost of the building, and effort has been directed to the development of models for various elements of a building (Reynolds, 1976), with
11
applications ranging from models dealing with the cost of heating, ventilating and air conditioning installations (Gould, 1970) to those concerned with concrete framed structures (Bowen, 1980). The superiority of a regression model over a traditional model such as the rate per square metre is easily perceived, in that it is statistically possible to demonstrate the strength of a relationship between, say, area and cost. The efficiency of more complex multiple linear and curvilinear regression models has been demonstrated, at least at a theoretical level, and it seems that the development of a hierarchical nest of models is entirely feasible (McCaffer et al., 1983). Regression models are suitable for application throughout the design phase, but are better suited to those early stages where a minimum of design information is available. Regarding the disadvantages of regression cost modelling, Beeston (1978) and Bowen (1982b) provide an overview of the problems associated with this statistical technique. Major drawbacks include the concept of model blindness (Brandon, 1982) and the requirement on the part of the user to possess an adequate grasp of the science of statistics (Bowen and Edwards, 1985). Meyret (1969), Tumarkin (1971), Paige (1979) and Krieg (1979) investigated the theory and application of parametric cost forecasting. The underlying tenet of parametric forecasting is that the average cost of a particular unit, element or component bears a definite relationship to the cost of the complete building in some ratio or proportion. It is not inconceivable to consider the majority of traditional cost models as parametric methods, with regression models also falling into this category (Krieg, 1979). The main advantage of parametric cost modelling is the speed in which a forecast can be produced, said to be in the order of a quarter of the time required to produce an elemental cost forecast. Furthermore, a forecast can be produced without recourse to drawings as long as the factors which affect building costs are known, together with details of building size, height, etc. The main disadvantages lie in the inability of the system to reflect the costs of the various elements of the system, the lack of transparency afforded by the model, and the validity of the enhancement factors (Paige, 1979). A substantial database is necessary to support the formulation and maintenance of regression and parametric cost models, and this is almost certainly beyond the individual capabilities of most professional quantity surveying firms. Comprehensive, centralised databases, unlike the situation prevailing in the United Kingdom, have yet to become a reality in South Africa. Ashworth (1981) contends that the number of sets of data used in the construction of a regression cost model must be greater than (ideally 2,5 times) the number of variables contained in the model. Pricing of bills of quantities According to Ferry and Brandon (1991), traditional bills of quantities constitute a good example of a product-based cost (sic) model. Product-based cost models are based on the measurement of finished

12
`work-in-place' according to a set of prescribed measurement rules. As such, the bills of quantities cost model is applicable to the technical documentation and approvals stage of the building procurement process. The pricing of the bills of quantities by the quantity surveyor immediately prior to the invitation of tenders constitutes the final cost forecast in the pre-contract phase of the building procurement process. In this manner, the quantity surveyor attempts to emulate the pricing actions of contractors tendering for the contract and, in a sense, may be thought of as being in competition with them in their attempts to forecast the `market' cost of the project. Bills of quantities generally comprise, inter alia, the trade preambles, the preliminaries, the various applicable trades of measured work (as opposed to elements), and provisional sums in respect of specialist installations. The rules of measurement are prescribed in the `Standard System of Measuring Building Work' (A.S.A.Q.S., 1991), sixth edition as amended, the first edition being issued in 1906. Bills of quantities, similar to that used in the United Kingdom, form the basis of the competitive form of tendering in the building industry and provide a detailed schedule of the quanta of labour and materials required for a particular project. The data necessary for the pricing of bills of quantities by the quantity surveyor include the priced bills of quantities of previous projects from which are drawn individual price rates for insertion against items of measured work. Adjustments, based on professional judgement, are made for perceived differences in quantity, time and complexity. Alternative approaches to pricing entails the use of published price books and the compilation of price rates from first principles. It may be necessary to refer to the working drawings to obtain greater clarity on specific issues. The advantages of this system are that it comprises the most detailed form of forecasting currently available and relates directly to the submission of tenders, thus permitting an analysis of differences between the pricing by the quantity surveyor and the successful tenderer. Its disadvantages lie mainly in the timing of its application, namely, that it occurs at too late a stage to be effective in the design process in terms of its usefulness in influencing design and as a mechanism for exercising cost control during the design process. Furthermore, the time taken to prepare this form of forecast is not inconsiderable, and the format of bills of quantities is largely unrelated to that used in the approximate quantities and elemental forms of forecasting. Notwithstanding these shortcomings, the pricing of bills of quantities is seen by quantity surveyors as the most detailed, accurate form of cost forecasting available to them. Assessment Current cost prediction techniques have as their basis the assumption that cost is related to a measurement parameter. Single-cost rate techniques are applicable if applied to buildings displaying
13
homogeneity. Multi-cost rate techniques assume that unit cost rates are sensitive to design criteria. None of the cost forecasting methods take cognisance of construction time, complexity or operational sequence. Cost information (data) available to service cost models In the previous section the various techniques of cost forecasting available to the quantity surveying profession in South Africa were discussed. In this section the data theoretically available to quantity surveyors for the purposes of cost forecasting will be introduced. The information concerning general cost levels is held by forecasters in various forms and extracted from various sources. Newton (1983) and Raftery (1984) warn of the necessity of any cost information system being compatible with the design process. The general lack of empirical research into the effect of information and the different types of information available to the cost forecaster is a source of major concern, resulting in much of the literature on cost planning being of questionable value (Skitmore et al., 1990). The cost information available to the quantity surveyor may be classified into two main categories: cost data obtained from previous projects with which the quantity surveyor has had personal involvement (or from other projects within the quantity surveyor's own organisation); and published cost information (Stevens, 1983). This contention is supported by various texts on the subject of cost planning and control (e.g., Ashworth, 1988; Ferry and Brandon, 1991). In-house cost information In-house cost data, the scope and quantity of which undoubtedly is a function of organisational size, generally consists of project cost analyses compiled by individual quantity surveyors, and the priced bills of quantities submitted by successful tenderers. Dealing with each of these in turn. Cost analyses It has already been shown that, with the failure of the E.B.D. service, quantity surveyors in South Africa do not have access to published elemental cost data similar to that of the B.C.I.S. Furthermore, journals in South Africa do not contain published elemental cost analyses along the lines of that contained in British journals such as The Architects' Journal, or the Australian journal The Building Economist. Consequently, the only source of elemental cost data available to the quantity surveyor in South Africa is that derived from analyses of priced bills of quantities undertaken within individual organisations.
14
Bills of quantities Cost data contained in the bills of quantities of successful tenderers must surely constitute the major source of cost information available to the quantity surveyor in South Africa, especially as there is an almost complete lack of published item rates relating to building work. Data derived from bills of quantities may be summarised as follows: : individual rates for measured items of work, : total costs for use with the single-cost rate methods of approximate cost forecasting, and, : elemental analyses in terms of the `Guide'. Published cost information Unlike the situation prevailing in the United Kingdom and Australia, South Africa is inadequately served by published cost information. Cost books The only local cost book worthy of note is Merkel's, a comprehensive document published annually. British cost books, for example Laxton's and Spon's, are obtainable, but their usefulness is limited to an explanation of the principles underlying the synthesis of prices for building work. Clearly, those data per se are useless in the South African context. Merkel's pricing and management manual, running into approximately one thousand pages, contains, inter alia, data relating to the pricing of items to be found in each trade of bills of quantities, the pricing of preliminaries and specialist installations, and an explanation of a typical specification and set of tender documents. A major problem relating to the use of published price data is the inevitable time lag between data collection, publication and use by the quantity surveyor. If one considers that these books are usually published at the commencement of a particular year, and that the relevant data must have been collected prior to that, it is questionable whether, at best, the rates presented can represent anything more than an average situation. The problem is exacerbated by the fact that such data are presented without accompanying descriptive statistics. Thus, judgement of data quality is difficult. The publishers of Merkel's do, however, advocate the use of the `P0151 - Haylett Formula' contract price adjustment indices and the wage rates for the industry published by the Central Statistical Service as a means for updating the cost information during the year - notwithstanding the fact that this statistical information is published three to four months in arrears.

15
Ashworth (1980, 1986) and Bennett (1984) produced comprehensive studies of the variability existing between the prices contained in the major cost book sources in the United Kingdom, concluding that wide variations in individual item cost rates exist. No similar study of the accuracy and consistency of data available in South Africa has been undertaken. Building cost and tender-based price indices The process of cost planning requires the use and manipulation of large quantities of historic cost and cost data, thus necessitating the use of appropriate indices as a means for relating the price level at the base date of the cost information to the price level pertaining at the base date of the cost forecast or elemental cost plan. Flanagan (1980) defines an index as a statistical measure designed to reflect changes in a variable or group of variables with respect to time. The two types of indices germane to this study are the building cost index and the tender-based price index. The former, known as a factor cost index, measures fluctuations in the cost of the production resources to the contractor, and is therefore composed of wages, material and plant costs appropriately weighted to reflect their relative importance in relation to each other - the `basket of goods' principle. Such indices can be compiled to reflect the total construction costs of a building, an element or trade within the building process, or even a single material. The latter type of index is based upon what the client is prepared to pay for the building and, as such, includes not only building costs per se, but also an allowance for market conditions and profit. This form of index is normally constructed by analysing bills of quantities submitted by successful tenderers. Allen (1975) and Tysoe (1981) offer a comprehensive analysis of the nature and use of construction cost and price indices. Bowley and Corlett (1970) recommend the use of a tender price index for the purposes of cost planning and control. Reasons cited for this include the fact that such an index represents the cost to the client; includes an allowance for market conditions; and takes cognisance of the contractor's method of undertaking the work. According to Ferry and Brandon (1991), there are five main uses to which building cost and tender price indices can be put: updating elemental cost analyses; extrapolation of existing trends; calculation of cost fluctuations; identification of changes in cost relationships; and the assessment of market conditions. The building industry in South Africa, unlike the United Kingdom which enjoys upward of fifteen cost and price indices, is served by two main indices. The first, published under the auspices of the Building Industry Advisory Council, is the `P0151 - Haylett Formula' index. This is a factor cost index compiled and published by the Central Statistical Service. The second is the `Building Cost Index', a tender-based price index compiled and published by the Bureau for Economic Research, University of Stellenbosch. Interestingly, the `Building Cost Index' referred to above is, in fact, a tender-based price index. In addition to these indices, certain other relevant indices are available.
16
These include: the `P0153 - Contract Price Index for Buildings' published by the Central Statistical Service; `Trends in Building Costs' and `Building and Construction' published by the Bureau for Economic Research; and the commercially available report produced by Medium-Term Forecasting Associates. It is not within the scope of this thesis to provide a detailed account of the nature and use of these indices. Comprehensive descriptions are provided by Brook (1974, 1985), Kilian (1980), Snyman (1980) and Kilian and Snyman (1984). There is no evidence in the literature of research into the validity of these indices. General economic indicators General economic indicators refer to those statistics representing the economic performance of the building industry, and reflect the activity levels in certain key areas of relevance to the building industry. Examples of these key areas would include total new orders, and architects' and quantity surveyors' workload. Kilian (1976) provides detailed commentary on the dearth of economic indicators available to the building industry in South Africa. In summary, the main indicators available and relevant to quantity surveyors are the series `P5041.2 - Building Statistics - Private Sector' (dealing with the value of building plans passed and buildings completed) and the `P17 - Short-Term Economic Indicators' publication. These indicators, published by the Central Statistical Service, are not without problems (Kilian, 1976), the issue of suitable deflators being amongst them. General indicator statistics are available from the `Quarterly Bulletin' of the South African Reserve Bank and the `Quarterly Bulletin of Statistics' produced by the Central Statistical Service. Details of architects' and quantity surveyors' workloads are contained in the `Building and Construction' publication. Assessment Quantity surveyors in South Africa, unlike their British counterparts, are poorly served by published price information. Historical cost data derived from bills of quantities are the main source of cost data of the quantity surveying profession in South Africa. Reliance is placed on indices for the adjustment of prices and price information. Forecasting accuracy achieved in theory In the previous section the various cost data available to the quantity surveying profession in South Africa were discussed. In this section the accuracy theoretically achievable by quantity surveyors in the provision of cost forecasts is introduced. The accuracy actually realised in practice in South Africa will be dealt with in Chapter 5.

17
Bowen and Edwards (1985) drew attention to the need to establish `acceptable' levels of accuracy in the context of the provision of cost forecasts and plans. Skitmore et al. (1990), in a detailed study of the quality of cost forecasts in the United Kingdom, state that the quality of any forecast is a function of five factors: the nature of the target (e.g., the nature, type and size of the project); the information used; the forecasting technique utilised; the feedback mechanism employed; and the person providing the forecasts. Very little research effort has been focused on the question of cost forecasting quality. The major contributions have emanated from Ashworth and Skitmore (1982, 1986), Flanagan and Norman (1983), Morrison (1984) and Skitmore et al. (1990), with Skitmore (1985) investigating the influence of professional expertise on construction cost forecasts. The issue of `accuracy' is confounded when it is appreciated that neither the cost forecast by the quantity surveyor nor the bid submitted by the contractor are `true' values, both being forecasts and hence subject to relative error bounds. In fact, three points are of relevance here: the accuracy of the tender price submitted by the contractor; the accuracy of the cost forecast made by the quantity surveyor; and the `true' price. Moreover, errors in the measurement of physical quanta will be present (Heisenberg, 1967), and need not be insignificant (Edwards et al., 1990). Bowen and Edwards (1985) point to the possible divergence between expectations of accuracy on the part of clients and architects on the one hand, and assumptions of accuracy by the quantity surveyor on the other hand. Cursory research (Bowen and Edwards, 1985) indicated that this is indeed so. Flanagan (1980) called for the introduction of accuracy monitoring systems utilising techniques borrowed from statistics, for example, cusum charts. Possibly the most seminal work has been produced by Beeston (1975, 1983) who, in a theoretical analysis, concluded that a coefficient of variation of 7% for the quantity surveyors' observable estimating variability is the performance which can be expected using present methods in the best way under average circumstances. Morrison (1983), in a study of 915 projects taken from seven different quantity surveyors' offices, revealed that the average accuracy achieved by quantity surveyors when pricing bills of quantities has a mean deviation of approximately 12% and coefficient of variation of approximately 16%. Morrison (1983) suggested that the use of a less detailed method of forecasting, such as the elemental method, is likely to produce results with a coefficient of variation of approximately 20%. All the above publications relate to studies undertaken in the United Kingdom. No evidence, apart from two very cursory studies undertaken by Bowen and Edwards (1985, 1986), could be found in the published literature relating to research concerning the accuracy of quantity surveyors' cost forecasts in South Africa. Conclusion

18
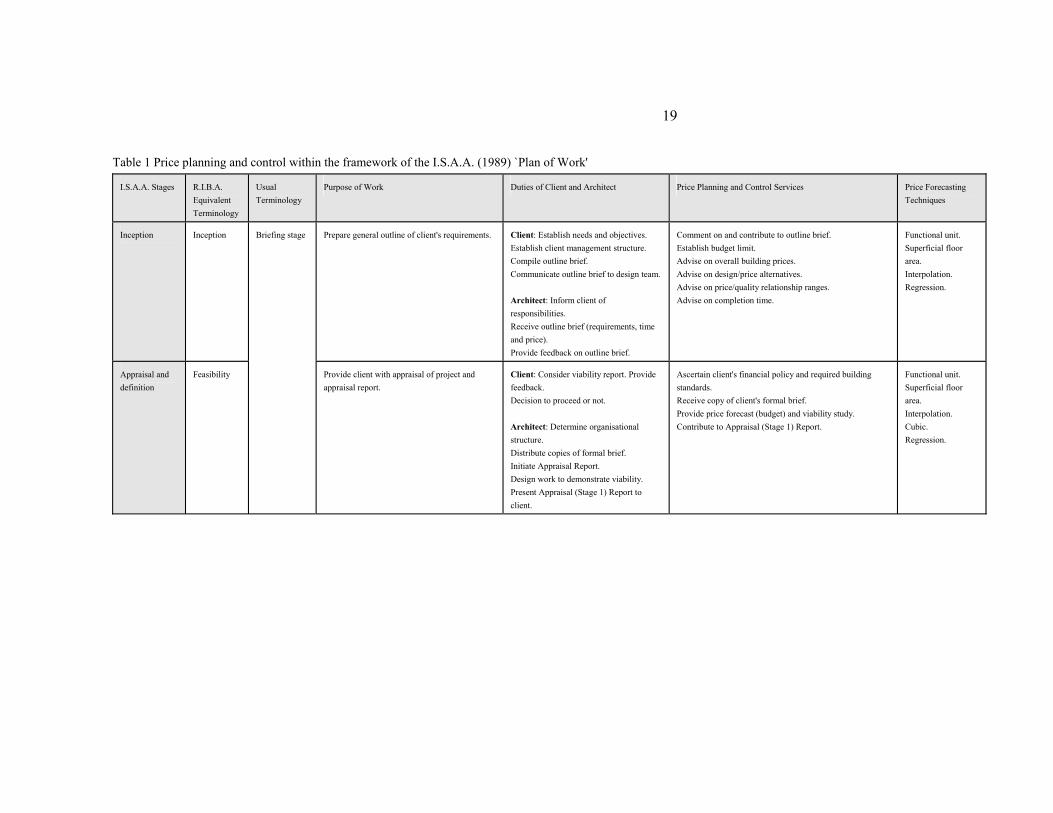
In this document the current theory of cost planning and cost control within the context of building design has been presented. In addition, a description of the cost forecasting techniques and cost information theoretically available to practising quantity surveyors was provided. Emphasis was given to the situation prevailing in South Africa. A summary of the theory of cost planning and control, within the framework provided by the I.S.A.A. (1989) `Plan of Work', is embodied in the attached Table 1. This summary indicates the cost planning and control services theoretically available, and the duties of the client and the architect. In addition, the cost forecasting techniques available to quantity surveyors at the various stages of the design process are given.
19
Table 1 Price planning and control within the framework of the I.S.A.A. (1989) `Plan of Work'
I.S.A.A. Stages R.I.B.A. Equivalent Terminology
Usual Terminology
Purpose of Work Duties of Client and Architect Price Planning and Control Services Price Forecasting Techniques
Inception Inception Prepare general outline of client's requirements. Client: Establish needs and objectives. Establish client management structure. Compile outline brief. Communicate outline brief to design team. Architect: Inform client of responsibilities. Receive outline brief (requirements, time and price). Provide feedback on outline brief.
Comment on and contribute to outline brief. Establish budget limit. Advise on overall building prices. Advise on design/price alternatives. Advise on price/quality relationship ranges. Advise on completion time.
Functional unit. Superficial floor area. Interpolation. Regression.
Appraisal and definition
Feasibility
Briefing stage
Provide client with appraisal of project and appraisal report.
Client: Consider viability report. Provide feedback. Decision to proceed or not. Architect: Determine organisational structure. Distribute copies of formal brief. Initiate Appraisal Report. Design work to demonstrate viability. Present Appraisal (Stage 1) Report to client.
Ascertain client's financial policy and required building standards. Receive copy of client's formal brief. Provide price forecast (budget) and viability study. Contribute to Appraisal (Stage 1) Report.
Functional unit. Superficial floor area. Interpolation. Cubic. Regression.

20
Table 1 (continued) Price planning and control within the framework of the I.S.A.A. (1989) `Plan of Work'
I.S.A.A. Stages R.I.B.A. Equivalent Terminology
Usual Terminology
Purpose of Work Duties of Client and Architect Price Planning and Control Services Price Forecasting Techniques
Design concept Outline proposals and Scheme design
Sketch plan stage
Determine general approach to layout, design and construction. Obtain client's approval of outline proposals. Complete the brief. Determine specific proposals including construction method, outline specification and price.
Client: Consider report, and suggested amendments. Provide feedback. Approval of scheme. Architect: Study analyses of similar buildings. Investigate possible solutions. Establish possible modifications to brief. Outline design plans. Decide on one general approach. Prepare full scheme design. Assist quantity surveyor with outline price plan. Scheme design plans. Receive individual consultant's reports. Compile and present Stage 2 Report to client.
Provide price forecasts on broad design concepts. Advise on comparative prices. Assist with price issues based on client's comments on appraisal report. Prepare initial price plan with specific recommendations. Reconcile price plan with budget price and viability. Contribute to Stage 2 Report to client including advice on construction time, price forecast and price plan, and recommendations for brief modification.
Superficial floor area. Interpolation. Comparative. Regression. Parametric. Storey enclosure. Elemental. Approximate quantities.
Design development
Detail design Working drawing stage
Obtain final decision on all matters relating to design, specification, construction and price.
Client: Consider report, and suggested amendments. Provide feedback. Approval to proceed. Architect: Review report and amend brief to client's satisfaction. Development of detail design. Pilot details. Detail studies. Detail design drawings, and submit to quantity surveyor for price checking. Review price plan and price checks of detail design. Receive individual consultant's reports. Compile and present Stage 3 Report to client.
Price check design against price plan. Update price forecast and viability study. Update price plan as necessary. Reconcile price plan with client's budget and initial price plan. Provide complete price check report. Advise client of commitment to brief. Amendments to brief affect price, programme and viability. Check viability. Contribute to Stage 3 Report to client, including updated price forecast, reconciliation of price plan and viability study.
Storey enclosure. Elemental. Approximate quantities.

21
Table 1 (continued) Price planning and control within the framework of the I.S.A.A. (1989) `Plan of Work'
I.S.A.A. Stages R.I.B.A. Equivalent Terminology
Usual Terminology
Purpose of Work Duties of Client and Architect Price Planning and Control Services Price Forecasting Techniques
Documentation and approvals
Production information, Bills of quantities and Tender action
Working drawing stage
Prepare production information. Prepare and complete all information and arrangements for obtaining tenders. Obtain tenders.
Client: Detailed decisions within the scope of previous decisions only. Consider report. Provide feedback. Architect: Review report and amend to client's satisfaction. Compile and issue design development report and drawings to team to act as parameters. Ensure documentation in accordance with agreed design. Compile and present Stage 4 Report to client.
Ensure production documentation in accordance with agreed design. Prepare price forecast on production documents - reconcile with price plan and review viability study. Measure and prepare bills of quantities. Price bills of quantities - final price forecast. Check submitted priced bills of quantities. Prepare report on checked priced bills of quantities, and reconcile with price plan. Prepare elemental price analysis. Review price forecast and viability study, and reconcile with price plan. Contribute to Stage 4 Report to client.
Approximate quantities. Detailed quantities.
Contract administration and supervision
Project planning and Operations on site
Plan efficient execution of contract. Effective implementation of contract. Transformation of contract particulars into building work.
Client: Approve variations. Receive and comment on progress and financial reports. Architect: Submit progress and financial reports to client. Obtain client's approval for variations. Record drawings. Submit to client and quantity surveyor all architect's instructions and variation orders.
Prepare cash flow projections (expenditure plan). Establish financial consequences of claims. Provide price advice on proposed variation orders. Match certification with expenditure. Establish price of variation orders. Prepare financial reports. Prepare final account.
Approximate quantities. Detailed quantities.
Debriefing Feedback
Site operations stage
Feedback of information from current project to assist in future projects.
Client: Contribute to debriefing meeting. Architect: Prepare maintenance manual. Hold debriefing meeting.
Prepare elemental price analysis. Compile historic price data. Contribute to debriefing meeting.
----
Note: The B.E.R Building Cost Index and the `Haylett' Index are the main indices available for the adjustment of building price and cost data.