Embed Size (px)
Citation preview

Traditional Chinese Medicine Industry
Oct 31, 2016 Equity Research | Healthcare
Modernization creating opportunities and driving growth
Natalie Chiu SFC CE No. AVH029 [email protected] +852 3760 2030 GF Securities (Hong Kong) Brokerage Limited 29-30/F, Li Po Chun Chambers 189 Des Voeux Road Central Hong Kong
Traditional Chinese medicine market to expand rapidly Traditional Chinese Medicine
(TCM) in China enjoyed more rapid growth than other segments of the pharmaceutical industry in 2011-14. Driven by an increasingly aging population, rising GDP per capita, expanding medical insurance programs and urbanization, we believe it will continue to expand rapidly, delivering a 15%+ CAGR in sales during 2015-19. The industry will also benefit from favorable government policies for the Chinese medicine industry, and we expect it to be globally competitive over the long term. For Chinese patent/finished medicines, companies face a tougher operating environment due to slower organic growth amid tough competition. For modern Chinese medicines, favorable policies are leading to the emergence of new companies. Sector trading at an unjustified discount The Chinese medicine segment is now
trading at 15x 2017E P/E, vs 17x for chemical drugs players. We believe this discount is due to a lack of understanding among investors of individual companies’ business models. Solid earnings and industry consolidation could trigger a re-rating. Overall, we believe the near-term risk-reward profile is attractive. Initiating coverage of China TCM, Kingworld Medicines, and Beijing Tong Ren Tang
We initiate coverage of China TCM (570 HK, Buy), Kingworld Medicines (1110 HK, Buy), and Beijing Tong Ren Tang CM (8138 HK, Accumulate) with one-year target prices of HK$5.20, HK$1.80 and HK$12.30, respectively, implying 30%, 22% and 9% upside from their latest closing prices. China TCM is the TCM arm of China National Pharmaceutical Group Corporation, Sinopharm’s (1099 HK, NR) parent company The company produces traditional patent
medicines (finished TCM) and modern Chinese medicine (concentrated TCM granules, or CCMG). The company has a diversified finished TCM portfolio with more than 500 prescription and OTC products. In concentrated TCM granules, it is among the top-five CCMG players that together account for 50% of the market. Kingworld Medicines to grow through M&A and organic development Kingworld has
a sound growth strategy, aiming to: 1) expand its high-GM product offerings; 2) increase online sales, and; 3) penetrate lower-tier city markets. With a proven ability for product integration, we expect the company to continue to grow faster than the industry average during 2016-18, with further penetration into lower-tier provinces and cities, and improved profitability through a better product mix and greater operating efficiency. Beijing Tong Ren Tang Medicine is the largest proprietary Chinese medicine exporter in China With 62 self-operated stores outside China, Tong Ren Tang CM now
has one of the largest TCM retail networks in Asia. The company operates a TCM clinics-centric model and relies on product revenue generated from providing TCM consultation services. It currently offers two self-manufactured products: Angong Niuhuang Pills and ganoderma lucidum spores powder.
Stock valuations
Sources: Company data, GF Securities (Hong Kong) Note: As of Oct 18, 2016
Mkt Cap PEG (x)
Ticker Rating (HK$ m) Price TP FY15 FY16E FY17E FY18E FY15 FY16E FY17E FY18E FY15 FY16E FY17E FY18E FY17E FY15 FY16E FY17E FY18E FY15 FY16E FY17E FY18E
Guangzhou BYS 874 HK NR 44,629 19.08 NR 15.4 15.9 14.7 13.5 9 9 13 6 7 (4) 9 8 1.7 2 6 6 1 16.1 14 13 14
CTCM 570 HK Buy 17,682 3.99 5.20 20.4 13.5 11.3 9.8 51 85 21 17 3 51 20 16 0.6 40 83 17 16 9.1 10 11 12
TRT Tech 1666 HK NR 19,929 15.56 NR 30.0 26.9 23.6 21.7 17 32 14 13 14 12 14 9 1.7 19 14 14 6 14.4 13 14 15
TRT CM 8138 HK Accumulate 9,309 11.12 12.30 26.7 21.0 18.3 15.8 23 28 16 17 20 27 15 16 1.0 28 13 15 16 20.9 22 22 19
Kingworld Med 1110 HK Buy 915 1.47 1.80 26.7 15.4 10.4 8.2 (18) 79 50 28 (22) 73 48 27 0.2 8 41 20 17 5.0 9 12 14
Shineway 2877 HK NR 6,674 8.07 NR 8.2 10.1 10.1 12.6 (7) (22) (6) (5) (8) (19) 0 (20) NA (8) (13) (3) (1) 12.9 9 9 8
Simple average 21.2 17.1 14.7 13.6 13 35 18 13 2 23 18 9 1 15 24 11 9 13 13 13 14
P/E (x) Net profit growth (%) EPS growth (%) Revenue growth (%) ROE (%)

Oct 31, 2016
2
Sector report
Traditional Chinese medicine sector to grow faster than chemical drugs in 2016-20 In 2011-14, the traditional Chinese medicine (TCM) sector grew faster than chemical drugs but slower than biologics. Frost & Suillivan estimates that the segment will continue to expand rapidly and deliver an 8.2% CAGR in sales during 2016-20. In 2015, wholesale revenue for TCM products in China reached approximately Rmb392bn, and accounted for around 32% of the country’s total pharmaceutical market. In terms of sales volume, TCM currently represents around two-thirds of drug sales in China. The faster growth in TCM compared to the conventional drug industry is attributable to: 1) government investment and favorable policies for the healthcare sector; 2) increasing demand for TCM due to the high incidence of chronic diseases; 3) extended applications of Chinese medicines, and; 4) changing consumer perceptions of Chinese medicines.
Figure 1: Breakdown of China’s pharmaceutical market (2011-2020E)
Sources: Frost & Sullivan, GF Securities (Hong Kong)
Favorable government policy support The Chinese government has set TCM as a strategic
priority and has issued supportive policies. Most recently, the State Council issued a formal notice as part of the 13th Five-Year Plan on the development of the TCM industry. Specifically, by 2020, it wants every citizen to be able to enjoy quality TCM services through balanced progress in TCM medical care, scientific research, education and culture. The government will undertake efforts to ensure that for every 1,000 people, there will be 0.55 beds in public TCM hospitals and 0.4 licensed TCM doctors. The State Council encouraged the establishment of a TCM service network that covers both urban and rural areas. Additionally, it called for the protection and industrialization of TCM herbs, as well as innovation in the TCM industry.
Figure 2: Key TCM-related initiatives in the 13th Five-Year Plan
Sources: SATCM, GF Securities (Hong Kong)
473.3 529.7 595.3 646.3 683.6 720.5 748.8 790.1 790.1 878
210.3259.3
314359
391.8423.8 460.4
500.4 542.2580.6
59.475.2
86.2116.7
145.3180.1
225.4258.7
298.7
333.3
0
200
400
600
800
1000
1200
1400
1600
1800
2000
2011 2012 2013 2014 2015 2016E 2017E 2018E 2019E 2020E
Chemical Drug TCM Biologics
Rmb bn, at wholesale level
Development plan Specific action points Target
Enhance TCM primary servicing capabilities Relax entry barriers to TCM services Increase the share of private TCM medical healthcare
institutions by 5% from 2015 to 20% of overall TCM services
Improve TCM services network to cover urban and rural areas Reach 70% TCM service coverage in all community health
service institutions, township hospitals and village clinics.
Ensure equal rights for private and public Chinese medical healthcare institutions
Promote TCM rehabilitation services Improve the function of TCM as emergency and preventive treatments Set up TCM rehabilitation departments in all Class-2 or above
TCM hospitals, 30% of maternal and child health centers, all
community health service institutions, and township hospitals.
50% of village clinics should provide TCM health intervention
services.
Support the development of TCM nursing homes for the elderly
Establish chains of TCM rehabilitaion institutions
Promote inheritance of TCM and other ancient Chinese
medicine
Organize personnel training, conduct scientific research, encourage technological
development and protect of intellectual property
Establish 3-5 international research platforms for TCM.
Develop 8-10 international scientific exchanges.
Establish 50 TCM innovation teams with a total oft 300 leading
scientists.
Accelerate TCM practitioner training Standardization of Chinese medicine residency training Ensure all Chinese medical practitioners possess postgraduate
medical degree with standardized training.
Strengthen TCM apprentice education Establish a national TCM training center and 50 TCM
apprentice education centers.
Nurture TCM culture and promote healthcare-related
tourism
Strengthen the cultural awareness and literacy on TCM Construction of 70 TCM education bases and 30 TCM culture
experience centers.
Promote TCM's core values and cultivate a healthy lifestyle
CAGR 2011-15 2016-20E
Chemical drug 9.6% 5.1%
TCM 16.8% 8.2%
Biologics 25.0% 18.1%
Total 13.2% 8.0%

Oct 31, 2016
3
Sector report
Competitive TCM landscape Traditional Chinese medicine is divided into 1) Chinese patent
medicines, 2) decoction pieces and 3) Chinese herbs. Chinese patent medicines are defined as any Chinese herbal medicine formulated into a finished dose form, while decoction pieces are mainly Chinese herbs that have been processed further. Historically, Chinese patent medicines account for about 50% of all traditional Chinese medicines sold, but decoction pieces now make up an increased share following their faster growth. Sales growth of Chinese patent medicines slowed from 40% in 2012 to 9% in 2014, while sales growth in the decoction pieces market rose from 22% in 2012 to 24% in 2014, based on industry data provided by chyxx. Development of modernized decoction technology such as ultra-fine pulverization has led to continued strong growth in the decoction pieces market.
Figure 3: TCM industry overview
Sources: IMS, GF Securities (Hong Kong)
Low market concentration Currently, the industry remains fragmented with different market
players of various sizes. According the China Association of TCM, there are more than 1,500 Chinese patent medicine manufacturers and 800 decoction pieces manufacturers in China. In terms of market revenue, the top 5 manufacturers of Chinese patent medicines and decoction pieces accounted for approximately 29% and 70% of the respective total revenue in 2013, including many state-owned enterprises.
Figure 4: Annual revenue at TCM companies Figure 5: Market share of top-10 TCM companies
Sources: chyxx, GF Securities (Hong Kong)
The rise of modern TCM Facing tough competition from local manufacturers and potential drug
quality issues, sales growth of Chinese patent medicines and traditional decoction pieces has continued to decline. Amid rising costs, the margins of these TCM players have remained under pressure and profitability has deteriorated. Industry players are expanding into new segments to seek higher growth. The introduction of concentrated Chinese medicine granules (CCMG) in China has created new opportunities for industry players. Over the long term, the market will be consolidated and we expect to see the emergence of several dominant national players.
Chinese patent
medicines, 46%
Decoction pieces,
42%
Chinese herbs ,
12%
traditional
decoction pieces, 41%
modern
decoction pieces (including CCMG),
1%
Rmb10m or below, 91.27%
Rmb10-30m, 3.79%
Rmb30-50m, 1.48%
Rmb50-100m, 1.43%
Rmb100-300m, 1.3%
Rmb300-500m. 0.3%
Rmb500-1bn, 0.23%
Rmb1-5bn, 0.16%
Rmb5bn or above, 0.04%
29%
69%
Chinese patent medicines Decoction pieces

Oct 31, 2016
4
Sector report
Figure 6: Historical and projected sales in the Chinese patent medicine market (2010-19)
Figure 7: Historical and projected sales of decoction pieces market (2010-19)
Sources: chyxx, GF Securities (Hong Kong)
TCM standardization crucial for its modernization The Chinese government has made
significant efforts to promote standardization of TCM in recent years. The aim is to align with practices in western medicine, meaning we could see the implementation of international standards, while TCMs will remain a drug class with unique features.
Figure 8: The national standards on TCM in China
Sources: Ministry of Health, CFDA, GF Securities (Hong Kong)
Evidence-based clinical trials In contrast to chemical drugs whose properties can be elucidated
via precise comparisons with current standards of care, proving the therapeutic value of TCMs is more difficult given its compound nature. The problem is more obvious in decoction TCMs with varying dosages. Despite this challenge, double-blind randomized controlled trials (RCTs) have been performed on various compound TCMs to study their safety and efficacy. Based on expert evaluations, it was found that the proportion of published RCTs in relation to all types of published clinical trials increased from 19% in 1999 to 36% in 2004. Academics generally believe Chinese medicine now has a better PK/PD profile compared with its previous status, but more effort is needed to ensure quality of the trials.
0%
10%
20%
30%
40%
50%
60%
0
50
100
150
200
250
300
350
400
450
2010 2011 2012 2013 2014 2015E 2016E 2017E 2018E 2019E
Revenue YoY %
Rmb bn
0%
10%
20%
30%
40%
50%
60%
70%
0
200
400
600
800
1000
1200
1400
1600
1800
2010 2011 2012 2013 2014 2015 1H16
Decoction pieces (Rmb100m) YoY %
Years A seies of standards
1953 Chinese Pharmacopoeia
1989 Drug Standards of the Ministry of Health (Finished Herbal Products Volume)
1992 Drug Standards of the Ministry of Health (Herbs Volume)
1999 Regulations for New Drug Approval
1999 Good Clinical Practices
1999 Good Laboratory Practices
2000 Good Supply Practices
2001 Good Manufacturing Practices
2002 Good Agriculture Practices
2005 Clinical Medicine Guidelines (Traditional Chinese Medicines Volume)
2010 Clinical Medicine Guidelines (Herbal Material Volume)

Oct 31, 2016
5
Sector report
China TCM (570 HK)
Buy (initiation)
Target price: HK$5.20
Emerging TCM leader
Natalie Chiu SFC CE No. AVH029 [email protected] +852 3760 2030 GF Securities (Hong Kong) Brokerage Limited 29-30/F, Li Po Chun Chambers 189 Des Voeux Road Central Hong Kong
TCM arm of CNPGC China TCM (CTCM) is the TCM arm of China National
Pharmaceutical Group Corporation, Sinopharm’s (1099 HK, NR) parent company. The company produces traditional patent medicine (finished TCMs) and modern Chinese medicine (concentrated TCM granules, or CCMG). It has a diversified finished TCM portfolio with more than 500 prescription and OTC products. In concentrated TCM granules, it is among the top-five CCMG players that together account for 50% of the market.
Becoming vertically integrated Five large acquisitions since 2006 have transformed
CTCM into an integrated TCM conglomerate covering decoction pieces, granules, patent medicines and supplement products. Total revenue and net profit rose at CAGRs of 30.1% and 62.2% respectively during 2007-15. Reform to lead to long-term shareholder value CTCM’s finished drug sales volume
growth and drug prices have come under pressure amid the currently severe market environment. To address pricing pressure, the company aims to: 1) actively adjust its product strategies to alleviate pressure on its finished drug business; 2) accelerate expansion of its concentrated TCM granules business, and; 3) overhaul its sales team. Strategic planning in its CCMG business The concentrated TCM granules market in
China has experienced rapid growth due to its regulated nature. With deregulation expected in the near future, the company has brought forward the integration of Tianjiang Pharma and promoted resource sharing to achieve synergy and improve core competitiveness. Attractive valuation The stock is currently trading at 11.4x 2017E P/E, compared to the
current average of 15x for other TCM manufacturers listed in Hong Kong. As an emerging leader in the TCM space with a faster-than-peers growth outlook, we believe CTCM’s discount to its HK-listed peers should narrow. Our one-year target price of HK$5.20 is based on a target P/E of 15x our 2017 EPS forecast of Rmb0.30 and represents 0.5x PEG. Risks 1) More aggressive price cuts for its key Essential Drug List drugs; 2) Weaker-than-
expected volume growth following tender withdrawals; 3) More intense competition after the CCMG market is liberalized.
Stock valuation
Sources: Company data, GF Securities (Hong Kong)
Turnover
(Rmb m)
Net profit
(Rmb m)
EPS
(Rmb)
EPS YoY
(%)
P/E BPS
(Rmb)
P/B ROE
(%)
2014 2,650 412 0.16 68% 21.2 1.3 2.7 13%
2015 3,709 622 0.17 3% 20.5 3.0 1.1 8%
2016E 6,805 1,150 0.25 51% 13.6 2.7 1.3 9%
2017E 7,930 1,388 0.30 20% 11.4 2.9 1.2 11%
2018E 9,218 1,623 0.35 16% 9.8 3.1 1.1 12%
Stock performance
Source: Bloomberg
Key data
Source: Bloomberg
-40%
-20%
0%
20%
40%
60%
80%
100%
Oct
-14
No
v-1
4
Dec
-14
Jan
-15
Feb
-15
Mar
-15
Ap
r-1
5
May
-15
Jun
-15
Jul-
15
Au
g-1
5
Sep
-15
Oct
-15
No
v-1
5
Dec
-15
Jan
-16
Feb
-16
Mar
-16
Ap
r-1
6
May
-16
Jun
-16
Jul-
16
Au
g-1
6
Sep
-16
570 HK Equity Hang Seng Index
Oct 27 close (HK$) 4.01
Shares in issue (m) 4.43
Major shareholder Sinopharm HK (36%)
Market cap (HK$ bn) 17.903
3M avg. vol. (m) 12.67
52W high/low (HK$) 6.42/2.89

Oct 31, 2016
6
Sector report
Weak finished drug growth amid stringent drug pricing Reimbursement control hurting finished drug sales growth Since 2015, the Chinese
government has deepened healthcare reform with reform of the drug approval process, implementation of the “two-invoice system”, and secondary drug tender policies. While these initiatives have spurred development in the industry, sales growth has slowed from 23% (for finished TCMs) and 24% (for decoction pieces) in 2013 to 8% and 13% respectively in 1H16.
Figure 9: Finished drugs market revenue (2010-1H16) Figure 10: Decoction pieces market revenue (2010-1H16)
Sources: MIIT, GF Securities (Hong Kong)
Finished TCMs under more pricing pressure than overall pharma sector Sales growth of
finished TCMs was only half that of the overall pharma sector during 2015-1H16, due to: 1) the zero-mark up policy aimed at bringing the contribution from drug sales to hospital revenues to 30% by 2017, and; 2) TCM drugs being a common form of complementary medicine leading to more pricing control. Only companies with flexible growth strategies can survive in this dynamic industry environment. CTCM to adjust product strategy in 2016 CTCM has over 500 products (70 of which are national
exclusive products), used for musculoskeletal, respiratory, dermatology and central nervous system problems, as well as infectious and cardiovascular diseases. The Tongjitang acquisition in May 2013 led to rapid growth in finished products in 2014. However, sales growth momentum weakened to 3.8% in 2015 and -20% in 1H16 due to an inventory build-up following the elimination of the second and third layers of distributors under the “two-invoice system”. Inventory rose to four months by the end of 2015 (two months under normal conditions).
Figure 11: CTCM’s top-ten finished products in 2015
Sources: Company data, GF Securities (Hong Kong)
Sales restructuring began at end-2015 Rather than focusing on ex-factory sales, CTCM has
adopted a partner/responsible person system whereby sales are now focused on in-market sales. The company’s conventional marketing line has changed from geography-based to product-based, which includes three business units responsible for selling the seven exclusive Essential Drug List (EDL) products, OTC products and about 60 non-EDL national exclusive products respectively. This provides better financial flexibility allowing them to monitor stock across channels, manage sales planning and performance, and control inventory. The sales revamp should help to unlock product potential and digest inventory at hospitals or OTC channels more quickly, in our view.
0%
5%
10%
15%
20%
25%
0
1000
2000
3000
4000
5000
6000
7000
2010 2011 2012 2013 2014 2015 1H16
Finished TCM (Rmb100m) YoY %
0%
10%
20%
30%
40%
50%
60%
70%
0
200
400
600
800
1000
1200
1400
1600
1800
2010 2011 2012 2013 2014 2015 1H16
Decoction pieces (Rmb100m) YoY %
Drug Name Drug Type Therapeutic Area Indication Sales (Rmb m) YoY %
Xianling Gubao TCM Musculoskeletal Osteoporosis 862.19 1.4%
Yupingfeng Granule TCM Infectious diseases Cold 271.14 8.4%
Jingshu Granule TCM Musculoskeletal Cervical spondylosis 224.91 12.2%
Moisturising & anti-itching Capsule TCM Dermatology 202.50 27.8%
Biyankang Granule TCM Respiratory Rhinitis 168.71 -34.1%
Sheng Tong Ping Chemical Cardiovascular Hypertension 99.51 3.60%
Fengshi Gutong Capsule TCM Musculoskeletal Rheumatoid arthritis 73.67 39.6%
Zaoren Anshen Capsule TCM CNS Insomnia 71.18 22.9%
Feng Liao Xing Medicinal Wine TCM Musculoskeletal Rheumatism 65.94 -19.2%
Gao De Chemical Infectious diseases Bacterial infection 59.33 -31.9%
2015
Oct 31, 2016
7
Sector report
TCM granules sales remain strong, profitability improving Healthy growth for its concentrated TCM granules business In China, concentrated TCM
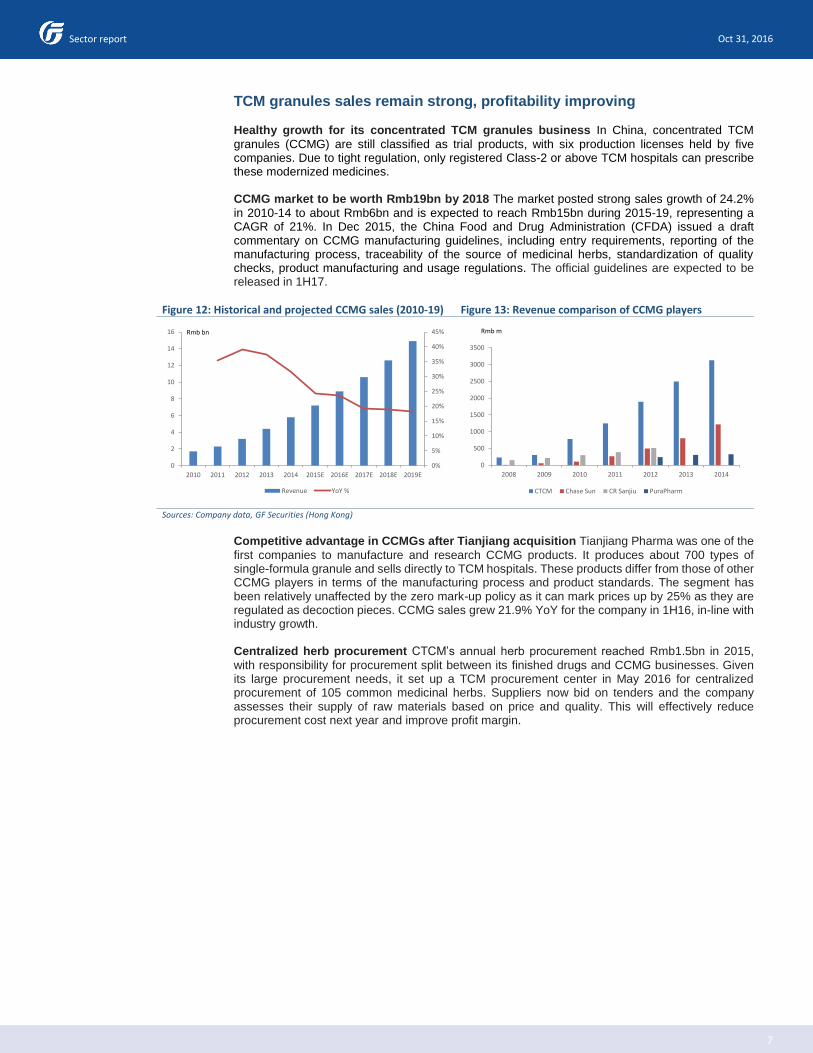
granules (CCMG) are still classified as trial products, with six production licenses held by five companies. Due to tight regulation, only registered Class-2 or above TCM hospitals can prescribe these modernized medicines. CCMG market to be worth Rmb19bn by 2018 The market posted strong sales growth of 24.2%
in 2010-14 to about Rmb6bn and is expected to reach Rmb15bn during 2015-19, representing a CAGR of 21%. In Dec 2015, the China Food and Drug Administration (CFDA) issued a draft commentary on CCMG manufacturing guidelines, including entry requirements, reporting of the manufacturing process, traceability of the source of medicinal herbs, standardization of quality checks, product manufacturing and usage regulations. The official guidelines are expected to be released in 1H17.
Figure 12: Historical and projected CCMG sales (2010-19) Figure 13: Revenue comparison of CCMG players
Sources: Company data, GF Securities (Hong Kong)
Competitive advantage in CCMGs after Tianjiang acquisition Tianjiang Pharma was one of the
first companies to manufacture and research CCMG products. It produces about 700 types of single-formula granule and sells directly to TCM hospitals. These products differ from those of other CCMG players in terms of the manufacturing process and product standards. The segment has been relatively unaffected by the zero mark-up policy as it can mark prices up by 25% as they are regulated as decoction pieces. CCMG sales grew 21.9% YoY for the company in 1H16, in-line with industry growth. Centralized herb procurement CTCM’s annual herb procurement reached Rmb1.5bn in 2015,
with responsibility for procurement split between its finished drugs and CCMG businesses. Given its large procurement needs, it set up a TCM procurement center in May 2016 for centralized procurement of 105 common medicinal herbs. Suppliers now bid on tenders and the company assesses their supply of raw materials based on price and quality. This will effectively reduce procurement cost next year and improve profit margin.
0%
5%
10%
15%
20%
25%
30%
35%
40%
45%
0
2
4
6
8
10
12
14
16
2010 2011 2012 2013 2014 2015E 2016E 2017E 2018E 2019E
Revenue YoY %
Rmb bn
0
500
1000
1500
2000
2500
3000
3500
2008 2009 2010 2011 2012 2013 2014
CTCM Chase Sun CR Sanjiu PuraPharm
Rmb m
Oct 31, 2016
8
Sector report
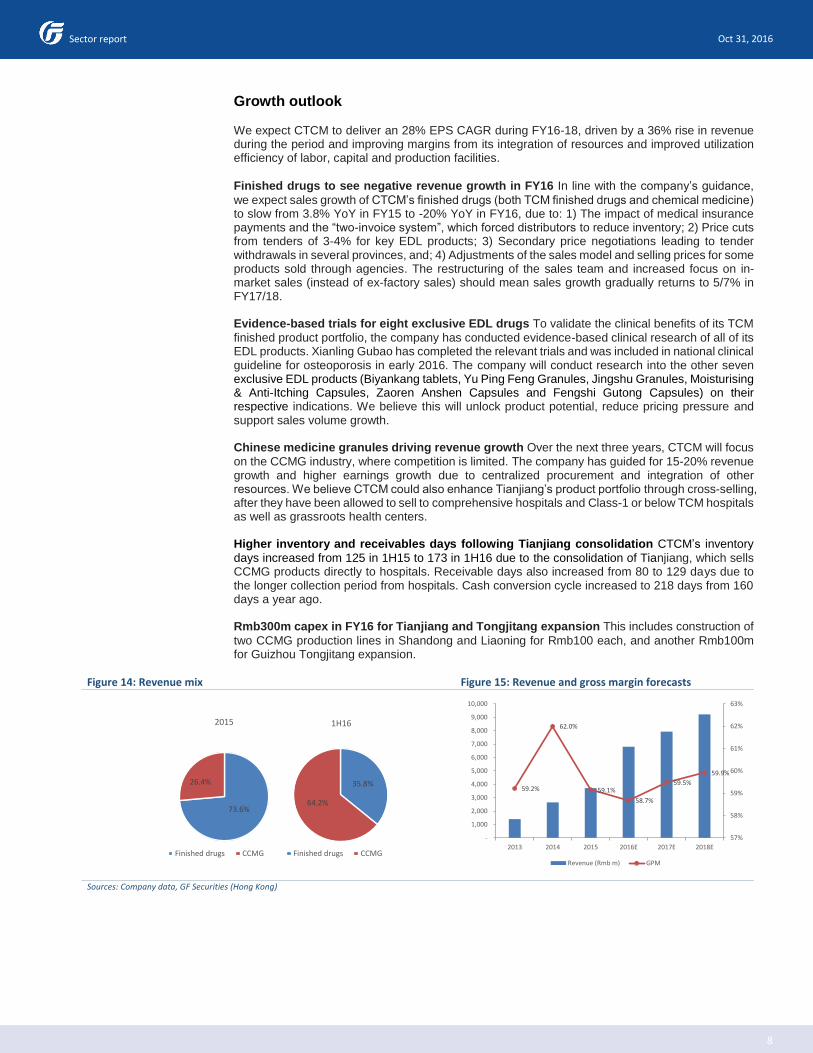
Growth outlook We expect CTCM to deliver an 28% EPS CAGR during FY16-18, driven by a 36% rise in revenue during the period and improving margins from its integration of resources and improved utilization efficiency of labor, capital and production facilities.
Finished drugs to see negative revenue growth in FY16 In line with the company’s guidance,
we expect sales growth of CTCM’s finished drugs (both TCM finished drugs and chemical medicine) to slow from 3.8% YoY in FY15 to -20% YoY in FY16, due to: 1) The impact of medical insurance payments and the “two-invoice system”, which forced distributors to reduce inventory; 2) Price cuts from tenders of 3-4% for key EDL products; 3) Secondary price negotiations leading to tender withdrawals in several provinces, and; 4) Adjustments of the sales model and selling prices for some products sold through agencies. The restructuring of the sales team and increased focus on in-market sales (instead of ex-factory sales) should mean sales growth gradually returns to 5/7% in FY17/18. Evidence-based trials for eight exclusive EDL drugs To validate the clinical benefits of its TCM
finished product portfolio, the company has conducted evidence-based clinical research of all of its EDL products. Xianling Gubao has completed the relevant trials and was included in national clinical guideline for osteoporosis in early 2016. The company will conduct research into the other seven exclusive EDL products (Biyankang tablets, Yu Ping Feng Granules, Jingshu Granules, Moisturising & Anti-Itching Capsules, Zaoren Anshen Capsules and Fengshi Gutong Capsules) on their respective indications. We believe this will unlock product potential, reduce pricing pressure and support sales volume growth. Chinese medicine granules driving revenue growth Over the next three years, CTCM will focus
on the CCMG industry, where competition is limited. The company has guided for 15-20% revenue growth and higher earnings growth due to centralized procurement and integration of other resources. We believe CTCM could also enhance Tianjiang’s product portfolio through cross-selling, after they have been allowed to sell to comprehensive hospitals and Class-1 or below TCM hospitals as well as grassroots health centers. Higher inventory and receivables days following Tianjiang consolidation CTCM’s inventory
days increased from 125 in 1H15 to 173 in 1H16 due to the consolidation of Tianjiang, which sells CCMG products directly to hospitals. Receivable days also increased from 80 to 129 days due to the longer collection period from hospitals. Cash conversion cycle increased to 218 days from 160 days a year ago. Rmb300m capex in FY16 for Tianjiang and Tongjitang expansion This includes construction of
two CCMG production lines in Shandong and Liaoning for Rmb100 each, and another Rmb100m for Guizhou Tongjitang expansion.
Figure 14: Revenue mix Figure 15: Revenue and gross margin forecasts
Sources: Company data, GF Securities (Hong Kong)
73.6%
26.4%
2015
Finished drugs CCMG
35.8%
64.2%
1H16
Finished drugs CCMG
59.2%
62.0%
59.1%
58.7%
59.5%
59.9%
57%
58%
59%
60%
61%
62%
63%
-
1,000
2,000
3,000
4,000
5,000
6,000
7,000
8,000
9,000
10,000
2013 2014 2015 2016E 2017E 2018E
Revenue (Rmb m) GPM

Oct 31, 2016
9
Sector report
Figure 16: Operating profit and OPM forecasts Figure 17: Net profit and net margin forecasts
Sources: Company data, GF Securities (Hong Kong
Valuation Our one-year target price of HK$5.20 implies 30% upside, represents 0.5x PEG, and is based on a target P/E of 15x our 2017 EPS forecast of Rmb0.30, compared to the current average of 15x for other Chinese medicines manufacturers listed in Hong Kong. As the leading TCM manufacturer, we believe CTCM’s discount to its HK-listed peers should narrow. Concerns about slowing growth in the finished TCM industry have led to de-rating since mid-2015.
Figure 18: P/E band
Sources: Bloomberg
19%
19%
20%
20%
21%
21%
22%
22%
-
500
1,000
1,500
2,000
2,500
2013 2014 2015 2016E 2017E 2018E
Operating profit OPM
Rmb m
0%
2%
4%
6%
8%
10%
12%
14%
16%
18%
20%
-
200
400
600
800
1,000
1,200
1,400
1,600
1,800
2,000
2013 2014 2015 2016E 2017E 2018E
Net profit NPM
Rmb m
1
2
3
4
5
6
7
8
9
Share Price 11x 18x 21x 24x 27x
Oct 31, 2016
10
Sector report
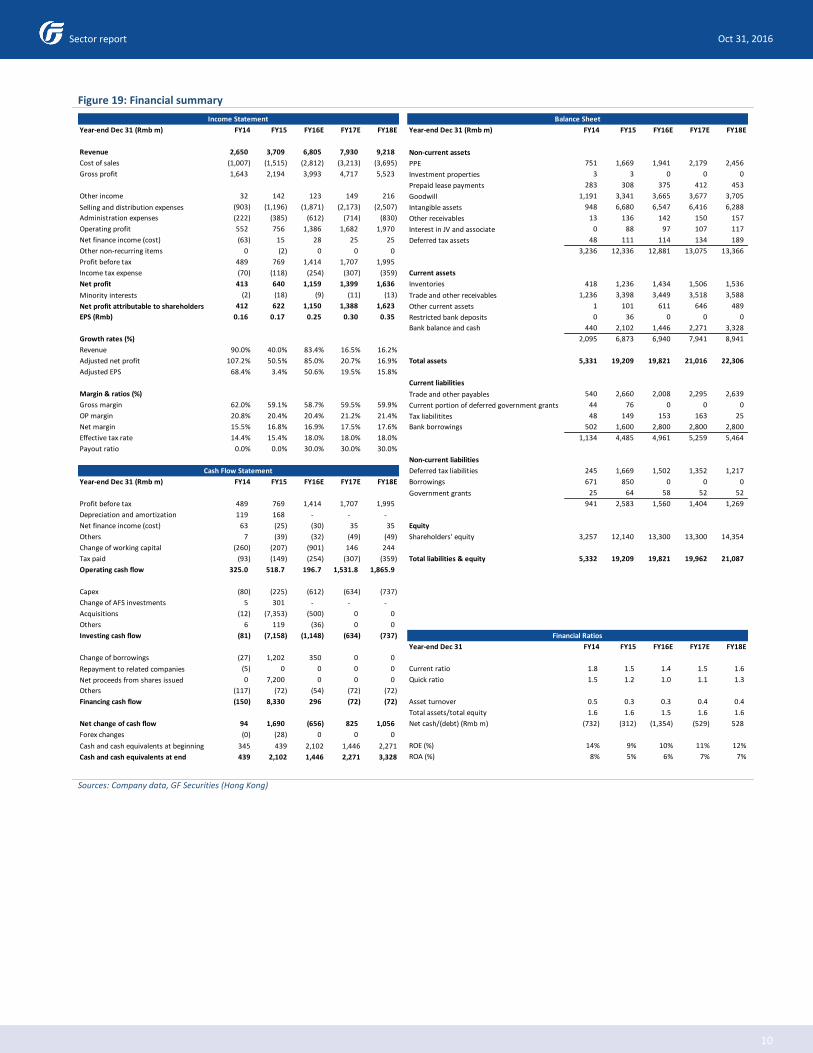
Figure 19: Financial summary
Sources: Company data, GF Securities (Hong Kong)
Year-end Dec 31 (Rmb m) FY14 FY15 FY16E FY17E FY18E Year-end Dec 31 (Rmb m) FY14 FY15 FY16E FY17E FY18E
Revenue 2,650 3,709 6,805 7,930 9,218 Non-current assets
Cost of sales (1,007) (1,515) (2,812) (3,213) (3,695) PPE 751 1,669 1,941 2,179 2,456
Gross profit 1,643 2,194 3,993 4,717 5,523 Investment properties 3 3 0 0 0
Prepaid lease payments 283 308 375 412 453
Other income 32 142 123 149 216 Goodwill 1,191 3,341 3,665 3,677 3,705
Selling and distribution expenses (903) (1,196) (1,871) (2,173) (2,507) Intangible assets 948 6,680 6,547 6,416 6,288
Administration expenses (222) (385) (612) (714) (830) Other receivables 13 136 142 150 157
Operating profit 552 756 1,386 1,682 1,970 Interest in JV and associate 0 88 97 107 117
Net finance income (cost) (63) 15 28 25 25 Deferred tax assets 48 111 114 134 189
Other non-recurring items 0 (2) 0 0 0 3,236 12,336 12,881 13,075 13,366
Profit before tax 489 769 1,414 1,707 1,995
Income tax expense (70) (118) (254) (307) (359) Current assets
Net profit 413 640 1,159 1,399 1,636 Inventories 418 1,236 1,434 1,506 1,536
Minority interests (2) (18) (9) (11) (13) Trade and other receivables 1,236 3,398 3,449 3,518 3,588
Net profit attributable to shareholders 412 622 1,150 1,388 1,623 Other current assets 1 101 611 646 489
EPS (Rmb) 0.16 0.17 0.25 0.30 0.35 Restricted bank deposits 0 36 0 0 0
Bank balance and cash 440 2,102 1,446 2,271 3,328
Growth rates (%) 2,095 6,873 6,940 7,941 8,941
Revenue 90.0% 40.0% 83.4% 16.5% 16.2%
Adjusted net profit 107.2% 50.5% 85.0% 20.7% 16.9% Total assets 5,331 19,209 19,821 21,016 22,306
Adjusted EPS 68.4% 3.4% 50.6% 19.5% 15.8%
Current liabilities
Margin & ratios (%) Trade and other payables 540 2,660 2,008 2,295 2,639
Gross margin 62.0% 59.1% 58.7% 59.5% 59.9% Current portion of deferred government grants 44 76 0 0 0
OP margin 20.8% 20.4% 20.4% 21.2% 21.4% Tax liabilitites 48 149 153 163 25
Net margin 15.5% 16.8% 16.9% 17.5% 17.6% Bank borrowings 502 1,600 2,800 2,800 2,800
Effective tax rate 14.4% 15.4% 18.0% 18.0% 18.0% 1,134 4,485 4,961 5,259 5,464
Payout ratio 0.0% 0.0% 30.0% 30.0% 30.0%
Non-current liabilities
Deferred tax liabilities 245 1,669 1,502 1,352 1,217
Year-end Dec 31 (Rmb m) FY14 FY15 FY16E FY17E FY18E Borrowings 671 850 0 0 0
Government grants 25 64 58 52 52
Profit before tax 489 769 1,414 1,707 1,995 941 2,583 1,560 1,404 1,269
Depreciation and amortization 119 168 - - -
Net finance income (cost) 63 (25) (30) 35 35 Equity
Others 7 (39) (32) (49) (49) Shareholders' equity 3,257 12,140 13,300 13,300 14,354
Change of working capital (260) (207) (901) 146 244
Tax paid (93) (149) (254) (307) (359) Total liabilities & equity 5,332 19,209 19,821 19,962 21,087
Operating cash flow 325.0 518.7 196.7 1,531.8 1,865.9
Capex (80) (225) (612) (634) (737)
Change of AFS investments 5 301 - - -
Acquisitions (12) (7,353) (500) 0 0
Others 6 119 (36) 0 0
Investing cash flow (81) (7,158) (1,148) (634) (737)
Year-end Dec 31 FY14 FY15 FY16E FY17E FY18E
Change of borrowings (27) 1,202 350 0 0
Repayment to related companies (5) 0 0 0 0 Current ratio 1.8 1.5 1.4 1.5 1.6
Net proceeds from shares issued 0 7,200 0 0 0 Quick ratio 1.5 1.2 1.0 1.1 1.3
Others (117) (72) (54) (72) (72)
Financing cash flow (150) 8,330 296 (72) (72) Asset turnover 0.5 0.3 0.3 0.4 0.4
Total assets/total equity 1.6 1.6 1.5 1.6 1.6
Net change of cash flow 94 1,690 (656) 825 1,056 Net cash/(debt) (Rmb m) (732) (312) (1,354) (529) 528
Forex changes (0) (28) 0 0 0
Cash and cash equivalents at beginning 345 439 2,102 1,446 2,271 ROE (%) 14% 9% 10% 11% 12%
Cash and cash equivalents at end 439 2,102 1,446 2,271 3,328 ROA (%) 8% 5% 6% 7% 7%
Income Statement Balance Sheet
Cash Flow Statement
Financial Ratios

Oct 31, 2016
11
Sector report
Kingworld Medicines (1110 HK)
Buy (initiation)
Target price: HK$1.80
Beneficiary of rising demand for health supplements in China
Natalie Chiu SFC CE No. AVH029 [email protected] +852 3760 2030 GF Securities (Hong Kong) Brokerage Limited 29-30/F, Li Po Chun Chambers 189 Des Voeux Road Central Hong Kong
Kingworld is a Chinese proprietary medicine and health supplement distributor in southern China The company distributes Hong Kong and overseas’ OTC and other
healhcare products and sells via distributors in south and southeastern China. It has a network of about 200,000 drug retailers and benefits from close relationships with distributors. Strong market capabilities and product selectivity offers above-peer profitability and revenue growth Kingworld posted revenue and gross profit CAGRs of 13% and 31%
respectively in 2013-15 and had a gross margin of 31.8% in 2015. This was attributable to its focus on selling high-margin products (e.g. distribution of foreign healthcare supplements in eastern and southern China, which carry a gross margin of about 60% vs the industry average of 30%). Sound growth strategy, active marketing and close distributor partnerships
Kingworld aims to: 1) expand its high-GM product offerings; 2) increase online sales, and; 3) penetrate into lower-tier cities. With a successful track record of product marketability, we expect Kingworld to continue to grow faster than the industry average in 2016-18 with improved profitability through a better product mix and superior operating efficiency. We project a CAGR of 23% and 42% for revenue and earnings respectively in 2016-18. Compelling valuation offers near-term upside Our target price of HK$1.80 represents
13x our 2017 diluted EPS estimate. The stock is trading at 11x our 2017 EPS estimate, a 27% discount to its peer group average of 15x. We believe early signs of growth acceleration will narrow this valuation discount. Risks: 1) Failure to renew distribution rights and registration certificates; 2) early
termination of distribution agreements with Nin Jiom Pei Pa Koa if guaranteed sales volume is not achieved; 3) damage to products’ brand image due to quality issues or aggressive discounts.
Stock valuation
Sources: Company data, GF Securities (Hong Kong)
Turnover
(Rmb m)
Net profit
(Rmb m)
EPS
(Rmb)
EPS YoY
(%)
P/E BPS
(Rmb)
P/B ROE
(%)
2014 660 38 0.06 -20% 19.6 1.6 0.7 4%
2015 714 31 0.05 -18% 25.1 1.7 0.7 3%
2016E 1,004 56 0.08 79% 14.5 1.8 0.7 5%
2017E 1,200 84 0.12 50% 9.8 2.0 0.6 6%
2018E 1,398 107 0.15 28% 7.7 2.2 0.5 7%
Stock performance
Source: Bloomberg
Key data
Source: Bloomberg
-50%
-40%
-30%
-20%
-10%
0%
10%
20%
30%
40%
Oct
-14
No
v-1
4
Dec
-14
Jan
-15
Feb
-15
Mar
-15
Ap
r-1
5
May
-15
Jun
-15
Jul-
15
Au
g-1
5
Sep
-15
Oct
-15
No
v-1
5
Dec
-15
Jan
-16
Feb
-16
Mar
-16
Ap
r-1
6
May
-16
Jun
-16
Jul-
16
Au
g-1
6
Sep
-16
1110 HK Equity Hang Seng Index
Oct 27 close (HK$) 1.38
Shares in issue (m) 623
Major shareholder Zhao Li Sheng (47.84%)
Market cap (HK$ bn) 0.87
3M avg. vol. (m) 0.12
52W high/low (HK$) 1.945/1.13

Oct 31, 2016
12
Sector report
Retail pharmacies offer stronger growth outlook than hospitals China’s over-the-counter market reached Rmb1.8bn in 2015 Revenue growth in the over-the-
counter (OTC) market (+8.9% YoY) overtook the prescription market (+7.4% YoY) in 2015 due to government healthcare budget controls and more restrained use of medicines by doctors, and will be supported by 1) a demand shift from prescription to OTC drugs as the government tries to reduce healthcare spending and free up hospital capacity by encouraging self-diagnosis for non-serious conditions, and 2) overall pharmaceutical industry growth due to an increasingly aging population, rising GDP per capita and urbanization.
Figure 20: Revenue in China’s OTC and prescription drug markets (2012-15)
Sources: IMS, GF Securities (Hong Kong)
Retail pharmacies and community health centers driving growth in the OTC market China’s
OTC drugs are sold via three main channels (hospitals, retail pharmacies and community health centers). Retail pharmacies and community health centers posted faster growth than hospitals in 2015 with sales growth of 11.6% and 11.1% YoY respectively.
Figure 21: Drug sales by channel in Beijing (2014-15) Figure 22: Revenue growth at major drug channels in China (2013-15)
Sources: IMS, GF Securities (Hong Kong)
Finished Chinese medicine represents over 60% of all retail pharmacies sales Although
overall finished Chinese medicine wholesale revenue growth slowed significantly from 13.1% YoY in 2014 to 5.7% YoY in 2015, we believe much of the slowdown is from sales to hospitals. This is evident in Beijing’s drug market, where sales growth of finished Chinese medicines and OTC drugs was 12.9% YoY and 8.5% YoY respectively in 2015.
0%
2%
4%
6%
8%
10%
12%
14%
16%
18%
20%
0
200
400
600
800
1000
1200
1400
2012 2013 2014 2015
OTC Rx OTC YoY Rx YoY
Rmb bn
70%
16%
14%
Hospitals Retail pharmacies Community health centers
13.40%11.70%
5.00%
9.50%
6.90%
8.30%
13.80% 15.60%
13.10%
0%
2%
4%
6%
8%
10%
12%
14%
16%
18%
2013% 2014 2015
Hospitals Retail pharmacies Community health centers

Oct 31, 2016
13
Sector report
Figure 23: Channel mix and revenue growth in Beijing’s pharma market (2014-15)
Figure 24: Channel mix and revenue growth in Beijing’s finished TCM market (2014-15)
Sources: IMS, GF Securities (Hong Kong)
Figure 25: Channel mix and revenue growth in Beijing’s OTC drug market (2014-15)
Sources: IMS, GF Securities (Hong Kong)
Proprietary Chinese medicine distribution market grew at a CAGR of 16.8% to Rmb392bn in 2011-15 Finished Chinese medicine can be classified into: 1) proprietary Chinese medicines, which
are exclusive formulas protected by the government, and 2) common TCM. Based on Euromonitor estimates, the proprietary Chinese medicine market in China is expected to grow at a CAGR of 17% during 2016-20.
Figure 26: Proprietary Chinese medicine market
Sources: Euromonitor, GF Securities (Hong Kong)
Local companies represent 86% of the OTC market in China, and finished TCM companies account for 50% The top-ten manufacturers/importers of OTC and healthcare supplement products
in China account for 26% of the market. By-Health (300146 CH) is the biggest OTC and health supplement player and Dong-E E-Jiao’s (000423 CH) E-Jiao is the best-selling product.
0.00%
2.00%
4.00%
6.00%
8.00%
10.00%
12.00%
14.00%
16.00%
0%
20%
40%
60%
80%
100%
120%
2014 2015
Hospitals Retail pharmacies
Community health centers Hospitals YoY
Retail pharmacies YoY Community health centers YoY
0%
2%
4%
6%
8%
10%
12%
14%
0%
20%
40%
60%
80%
100%
120%
2014 2015
Hospitals Retail pharmacies
Community health centers Retail pharmacies YoY
0%
1%
2%
3%
4%
5%
6%
7%
8%
9%
0%
20%
40%
60%
80%
100%
120%
2014 2015
Hospitals Retail pharmacies
Community health centers Retail pharmacies YoY
33.8%
33.8%
21.6%20.3%
19.2% 18.3% 17.4%16.2%
15.1%
0%
5%
10%
15%
20%
25%
30%
35%
40%
0
200,000
400,000
600,000
800,000
1,000,000
1,200,000
1,400,000
1,600,000
1,800,000
2010 2011 2012 2013 2014 2015 2016E 2017E 2018E 2019E
Retail sales value (Rmb m) YoY %

Oct 31, 2016
14
Sector report
Figure 27: Top-10 OTC and healthcare supplement product companies in China
Figure 28: Top-10 OTC and healthcare supplement products in China
Sources: IMS, GF Securities (Hong Kong)
Greater growth potential in lower-tier cities Sales growth at retail pharmacies in first and second-
tier cities has slowed since 2014, while third and fourth-tier cities have seen faster growth both in terms of sales value and volume. Sales growth in top tier cities is driven by price hikes from product upgrade, while in lower tier cities sales are driven by urbanization and the upgrading of infrastructure in these less-accessed markets.
Selective product sourcing to drive growth Quality portfolio of 60 products Kingworld was set up in 1996 and began by signing three major
distribution agreements with Tai San Enterprise, Nin Jiom Medicine and Great Pleasure, and Etta Trading, which supplies the best-selling proprietary Chinese medicines and health supplements in Hong Kong. Since then it has expanded its product portfolio and currently manages 60 products used for cough and phlegm relief, vitamins, and gastrointestinal, orthopedic, cardiovascular and influenza issues. These include 12 pharmaceutical products, seven healthcare products, 28 general foodstuffs and two medical products, and are manufactured in Japan, Canada, Hong Kong, Taiwan, Thailand and mainland China and sourced from 13 different suppliers.
Figure 29: Kingworld’s revenue mix
Sources: Company data, GF Securities (Hong Kong)
Stable relationship with suppliers Kingworld has maintained stable relationships with its five
largest suppliers for periods of between 10-20 years. Nin Jiom Pei Pa Koa was introduced to the company by Kingworld’s chairman, Zhao Li Sheng, as he believed there was a potential market for the product in mainland China. Mr Zhao secured the distribution rights of Nin Jiom Pei Pa Koa for Kingworld in 1997. In Apr 2010, before listing, Kingworld entered into a written three-year distribution agreement with the manufacturer and supplier of Nin Jiom Pei Pa Koa to sell the product in 14 regions in China. The agreement has been renewed twice, most recently in 1H16.
Rank OTC and health supplement company
1 BY-Health
2 Dong-E E-Jiao
3 Wyeth
4 Bayer Healthcare
5 Yunnan Baiyao
6 Xi'an Janssen Pharm
7 Jiangsxi Huiren
8 Xiuzheng Pharm
9 Fupai E-jiao
10 Nin Jiom Medicine
Rank Product Manufacturer Drug type
1 E-Jiao Dong-E E-Jiao TCM
2 Caltrate Wyeth Chemical
3 Kidney treasure tablets Jiangsxi Huiren TCM
4 E-Jiao Fupai E-jiao TCM
5 Hong Mao Medicinal Wine Hong Mao pharma TCM
6 Nin Jiom Pei Pa Koa Nin Jiom Medicine TCM
7 Compound E Jiao Jiang Dong-E E-Jiao TCM
8 Shujin Jinyao Wan Guangzhou Chenliji TCM
9 BY-Health protein powder BY-Health Chemical
10 Centrum Wyeth Chemical
Nin Jiom Chuan Bei Pei Pa series,
80.39%
Culturelle probiotic series, 3.94%
Taiko Seirogan,
9.63%
Others, 2.26%Mentholatum Menthol
Cream, 3.78%
2014
Nin Jiom Chuan Bei Pei Pa series,
45.69%
Culturelle probiotic
series, 13%Flying Eagle Wood Lok Medicated Oil,
5.87%
Taiko Seirogan, 6.96%
Others, 22.26%
Imada Red Flower Oil, 1.87%
Mentholatum Menthol Cream,
4.35%
2015
Oct 31, 2016
15
Sector report
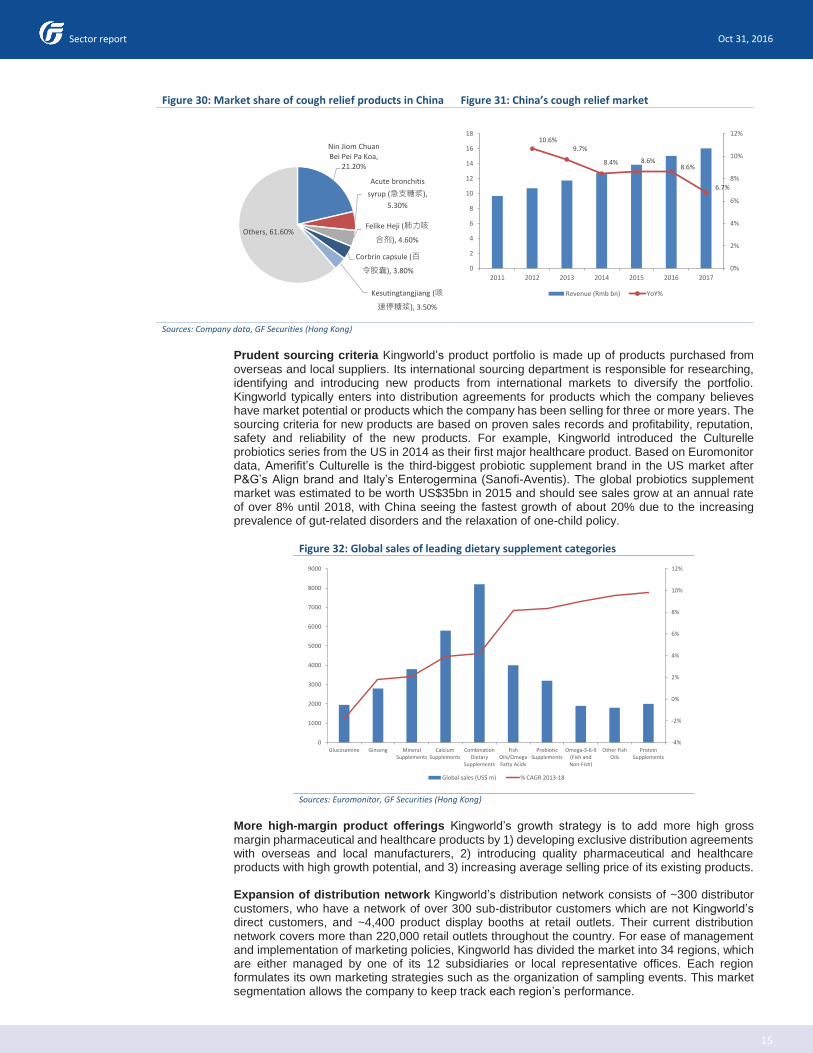
Figure 30: Market share of cough relief products in China Figure 31: China’s cough relief market
Sources: Company data, GF Securities (Hong Kong)
Prudent sourcing criteria Kingworld’s product portfolio is made up of products purchased from
overseas and local suppliers. Its international sourcing department is responsible for researching, identifying and introducing new products from international markets to diversify the portfolio. Kingworld typically enters into distribution agreements for products which the company believes have market potential or products which the company has been selling for three or more years. The sourcing criteria for new products are based on proven sales records and profitability, reputation, safety and reliability of the new products. For example, Kingworld introduced the Culturelle probiotics series from the US in 2014 as their first major healthcare product. Based on Euromonitor data, Amerifit’s Culturelle is the third-biggest probiotic supplement brand in the US market after P&G’s Align brand and Italy’s Enterogermina (Sanofi-Aventis). The global probiotics supplement market was estimated to be worth US$35bn in 2015 and should see sales grow at an annual rate of over 8% until 2018, with China seeing the fastest growth of about 20% due to the increasing prevalence of gut-related disorders and the relaxation of one-child policy.
Figure 32: Global sales of leading dietary supplement categories
Sources: Euromonitor, GF Securities (Hong Kong)
More high-margin product offerings Kingworld’s growth strategy is to add more high gross
margin pharmaceutical and healthcare products by 1) developing exclusive distribution agreements with overseas and local manufacturers, 2) introducing quality pharmaceutical and healthcare products with high growth potential, and 3) increasing average selling price of its existing products. Expansion of distribution network Kingworld’s distribution network consists of ~300 distributor
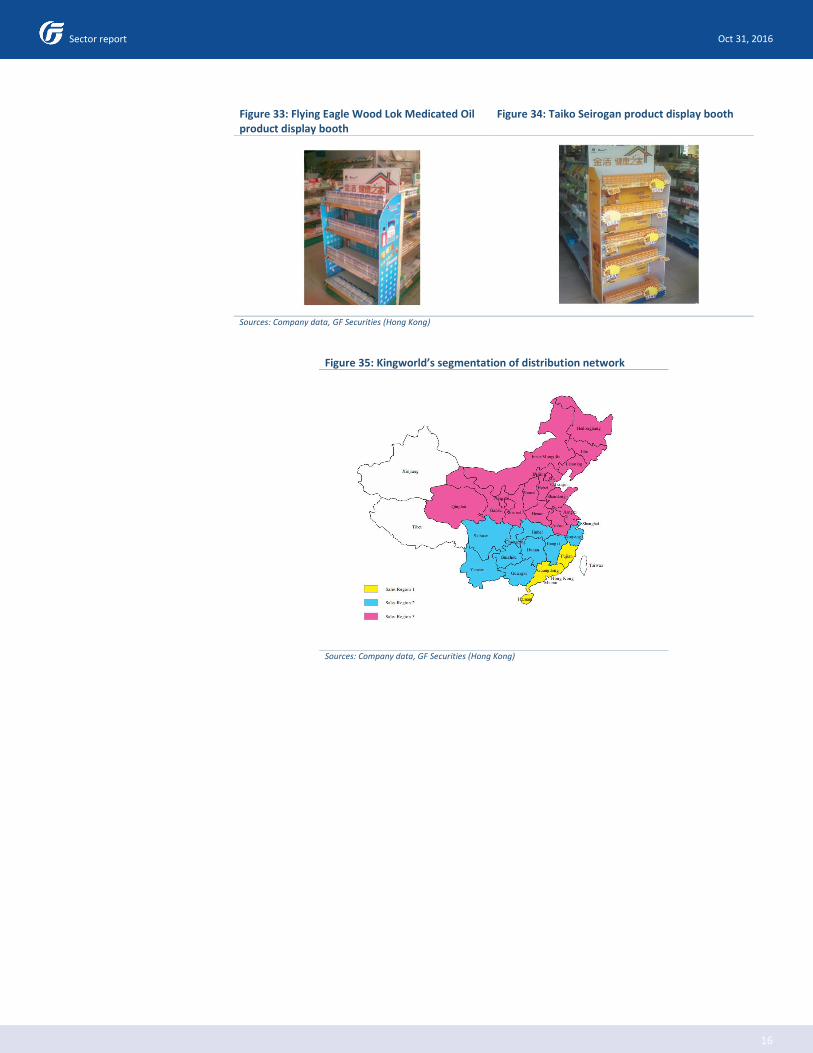
customers, who have a network of over 300 sub-distributor customers which are not Kingworld’s direct customers, and ~4,400 product display booths at retail outlets. Their current distribution network covers more than 220,000 retail outlets throughout the country. For ease of management and implementation of marketing policies, Kingworld has divided the market into 34 regions, which are either managed by one of its 12 subsidiaries or local representative offices. Each region formulates its own marketing strategies such as the organization of sampling events. This market segmentation allows the company to keep track each region’s performance.
Nin Jiom Chuan Bei Pei Pa Koa,
21.20%
Acute bronchitis
syrup (急支糖浆),
5.30%
Felike Heji (肺力咳
合剂), 4.60%
Corbrin capsule (百
令胶囊), 3.80%
Kesutingtangjiang (咳
速停糖浆), 3.50%
Others, 61.60%
10.6%9.7%
8.4% 8.6%8.6%
6.7%
0%
2%
4%
6%
8%
10%
12%
0
2
4
6
8
10
12
14
16
18
2011 2012 2013 2014 2015 2016 2017
Revenue (Rmb bn) YoY%
-4%
-2%
0%
2%
4%
6%
8%
10%
12%
0
1000
2000
3000
4000
5000
6000
7000
8000
9000
Glucosamine Ginseng MineralSupplements
CalciumSupplements
CombinationDietary
Supplements
FishOils/OmegaFatty Acids
ProbioticSupplements
Omega-3-6-9(Fish andNon-Fish)
Other FishOils
ProteinSupplements
Global sales (US$ m) % CAGR 2013-18
Oct 31, 2016
16
Sector report
Figure 33: Flying Eagle Wood Lok Medicated Oil product display booth
Figure 34: Taiko Seirogan product display booth
Sources: Company data, GF Securities (Hong Kong)
Figure 35: Kingworld’s segmentation of distribution network
Sources: Company data, GF Securities (Hong Kong)

Oct 31, 2016
17
Sector report
Growth outlook We expect Kingworld Medicines to deliver CAGRs of 48% in EPS and 25% in revenue during FY16-18, driven by its expanding retail and distribution network and greater number of high-margin product offerings. Sustainable gross margin improvement supported by launch of higher-margin products The
company has actively adjusted its product mix by distributing high margin OTC and healthcare products. Overall GM improved from 23.7% in 2014 to 33% in 1H16, driven by improved sales of high-margin products such as the Culturelle probiotics series and Flying Eagle Wood Lok Medicated Oil. We expect margin expansion to continue driven by a better product mix.
Figure 36: Sales of Kingworld’s high-margin products increasing
Sources: Company data, GF Securities (Hong Kong)
License renewal of Nim Jiom Pei Pa Koa in April 2016 The Imported Drug Registration Certificate
and the Pharmaceutical Product Registration Certificate were issued and approved by the CFDA, with a validity period of five years. For Nim Joim Pei Pa Koa, the expiry date of the Pharmaceutical Product Registration Certificate was March 2015 and product sales were affected during the renewal process. In 2015, revenue from Nim Jiom reached Rmb290m, down 40% from 2014. It booked Rmb230m in 1H16 and is on track to post Rmb575m in revenue in 2016, based on its 40/60% conventional yearly split. Lower costs in online pharmacy Kingworld gained access to an e-commerce platform in 2015
and built an online sales network to distribute its pharmaceutical and healthcare products. It opens online stores that 1) are commercially attractive, 2) have a good reputation, and are 3) within their target group and industry, such as professional retail channels related to maternity and babies. In 1H16, online sales reached Rmb39m and contributed 9% of revenue. We believe the surge in online pharmacy sales will help to improve margins and increase sales by diverting customer traffic away from traditional brick-and-mortar drugstores, especially in second and third-tier cities. Strategic cooperation with Sinopharm Capital Sinopharm Capital, a sister company of
Sinopharm Holdings (1099 HK, NR), became a strategic investor in Kingworld Medicines in Sept 2014 with the purchase of a 9.99% stake and HK$134m worth of convertible bonds which can be converted into shares at HK$2.15/share. Both parties extended the conversion period from 18 months to 36 months, ending in Dec 2017, and the annual interest rate was reduced from 7.4% to 5.0%. We believe Sinopharm Capital’s involvement is positive for Kingworld, as it could leverage Sinopharm’s resource network to distribute its products and pursue a more aggressive M&A strategy.
0%
10%
20%
30%
40%
50%
60%
70%
>50% 30-50% 20-30% 10-20%
1H16
Kingworld GM: 33%
0%
10%
20%
30%
40%
50%
60%
70%
80%
90%
>50% 30-50% 20-30% 10-20%
2014
Kingworld GM: 23.7%

Oct 31, 2016
18
Sector report
Figure 37: Kingworld’s pharmaceutical business Figure 38: Kingworld’s healthcare business
Sources: Company data, GF Securities (Hong Kong)
Figure 39: Kingworld’s margins Figure 40: Revenue mix by business segment (1H16)
Sources: Company data, GF Securities (Hong Kong)
Valuation Our one-year target price of HK$1.80 implies 22% upside and is based on a target P/E of 13x our 2017 EPS forecast of Rmb0.12, compared to the current average of 15x for its HK-listed peers. The stock is currently trading at 10.5x our 2017 EPS forecast. Concerns about the company’s slowing product sales growth have led to de-rating since mid-2015. We believe early signs of growth acceleration in 2016 will narrow the valuation discount to its peers.
Figure 41: P/E band
Sources: Bloomberg
-40%
-30%
-20%
-10%
0%
10%
20%
30%
40%
50%
0
100
200
300
400
500
600
700
800
2013 2014 2015 2016E 2017E 2018E
Pharmaceutical products revenue (Rmb m) YoY growth
0%
20%
40%
60%
80%
100%
120%
140%
160%
180%
0
50
100
150
200
250
300
350
400
450
500
2013 2014 2015 2016E 2017E 2018E
Healthcare products revenue (Rmb m) YoY growth
31.8%33.3%
34.5% 35.3% 36.1%
6.9%
9.6%11.2% 12.0%
13.2%
4.4%5.6%
7.0% 7.7% 8.6%
0.0%
5.0%
10.0%
15.0%
20.0%
25.0%
30.0%
35.0%
40.0%
2014 2015 2016E 2017E 2018E
Gross margin Operating margin Net margin
Pharmaceutical
products61%
Healthcare
products19%
Medical devices
20%
0.5
0.7
0.9
1.1
1.3
1.5
1.7
1.9
2.1
2.3
2.5
2.7
2.9
10
/20
14
11
/20
14
12
/20
14
01
/20
15
02
/20
15
03
/20
15
04
/20
15
05
/20
15
06
/20
15
07
/20
15
08
/20
15
09
/20
15
10
/20
15
11
/20
15
12
/20
15
01
/20
16
02
/20
16
03
/20
16
04
/20
16
05
/20
16
06
/20
16
07
/20
16
08
/20
16
09
/20
16
10x 13x 16x 19x 22x Share Price

Oct 31, 2016
19
Sector report
Figure 42: Financial summary
Sources: Company data, GF Securities (Hong Kong)
Year-end Dec 31 (Rmb m) FY14 FY15 FY16E FY17E FY18E Year-end Dec 31 (Rmb m) FY14 FY15 FY16E FY17E FY18E
Revenue 660 714 1,004 1,200 1,398 Non-current assets
Cost of sales (504) (487) (670) (786) (904) PPE 5 16 21 27 34
Gross profit 156 227 334 414 493 Investment properties 92 108 129 155 186
Interest in a joint venture 45 63 68 74 81
Other income 27 10 30 36 42 Goodwill 0 91 91 91 91
Selling and distribution expenses (88) (119) (178) (208) (242) Intangible assets 0 116 215 187 155
Administration expenses (46) (69) (90) (108) (126) Other receivables 75 75 99 104 109
Operating profit 49 49 96 134 168 Available for sales investments 0 10 17 19 21
Net finance income (cost) (7) (16) (5) (7) (7) 218 478 640 657 676
Other non-recurring items 6 18 5 6 7
Profit before tax 49 51 97 133 167 Current assets
Income tax expense (11) (12) (21) (29) (37) Inventories 70 79 96 112 129
Net profit 38 39 76 104 130 Trade and other receivables 418 287 335 400 466
Minority interests 0 (8) (20) (20) (23) Other current assets 0 105 87 92 93
Net profit attributable to shareholders 38 31 56 84 107 Restricted bank deposits 84 0 0 0 0
EPS (Rmb) 0.06 0.05 0.08 0.12 0.15 Bank balance and cash 230 132 132 190 279
802 604 649 794 967
Growth rates (%)
Revenue 19.0% 8.1% 40.7% 19.5% 16.5% Total assets 1,019 1,082 1,289 1,451 1,643
Adjusted net profit -19.7% -17.6% 78.9% 49.8% 28.0%
Adjusted EPS -19.9% -21.9% 73.3% 48.3% 26.7% Current liabilities
Trade and other payables 186 159 167 197 226
Margin & ratios (%) Other financial l iabil ity 7 21 20 20 0
Gross margin 23.7% 31.8% 33.3% 34.5% 35.3% Tax liabilitites 13 17 19 47 61
OP margin 7.5% 6.9% 9.6% 11.2% 12.0% Bank borrowings 229 168 190 200 200
Net margin 5.7% 4.4% 5.6% 7.0% 7.7% 435 364 396 463 487
Effective tax rate 22.2% 23.3% 22.0% 22.0% 22.0%
Payout ratio 24.9% 27.0% 25.0% 25.0% 25.0% Non-current liabilities
Deferred tax l iabilities 10 30 32 165 335
Other l iabilities 3 0 98 93 0
Year-end Dec 31 (Rmb m) FY14 FY15 FY16E FY17E FY18E 14 30 130 258 335
Profit before tax 49 51 97 133 167 Equity
Depreciation and amortization 2 4 28 34 39 Shareholders' equity 571 687 763 728 818
Net finance income (cost) 5 11 (0) 1 1
Others (9) (9) (13) (10) 9 Total liabilities & equity 1,019 1,082 1,289 1,449 1,639
Change of working capital (44) 61 (56) (53) (53)
Tax paid (8) (16) (21) (29) (37)
Operating cash flow (5.2) 103.2 34.8 76.1 126.7
Capex (2) (6) (34) (18) (21)
Change of AFS investments - (31) (15) 5 5
Acquisitions 0 (148) 0 0 0
Others (28) 17 5 6 6
Investing cash flow (30) (168) (44) (8) (10)
Year-end Dec 31 FY14 FY15 FY16E FY17E FY18E
Change of borrowings 130 (61) 22 10 0
Decrease /(increase) in pledged bank deposits (66) 84 0 0 0 Current ratio 1.8 1.7 1.6 1.7 2.0
Proceeds from issuance of mandatorily convertible bonds 105 0 0 0 0 Quick ratio 1.7 1.2 1.0 1.2 1.3
Others (26) (24) (14) (21) (28)
Financing cash flow 144 (1) 9 (11) (28) Asset turnover 0.8 0.7 0.8 0.9 0.9
Total assets/total equity 1.8 1.6 1.7 2.0 2.0
Net change of cash flow 109 (66) (1) 58 89 Net cash/(debt) (Rmb m) 85 (35) (58) (10) 79
Forex changes (0) (1) 0 0 0
Cash and cash equivalents at beginning 91 200 132 132 190 ROE (%) 7% 5% 9% 12% 14%
Cash and cash equivalents at end 200 133 132 190 279 ROA (%) 4% 3% 5% 6% 7%
Income Statement Balance Sheet
Cash Flow Statement
Financial Ratios
Oct 31, 2016
20
Sector report
Beijing Tong Ren Tang Chinese Medicine (8138 HK)
Accumulate (initiation)
Target price: HK$12.30
Expanding global footprint
Natalie Chiu SFC CE No. AVH029 [email protected] +852 3760 2030 GF Securities (Hong Kong) Brokerage Limited 29-30/F, Li Po Chun Chambers 189 Des Voeux Road Central Hong Kong
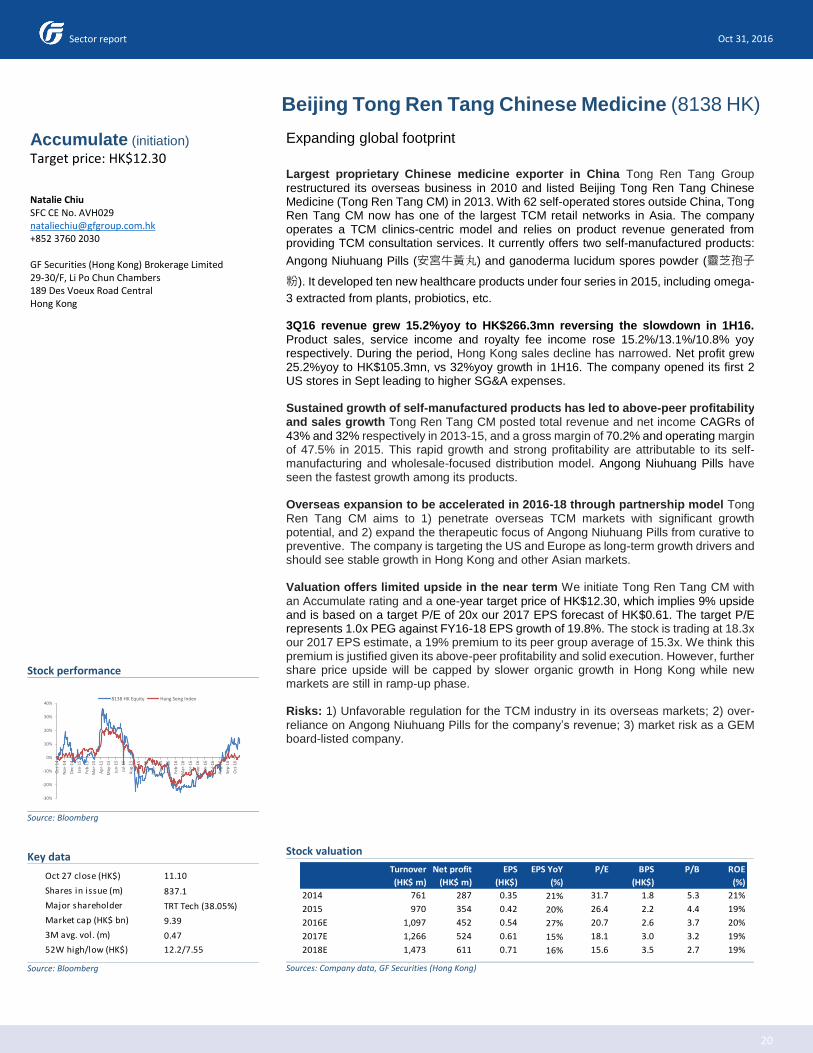
Largest proprietary Chinese medicine exporter in China Tong Ren Tang Group
restructured its overseas business in 2010 and listed Beijing Tong Ren Tang Chinese Medicine (Tong Ren Tang CM) in 2013. With 62 self-operated stores outside China, Tong Ren Tang CM now has one of the largest TCM retail networks in Asia. The company operates a TCM clinics-centric model and relies on product revenue generated from providing TCM consultation services. It currently offers two self-manufactured products:
Angong Niuhuang Pills (安宮牛黃丸) and ganoderma lucidum spores powder (靈芝孢子
粉). It developed ten new healthcare products under four series in 2015, including omega-
3 extracted from plants, probiotics, etc. 3Q16 revenue grew 15.2%yoy to HK$266.3mn reversing the slowdown in 1H16.
Product sales, service income and royalty fee income rose 15.2%/13.1%/10.8% yoy respectively. During the period, Hong Kong sales decline has narrowed. Net profit grew 25.2%yoy to HK$105.3mn, vs 32%yoy growth in 1H16. The company opened its first 2 US stores in Sept leading to higher SG&A expenses. Sustained growth of self-manufactured products has led to above-peer profitability and sales growth Tong Ren Tang CM posted total revenue and net income CAGRs of
43% and 32% respectively in 2013-15, and a gross margin of 70.2% and operating margin of 47.5% in 2015. This rapid growth and strong profitability are attributable to its self-manufacturing and wholesale-focused distribution model. Angong Niuhuang Pills have seen the fastest growth among its products. Overseas expansion to be accelerated in 2016-18 through partnership model Tong
Ren Tang CM aims to 1) penetrate overseas TCM markets with significant growth potential, and 2) expand the therapeutic focus of Angong Niuhuang Pills from curative to preventive. The company is targeting the US and Europe as long-term growth drivers and should see stable growth in Hong Kong and other Asian markets. Valuation offers limited upside in the near term We initiate Tong Ren Tang CM with
an Accumulate rating and a one-year target price of HK$12.30, which implies 9% upside and is based on a target P/E of 20x our 2017 EPS forecast of HK$0.61. The target P/E represents 1.0x PEG against FY16-18 EPS growth of 19.8%. The stock is trading at 18.3x our 2017 EPS estimate, a 19% premium to its peer group average of 15.3x. We think this premium is justified given its above-peer profitability and solid execution. However, further share price upside will be capped by slower organic growth in Hong Kong while new markets are still in ramp-up phase. Risks: 1) Unfavorable regulation for the TCM industry in its overseas markets; 2) over-
reliance on Angong Niuhuang Pills for the company’s revenue; 3) market risk as a GEM board-listed company.
Stock valuation
Sources: Company data, GF Securities (Hong Kong)
Turnover
(HK$ m)
Net profit
(HK$ m)
EPS
(HK$)
EPS YoY
(%)
P/E BPS
(HK$)
P/B ROE
(%)
2014 761 287 0.35 21% 31.7 1.8 5.3 21%
2015 970 354 0.42 20% 26.4 2.2 4.4 19%
2016E 1,097 452 0.54 27% 20.7 2.6 3.7 20%
2017E 1,266 524 0.61 15% 18.1 3.0 3.2 19%
2018E 1,473 611 0.71 16% 15.6 3.5 2.7 19%
Stock performance
Source: Bloomberg
Key data
Source: Bloomberg
-30%
-20%
-10%
0%
10%
20%
30%
40%
Oct
-14
No
v-1
4
Dec
-14
Jan
-15
Feb
-15
Mar
-15
Ap
r-1
5
May
-15
Jun
-15
Jul-
15
Au
g-1
5
Sep
-15
Oct
-15
No
v-1
5
Dec
-15
Jan
-16
Feb
-16
Mar
-16
Ap
r-1
6
May
-16
Jun
-16
Jul-
16
Au
g-1
6
Sep
-16
Oct
-16
8138 HK Equity Hang Seng Index
Oct 27 close (HK$) 11.10
Shares in issue (m) 837.1
Major shareholder TRT Tech (38.05%)
Market cap (HK$ bn) 9.39
3M avg. vol. (m) 0.47
52W high/low (HK$) 12.2/7.55

Oct 31, 2016
21
Sector report
Stable growth for proprietary Chinese medicines in Hong Kong in 2011-15 Stable growth for proprietary Chinese medicine products in Hong Kong Proprietary Chinese
medicine products refers to any proprietary product composed of any Chinese herbal medicines and formulated in a finished dose form. The segment is expected to sustain stable growth over the next five years. According to Frost & Sullivan, it grew from HK$1.0bn in 2011 to HK$1.3bn in 2015, a CAGR of 7.0%, and is expected to grow to HK$1.7bn by 2020, meaning a CAGR of 6.3%.
Figure 43: Breakdown of Hong Kong pharmaceutical market by western medicine and proprietary Chinese medicine
Sources: Tong Ren Tang CM’s prospectus, GF Securities (Hong Kong)
Cardiovascular proprietary Chinese medicines have grown faster than the industry average
The major proprietary Chinese medicines in Hong Kong covers therapeutic categories such as cardiovascular, respiratory, musculoskeletal, gastrointestinal, gynecological and genitourinary. Cardiovascular proprietary Chinese medicines can be used for both preventative and curative uses. Angong Niuhuang Pills account for a dominant share of the Hong Kong cardiovascular proprietary Chinese medicine market. Tong Ren Tang CM’s Angong Niuhuang Pills accounted for >90% of Angong Niu Pills in Hong Kong in 2011.
Figure 44: Industry sales of Angong Niuhuang pills in Hong Kong
Figure 45: Sales and market share of Angong Niuhuang pills in Hong Kong (2011)
Sources: Tong Ren Tang CM’s prospectus, GF Securities (Hong Kong)
Rising global demand for high value proprietary Chinese medicines Export value of Chinese medicine products posted two-year CAGR of 18.8% in 2013-15
According to the China Chamber of Commerce for Import and Export of Medicine and Health Products, exports of Chinese medicine products have been steadily growing over the years and totaled US$3.77bn in 2015, representing a two-year CAGR of 18.8% (2013-15). Exports of proprietary Chinese Medicines accounted for 7% of the total export value of Chinese medicine products in 2015 and posted growth of 4.7% YoY to US$262m. The slower segment growth in 2015
0
2
4
6
8
10
12
14
16
18
20
2011 2012 2013 2014 2015 2016E 2017E 2018E 2019E 2020E
Western medicines Proprietary Chinese medicines
HK$ bn
2011-15 CAGR: Western medicine: 8.4%
Proprietary chinese medicine: 7.0%
2015-20 CAGR: Western medicine: 6.8%
Proprietary chinese medicine: 6.3%
HK$ m
172 190 218294
516
831
1018
1221
1445
1662
0
200
400
600
800
1000
1200
1400
1600
1800
2007 2008 2009 2010 2011 2012E 2013E 2014E 2015E 2016E
CAGR: 18.9%
HK$486m: 94%
HK$30m: 6%
Beijing Tong Ren Tang Others

Oct 31, 2016
22
Sector report
was partly due to the loss of TRT Group’s export revenue to its subsidiary Tong Ren Tang CM, which is a Hong Kong entity.
Tong Ren Tang CM accounts for the majority of proprietary Chinese medicine exports The
TRT Group was the largest Chinese Medicines exporter in 2011 according to the China Chamber of Commerce for Import & Export of Medicine & Health Products. Tong Ren Tang Ltd. was the top exporter and Tong Ren Tang Tech was third in terms of export value of Chinese Medicines in China in 2011. Together they contributed ~19% of total export value of Chinese Medicines. Since 2013, Tong Ren Tang CM has assumed overseas distribution of “Tong Ren Tang” branded products and thus its market share largely represents the combined share of TRT Ltd and TRT Tech which currently holds 33.62% and 38.05% interest in the company.
Figure 46: TRT Group’s export market share and their respective relevant export value in 2011
Sources: Tong Ren Tang CM’s prospectus, GF Securities (Hong Kong)
Hong Kong is the top export destination for Chinese medicine products in terms of export value, but the United States is the fastest growing key export market Asia accounted for 58.8%
of total export value of Chinese medicine products from China in 2015, down from 73.5% four years ago. The US continued to be the third biggest Chinese medicine product export market, and its share has increased from 8.0% in 2011 to 14.3% in 2015. During the year, the Chinese regulator forged a mutual agreement for recognition of herbal extraction standards with the United States Pharmacopeia (USP), which contributed to the faster growth in Chinese medicine herbs. We believe improved regulation and supervision of the Chinese medicine industry by foreign counterparts will promote further growth in these countries.
Above-peer profitability ensures sustainable growth Competitive advantage for Angong Niuhuang Pills Tong Ren Tang CM’s Angong Niuhuang Pills
is a major TCM proprietary product in Hong Kong’s cardiovascular proprietary Chinese medicines market. The product differs from other Angong Niuhuang Pills as it contains natural musk, a regulated Chinese medicinal herb with limited supply. Most other Angong Niuhuang Pills in China do not contain these Chinese herbs. Together with ganoderma spores powder in Hong Kong, the two self-manufactured products contributed two-thirds of their product sales in 2015. Increasing stroke prevalence in Hong Kong and other Asian countries provides long-term upside Strokes are the fourth leading cause of death in Hong Kong. The prevalence rate for strokes
in people aged above 65 years is around 5%, with 55,000 patients in need of, or under, long-term treatment. This implies significant growth potential for Angong Niuhuang Pills as a preventive medicine. Higher profitability than competitors Tong Ren Tang CM has one of the largest Chinese
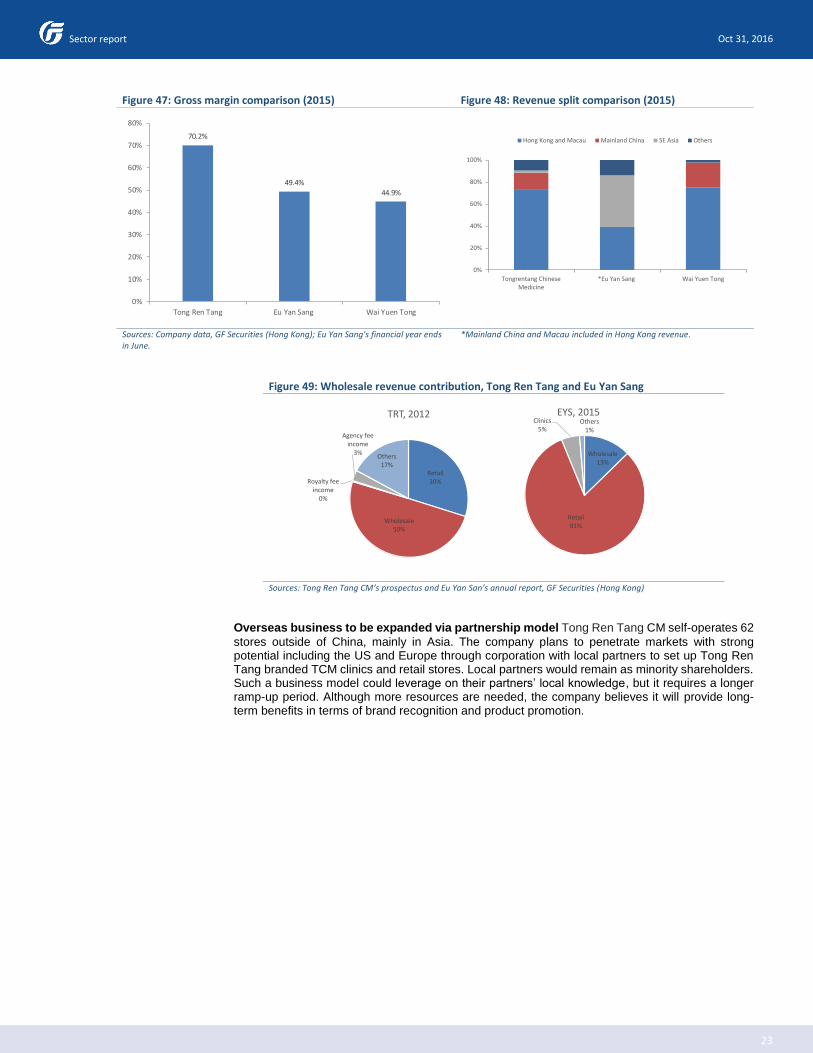
medicine retail networks in Hong Kong. Other TCM retail chain operators include Singapore-based Eu Yan Sang and Hong Kong-based Wai Yuen Tong (897 HK, NR). In contrast to its competitors, Tong Ren Tang CM’s products are mainly based on therapeutic efficacy while its peers target TCMs as health supplements. In terms of profitability, Tong Ren Tang CM has the highest gross margin in sales of key products, which is attributable to its bigger wholesale business and higher retail segment margins.
US$36.6m:16% US$7.5m: 3%
US$37.1m: 81%
TRT Ltd TRT Technologies Others
Oct 31, 2016
23
Sector report
Figure 47: Gross margin comparison (2015) Figure 48: Revenue split comparison (2015)
Sources: Company data, GF Securities (Hong Kong); Eu Yan Sang's financial year ends in June.
*Mainland China and Macau included in Hong Kong revenue.
Figure 49: Wholesale revenue contribution, Tong Ren Tang and Eu Yan Sang
Sources: Tong Ren Tang CM’s prospectus and Eu Yan San’s annual report, GF Securities (Hong Kong)
Overseas business to be expanded via partnership model Tong Ren Tang CM self-operates 62
stores outside of China, mainly in Asia. The company plans to penetrate markets with strong potential including the US and Europe through corporation with local partners to set up Tong Ren Tang branded TCM clinics and retail stores. Local partners would remain as minority shareholders. Such a business model could leverage on their partners’ local knowledge, but it requires a longer ramp-up period. Although more resources are needed, the company believes it will provide long-term benefits in terms of brand recognition and product promotion.
70.2%
49.4%44.9%
0%
10%
20%
30%
40%
50%
60%
70%
80%
Tong Ren Tang Eu Yan Sang Wai Yuen Tong
0%
20%
40%
60%
80%
100%
Tongrentang ChineseMedicine
*Eu Yan Sang Wai Yuen Tong
Hong Kong and Macau Mainland China SE Asia Others
Retail30%
Wholesale50%
Royalty fee income
0%
Agency fee income
3%Others
17%
TRT, 2012
Wholesale13%
Retail81%
Clinics5%
Others1%
EYS, 2015
Oct 31, 2016
24
Sector report
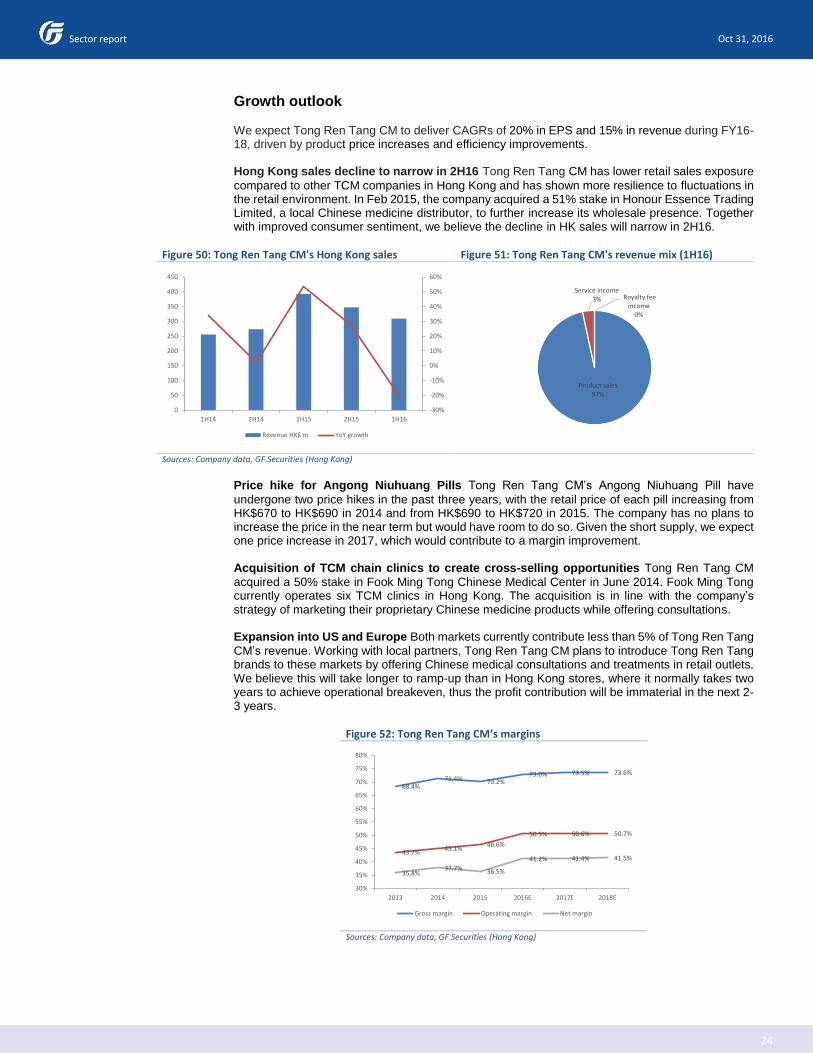
Growth outlook We expect Tong Ren Tang CM to deliver CAGRs of 20% in EPS and 15% in revenue during FY16-18, driven by product price increases and efficiency improvements. Hong Kong sales decline to narrow in 2H16 Tong Ren Tang CM has lower retail sales exposure
compared to other TCM companies in Hong Kong and has shown more resilience to fluctuations in the retail environment. In Feb 2015, the company acquired a 51% stake in Honour Essence Trading Limited, a local Chinese medicine distributor, to further increase its wholesale presence. Together with improved consumer sentiment, we believe the decline in HK sales will narrow in 2H16.
Figure 50: Tong Ren Tang CM's Hong Kong sales Figure 51: Tong Ren Tang CM's revenue mix (1H16)
Sources: Company data, GF Securities (Hong Kong)
Price hike for Angong Niuhuang Pills Tong Ren Tang CM’s Angong Niuhuang Pill have
undergone two price hikes in the past three years, with the retail price of each pill increasing from HK$670 to HK$690 in 2014 and from HK$690 to HK$720 in 2015. The company has no plans to increase the price in the near term but would have room to do so. Given the short supply, we expect one price increase in 2017, which would contribute to a margin improvement. Acquisition of TCM chain clinics to create cross-selling opportunities Tong Ren Tang CM
acquired a 50% stake in Fook Ming Tong Chinese Medical Center in June 2014. Fook Ming Tong currently operates six TCM clinics in Hong Kong. The acquisition is in line with the company’s strategy of marketing their proprietary Chinese medicine products while offering consultations. Expansion into US and Europe Both markets currently contribute less than 5% of Tong Ren Tang
CM’s revenue. Working with local partners, Tong Ren Tang CM plans to introduce Tong Ren Tang brands to these markets by offering Chinese medical consultations and treatments in retail outlets. We believe this will take longer to ramp-up than in Hong Kong stores, where it normally takes two years to achieve operational breakeven, thus the profit contribution will be immaterial in the next 2-3 years.
Figure 52: Tong Ren Tang CM’s margins
Sources: Company data, GF Securities (Hong Kong)
-30%
-20%
-10%
0%
10%
20%
30%
40%
50%
60%
0
50
100
150
200
250
300
350
400
450
1H14 2H14 1H15 2H15 1H16
Revenue HK$ m YoY growth
Product sales97%
Service income3% Royalty fee
income 0%
68.4%71.4% 70.2%
73.0% 73.5% 73.6%
43.7%45.1%
46.6%
50.5% 50.6% 50.7%
35.8%37.7% 36.5%
41.2% 41.4% 41.5%
30%
35%
40%
45%
50%
55%
60%
65%
70%
75%
80%
2013 2014 2015 2016E 2017E 2018E
Gross margin Operating margin Net margin

Oct 31, 2016
25
Sector report
Valuation Our one-year target price of HK$12.30 implies 9% upside and is based on a target P/E of 20x our 2017 EPS forecast of HK$0.61, and represents 1.0x PEG. Other HK-listed Chinese medicine companies are trading at 15.3x 2017E P/E. The stock is currently trading at 18.3x our 2017 EPS forecast. We think this premium is justified given its above-peer profitability and solid execution. However, further share price upside will be capped by slower organic growth in Hong Kong, and as new markets are still in ramp-up phase.
Figure 53: P/E band
Sources: Bloomberg
1
3
5
7
9
11
13
15
10
/20
14
11
/20
14
12
/20
14
01
/20
15
02
/20
15
03
/20
15
04
/20
15
05
/20
15
06
/20
15
07
/20
15
08
/20
15
09
/20
15
10
/20
15
11
/20
15
12
/20
15
01
/20
16
02
/20
16
03
/20
16
04
/20
16
05
/20
16
06
/20
16
07
/20
16
08
/20
16
09
/20
16
10
/20
16
10x 13x 16x 19x 22x Share Price
Oct 31, 2016
26
Sector report
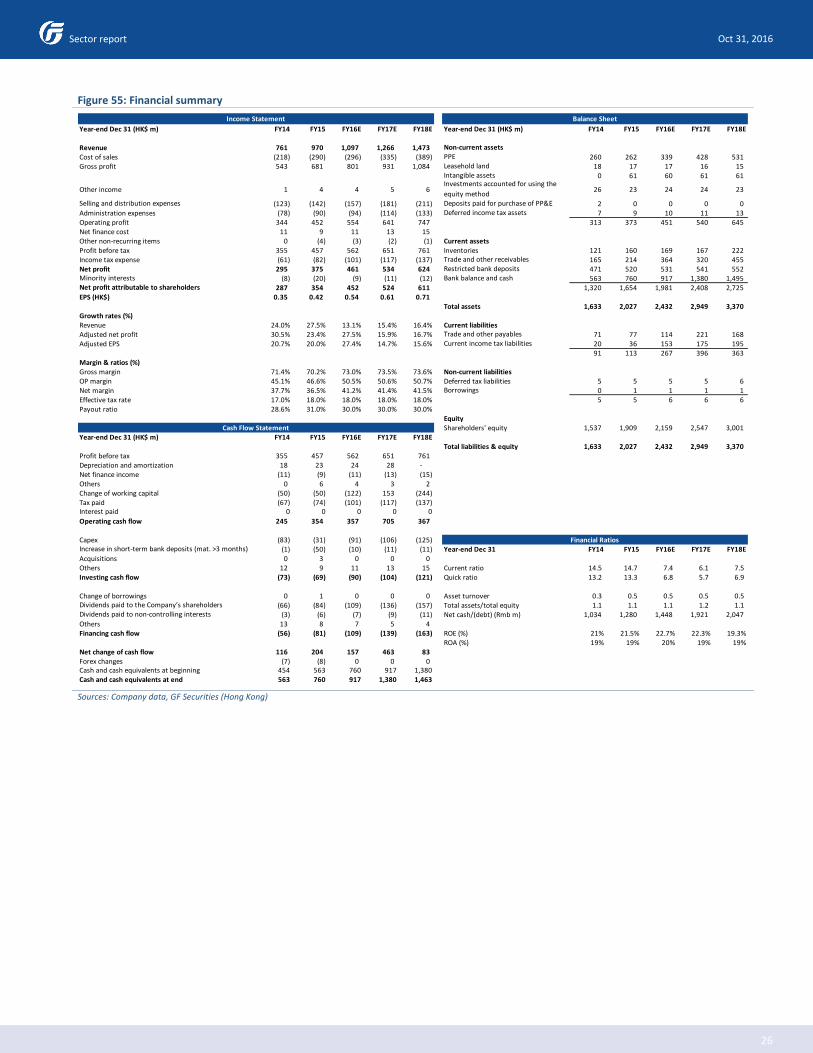
Figure 55: Financial summary
Sources: Company data, GF Securities (Hong Kong)
Year-end Dec 31 (HK$ m) FY14 FY15 FY16E FY17E FY18E Year-end Dec 31 (HK$ m) FY14 FY15 FY16E FY17E FY18E
Revenue 761 970 1,097 1,266 1,473 Non-current assets
Cost of sales (218) (290) (296) (335) (389) PPE 260 262 339 428 531Gross profit 543 681 801 931 1,084 Leasehold land 18 17 17 16 15
Intangible assets 0 61 60 61 61
Other income 1 4 4 5 6Investments accounted for using the
equity method26 23 24 24 23
Selling and distribution expenses (123) (142) (157) (181) (211) Deposits paid for purchase of PP&E 2 0 0 0 0Administration expenses (78) (90) (94) (114) (133) Deferred income tax assets 7 9 10 11 13Operating profit 344 452 554 641 747 313 373 451 540 645Net finance cost 11 9 11 13 15Other non-recurring items 0 (4) (3) (2) (1) Current assetsProfit before tax 355 457 562 651 761 Inventories 121 160 169 167 222Income tax expense (61) (82) (101) (117) (137) Trade and other receivables 165 214 364 320 455Net profit 295 375 461 534 624 Restricted bank deposits 471 520 531 541 552Minority interests (8) (20) (9) (11) (12) Bank balance and cash 563 760 917 1,380 1,495Net profit attributable to shareholders 287 354 452 524 611 1,320 1,654 1,981 2,408 2,725EPS (HK$) 0.35 0.42 0.54 0.61 0.71
Total assets 1,633 2,027 2,432 2,949 3,370Growth rates (%)Revenue 24.0% 27.5% 13.1% 15.4% 16.4% Current liabilitiesAdjusted net profit 30.5% 23.4% 27.5% 15.9% 16.7% Trade and other payables 71 77 114 221 168Adjusted EPS 20.7% 20.0% 27.4% 14.7% 15.6% Current income tax liabilities 20 36 153 175 195
91 113 267 396 363Margin & ratios (%)Gross margin 71.4% 70.2% 73.0% 73.5% 73.6% Non-current liabilitiesOP margin 45.1% 46.6% 50.5% 50.6% 50.7% Deferred tax liabilities 5 5 5 5 6Net margin 37.7% 36.5% 41.2% 41.4% 41.5% Borrowings 0 1 1 1 1Effective tax rate 17.0% 18.0% 18.0% 18.0% 18.0% 5 5 6 6 6Payout ratio 28.6% 31.0% 30.0% 30.0% 30.0%
EquityShareholders' equity 1,537 1,909 2,159 2,547 3,001
Year-end Dec 31 (HK$ m) FY14 FY15 FY16E FY17E FY18ETotal liabilities & equity 1,633 2,027 2,432 2,949 3,370
Profit before tax 355 457 562 651 761 Depreciation and amortization 18 23 24 28 - Net finance income (11) (9) (11) (13) (15) Others 0 6 4 3 2 Change of working capital (50) (50) (122) 153 (244) Tax paid (67) (74) (101) (117) (137) Interest paid 0 0 0 0 0
Operating cash flow 245 354 357 705 367
Capex (83) (31) (91) (106) (125) Increase in short-term bank deposits (mat. >3 months) (1) (50) (10) (11) (11) Year-end Dec 31 FY14 FY15 FY16E FY17E FY18EAcquisitions 0 3 0 0 0Others 12 9 11 13 15 Current ratio 14.5 14.7 7.4 6.1 7.5Investing cash flow (73) (69) (90) (104) (121) Quick ratio 13.2 13.3 6.8 5.7 6.9
Change of borrowings 0 1 0 0 0 Asset turnover 0.3 0.5 0.5 0.5 0.5Dividends paid to the Company’s shareholders (66) (84) (109) (136) (157) Total assets/total equity 1.1 1.1 1.1 1.2 1.1Dividends paid to non-controlling interests (3) (6) (7) (9) (11) Net cash/(debt) (Rmb m) 1,034 1,280 1,448 1,921 2,047Others 13 8 7 5 4Financing cash flow (56) (81) (109) (139) (163) ROE (%) 21% 21.5% 22.7% 22.3% 19.3%
ROA (%) 19% 19% 20% 19% 19%Net change of cash flow 116 204 157 463 83Forex changes (7) (8) 0 0 0Cash and cash equivalents at beginning 454 563 760 917 1,380Cash and cash equivalents at end 563 760 917 1,380 1,463
Income Statement Balance Sheet
Cash Flow Statement
Financial Ratios

Oct 31, 2016
27
Sector report
Rating definitions
Benchmark: Hong Kong Hang Seng Index Time horizon: 12 months
Company ratings
Buy Stock expected to outperform benchmark by more than 15%
Accumulate Stock expected to outperform benchmark by more than 5% but not more than 15%
Hold Expected stock relative performance ranges between -5% and 5%
Underperform Stock expected to underperform benchmark by more than 5%
Sector ratings
Positive Sector expected to outperform benchmark by more than 10%
Neutral Expected sector relative performance ranges between -10% and 10%
Cautious Sector expected to underperform benchmark by more than 10%
Analyst Certification The research analyst(s) primarily responsible for the content of this research report, in whole or in part, certifies that with respect to the company or relevant securities that the analyst(s) covered in this report: (1) all of the views expressed accurately reflect his or her personal views on the company or relevant securities mentioned herein; and (2) no part of his or her remuneration was, is, or will be, directly or indirectly, in connection with his or her specific recommendations or views expressed in this research report.
Disclosure of Interests (1) The proprietary trading division of GF Securities (Hong Kong) Brokerage Limited (“GF Securities (Hong Kong)”) and/or its affiliated or associated companies do not hold any shares of the securities mentioned in this research report. (2) GF Securities (Hong Kong) and/or its affiliated or associated companies do not have any investment banking relationship with the companies mentioned in this research report in the past 12 months. (3) Neither the analyst(s) preparing this report nor his/her associate(s) serves as an officer of the company mentioned in this report and has any financial interests or hold any shares of the securities mentioned in this report.
Disclaimer This report is prepared by GF Securities (Hong Kong). It is published solely for information purpose and does not constitute an offer to buy or sell any securities or a solicitation of an offer to buy, or recommendation for investment in, any securities. The research report is intended solely for use of the clients of GF Securities (Hong Kong). The securities mentioned in the research report may not be allowed to be sold in certain jurisdictions. No action has been taken to permit the distribution of the research reports to any person in any jurisdiction that the circulation or distribution of such research report is unlawful. No representation or warranty, either express or implied, is made by GF Securities (Hong Kong) as to their accuracy and completeness of the information contained in the research report. GF Securities (Hong Kong) accepts no liability for all loss arising from the use of the materials presented in the research report, unless is excluded by applicable laws or regulations. Please be aware of the fact that investments involve risks and the price of securities may be fluctuated and therefore return may be varied, past results do not guarantee future performance. Any recommendation contained in the research report does not have regard to the specific investment objectives, financial situation and the particular needs of any individuals. The report is not to be taken in substitution for the exercise of judgment by respective recipients of the report, where necessary, recipients should obtain professional advice before making investment decisions. GF Securities (Hong Kong) may have issued, and may in the future issue, other communications that are inconsistent with, and reach different conclusions from, the information presented in the research report. The points of view, opinions and analytical methods adopted in the research report are solely expressed by the analysts but not that of GF Securities (Hong Kong) or its affiliates. The information, opinions and forecasts presented in the research report are the current opinions of the analysts as of the date appearing on this material only which may subject to change at any time without notice. The salesperson, dealer or other professionals of GF Securities (Hong Kong) may deliver opposite points of view to their clients and the proprietary trading division with respect to market commentary or dealing strategy either in writing or verbally. The proprietary trading division of GF Securities (Hong Kong) may have different investment decision which may be contrary to the opinions expressed in the research report. GF Securities (Hong Kong) or its affiliates or respective directors, officers, analysts and employees may have rights and interests in securities mentioned in the research report. Recipients should be aware of relevant disclosure of interest (if any) when reading the report. Copyright © GF Securities (Hong Kong) Brokerage Limited. Without the prior written consent obtained from GF Securities (Hong Kong) Brokerage Limited, any part of the materials contained herein should not (i) in any forms be copied or reproduced or (ii) be re-disseminated. © GF Securities (Hong Kong) Brokerage Limited. All rights reserved. 29-30/F, Li Po Chun Chambers, 189 Des Voeux Road Central, Hong Kong Tel: +852 3719 1111 Fax: +852 2907 6176 Website: http://www.gfgroup.com.hk