Embed Size (px)
Citation preview

7 BIGGEST MISTAKESLearn how to identify and avoid them.
GREATER CONFIDENCEIdentify reversal entry and exitsignals faster.
WHY SYSTEMS FAILInvestigate three reasons whymost trading systems don’t work.
USING SCIENCE TO MAXIMIZE YOUR TRADING APPROACH.
channels, trend lines and Commitment of Traders reports only give you part of the picture. Reversal Days can tell you where the market is really heading." - John Crane
1-2-3 Patterns,
BONUS G IFT INSIDE .
TRADERSNETWORK.COM
INSIDE LOOK
TRADERSCHALLENGEGET READY FOR A WILD RIDE! PINPOINT THE NEXTMARKET REVERSAL
THE SUPRISING FORCESTHAT DRIVE TODAY’SMARKETS: GREED AND FEAR
THE MOST VERSATILETRADING TOOL YOU’LLEVER USE. WHAT IS IT? WE’LL TELL YOU.
INS IDECHALLENGEThink you 've got a system for makingconsis tent prof i ts in commodit ies?Well , professional t rader , John Crane,says his Reversal Day TradingIndicator can make your system evenbet ter. . .and he ' l l guarantee i t or yourmoney back! Take his "Trader’sChal lenge" and see how this break-through t rading tool pinpoints marketturns with uncanny accuracy.
THE 7 EASIEST WAYS TOLOSE MONEY TRADINGI f your t rading prof i ts aren ' t as big asyou 'd l ike , perhaps i t ' s becauseyou ' re making one of thesecommon mistakes .
SECRETS OF A $50 MILLIONCOMMODITIES TRADERBefore his death in 1954, W.D. Gannmade over $50 mil l ion in t radingprof i ts us ing a system that a l lowedhim to pinpoint , months in advance,the exact turning point in the market .Al though Gann was eventual ly per-suaded to publ ish the s tory of hist rading method, he lef t out crucia ldata . Did John Crane use that miss inginformat ion to create his newReversal Day Indicator?Although wewil l probably never know for sure ,i t ’s c lear that Crane’s new t imingmethod is a worthy successor toGann.
IT 'S NOT MAGIC, IT ’S SCIENCE In this exclusive SCIENTIFIC TRAD-ER interview, John Crane, d iscovererof the Reversal Day Indicator ,explains why some people have ahard t ime bel ieving his t rading toolcan help predict market turns , andwhat he 's doing to convince the skep-t ics .
WHY MOST TRADING SYSTEMS DON’T WORK. There are hundreds of trading systems.Problem is, most simply don't work.
NAVIGATE THE MARKETS WITH GREAT ACCURACYDuring the early years of the 20th century, William D.Gann built a reputation for being able to pinpoint marketturning points with incredible accuracy. Can his phenomenal record for predicting market turns ever bematched? page 10
USING SCIENCE TO MAXIMIZE YOUR TRADING APPROACH.
3
9
10
12
14
SCIENTIFIC TRADER 2
SCIENTIFIC TRADER 3
by John CraneOn a chilly morning in September,
I sat in my office with the breathtakingview of the Rocky Mountains. But themagnificent scenery went unnoticedthat morning because the S&P futureschart had my undivided attention.
Other traders may have seen flags,channels, or trend lines on their S&Pcharts, but when I looked at my barchart that morning, I saw a ReactionSwing, the unmistakable telltale signthat a change was in the wind.
The December S&P contract hadbeen falling precipitously for weeks,and after a short-term correction, hadbegun another sharp price drop. Iquickly determined that the S&Pfutures contract was about to bottom...
Get ready for a wild ride!
Excited by implications of what Iwas seeing, I quickly did two simplearithmetic computations and pinpoint-ed October 8th as a reversal date forthe S&P contract, the day on whichprices could begin a major move. Thepattern also indicated October 13th asthe next possible Reversal Day.
Six days later on October 8th, Ilooked more closely at my charts andrealized the Reversal Day was accom-panied by a particular kind of patternthat almost always signals a major turnin the market, in this case, an upwardprice move. There was only one logi-cal conclusion: S&P prices were aboutto surge ahead with unprecedentedfury, like a sleeping dog awakened bya kick in the head!
Sure enough exactly on October8th, S&P began its predicted move,surging from 969.30 to 1092.50 on Oct
20 (which my charts predicted couldbe another Reversal Date for the S&P).The market only paused briefly as theS&P pulled back into the ReversalDate of October 13th. This ReversalDate was also accompanied by a par-ticular price pattern, confirming theupward trend was still intact.
While the Reversal Day Indicatordidn’t explain why the S&P made sucha strong move, it did correctly foretell, days in advance: (1) the precise daythe market for S&P would undergo achange; (2) the direction of thatchange; (3) the date the newly established trend could end!
Just a lucky call? Not hardly. In fact, the prediction of
escalating S&P prices was just one ofhundreds of amazing forecasts madewith my Reversal Day Indicator dur-ing the last 20+ years for virtually
every market in virtually every kind of market climate.
Before going further, it should bepointed out that trading does containrisk of loss, therefore, you should care-fully consider whether such trading issuitable for you in light of your finan-cial condition.
With the Unlocking Wealth: Secretto Market Timing book, you will learnhow to identify, weeks ahead of time,when the market is due for a reversal.The manual explains everything youneed to know to predict the nextReversal Day! You will be shocked byhow simple it is to do! Anyone canlearn, anyone can do it!
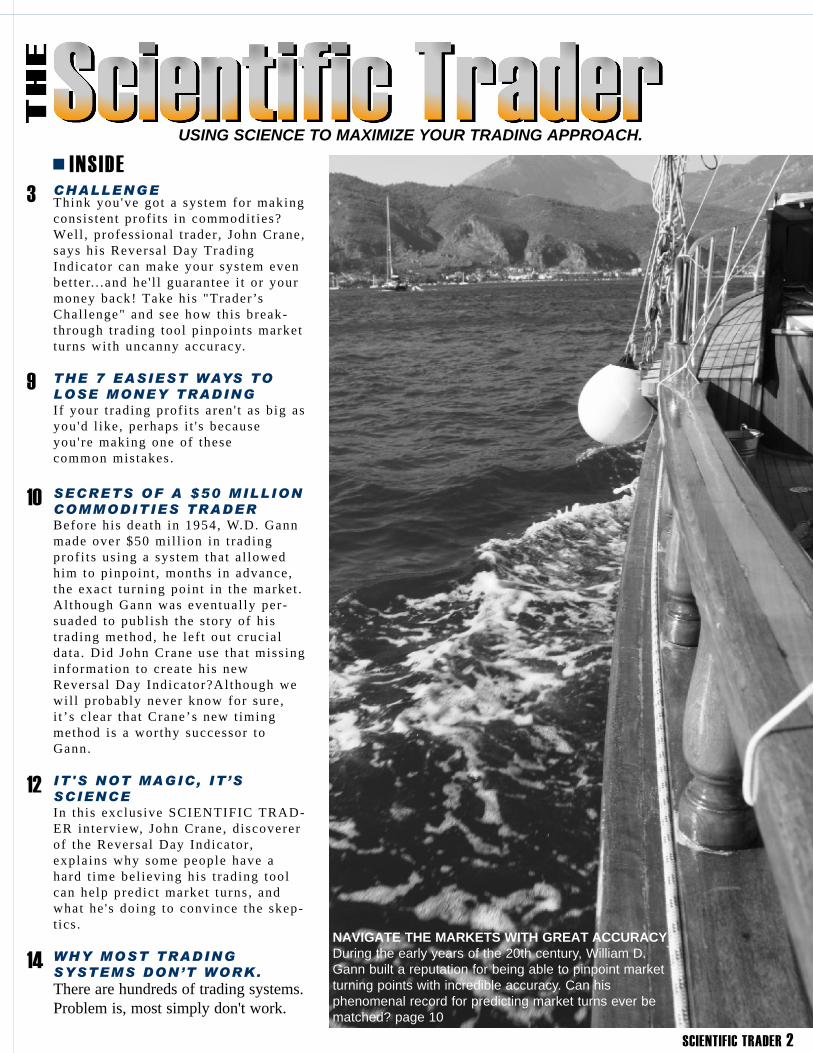
This strong rally stopped onthis projected reversal day.
This is the day the Indicator predicted themarket could turn, right on the money!
This is the day theprediction was made.
Prices were still in asharp decline when Imade my prediction.
INTRODUCING THE TRADER’S CHALLENGE...“I believe my Reversal Day Trading Indicator can make“I believe my Reversal Day Trading Indicator can makeany trading system more accurate and more profitableany trading system more accurate and more profitable
than you ever dreamed possible!”than you ever dreamed possible!”
From 10/8 to 10/20, S&P moved significantly higher for the next eight days! Once you knowhow to use my Reversal Day Trading Indicator, you’ll be able to spot trading opportunities likethis on a regular basis. *PAST PERFORMANCES ARE NOT INDICATIVE OF FUTURERESULTS.
SCIENTIFIC TRADER 4
Unlike many other indicators, theReversal Day Indicator is precise in itsprojections of the potential marketreversals. All confirmed reversals takeplace on the exact date predicted, or onthe Trail Day (the day following thepredicted Reversal Day). Now, thebig question- will every Reversal Daycalculated be a major reversal in themarket? No, some dates will only be asmall correction in the market, while asmall percentage will be a continua-tion of the existing trend. Knowing thedate of a potential market reversal isimportant information, but knowingwhat to do with that information is even more important.
That information is also explainedin the book, Unlocking Wealth: Secretto Market Timing. When the predictedReversal Date approaches, you justlook for particular pricepatterns that will confirm the marketreversal. Depending on which patternoccurs, the market will reveal to youwhether it is a Market Reversal orTrend Continuation. Both are extreme-ly important information toany trader. These patterns (there areonly six) are described in detail withsimple instructions on how to use them.
Once you have learned to find thereversal, you just wait for the pricepatterns to tell you what the market isgoing to do. Yes, it is that easy.
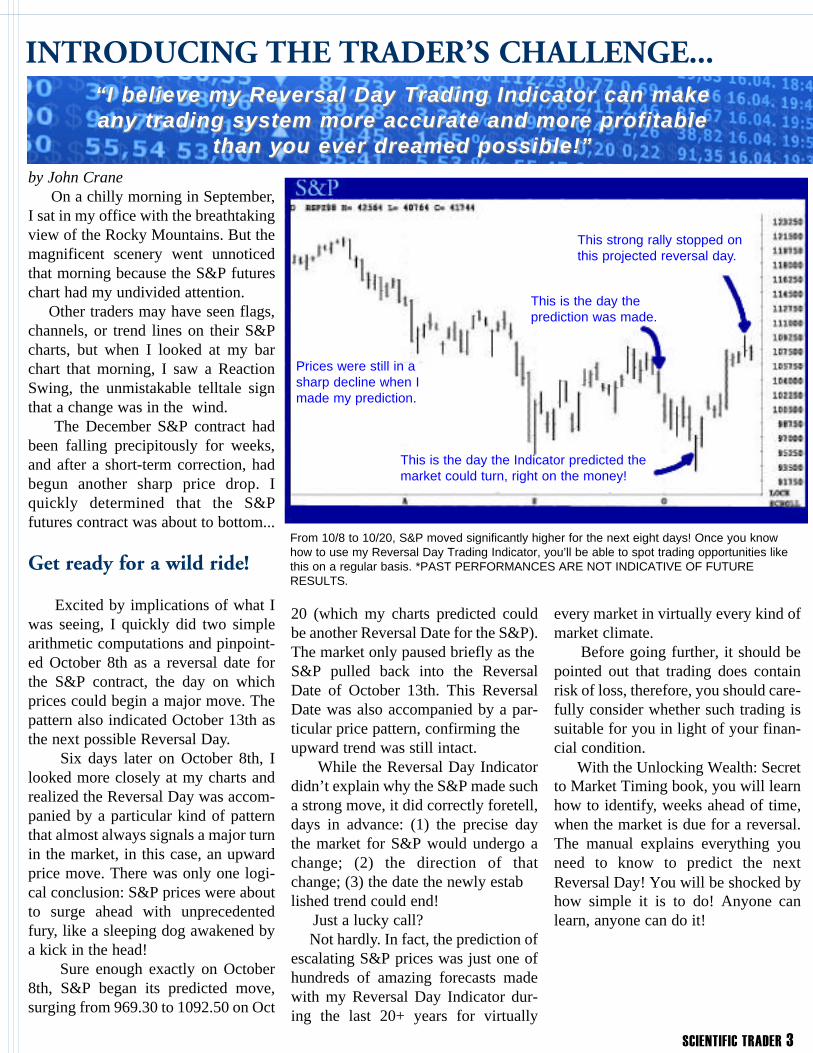
The March contract wastrading steadily downward.
This date, predicted by the Indicator,proved to be the low of a 1-2-3 formation.
The Indicator correctly predictedthe market could turn on this date.
This is the day theforecast was made.
Find out how you can start putting on trades with this kind of potential by sending for a no riskcopy of Unlocking Wealth, Secret to Market Timing, the new traders manual that explains theReversal Day Trading Indicator in detail. *PAST PERFORMANCES ARE NOT INDICATIVE OFFUTURE RESULTS
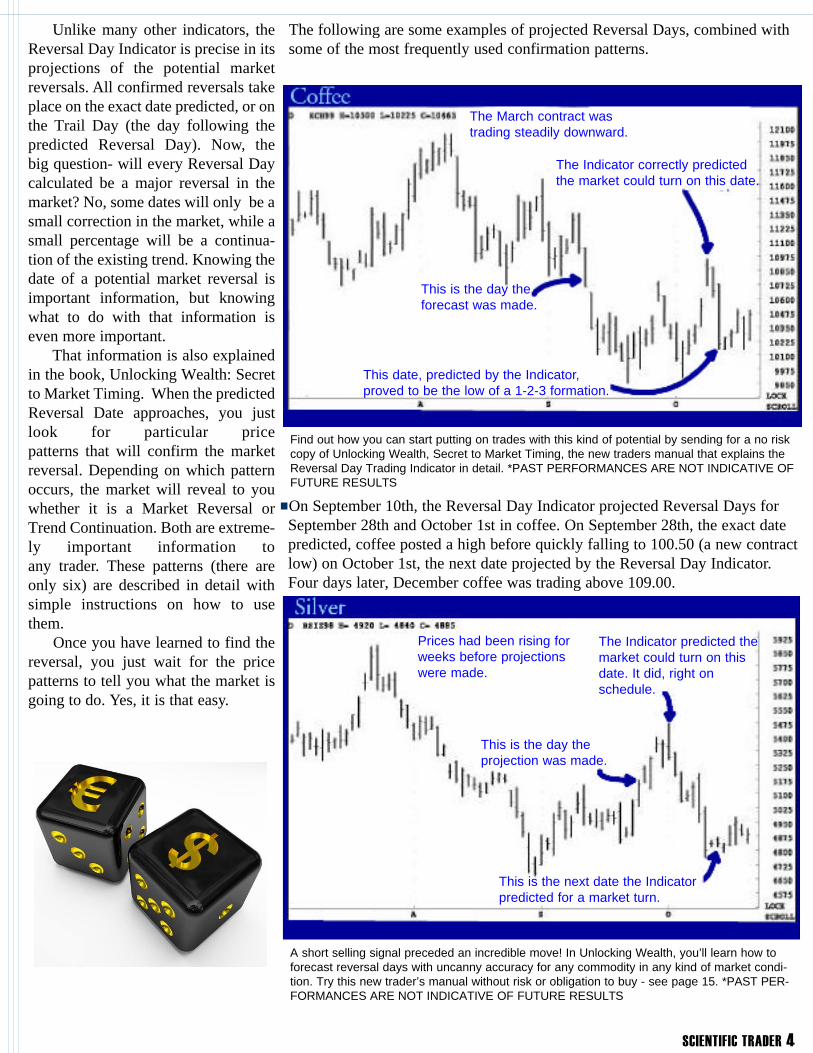
Prices had been rising forweeks before projectionswere made.
This is the next date the Indicator predicted for a market turn.
The Indicator predicted themarket could turn on thisdate. It did, right on schedule.
This is the day theprojection was made.
A short selling signal preceded an incredible move! In Unlocking Wealth, you’ll learn how toforecast reversal days with uncanny accuracy for any commodity in any kind of market condi-tion. Try this new trader’s manual without risk or obligation to buy - see page 15. *PAST PER-FORMANCES ARE NOT INDICATIVE OF FUTURE RESULTS
The following are some examples of projected Reversal Days, combined withsome of the most frequently used confirmation patterns.
On September 10th, the Reversal Day Indicator projected Reversal Days forSeptember 28th and October 1st in coffee. On September 28th, the exact datepredicted, coffee posted a high before quickly falling to 100.50 (a new contractlow) on October 1st, the next date projected by the Reversal Day Indicator.Four days later, December coffee was trading above 109.00.

On September 24th, my Reversal Day Indicator predicted a possible top inDecember silver for October 1st. This top should be followed by a secondreversal day on Oct. 14. Right on schedule, Silver topped on October 1st, thepredicted Reversal Date, followed by a sharp fall in silver prices, as the marketfell over 65 cents into October 14.
On September 18th, my Reversal Day Indicator suggested that Decemberunleaded gas, which had been in a strong bull trend for the past three weeks,could turn lower on Oct 1. It did, on the exact date! Following this reversal themarket fell from 4598 to 4365 in only five days, stopping on October 8th, thenext projected Reversal Date. On this date, the market paused before anotherdrop into the third projected reversal date of October 20th. This reversal dayproved to be a major low in December unleaded gas. Remember, these ReversalDates were all predicted several days in advance.
The RDTI indicated a reversal due on October 8th, and forecasted anotherreversal for October 27th. December cotton had been trading lower for eightdays before a sharp correction sent prices higher over the next three days. The
market then topped on October 7th, just one day before the predicted ReversalDay. After the October 8th Reversal Day, the market plummeted for the next13 days, stopping exactly on the next reversal date, Oct. 27.The RDTI projected September 24th, October 1st, and October 21st, as upcom-
ing Reversal Dates in December crude oil. After hitting a high on the September24th Reversal Date, the market traded sideways to lower until October 1st. Onthis Reversal Day, the market posted a wide outside day, making a new contracthigh before closing lower, triggering a sharp price drop. From this point crudeoil prices collapsed, falling sharply into the next projected Reversal Day ofOctober 21st before rebounding.
These are just a handful of times my Reversal Day Indicator has pinpointedthe beginning of major market moves. In a few minutes, I'll tell you how youcan prove to yourself, without risking a penny, that the Indicator works for any
commodity in any kind of market. Butfirst, let me explain why the ReversalDay Indicator works so well...
The Surprising forcesdriving today's markets
Ask the typical trader how themarkets work and he'll tell you, with-out missing a beat, that it’s all basedon supply and demand. If demand fora particular commodity exceeds thesupply, prices go up. If supplyexceeds demand, prices decline.
It’s all so comfortingly logical.Unfortunately, it's just plain wrong!
Yes, supply and demand play arole, but not the one most peoplethink. You see, this simplistic lawof supply and demand is constantlysubjected to a force that's equallypowerful, harder to measure andinfinitely less logical: human emotion.
Because of two emotions that areas old as humanity itself, greed andfear, most traders have a tendency tooverreact to market conditions. Whenthings are going well, traderssuccumb to greed, buying too manycontracts in an effort to maximizeprofits. When the market doesn't seemto be going their way, fear kicks in,causing a flurry of selling.
This greed-based and fear-basedtrading causes the market to swinglike a pendulum, first in the one direc-tion and then in the other, beforereturning to a state of equilibrium. Inthe process, it produces a clearly rec-ognizable pattern on the bar charts,which I call "Reaction Swings".
SCIENTIFIC TRADER 5
This is the date the Indicatorpredicted the market could turn.
The price collapse ended one daybefore the next predicted date.
This is the daythe Indicator
predictedthe marketcould turn.It did, as
pricesplummeted.
This is the day theforecast was made.
This is fully explained in Advanced Swing Trading. See page 17 to find out how you can try thisnew trader’s manual without risk or obligation to buy.
Crude had beenin a strong bulltrend before the
forecast was made.
SCIENTIFIC TRADER 6
They may not be as well known asflags, channels, or pennants, but thesereaction Swings have infinitely greatervalue as a forecasting tool. That’sbecause they're the starting point forcalculating Reversal Days, the dayson which the market can be expected to turn.
The key to mastering market moves
I've been using my Reversal DayTrading Indicator for more than 20years, and it's downright uncanny how reliable it can be.
As you can see from these exam-ples, the Reversal Day TradingIndicator can identify the exact day onwhich the market will undergo a reac-tion, either up or down. Having reli-able information about market turns isthe key to consistent trading profits.
Reversal dates can easily be deter-mined in any market with the righttrading patterns, it only takes a fewminutes. Once you have the date, allyou do is watch to see how the markettrades into the predicted date. If themarket matches the patterns described,you take the appropriate action. If not,you stand aside. It is that simple! Thestrategies will help determine if themarket is ready to reverse or continuethe existing trend. Only take actionwhen all parts of the puzzle are inplace. But remember, not every signalwill work. There is no substitute forproper money management!
Sometimes these Reversal Days arepart of a short-term, or intermediateterm, move that can generate modest,but rapid, trading profits like the ones shown above.
But when the Reversal Daysoccur at important support orresistance levels, the potentialcan be astronomical!
I'll tell you how to profit fromthese major price moves in justa few minutes. But first, I wantto explain why I use the word
"Indicator" when referring to mybreakthrough.
The most versatile tradingtool you've ever used
Virtually every trading system I'veever seen only works forparticular markets or in certain marketconditions. One reason for this is thatmost systems are "backtested" usinghistorical data from a particular type ofmarket. When market conditionschange, the system usually implodes,frequently with disastrous results for those using it.
But the Reversal Day Trading
Indicator can be used for any condi-tion. That’s because the RDTI isn't arigid trading "system". It’s a tradingtool that has the potential to makeany investing method or approachmore accurate, more consistent, andmuch more reliable. For example...
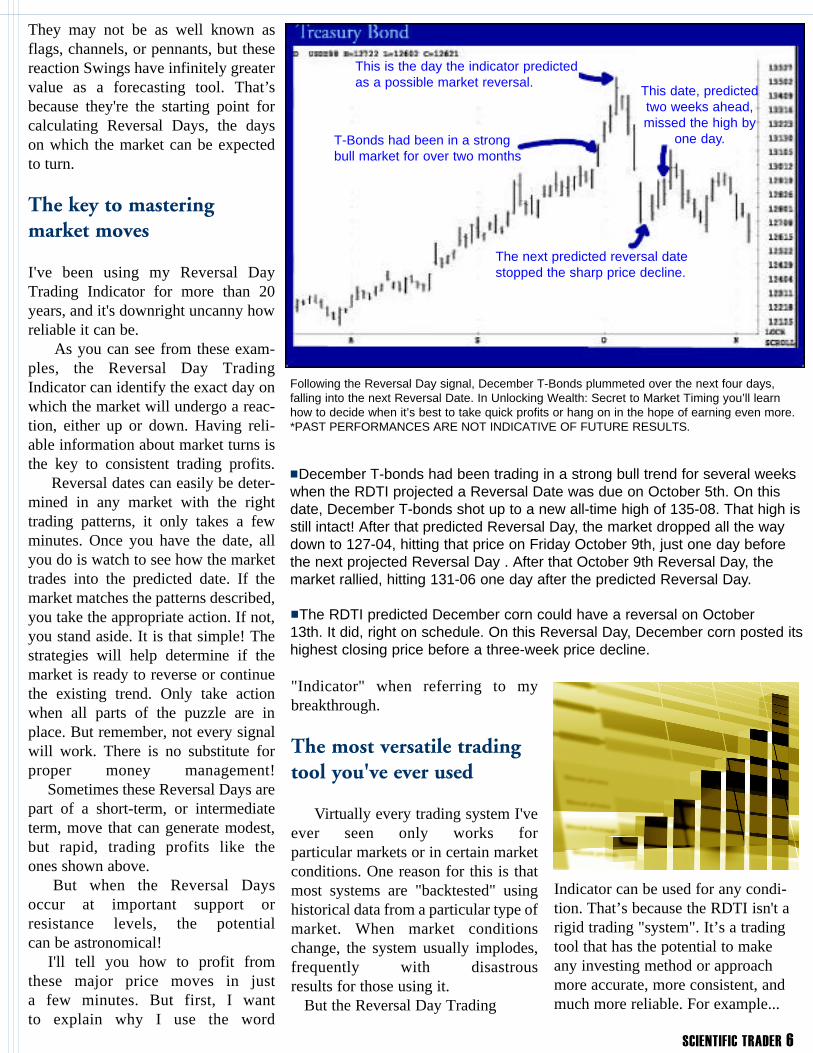
T-Bonds had been in a strongbull market for over two months
This is the day the indicator predictedas a possible market reversal.
The next predicted reversal datestopped the sharp price decline.
This date, predictedtwo weeks ahead,missed the high by
one day.
Following the Reversal Day signal, December T-Bonds plummeted over the next four days,falling into the next Reversal Date. In Unlocking Wealth: Secret to Market Timing you’ll learnhow to decide when it’s best to take quick profits or hang on in the hope of earning even more.*PAST PERFORMANCES ARE NOT INDICATIVE OF FUTURE RESULTS.
December T-bonds had been trading in a strong bull trend for several weekswhen the RDTI projected a Reversal Date was due on October 5th. On thisdate, December T-bonds shot up to a new all-time high of 135-08. That high isstill intact! After that predicted Reversal Day, the market dropped all the waydown to 127-04, hitting that price on Friday October 9th, just one day beforethe next projected Reversal Day . After that October 9th Reversal Day, themarket rallied, hitting 131-06 one day after the predicted Reversal Day.
The RDTI predicted December corn could have a reversal on October13th. It did, right on schedule. On this Reversal Day, December corn posted itshighest closing price before a three-week price decline.

If you use a 1-2-3 trading method, theRDTI will usually confirm a signalbefore the number three point is bro-ken. This allows you to enter the marketearlier and with greater confidence.
It will help to use the Commitment ofTraders Reports or open interests tolook at disparities between large and small traders.
The RDTI will also be a boon totraders using systems based on season-ality, since it helps to overcome theuncertainties imposed by weather,planting conditions and changing gov-ernment policies.
Bottom line: you don't need to learn anew trading method or abandon your
present system to use the Reversal DayTrading Indicator. My new book,Unlocking Wealth: Secret to MarketTiming (which I’ll tell you more aboutshortly), illustrates how to quickly andeasily integrate the RDTI with whatev-er trading system you're already using.
But what if you’re not using a tradingsystem or aren’t completely happy withthe one you currently have? No prob-lem, you can use the Reversal DayIndicator all by itself.
continued on page 8...
Meet John Crane John Crane grew up on a farm in
Idaho where, he remembers, therewasn't much to do on long winternights. So when he wasn't farming, heattended a course about commoditiestrading. Anxious to try out his newknowledge, he bought a hog contractand made enough money for a two week vacation to Mexico.
That was enough to get him hooked.He obtained his commodities license,opened a small firm with a friend, andbegan to study the markets in earnest.It was about this time that he firstheard about Gann, Elliott, Andrews,and other master traders, and beganconducting research on recurring patterns in the markets.
His next stop was a national broker-age in southern California, where hisresearch into seasonal tendencies andrecurring patterns in the marketscaught the attention of a nationallyknown research firm. Upon joiningthat firm, John’s research appeared inarticles in the Wall Street Journal,Investors Business Daily, Barrons,and Stocks and Commodities, pro-pelling him to national prominence virtually overnight.
In 1990, John became a partner inTraders Network, Inc., the Coloradobrokerage firm where he continues torefine his Reversal Day Indicator, thetrading tool that evolved from hisstudy of seasonality and market pat-terns, as well as the trading techniquesof Gann, Elliott, and Andrews.
SCIENTIFIC TRADER 7
The sharp rally endedon this date, predictedby the Reversal Day
Indicator.
This is when theforcast was made.
This was a move that caught most traders by suprise, except for those who use the ReversalDay Indicator. A reversal signal precedes a strong eight-day rally, as prices moved from 7788 to8852. In Unlocking Wealth; Secret to Market Timing, you’ll see other examples. *PAST PER-FORMANCES ARE NOT INDICATIVE OF FUTURE RESULTS
The RDTI signaled the December Dow Jones Industrial could bottom onctober 8th. It did, on that exact date. On this predetermined date, the marketposted a new low before a strong eight-day rally into the next predictedReversal Date of October 20th.
The RDTI said December wheat would have Reversal Dates on October20th, and October 26th, and it did. On October 20th, wheat posted its lowestclose before a rally right up to the next Reversal Day of October 26th. Thisdate proved to be the beginning of a 1-2-3 formation, confirming the top longbefore the market broke below the #2 point.
This is the day the
Indicator pre-dicted the
market couldturn - perfect!

Three “trade secrets”
During the 20 years I spent refining theReversal Day Trading Indicator, Ilooked at a lot of bar charts. After awhile, I began to realize that the samepatterns kept appearing whenever aReversal Day signaled a significantprice move.
For example, these patterns appeared...
In February 2009, when MarchJapanese yen plunged over 830 pointsin the 10 trading sessions following thepattern.When May Copper soared over 2100
points during an 11-day period inMarch 2009.When May Soybeans rallied $1.40
during the first two weeks of April 2009When the S&P 500 fell over 14.00
points during a two-week period in lateFebruary and early March of 2009.
These patterns operate together as asafe system to ensure you don't misscrucial market turns. If the first pattern
doesn't appear, you look for the second.If that one doesn't appear, you look forthe third.
In my new book Unlocking Wealth:Secret to Market Timing , I provideactual examples of each pattern, revealhow to spot them on your charts andexplain in detail how they work. Thebook also provides specific, plain-English rules for taking action whenone of these patterns appears. A single-page, easy-to-use checklist tells you:when to enter the market and what
kind of order to place.
where to set protective stops.
what action to take if certain price lev-els are attained.
I'll tell you how you can receive a no-risk copy of Unlocking Wealth: Secretto Market Timing in just a few minutes.But first, let me explain why theReversal Day Indicator is more impor-tant today than ever before, whetheryou use it alone or in conjunction witha trading system.
Cashing in today's "new"commodities markets
As I mentioned above, the ReversalDay Trading Indicator works withany type of market in any kind ofmarket - bull, bear, or trendless.That's particularly important in viewof how the market has changed inrecent years.
Today’s markets are more volatilethan ever. Because of a wide avail-ability of quote machines, computers,and other technological break-throughs that disseminate informa-tion almost instantly, we have manymore short-term swings as tradersmove in and out of the market, react-ing to this explosion of information.(Remember those Reaction Swings Itold you about earlier!)
Although volatility may wreak havocwith many traders, it's a powerful allyfor those who use the Reversal DayTrading Indicator to identify lucrativetrading opportunities that the typicalsystem simply can't spot.
SCIENTIFIC TRADER 8
Unlocking Wealth: Unlocking Wealth: Secret to Market TimingSecret to Market Timing
In Unlocking Wealth (278 pages), JohnCrane, a veteran trader and cofounder ofTraders Network, discusses his work withthe Action/Reaction trading theory, andillustrates a whole new way of using time,price, and patterns to predict, identify, andtrade future market swings. Chapter byinformative chapter, you’ll be introduced tothe concepts that encompass this provenmethod, including:
Market Behavior, Reaction swings, Swingtrading reaction swings, The Reactioncycle, Action and reaction lines, Enteringand exiting trades, Reversal dates, Long-term versus short-term trends, and more
ORDER YOUR COPY TODAY!1.) Call 1-800-521-0705 to order over the phone2.) Order online at www.tradersnetwork.com (click the ‘Store’ tab)

This kind of short-swing trading onlymakes sense if you can reliably, andconsistently, spot market turns in timeto take advantage of them. That's exact-ly what the Reversal Day TradingIndicator can help you do.
Because it's completely objective, theRDTI forces you to have discipline. Ifthe patterns don't occur, you don't makethe trade. No, it's not foolproof, butwhat in life is? It can, however, beuncanny in predicting market turningpoints.
But why take my word for it when youcan see for yourself, without risk orobligation!
Spotting market turns is simpleonce you know how.
Take the Traders Challenge& prove this scientific break-through really works...
without risking a CENT!
The 7 Easiest Ways To Lose The 7 Easiest Ways To Lose Money TradingMoney Trading
More than 90% of commodities traders lose half their capital within theirfirst year. Although the reasons vary from person to person, the followingseven crop up with disconcerting regularity:
Losing Strategy #1: Don't use stops. Some traders seem to think that notusing stops is "gutsy". But successful traders know otherwise. Stops limityour potential loss and protect profits. Establish realistic stops when you puton a trade, then adjust them as market conditions change.
Losing Strategy #2: Cancel stops when the price approaches that level. If you“wait a little longer" to bail out of a losing trade, all you’re doing is addingto your losses. That defeats the whole idea of using stops.
Losing Strategy #3: Base investment decisions on hunches and "hot" tips. It’sbelieved that 60% to 70% of traders are guilty of this, if only occasionally.But, remember, without good money management, it only takes one losingtrade to wipe out profits from a string of winners.
Losing Strategy #4: Fail to establish objectives. Before you put on a trade,you should know how much profit you anticipate making and how much lossyou're willing to accept. If you don't, you're like a driver who doesn't knowwhere he’s going...you'll never get where you want to be.
Losing Strategy #5: Don't have a contingency plan. Many investors knowwhat they intend to do if the market moves as they anticipate. A significantpercentage, unfortunately, don't know what to do if their basic premise turnsout to be incorrect. If you haven't planned for that eventuality, you haven'treally planned at all.
Losing Strategy #6: Deviate from an approach that works. You'd be amazedat the number of traders who make solid profits using a particular approach,only to lose their shirt when they got greedy and deviated from the strategyin order to make a “big killing". If it works, have the discipline to stick withit.
Losing Strategy #7: Rely slavishly on a system that's stopped working. Aswe saw on page 8, most systems don't work over the long haul. If marketconditions cause your trading system to stop working, switch systems, don'tkeep piling up losses. This isn't discipline, it’s financial suicide.
The Reversal Day Trading Indicator isn't a "system". It’s a trading tool thatcan help prevent you from making mistakes like those listed above.
SCIENTIFIC TRADER 9
By Patrick J. Malone,INVESTORS NEWS SERVICE
During the early years of the 20thcentury, William D. Gann built a repu-tation for being able to pinpoint mar-ket turning points with incredibleaccuracy. Although he made thousandsof forecasts, his prediction about theprice of September wheat is probablythe most memorable.
On September 21, 1909 when wheatwas trading at $1.05 a bushel, Gannpredicted it would trade at $1.20 on orbefore September 30th, the contractexpiration date. By September 30th,wheat had inched up to $1.08, butseemed stuck at that level.
As the day wore on with wheat stillfar below $1.20, a crowd gathered towitness the downfall of a man whowas worshipped by some and despisedby others. "I don't care what the priceis now", he told his critics. "It must goto $1.20." And minutes before the con-tract expired, September wheat sud-denly soared to $1.20 and closed atthat price.
His critics were stunned, but Gannmerely smiled. "The future is nothingbut a repetition of the past", he told areporter. "Everything moves in cyclesas a result of the natural law of actionand reaction".
1000% profit in a single month!
The following month, The Tickerand Investment Digest (the forerunnerof today's Wall Street Magazine) dis-patched a top reporter to follow Gannand record his activities. In a subse-quent issue, the magazine reported:"During the month of October 1909,during 25 market days, Mr. Gannmade, in the presence of our represen-tative, 286 transactions on both thelong and short side of the market. Ofthese transactions, 264 resulted inprofits, and 22 in losses."
The article went on to say:"We haveseen him give, in one day, 16 succes-sive orders...eight of which turned outto be either to the top or bottom eightof that particular swing."
Although it’s clear that Gann had anextraordinary ability to time turns, noone has even been able to determinethe full extent of his financial success.He is reputed to have made more than$50 million in trading profits prior tohis death in 1954, but it’s unclearwhether that number is accurate.
The article in The Ticker, however,sheds some light on the profitability ofGann's trading tactics. The magazinereported that during the month ofOctober 1909, "the capital with whichhe operated had doubled 10 times sothat at the end of the month he had1,000% of his original margin." Withreturns like that, $50 million may wellbe a conservative estimate of Gann’slifetime earnings.
The key to Gann's success
Shortly after his October 1909 demon-stration, Gann revealed the underlyingconcepts of his trading tactics. In anarticle published in The Ticker, Ganncompared stocks and commodities toatoms, pointing out that they're all"centers of energy" that are "controlledmathematically".
Gann went on to say that investments"create their own field of action andpower, power to attract and repel."According to Gann, this explains whycertain stocks and commodities leadthe market at times, only to trail it atothers.
Many people pressed Gann for amore complete explanation of his trad-ing techniques, but he refused todivulge details about how he was ableto generate such incredibly accuratepredictions. A few years later, Gannrelented and began to slowly parcelout details of his trading methods inarticles and training courses.
Shortly thereafter, he left the broker-age business to start an advisory serv-ice. Gann purchased a plane and beganto travel extensively, frequently flyingto cities around the country to teachhis tactics to traders who were willingto pay huge fees (even during theheight of the Depression!) to learn hissecrets.
From science to speculation
During his years of trading and teach-ing, Gann never deviated from hisbasic premise that commodities (andstocks) follow a natural pattern ofaction and reaction. But because hefrequently failed to provide as muchdetail as people wanted, or presentedhis concepts so obliquely, commenta-tors began to interpret his teachings.
Unfortunately, in doing so, manyintroduced ideas that appear to springmore from their own imaginations ...
SCIENTIFIC TRADER 10
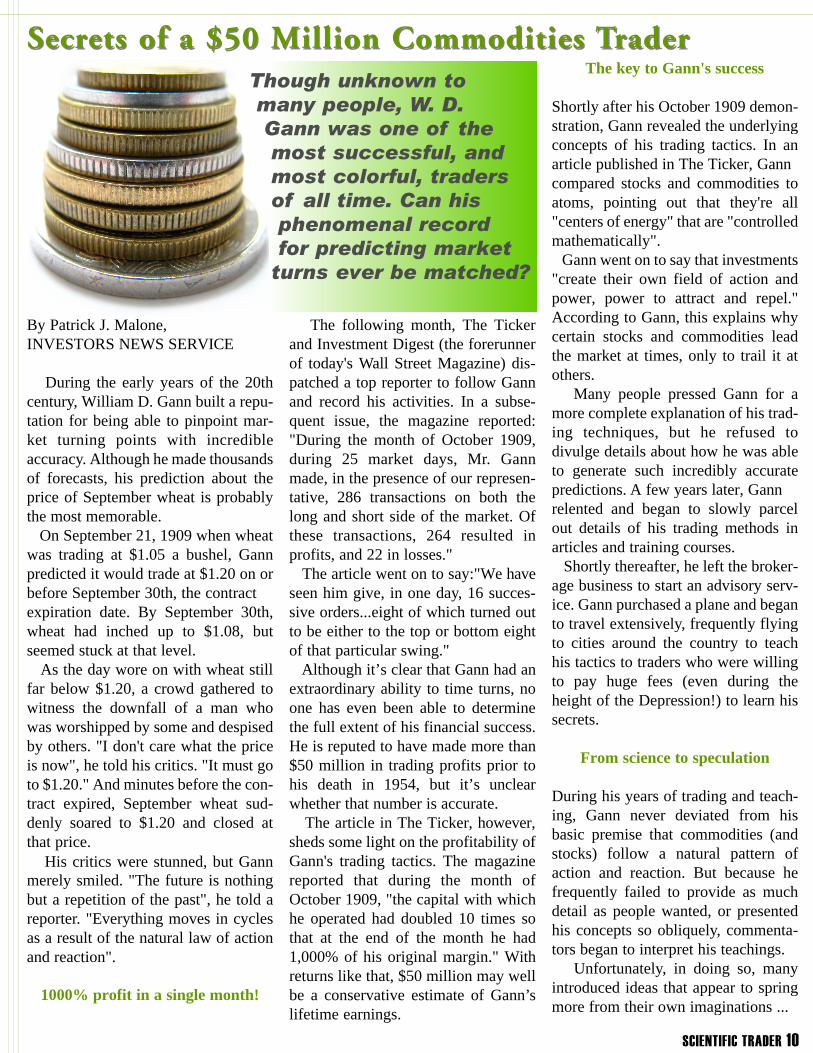
Secrets of a $50 Million Commodities TraderSecrets of a $50 Million Commodities TraderThough unknown to many people, W. D. Gann was one of the most successful, and most colorful, traders of all time. Can his phenomenal record for predicting market
turns ever be matched?
than from Gann's proven strategies.These interpretations are, however,
just that, interpretations. Gann himselfmaintained that his trading tactics werebased on scientific and mathematicalprinciples. He did, however, set a stagefor some of the more imaginativeinterpretations of his work by con-structing charts that have long tanta-lized, mystified and infuriatedresearchers.
These number arrays, which appearto be a type of calculator for plottingcycles, were reputed to have been usedby Gann for his own trading activities.Unfortunately, it's unclear exactly howhe used these mysterious charts.
What is clear, however, is that Gann'ssuccess can be traced to the basicpremise that markets are controlled bynatural cycles that endlessly repeat.Moreover, we know that his tradingtechnique was a purely mathematicalapproach, devoid of the less scientificinterpretations that were later added bycommentators.
A worthy successor to Gann
John Crane's Reversal Day TradingIndicator is similar to Gann’s approachin two important respects. For starters,it’s based on the same underlying con-cept that the markets have a naturalrhythm that can be used to predictfuture turning points. Secondly,Crane’s indicator is purely mathemati-cal with all trading decisions based ona simple calculation.
Whether the Reversal Day Indicatorturns out to be as successful as Gann'stechnique remains to be seen. But theTraders Challenge (see page 16) givesserious traders an opportunity to put itto the test without risking a penny.Crane may not be as colorful as thelegendary W.D. Gann, but he seemsequally confident in his Indicator'sability to accurately predict marketturns.
SCIENTIFIC TRADER 11
Trading From the Inside: Trading From the Inside: Strategies of aStrategies of a
Professional traderProfessional trader
You don´t have to be a Wall Street insiderto trade like one. This book (236 pages) isa must read for every commodity trader.Learn how to read charts and technicalindicators, such as Gann Lines and chartformations. Gain understanding of tradingfundamentals and psychology. Also, readabout wit and war stories that will help youdevelop proper trading skills.
What are traders saying about it...
"I've since, reading Joe Kellogg's book,made more money and felt more confidentin my trading than ever before." -M. Kozoriz
"I find it concise and direct, helpful as a refresher and a good study for thebeginner." -W. Martin
ORDER YOUR COPY TODAY!1.) Call 1-800-521-0705 to order over the phone2.) Order online at www.tradersnetwork.com (click the ‘Store’ tab)
REVERSALAHEAD
The Reversal Day TradingIndicator provides 7 important benefits no trading system
or method can deliver...
BENEFIT #1: The RDTI worksfor any in any type of marketcondition.
BENEFIT #2: It can be used inconjunction with virtually anytrading method- or you can useit by itself.
BENEFIT #3: You can use theIndicator to find entry and exitpoints for both short-term andlong-term traders.
BENEFIT #4: The Indicator isfast and easy to use.Everything you need to know isincluded in my book.
BENEFIT #5: You can use theIndicator to determine where toput stops, and when (and how)to adjust them.
BENEFIT #6: The RDTI clearlysignals when it is best to stayout of the market.
BENEFIT #7: The Indicatoruses the markets internalAction/Reaction patterns,rather than relying on less reli-able external factors.

By J. William Roberts,Contributing Editor, THE SCIENTIFIC TRADER
I have to ask this question, so let’sget it out of the way up front: If yourindicator is as good as you say it is,why share it with other traders?Won't you be cutting into your owntrading profits?
Commodities markets are so big it'svirtually impossible for any indicator,system, or method, regardless of howgood it is, to really have much impacton the overall market. For example,the average daily volume for all stockson the NYSE is about $3 billion. Theaverage daily volume for a single com-modity- T-bonds, exceeds $3.5 billion.Factor in all the other commoditiesbeing traded, and you can quickly real-ize there are plenty of markets to goaround.
When did you first start using theReversal Day Trading Indicator?
I didn't wake up one morning withthe idea for the Indicator as it existstoday. I've been using it in one form oranother for the last 20 years, constant-ly refining it to make it more accurate.How much more accurate can you get?After all, your Indicator is capable ofpinpointing the exact day of anupcoming market turn.
Yes, in that respect, the Reversal DayIndicator is pretty darned accurate, butI'm only able to achieve that degree ofaccuracy about three to four weeksinto the future. When I go beyondthat, the Indicator becomes less reli-able. I'd like to get to the point where Ican reliably predict market turnsmonths in advance, the way Gann did.
May I assume, by your reference toGann, that the Reversal Day
Indicator is based on his theories?
I don't put much stock in some ofGann's more esoteric ideas, but I dothink he was 100% correct in hisobservation that the markets run incycles, that history is constantlyrepeating itself. Once you learn to spotthose cycles, you can use data aboutthe past to help predict what's going tohappen in the future. (for more infor-mation about Gann see page 10)
But aren't today’s markets radicallydifferent than the market in Gann'stime?
There are big differences in how wetrade. After all, we have advancedcomputer analytical software andother technological innovations Ganndidn't have access to in his day. Yet,
the markets themselves have changedfar less than most people realize. Forexample, look at cotton, a commodityfor which we have price records datingback hundreds of years. Cotton peakedat $1.89 a pound in 1865, at the end ofthe Civil War. In the 1970's, a decademarked by double digit inflation, thehighest recorded price for cotton wasonly 99 cents. What commodities mar-kets have is an internal consistencythat defies external factors like infla-tion, population growth, etc. Once youlearn to spot the patterns, future pricemoves become obvious.
So your Reversal Day Indicator isbased on recognizing patterns?
Yes, but not the way that most trad-ing systems use patterns. TheIndicator's patterns aren't subjective,
SCIENTIFIC TRADER 12
“It’s not magic, it’s science.”“It’s not magic, it’s science.”An exclusive interview with John Crane, discoverer of the Reversal Day Trading Indicator
Traders Market ViewsTraders Market ViewsNewsletterNewsletter
Over 20 years in publication: TradersMarket Views; published three times aweek, is packed with timely marketinsight and recommendations.
The Reversal Date section, written byJohn Crane, is the shorter-term view ofthe market and is based on Mr. Crane’sprinciple, described in his best sellingbook, Unlocking Wealth: Secret toMarket Timing.
The Market Scoop section, written by Joseph Kellogg, is the longerview of the market and is based on his highly acclaimed book,Trading From the Inside.
With the newsletter you also gain web access to John Crane’s exclu-sive nightly Reversal Date updates and recommendations!
If you’re not already receiving the newsletter get set up today:1. Call 1-800-521-0705 to subscribe or set up a 2-month free trial2. Visit: www.tradersnetwork.com

they're objective. You find them not byguessing where lines should be drawnon a chart, but by doing a handfulof simple calculations.
The trades featured in the ScientificTrader all look very good. Does thismean all the Reversal Dates will givesignals as incredible as these?
These trades were picked as illustra-tion purposes only. Not all ReversalDates will give trading signals. That iswhere the price patterns come in, tohelp filter out the non-signals. Evenafter a signal is generated, it is up tothe individual trader how they will fol-low through on the trade. I havelearned through years of experiencethat you can have five individuals fol-lowing the exact same trading programand get five different results.Everybody trades the market different-
ly. Some traders like to trade short-term, while others like the long-termapproach. The Reversal Date Indicatormay generate a great signal, but it is upto the trader to have the discipline tofollow through with the plan.
Remember, great entry and exit sig-nals are not a substitute for goodmoney management. Great traders willalways tell you money management isvital to the success of any investor.
It sounds too easy.
You're right, it does sound too easy, butit works. Traders using the Indicatorfor the first time think it’s magical theway it zeros in on the specific day. Butit’s not magic, it’s science. That's whyI came up with my Trader’s Challenge.Once people see how the Reversal DayIndicator predicts market turns, they'llnever trade without it again.
SCIENTIFIC TRADER 13
The Reversal Tracker is purely a technical trading program that uses time,price, and pattern to project future market swings and to identify well-timedmarket entry and exit points, based on the software´s projections.
Money management must be a key element of your trading arsenal and theReversal Tracker has that element built right in to the software.
Many trading programs attempt to project market movement based on indi-cators such as moving averages, RSI, stochastic and moving average conver-gence divergence. The approach is problematic because they are lagging indi-cators. Those systems tell us what the market has already done, but fall shortin predicting future movement.
The Reversal Tracker is different because it´s a leading indicator. It uses atime/price mathematical formula to project specific reversal points, future
time-lines for market directionalchange, or where trend acceleration islikely to occur.
There are many programs dedicatedto pattern recognition and price reval-uation, but few programs focus ontime. Yet, timing is the most criticalelement of all, without which success-ful trading would be impossible toachieve. John Crane understood thatwhen he began developing hisReversal methodology over 20 yearsago. The Reversal Tracker softwareencapsulates that knowledge. Armedwith this market specific timing,Reversal Tracker gains the edge.
MORE INFORMATION AT:
www.www.reversaltrackerreversaltracker .com.com
If you’re not already signed upfor a 2-week free trial:
1. Call 1-800-521-0705 2. Visit: www.reversaltracker.com
You Already Predict The Future....With Incredible Accuracy!
You predict the future on a regular basisand think nothing of it!
For example, you can predict, withdeadly accuracy, the exact date of thenext full moon or the exact time oftoday’s sunset and tomorrow's sunrise...and literally thousands of seemingly ran-dom variables that, in reality, follow anatural pattern or progression.
People who balk at the idea of predict-ing future movements of commoditiesprices fail to realize that prices, like theflowing of the tide and the setting of thesun, follow a natural cycle. Once youunderstand that cycle, predicting theprice of corn can be as straight forwardas predicting the date of the next fullmoon.
That's exactly what the Reversal DayIndicator does. It’s really nothing morethan a tool that "decodes" past actions topredict future ones.
Why Most Trading Systems JustDon't Work!
There are hundreds of systems, methods and approachesfor trading commodities. Unfortunately, the vast majoritysimply don't work over the long haul, for one of the fol-lowing reasons:
Reason #1: They use lagging indicators . Systems that rely on laggingindicators like moving averages, relative strength indices,or stochastics don't signal a buy or sell until after most ofthe price moves have been realized. That's because they'recollecting the data needed to "forecast" a price move evenas the move is taking place. Yes, they work occasionally,but not for the reasons their proponents cite. The ReversalDay Trading Indicator, on the other hand, gets you in andout of the market much faster because it’s based on lead-ing indicators.
Reason #2: They're based on pie-in-the sky ideas instead of hard sci-ence. We've all seen so-called trading systems based onastrology, the number of steps in Egyptian pyramids andany number of other silly ideas. You can dress up thesesystems and provide a convoluted explanation of whythey supposedly work, but the fact remains that they're notgrounded in hard science. The Reversal Day Indicator,however, uses natural cycles within the market. Once youknow how to spot them, it's easy to tell where the marketis likely to go next.
Reason #3:They only work under certain market conditions. Mosttrading systems are "invented" by backtiming with histori-cal data. This almost invariably results in a system thatworks in a particular kind of market climate representedby that data. Unfortunately, when market conditionschange, the data is no longer applicable, and the systemstops working.
The Reversal Day Indicator is a breakthrough trading toolthat has the potential to make virtually any trading systemyou're currently using more accurate and reliable. You canalso use the Indicator all by itself to pinpoint the exactdays on which the market is expected to turn.
SCIENTIFIC TRADER 14
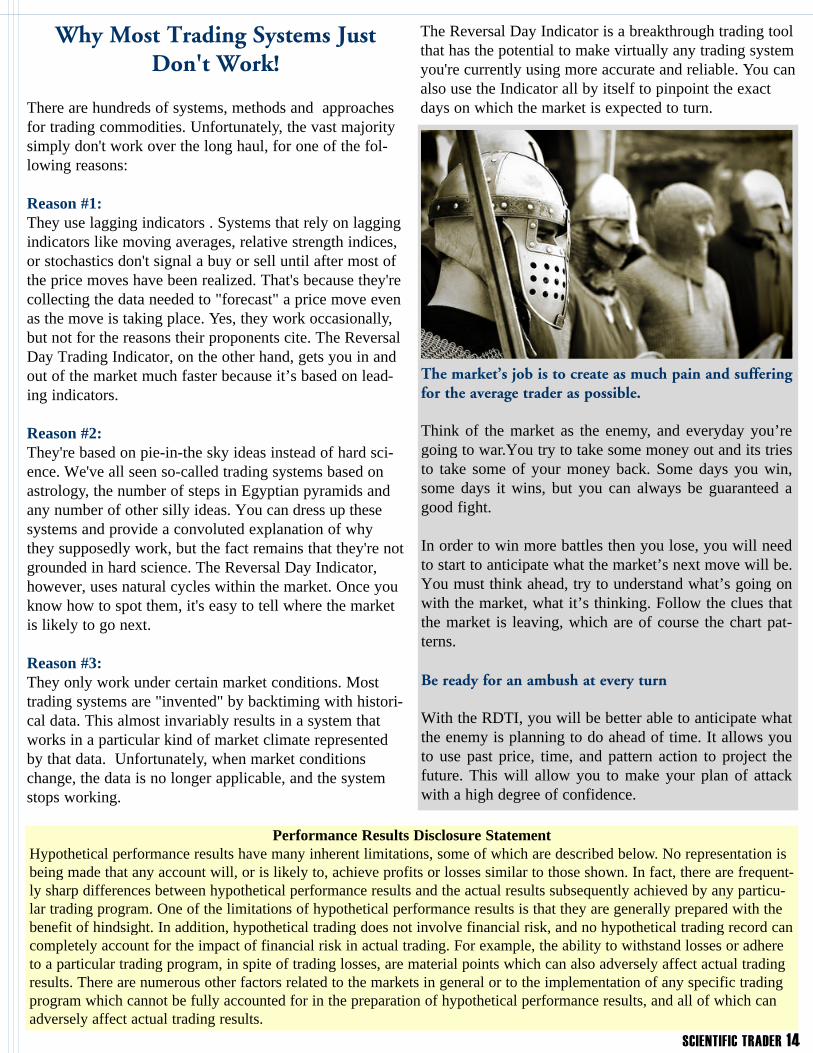
The market’s job is to create as much pain and sufferingfor the average trader as possible.
Think of the market as the enemy, and everyday you’regoing to war.You try to take some money out and its triesto take some of your money back. Some days you win,some days it wins, but you can always be guaranteed agood fight.
In order to win more battles then you lose, you will needto start to anticipate what the market’s next move will be.You must think ahead, try to understand what’s going onwith the market, what it’s thinking. Follow the clues thatthe market is leaving, which are of course the chart pat-terns.
Be ready for an ambush at every turn
With the RDTI, you will be better able to anticipate whatthe enemy is planning to do ahead of time. It allows youto use past price, time, and pattern action to project thefuture. This will allow you to make your plan of attackwith a high degree of confidence.
Performance Results Disclosure StatementHypothetical performance results have many inherent limitations, some of which are described below. No representation isbeing made that any account will, or is likely to, achieve profits or losses similar to those shown. In fact, there are frequent-ly sharp differences between hypothetical performance results and the actual results subsequently achieved by any particu-lar trading program. One of the limitations of hypothetical performance results is that they are generally prepared with thebenefit of hindsight. In addition, hypothetical trading does not involve financial risk, and no hypothetical trading record cancompletely account for the impact of financial risk in actual trading. For example, the ability to withstand losses or adhereto a particular trading program, in spite of trading losses, are material points which can also adversely affect actual tradingresults. There are numerous other factors related to the markets in general or to the implementation of any specific tradingprogram which cannot be fully accounted for in the preparation of hypothetical performance results, and all of which canadversely affect actual trading results.
Take the Trader’s ChallengeSet up two portfolios for paper trading. Trade one portfolio using the Reversal Day Indicator by itself,or in conjunction with your present trading system. Trade the second portfolio using just your currentsystem. At the end of 60 days, you will be completely blown away by how much better you tradedusing the Reversal Day Indicator.
FOLLOW THESE SIMPLE STEPS TO GET STARTED:
1. Read my book, Unlocking Wealth: Secret to Market Timing, which provides a plain-English expla-nation of exactly how to use this Indicator to become a better, more accurate commodities trader.(Book can be purchased with a 30-day money back guarantee at www.tradersnetwork.com - click onstore OR call 1-800-521-0705)
2. Follow the Traders Market Views newsletter for two months free. The newsletter is emailed threetimes a week. Call to set up your free trial: 1-800-521-0705. The newsletter will walk you through themost important concepts in Unlocking Weath and explain the key points, and keep you updated on allupcoming Reversal Dates and Market Scoop.
3. Two months of unlimited consultations with a commodities expert at Traders Network. Ask asmany questions as needed to develop your trading skills. Also, open up an over the phone papertrad-ing account.
4. Watch John Crane’s Swing Trading DVD, which will help you identify, weeks ahead of time, whenthe market is due for a reversal. (DVD can be purchased with a 30 day money back gurantee atwww.tradersnetwork.com - click on store OR call 1-800-521-0705)
5. At the end of 30 days, compare the results of your two portfolios. If you aren't completely blownaway by how much better you traded with the Indicator, simply return everything for a full refund ofevery penny you paid.
This is your golden opportunity to test the Reversal Day Trading Indicator without risking a penny.Once you see it in action, you'll never again trade commodities without it!
Cordially,
John Crane
SCIENTIFIC TRADER 15