Embed Size (px)
Citation preview
Trade summary charts and tables

Figure 16.1: Industry shares of GDP
29 7 7
59
210 6 7
61
0
20
40
60
80
Agriculture,forestry and
fishing
Mining Manufacturing Building andconstruction
Services
Per c
ent
2010–11 2020–21
GDP: $1581 b
GDP: $1976 b
Source: ABS (2021) Australian National Accounts, National Income, Expenditure & Production, 5204.0
Figure 16.2: Principal markets for Australia’s resources and energy exports, 2021–22 dollars
28
1422
10 116 8
1
48
13 12 10 7 5 4 20
10
20
30
40
50
60
China Other Japan OtherAsia
SouthKorea
EU India UnitedStates
Per c
ent
2010–11 2020–21
Exports: $315 b
Exports: $223 b
Source: ABS (2021) International Trade in Goods and Services, 5368.0
Figure 16.3: Principal markets for Australia’s resources exports, 2021–22 dollars
38
188 13 9 5 6 3
59
13 9 5 6 6 1 10
20
40
60
80
China Other OtherAsia
Japan SouthKorea
EU India Thailand
Per c
ent
2010–11 2020–21
Exports: $137 b
Exports: $232 b
Source: ABS (2021) International Trade in Goods and Services, 5368.0
Figure 16.4: Principal markets for Australia’s energy exports, 2021–22 dollars
40
13 147
11 9 6
31
17 14 13 11 113
0
20
40
60
Japan China OtherAsia
Other SouthKorea
India EU
Per c
ent
2011–12 2020–21
Exports: $84 b
Exports: $83 b
Source: ABS (2021) International Trade in Goods and Services, 5368.0
155Resources and Energy Quarterly September 2021

Figure 16.5: Principal markets for Australia's total exports, 2021–22 dollars
2318
8 8 5 4 4
30
39
147 5 4 3 3
25
0
20
40
60
China Japan SouthKorea
India UnitedStates
HongKong
NewZealand
Source: ABS (2021) International Trade in Goods and Services, 5368.0
Figure 16.6: Australia's total imports by country of origin, 2021–22 dollars
1811 9 6 5 5
46
27
126 5 5 4
41
0
20
40
60
China UnitedStates
Japan SouthKorea
Thailand Germany Other
Per c
ent
2010–11 2020–21
Imports: $256 b
Imports: $309 b
Source: ABS (2021) International Trade in Goods and Services, 5368.0
Figure 16.7: Proportion of goods and services exports by sector
12
55
1222
10
58
1121
10
60
1119
10
66
11 13
0
20
40
60
80
Rural Mineralresources
Othermerchandise
Services
Per c
ent
2017–18 2018–19 2019–20 2020–21
Source: ABS (2021) Balance of Payments and International Investment Position, 5302.0
Figure 16.8: Proportion of merchandise exports by sector
15
70
1513
73
1412
74
1412
76
13
0
20
40
60
80
Rural Mineral resources Other merchandise
Per c
ent
2017–18 2018–19 2019–20 2020–21
Source: ABS (2021) Balance of Payments and International Investment Position, 5302.0
Other
Per c
ent
2010–11 2020–21
Exports: $294 b
Exports: $396 b
156Resources and Energy Quarterly September 2021

Table 16.1: Principal markets for Australia’s thermal coal exports, 2021–22 dollars
Unit 2016–17 2017–18 2018–19 2019–20 2020–21
Japan $m 7,438 8,783 10,322 8,643 7,121
South Korea $m 2,742 2,735 3,118 2,944 2,612
Taiwan $m 1,713 2,410 2,697 2,470 2,107
Vietnam $m 108 156 134 1,078 725
Malaysia $m 534 687 784 553 570
Thailand $m 341 310 389 447 528
Total $m 20,548 24,089 27,237 21,097 16,279
Source: ABS (2021) International Trade in Goods and Services, 5368.0
Table 16.2: Principal markets for Australia’s metallurgical coal exports, 2021–22 dollars
Unit 2016–17 2017–18 2018–19 2019–20 2020–21
India $m 5,014 8,926 9,950 7,755 7,742
Japan $m 4,741 7,401 7,622 6,300 4,859
South Korea $m 2,269 3,934 3,848 3,141 2,776
China $m 4,213 8,163 8,789 10,123 1,700
Taiwan $m 1,056 1,943 2,028 2,064 1,359
Netherlands $m 994 2,012 1,880 1,285 945
Total $m 38,413 40,308 45,786 35,458 23,801
Source: ABS (2021) International Trade in Goods and Services, 5368.0
157Resources and Energy Quarterly September 2021
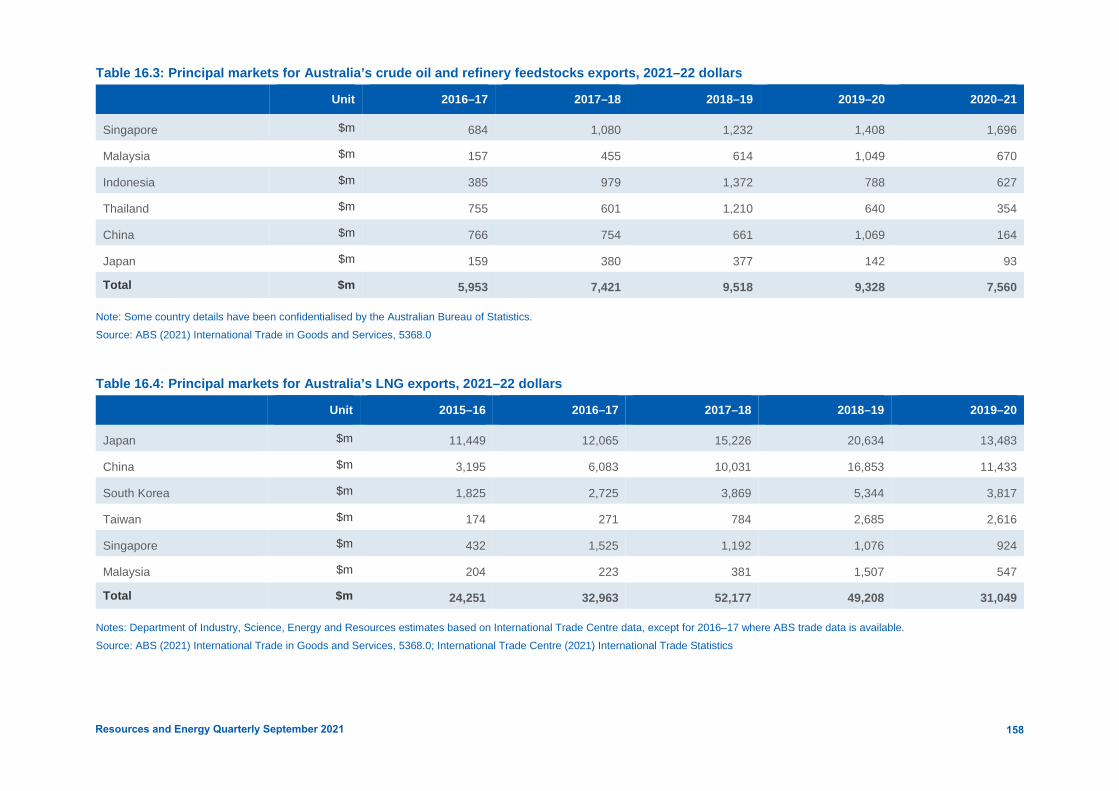
Table 16.3: Principal markets for Australia’s crude oil and refinery feedstocks exports, 2021–22 dollars
Unit 2016–17 2017–18 2018–19 2019–20 2020–21
Singapore $m 684 1,080 1,232 1,408 1,696
Malaysia $m 157 455 614 1,049 670
Indonesia $m 385 979 1,372 788 627
Thailand $m 755 601 1,210 640 354
China $m 766 754 661 1,069 164
Japan $m 159 380 377 142 93
Total $m 5,953 7,421 9,518 9,328 7,560
Note: Some country details have been confidentialised by the Australian Bureau of Statistics. Source: ABS (2021) International Trade in Goods and Services, 5368.0
Table 16.4: Principal markets for Australia’s LNG exports, 2021–22 dollars
Unit 2015–16 2016–17 2017–18 2018–19 2019–20
Japan $m 11,449 12,065 15,226 20,634 13,483
China $m 3,195 6,083 10,031 16,853 11,433
South Korea $m 1,825 2,725 3,869 5,344 3,817
Taiwan $m 174 271 784 2,685 2,616
Singapore $m 432 1,525 1,192 1,076 924
Malaysia $m 204 223 381 1,507 547
Total $m 24,251 32,963 52,177 49,208 31,049
Notes: Department of Industry, Science, Energy and Resources estimates based on International Trade Centre data, except for 2016–17 where ABS trade data is available. Source: ABS (2021) International Trade in Goods and Services, 5368.0; International Trade Centre (2021) International Trade Statistics
158Resources and Energy Quarterly September 2021

Table 16.5: Principal markets for Australia’s iron ore exports, 2021–22 dollars
Unit 2016–17 2017–18 2018–19 2019–20 2020–21
China $m 42,154 54,966 52,587 87,790 126,822
South Korea $m 3,319 4,168 3,784 6,442 9,219
Japan $m 5,090 5,745 5,594 7,287 9,211
Taiwan $m 1,110 1,527 1,296 1,942 3,126
Indonesia $m 59 46 47 28 41
India $m 7 6 314 21 10
Total $m 68,073 65,477 81,373 106,505 155,475
Source: ABS (2021) International Trade in Goods and Services, 5368.0
Table 16.6: Principal markets for Australia’s aluminium exports, 2021–22 dollars
Unit 2016–17 2017–18 2018–19 2019–20 2020–21
Japan $m 757 994 1,441 1,052 965
South Korea $m 1,212 790 885 1,179 921
Taiwan $m 324 220 343 373 421
Thailand $m 292 328 392 300 355
United States $m 20 136 194 255 261
China $m 102 54 35 30 119
Total $m 3,443 4,280 4,371 3,823 3,818
Source: ABS (2021) International Trade in Goods and Services, 5368.0
159Resources and Energy Quarterly September 2021

Table 16.7: Principal markets for Australia’s copper exports, 2021–22 dollars
Unit 2016–17 2017–18 2018–19 2019–20 2020–21
China $m 3,899 2,877 3,953 3,921 2,784
South Korea $m 533 476 305 674 1,358
Malaysia $m 671 917 913 853 865
India $m 558 728 879 479 646
Japan $m 1,552 1,446 1,600 2,201 17
Philippines $m 239 423 175 373 0
Total $m 8,228 9,013 10,251 10,570 11,645
Source: ABS (2021) International Trade in Goods and Services, 5368.0
Table 16.8: Principal markets for Australia’s gold exports, 2021–22 dollars
Unit 2016–17 2017–18 2018–19 2019–20 2020–21
United Kingdom $m 4,282 4,173 3,430 13,157 9,102
United States $m 160 157 77 3,188 4,012
Singapore $m 1,300 326 1,214 1,473 2,988
China $m 7,117 2,474 3,083 853 2,066
Switzerland $m 781 1,010 1,149 1,966 1,924
India $m 745 437 768 69 1,502
Total $m 20,632 20,576 19,796 25,258 26,601
Source: ABS (2021) International Trade in Goods and Services, 5368.0
160Resources and Energy Quarterly September 2021