Embed Size (px)
Citation preview

Draft Paper
1
Recent Trade Patterns and Modes of Supply in Computer and
Information Services in United States and NAFTA
There are known knowns. There are things we know that we know. There are known unknowns. That is to say, there
are things that we now know we don’t know. But there are also unknown unknowns. There are things we do not
know we don’t know.
Donald Rumsfeld, Pentagon Briefing February 12th 2002 I Introduction
The aim of this paper is to describe developments in US and regional NAFTA trade patterns in Computer and Information services (C&IS) in recent years with particular emphasis given to illuminating the relative importance and trends in different modes of supply of C&IS. Due to superior data availability, the majority of the paper will concern the United States.
The study of C&IS trade warrants attention due to C&IS’s general characteristics as an enabling technology, which as input to other sectors and products have been found to positively affect productivity in the US1. Secondly, C&IS trade is intuitively among the most digitizable of commercial services and accordingly can be expected to be perhaps the most internationally tradable among commercial service categories. Investigating C&IS trade trends might therefore reveal early results relevant for also other less immediately digitizable commercial services.
Analyzing specifically US C&IS trade by mode of supply is appealing for several
reasons; The IT services industry is among the most globalized of all services industries and US IT services companies are globally dominant and thus make up the majority of the world’s top companies in this industry category2. The commercial activity and strategies of the US IT services industry can therefore with reasonable certainty be viewed as indicative of where the global IT services industry is heading. Even allowing for today’s huge global scale advantage for the incumbent US IT services industry, it is a sensible benchmark for global trends in the industry. Furthermore, US government statistical agencies produce the most comprehensive statistical coverage of this industry in the world. As such, the analysis of the US IT services industry can be made much more elaborate than is possible for other countries.
The availability of more detailed data on C&IS trade in the US will in this paper be
utilized to carry out a mode of supply analysis which to the greatest extent possible adheres to the definitions of modes of supply in the 2002 Manual on Statistics of International Trade in Services (MSITS)3. This will be particularly relevant in the analysis of mode 3, where this paper will be able to adopt a very narrow and targeted definition of “commercial presence” closely aligned with the traditional mode 1 definition of C&IS trade. In addition mode 3 will be
1 See for instance Oliner, Sichel and Stiroh (2007) and Jurgenson, Ho and Stiroh (2007). 2 OECD (2006) tables 1.A1.4 and 1.A1.5. shows how US firms make up nine of the global top-ten IT services firms in 2005 (the registration for tax purposes of Accenture in Bermuda is disregarded here) and eight of the global top-10 software companies in 2005. 3 The MSITS was a joint publication by the UN, IMF, OECD, UNCTAD, European Commission and WTO.

Draft Paper
2
quantified using data on local market sales by foreign affiliates, rather than the in the literature commonly used proxy of FDI stock and flow data. Hereby the mode 3 trade data utilized in this paper will possess enhanced definitional validity, although this will come partially at the expense of the number of available data points.
The superiority of available relevant data from US official sources extends to mode 4
trade. This paper will introduce a new methodology utilizing wage and occupational data for temporary immigrants to the US from the US Department of Homeland Security to attempt to quantify and approximate US mode 4 C&IS import trade.
C&IS trade is generally considered among the least restricted categories under the GATS agreement. This paper will briefly illustrate explicit sectoral trade barriers and investigate the types, scope and importance of domestic regulation for C&IS trade by modes of supply in the US and elsewhere. This paper will further analyze the impact of NAFTA on regional trade in C&IS. This paper is structured as follows. Given the importance of methodological and statistical concerns, Section II at the beginning discusses the numerous data limitations and caveats relevant for the analysis of C&IS trade by modes of supply, as well as identifies the specific data categories chosen for analysis in this paper. Section III describes the most recent trends in aggregate US C&IS trade in modes 1 and 3, estimates Revealed Comparative Advantages (RCA) for US C&IS trade by modes of supply, and analyzes bilateral differences in C&IS trade and the relative importance of modes of supply in bilateral trade. Section IV covers the impact of explicit GATS barriers to C&IS trade, as well as the impact on trade by US domestic regulations with an emphasis on national security concerns. Section V introduces a new methodology for estimating and evaluating the scope of US C&IS trade in mode 4 and considers the impact on C&IS mode 4 trade by US immigration laws. Section VI presents estimates for the relative importance of all modes of supply in US C&IS trade and makes comparison with other studies hereof in the literature. Section VII explores the impact of NAFTA on regional C&IS trade, while section VIII concludes.
It is the Nature of All Greatness Not To Be Exact4
Edmund Burke
II Data Availability, Classification and Compatibility Issues in US and
NAFTA Data for Computer and Information Services
Accurately measuring almost any trade in services is intrinsically more complicated than measuring trade in goods. Precise and coherent definitions of services are hard to establish, as these frequently take the character of abstract concepts (like say management consulting) and almost invariably possess no physical form. In contrast to merchandise trade, services trade very rarely entails a physical package crossing a customs frontier, dutifully stamped with an internationally recognized commodity code, and descriptions of contents, origin and destination. Services trade can further not rely on the for government revenues in many countries historically
4 Unless otherwise specified, quotes in this paper are cited from the collection in Shaw (2001).

Draft Paper
3
significant public administrative apparatus for the collection of customs duties. Unlike for goods, the measurement of services trade is aided by few such mandatory administrative practices. Instead, statisticians working on services trade measurements are compelled to rely on several different data gathering techniques, including surveys, business accounting records, other (frequently non-mandatory) administrative records and estimation techniques. Services trade data therefore rely on a multitude of different data sources and stakeholders, whose common and consistent understanding of services concepts is of the utmost importance for data validity. This gives rise to the ultimately insoluble services trade data conflict between on the one hand researchers, trade negotiators and policy makers’ desire for accurate and comprehensive data, and on the other costs of collection, the burden of information provision on private businesses and confidentiality concerns5. Any services trade data finds their origin in the always unstable compromise of these conflicting demands. One must, when analyzing C&IS never lose sight of these broader issues pertaining to services trade data collection. Fortunately, different parts of the United States government maintains by a significant margin the most comprehensive, valid and timely data collection effort in the world in areas relevant for analysis of C&IS. The spoils of this on-going data collection effort make the United States (and its NAFTA partners) the only country (region) for which an empirically oriented paper of this nature could be written, while at the same time still raising substantial data availability, classification and comparability issues. These are the subject of the remainder of this section. The starting point of this analysis is the standard definition of C&IS from the IMF Balance of Payments Manual, Rev. 5 (BPM5: 39-40), which defines it as:
“Computer and information services covers resident/nonresident transactions related to hardware
consultancy, software implementation, information services (data processing, data base, news agency), and
maintenance and repair of computers and related equipment”.
The MSITS further as part of the Extended Balance of Payments Service (EBOPS) Classification system, identifies three disaggregated sub-components of C&IS6; 7.1 Computer services: consists of hardware and software-related services and data-processing services. Included are hardware and software consultancy and implementation services; maintenance and repair of computers and peripheral equipment; disaster recovery services, provision of advice and assistance on matters related to the management of computer resources; analysis, design and programming of systems ready to use (including web page development and design), and technical consultancy related to software; development, production, supply and documentation of customized software, including operating systems made on order for specific users; systems maintenance and other support services, such as training provided as part of consultancy; data-processing services, such as data entry, tabulation and processing on a time-sharing basis; web page hosting services (i.e., the provision of server space on the Internet to host clients’ web pages); and computer facilities management. Excluded from computer services are the provision of packaged (non-customised) software (classified as goods and therefore not included in EBOPS) and non-specific computer training courses (included in other personal, cultural, and recreational services).
5 See the introduction to MSITS (2002) for an elaboration of these general issues in services data collection. 6 At the time of the preparation of the MSITS, the classification of the provision of software downloaded from the internet was not decided upon. This issue remains under discussion in the work for an update to the BPM5. See IMF (2006). As the level of download activity of software over the internet has with certainty expanded very dramatically in recent years, this outstanding issue poses noteworthy validity problems for international C&IS data.

Draft Paper
4
7.2.1 News agency services: include the provision of news, photographs, and feature articles to the media. In the GNS/W/120 list of services that was a basis for the GATS commitments in the Uruguay Round, these services are a part of “recreational, cultural and sporting services” rather than computer and information services in the case of BPM5. These services are therefore separately identified in EBOPS, thus facilitating a linkage with GNS/W/120. 7.2.2 Other information provision services: includes database services - database conception, data storage and the dissemination of data and databases (including directories and mailing lists), both on-line and through magnetic, optical or printed media; and web search portals (search engine services that find internet addresses for clients who input keyword queries). Also included are direct, non-bulk subscriptions to newspapers and periodicals, whether by mail, electronic transmission or other means. Little or no data at this disaggregated level of detail is available from US statistical agencies (or from any other country or entity) and the policy relevance of analysis at this fully disaggregated EBOPS level of detail is as a result relatively limited. Hence the principal analysis level of the aggregate C&IS category (EBOPS category 7) will be maintained throughout this paper7. II.a International Trade and Modes of Supply in C&IS
The principal analytical thrust of this paper is the analysis of US C&IS by GATS mode of supply. Yet, these two notions – international trade (as traditionally defined by the BOPM) and GATS modes of supply – are not immediately compatible concepts. The BOPM defines international trade in services similarly to trade in goods, as occurring between the residents and non-residents of an economy. However, services materially differ from goods with respect to the proximity of supplier and consumer. Some services are non-transportable in character and cannot be traded separately from their production. For instance, in order to get a haircut, either the customer must go to the hairdresser or (less frequently) vice versa8. Reflecting this issue, the GATS agreement and the MSITS expands the BOMP definition of international trade significantly beyond its traditional notion of “cross-border imports and exports” to include the GATS four modes of supply9; Mode 1: Cross-border Supply; From the territory of one [WTO] Member [country] into the
territory of any other Member; Mode 2: Consumption Abroad; In the territory of one [WTO] Member to the service
consumer of any other Member; Mode 3: Commercial Presence; By a service supplier of one [WTO] Member, through
commercial presence in the territory of any other Member; Mode 4: Presence of Natural Persons; By a service supplier of one [WTO] Member,
through presence of natural persons of a Member in the territory of any other Member.
Figure 1 reproduced from the MSITS illustrates the different modes of supply;
7 As can be seen from the listed sub-component definitions, the main benefit arising from this level of data detail is statistical compatibility with other data classification systems and for GATS negotiating purposes. 8 See Box 1 and 2 in the MSITS. 9 MSITS, p. 11-12.

Draft Paper
5
Figure 1:
As a result of this expansion of the traditional notion of “exports and imports”, analysis of services trade by modes of supply requires that researchers look beyond the traditional sources of trade data. The statistical coverage of each mode of supply of C&IS by US data sources is summarized in table 1:

Draft Paper
6
The data sources included in table 1 does not pretend to offer a comprehensive coverage of US C&IS trade by individual mode, rather merely the best coverage available. Particular concerns pertaining to US data for each mode of supply, excluding mode 2, will be discussed next; II.b C&IS Mode 1: Cross-border Supply;
Cross-border supply of C&IS is the trade mode most closely resembling “traditionally defined imports and exports”. However, as mentioned in the introduction, significant data validity issues nonetheless exist. A quick look at the total reported global trade in C&IS gives an illustration of the severity hereof. Figure 2 shows the total global imports (133 countries reporting) and exports (121 countries reporting) of C&IS from 2000-200610.
10 As reported in Lipsey (2006), going further back in time than 2000 in terms of total reported global trade in C&IS in the IMF BOPS data makes little sense, as it was only in the late 1990s the majority of countries began reporting this type of data. Lipsey (2006, table 2 and 3) shows how for instance in 1993 just 19 and 20 countries reported C&IS exports and imports respectively.

Draft Paper
7
Figure 2: Global Computer and Information Services (Unaffiliated)
Trade 2000-2006, As Reported in the IMF BOPS, $USbn
25.028.1
30.234.8
41.4
48.6
54.2
45.5
50.9
57.9
73.8
95.2
107.2
123.5
0
20
40
60
80
100
120
140
2000 2001 2002 2003 2004 2005 2006
$U
Sbn
Imports Exports
Source: IMF BOPS January 2008 Figure 2 shows how total reported C&IS exports by 2006 were more than double those of globally reported imports, with the difference being fully $70bn. Equally important, the relative difference between globally reported imports and exports have been rising steadily in the 21st century, both in absolute and relative terms. Given that in principle each category of the IMF BOPS should “add up” with globally reported imports and exports at similar annual levels11, the increasing magnitude of the divergence herein indicates that in fact C&IS is an area of services trade, where global data quality might be getting worse, not better over time. This deterioration can be illustrated by estimating the standard OECD quality metric for the comparability of exports and related import flows, the so-called Asymmetry Coefficient12, for global trade in C&IS from 2000-2006. It was .58 from 2000-2001, but had deteriorated to .78 by 2006. With the relatively large number of countries reporting each year, including all major industrialized nations (and India) accounting for a steady just over 90 percent of total global services for both imports and exports from 2000-2006, any explanation that the size of and increasing divergence is largely related to annual differences in the number of countries reporting must be dismissed13. 11 Global export and import symmetry of course assumes that all countries report both. It further may not necessarily hold for certain transportation services. 12 If X = Exports and mM = Mirror Imports, the Asymmetry Coefficient is given as (X-mM)/((X+mM)/2). See OECD (2004). See also Cave (2007). 13 117 countries reported both exports and imports for the 2000-2006 period, while four countries (Honduras, Israel, Panama and Sri Lanka) reported exports but not imports, and 16 countries (Angola, Anguilla, Antigua/Barbados, Belize, Macao, Dominica, French Polynesia, The Gambia, Kuwait, Libya, Rwanda, Sierra Leone), St. Kitts & Nevis, St. Vincent, Vanuatu and Yemen) reported imports but not exports.
Draft Paper
8
It is noteworthy that a similar almost 1-to-2 difference between reported imports and exports is found also when looking only at the OECD countries. The OECD ITS database shows how total OECD mode 1 C&IS exports to the world were $72bn and $74bn in 2004 and 2005, while total OECD C&IS imports from the world amounted to $40bn and $47bn in those years respectively. Superficially, this indicates a strong OECD country competitive position relative to the rest of the non-OECD world with an OECD C&IS trade surplus of approximately $30bn in 2004 and 2005. Comparing those data to the globally reported data in figure 2, it is clear that the OECD countries accounts for the overwhelming majority of reported C&IS trade. What cannot be immediately discerned, however, is whether the OECD countries, rather than possess a strong competitive position in C&IS trade, instead merely accounts for most of the global measured import-export discrepancy herein? More statistical research is required to determine this issue. Even relatively large statistical discrepancies in trade data are hardly unique to C&IS data. See for instance the treatment in Appendix II in the IMF WEO from April 2000, which discussed the origin of the roughly 3 percent global current account discrepancies in 199914. Yet, an aggregate discrepancy of more than 100 percent between reported imports and exports for C&IS in 2006 indicates the validity problems that research utilizing many traditional multi-country trade methodologies may face encounter when analyzing C&IS trade. US C&IS data for mode 1 has been collected by the BEA since 198615. The validity of these data have, particularly with respects to the bilateral C&IS trade between the US and India, been subject to substantial scrutiny in recent years. See for instance in-depth analysis in OECD (2006: Box 3.2) and GAO (2005). It should be further noted here that large bilateral discrepancies is not just a US-India bilateral issue, as US-EU C&IS data for instance also show conflicting trade balances. According to the BEA, the US in 2006 ran a $3.4bn bilateral trade surplus with the EU-25 in C&IS16, whereas Eurostat (2008, table 4.4) lists a €1.5bn EU-25 bilateral C&IS trade surplus with the US. Several commentators have recommended and the BEA itself has supported an improvement of the statistical survey coverage of US C&IS (as well as several other services sectors) cross-border trade, particularly of US imports of cross-border C&IS17. As such, a general understating of reported US imports of mode 1 C&IS in the data presented in this paper seems likely, due to the lack of inclusion of imports by US companies not covered by BEA
14 See also Marquez and Workman (2000) and the oral discussion hereof by then IMF Director of Research Michael Mussa at the IMF press conference launching the April 2000 WEO. Available at http://www.imf.org/external/np/tr/2000/TR000412.HTM 15 Available at the BEA website at http://www.bea.gov/international/intlserv.htm. See also http://www.bea.gov/surveys/iussurv.htm for an overview of the full list of surveys carried out by the BEA in this data collection effort. See Kozlow (2006) for an overview of recent BEA efforts. 16 See http://www.bea.gov/international/intlserv.htm, table 7.21. 17 See for instance Sturgeon et al (2006) and the National Academy of Science (2007), as well as the response from the US Department of Commerce (BEA) to GAO (2005). In the latter it is stated that: “We support GAO’s recommendations that the Bureau of Economic Analysis (BEA) should strive to improve its coverage of services
imports and, in particular that BEA work to obtain additional company information from the Census Bureau. As
GAO is aware, before this GAO study began, BEA had initiatives underway that would help accomplish there
objectives….. Nonetheless, we agree that some portion of the difference between the US and Indian estimates [of
bilateral C&IS flows] may reflect under-reporting on BEA’s surveys.” GAO (2005:29).

Draft Paper
9
surveys18. The data in figure 2 above suggests that this potential underestimate of C&IS imports is a global issue, and not confined to the US. A further complicating factor for mode 1 C&IS analysis is the fact that while as mentioned cross-border US C&IS data has been collected since 1986, this is true solely for unaffiliated (i.e. arms-length transactions between different businesses) trade data. Only since 1997 has the BEA collected C&IS mode1trade data between also affiliated entities (i.e. infra-firm data). Here it is sufficient to note that there is some confusion between traditionally internationally compatible trade data sources with respect to whether or not to include affiliated G&IS data in the US total. The IMF BOPS data presented in figure 2 does not include affiliated trade, presenting unaffiliated trade only. At the same time, the OECD ITS database for trade in services between OECD member states from 1991-200519 does include affiliated trade in C&IS in the years after 1997 where it is available20. As we shall see in section III, this has important implications for net US C&IS trade. II.c C&IS Mode 3 Commercial Presence
Transactions in GATS mode 3 is outside the traditional BPM5 realm of trade between residents and non-residents of a country and instead applies an ownership criterion to the analytical units, separating out either foreign-owned companies in the home-country or subsidiaries of locally-owned companies in other countries. Due to data scarcity, most researchers approximate mode 3 trade as a “constant function of the value of foreign direct investment”. Hoekman (2006:8) for example estimates an aggregate mode 3 sales/FDI stock ratio for US outward FDI of 0.35. Utilizing the superior data availability for the operations of US multinational companies and non-US multinational operating in the US, this paper will not have to rely on this type of “FDI data proxies” for its estimates of the scope of mode 3 trade in C&IS services. Instead actual local market sales data will be utilized. As this section will elaborate, there is, however, significant remaining statistical issues pertaining to this choice of data source. The BEA has since the late 1970s surveyed the operations of US multinational companies abroad21, as well as the operations of non-US multinational companies in the US22. Collection of this “Foreign Affiliate Trade in Services” (FATS) data has historically been carried out using two separate ownership-thresholds; 10 percent and 50 percent (i.e. majority ownership). As described in the MSITS, p.57-58. the GATS concerns itself with “cases of majority ownership – where by the very fact, control typically could be assumed to exist – as well as cases in which
control can be demonstrated to have been achieved with a smaller ownership share”. A case might thus be made for perhaps including in mode 3 trade all trade related to foreign affiliates with just a 10 percent foreign ownership. At the same time, the overlap in US data between the
18 Sicsic (2006) makes the argument that for a broader category of services, the underreporting of services imports is less of a problem in the statistical survey coverage in France. 19 Available at http://stats.oecd.org/WBOS/Default.aspx?DatasetCode=TRADEINDMACRO. 20 The ITS database, however, does not indicate in its footnotes that there in C&IS, similarly to the case in “Financial Services” is a break in the series from 1996 to 1997, with both unaffiliated and affiliated trade included in and after 1997. 21 Available at http://www.bea.gov/scb/account_articles/international/iidguide.htm#USDIA1. 22 Available at http://www.bea.gov/scb/account_articles/international/iidguide.htm#FDIUS.

Draft Paper
10
two categories of ownership is very high and the bulk of recently released data from the BEA has been related to majority-owned affiliates23. Therefore and following also an intuitive understanding of “foreign-ownership”, for the purposes of this paper, only majority-owned foreign affiliate data will be discussed. This demarcation further eliminates from the analysis in this paper, indirect ways for companies to achieve commercial presence in a market via for instance licensing agreements, collaborative distribution agreements between companies or online sales. An axiomatic distinction exists between mode 1 trade data, which as described earlier are classified according product or unit characteristics and transactionally occurs between residents and non-residents, and FATS mode 3 data, which are instead classified on the basis of the sectoral business activities of the foreign affiliate. In the United States (and in principle also in other NAFTA countries), the industrial classification system has since 1997 been the North American Industrial Classification System, or NAICS24. Prior to the introduction of NAICS, US statistical authorities relied on the Standard Industrial Classification System (SIC). As the two classification systems with respect to the industries relevant to this paper are not compatible and longer time-series therefore will suffer some additional data impairment, only NAICS based data will be presented25. The original NAICS system from 1997 was updated to reflect changes in the real economy by the US Census in 200226 and 200727. As computer services are among the most innovative and dynamic sectors in the US economy, these periodic NAICS industry classification revisions have had a direct impact on several of the industries relevant for this paper. As a result, some data will be chosen for industries which have had unchanged NAICS classifications since 1997, while other data from closely overlapping sectors from both NAICS 1997 and NAICS 2002 with constitute another time-series. Much of the firm-level data collected by the BEA and other statistical agencies will be of a proprietary nature and any data that potentially could reveal business strategy details for any individual company will be suppressed by the BEA to avoid such disclosure28. This means that researchers wishing to publicly cite this type of data are faced with the unsolvable dilemma that analytically attractive additional industry and country data detail results in a higher risk of data 23 See Mataloni (2007) for data showing that in employment-terms 87 percent of all US affiliates abroad were majority-owned in 2005. 24 The new NAICS system was introduced gradually by the BEA in its different annual and benchmark surveys and all types of data are therefore not available starting immediately from 1997 on a NAICS basis. 25 There are significant differences between the SIC and NAICS classification systems, which makes combining detailed industry data very difficult. SIC was an establishment-based industry classification system that classified each establishment according to its primary activity. It had been updated several times since its inception in the 1930s with new – particularly services – industries added and small, declining industries deleted or combined with other activities. Nonetheless, the SIC provided a very poor statistical coverage of the services sectors. Instead the NAICS classification is based on a concept in which companies that use the same or similar processes to produce goods or services are grouped together. This makes the NAICS significantly closer to the international ISIC system. See the Census Bureau at http://www.census.gov/epcd/www/naicsdev.htm for an overview and Mann and Kirkegaard (2006) for a discussion of how one can attempt to combine SIC and NAICS based data. 26 See the Census Bureau website at http://www.census.gov/epcd/naics02/index.html for an overview of the industry classification changes involved from NAICS 1997 to NAICS 2002. 27 See the Census Bureau website at http://www.census.gov/naics/2007/index.html for an overview of the industry classification changes involved from NAICS 2002 to NAICS 2007. 28 Failure to do so would likely lead to reduced compliance among US companies in filling out BEA survey forms, resulting in reduced data validity. See GAO (2005) for an elaboration of these concerns among BEA officials.

Draft Paper
11
points being suppressed for confidentiality reasons29. Hence there is an unavoidable trade-off involved when choosing the relevant mode 3 industry(ies) with which to match mode 1 C&IS data. This paper will to the degree possible attempt the maximum industry specificity, as it is from a validity point of view overwhelmingly desirable to avoid adding the activities of spurious and unrelated non-IT services industries to the data for mode 1 C&IS trade30. Keeping these trade-offs in mind and based upon the data detail in the publicly available BEA data tables, the following NAICS industries have been chosen to represent mode 3 trade in C&IS31; Two NAICS industries with unaltered NAICS industry classifications from 1997 onwards; NAICS 5112 Software Publishers; This industry comprises establishments primarily engaged in computer software publishing or publishing and reproduction. Establishments in this industry carry out operations necessary for producing and distributing computer software, such as designing, providing documentation, assisting in installation, and providing support services to software purchasers. These establishments may design, develop, and publish, or publish only. And;
NAICS (5415) Computer Systems Design and Related Services: This industry comprises establishments primarily engaged in providing expertise in the field of information technologies through one or more of the following activities: (1) writing, modifying, testing, and supporting software to meet the needs of a particular customer; (2) planning and designing computer systems that integrate computer hardware, software, and communication technologies; (3) on-site management and operation of clients' computer systems and/or data processing facilities; and (4) other professional and technical computer-related advice and services.
In addition hereto, the following NAICS (1997) industry from 1997 to 2002 NAICS (1997) 514 Information Services and Data Processing Services; Industries in the Information Services and Data Processing Services subsector group establishments providing information, storing information, providing access to information, and processing information. The main components of the subsector are news syndicates, libraries, archives, on-line information service providers, and data processors. will be combined with a BEA NAICS 2002 meta-data category, termed in the BEA data-tables “Internet, data processing, and other information services”. This meta-classification is the aggregate of the following three NAICS 2002 industries; NAICS (2002) 516 Internet Publishing and Broadcasting; Industries in the Internet Publishing and Broadcasting subsector group establishments that publish and/or broadcast content exclusively for the Internet. The unique combination of text, audio, video, and interactive features present in informational or cultural products on the Internet justifies the separation of Internet publishers and broadcasters from more traditional publishers included in subsector 511, Publishing Industries (except Internet) and subsector 515, Broadcasting (except Internet).
29 Researchers with US citizenship can get access to the full micro firm-level datasets on BEA premises and publicly report macro-level research results based here upon. 30 Put in statistical terms, this can be likened to an attempt to minimize “type I” errors, i.e. reducing the risk that this paper reports C&IS “false positives”. This would occur if data variation attributed to C&IS in reality origin with changes in other sectors. 31 These partly follow Mann and Kirkegaard (2006). This paper will subsequently proceed to use the terms mode 3 imports and exports.
Draft Paper
12
NAICS (2002) 518: Internet Service Providers, Web Search Portals, and Data Processing Services; Industries in the Internet Service Providers, Web Search Portals, and Data Processing Services subsector group establishments that provide: (1) access to the Internet; (2) search facilities for the Internet; and (3) data processing, hosting, and related services. The industry groups (Internet Service Providers and Web Search Portals, Data Processing Hosting, and Related Services) are based on differences in the processes used to access information and process information. The Internet Service Providers and Web Search Portals industry group includes establishments that are providing access to the Internet or aiding in navigation on the Internet. The Data Processing, Hosting, and Related Services industry group includes establishments that process data. These establishments can transform data, prepare data for dissemination, or place data or content on the Internet for others. In addition, the shared use of computer resources is included in the Data Processing, Hosting, and Related Services industry group. Establishments that are publishing exclusively on the Internet are included in Subsector 516, Internet Publishing and Broadcasting and establishments that are retailing goods using the Internet are included in Sector 44-45, Retail Trade. NAICS (2002) 519 Other Information Services; Industries in the Other Information Services subsector group establishments supplying information, storing information, providing access to information, and searching and retrieving information. The main components of the subsector are news syndicates, libraries, and archives. The combined time-series from 1997 onwards for these industries will for the sake of simplicity throughout this paper be termed “Internet and Information Services”, while break in the series will be identified. This is quite a narrow NAICS-based sectoral definition of C&IS, compared to for instance Mann and Kirkegaard (2006) and Yuskavage et al. (2006). It does, however, essentially mirror the NAICS-based definition of the Canadian “software development and computer services industry” used by Statistics Canada in their annual survey hereof32. Several circumstances adds a non-trivial degree of additional uncertainty to any such choice of “computer and information services industries”. These will now be elaborated upon. First of all, any classification of a given foreign affiliate in a given industry is done on the basis of the affiliate’s “primary industry”, i.e. the industry in which the affiliate has most of its activities and sales. As it can safely be assumed that many companies in the three industries listed above do not carry out all their activities within the classification of just that single industry, the recorded data ought best be interpreted as indicative of the total activity levels of firms “predominantly engaged” in these industries, rather than as a precise measure33. Secondly, in a dynamic business world, it may be that companies change corporate strategy and thus in time their “primary industry”. This introduces an additional element of variation into any time series of FATS data. As the broader ICT industry has in recent years expanded rapidly in services, a degree of underrepresentation of newer “services activities” from traditional “primarily ICT hardware firms” can therefore not be ruled out. At the same time, as illustrated in figure 3, the transition of a very large US IT company – IBM was up to 2000 still mostly in IT hardware – to “primarily an IT services company” will bias data collection in the other direction.
32 See Statistics Canada (2008). Statistics Canada includes three NAICS industries in their survey; NAICS 5112: Software Publishers; NAICS 5182: Data Processing, Hosting and Related Services; and NAICS 5415: Computer Systems Design and Related Services. 33 The MSITS, p. 63, footnote 69 in fact singles out computer services as a service which “may be provided not only by firms classified in the computer services industry…”

Draft Paper
13
At the very least, major company re-classifications like IBM from 2000-200134 may introduce substantial spurious year-to-year variation in the time series.
Figure 3: IBM Revenues by Business Segment 1991-2007
57%
52%
50% 50%49%
48%46%
43%42% 43%
39%
34%
32% 32%
27%
24%
22%
9%
11%13%
15%
18%
21%
25%
35%37%
38%
41%
45%
48% 48%
52%53%
55%
0%
10%
20%
30%
40%
50%
60%
1991 1992 1993 1994 1995 1996 1997 1998 1999 2000 2001 2002 2003 2004 2005 2006 2007
Hardware Services Software Other (1)
(1) Content varies throughout the period, but includes segments such as Maintenance, Rentals, Financing and Enterprise Investment, and "Other".
Source: Company annual 10-K Filings. Due to a change in reporting segments from 1997-1998, a break in the timeseries for "other" is present between these two years. This,
however, does not affect the main conclusions of this table. Thirdly, as a result of the inherent trade-off between analytically relevant data detail and disclosure concerns, the starting point for collection of mode 3 export data will typically be “total sales” made by the foreign affiliate in identified industries. Total sales data, however, are too aggregate in character and requires two adjustments to improve validity. First a disaggregation into “total sales by product” must be made, such that foreign affiliate sales of goods and services are separated out. For the purposes of this paper, only affiliate sales of services are of interest35. Such a disaggregation is in fact in principle available in the BEA data36. Yet, the data at the industry level relevant for this paper are only sporadically available, due to the privacy concerns discussed above. A detailed empirical determination of the level of “mode 3 affiliate services
34 Note that the revenue breakdown from IBM’s annual 10-K filings may not correspond to the industry classification of sales data used by the BEA the determine IBM’s primary industry. As such, it cannot be discerned in which year precisely, the re-classification took place. 35 Serious conceptual doubt concerns the validity of this disaggregation by product in to goods and services for the IT services industries. This reflects the inherent duality of many electronic products, which can for instance be traded as an electronic service, only to be transformed into a good upon printing. It is beyond the scope of this paper to explore this issue further. However, attempting to distinguish between goods and services sales retains substantial analytical value. 36 See annual tables III-F14 and III-F16 in the BEA’s comprehensive financial and operating data for US multinationals abroad as well as tables 10 and 11 in the BEA’s international services data, available at http://www.bea.gov/international/intlserv.htm.

Draft Paper
14
sales” in the industries selected for analysis in this paper is therefore difficult and only an approximate adjustment can be made. The second adjustment that must be made to “foreign affiliate total sales” is of particular concern to this paper, as it will to the degree possible attempt to compare the flows of mode 1 and mode 3 trade. The issue concerns the ultimate destination of foreign affiliate sales. The MSITS, p.18 demarcates this issue in the following manner; “In the present [MSITS] Manual and following GATS coverage, domestic sales by foreign affiliates are covered by the term “international trade
in services””. In other words, only sales by foreign affiliates made in the local (foreign) market should be included in mode 3 trade, while all sales made outside the local market by definition crosses an international border and thus becomes part of mode 1 trade. Some of this mode 1 trade may be “affiliated in nature” and conducted between the foreign affiliate and the parent group, while the rest will be with unaffiliated third parties. This issue principally concerns US mode 3 C&IS exports, as the size of the US domestic market makes the large scale sale of services by US located foreign affiliates to non-US markets unlikely and for the purposes of this paper it is therefore assumed to be zero. With respect to US mode 3 C&IS exports the adjustment of “total affiliate sales” to “local services sales” is, based on available data, set at a deduction by 30 percent from “total affiliate sales”. Fourthly, a noteworthy issue concerns the (primary) industry by which foreign affiliates are classified. Intuitively, this would be the industry in which the foreign affiliate is operating, which would usually be the same primary industry as the entire multinational group. However, there are circumstances in which some foreign affiliates in a country operate primarily in industries other than the industry of their parent company37. This especially concerns foreign affiliates, which have their principal activities in “wholesale operations” and are subsequently classified in NAICS industry 42 – Wholesale. Typically, this is a concern in merchandise producing sectors38, where analysts may miss some relevant foreign affiliate activities through such differences in industry classifications. It however also poses a challenge in the industries relevant in this paper. One way in which the to illustrate the potency of this issue with available BEA data is to compare total foreign affiliate sales classified by the industry of the affiliate (as presented in table 2) with total foreign affiliate sales in the same industry, but with all foreign affiliates organized by the industry of their US parent company. In the latter way, all foreign affiliates of US multinational parent companies in computer services industries would be classified as computer services industries affiliates, irrespective of the primary industry of any individual affiliate. According to the latest available preliminary data for NAICS 5415 from 2005, total sales that year classified by the industry of the affiliate amounted to $68.4bn. Other BEA data for the same industry also from 2005, only classified by the industry of the US parent company shows total affiliate sales of $100.8bn39. In other words a discrepancy of more than 50 percent!
37 Note that the BEA collects operation and financial data for US parent companies (survey form BE-11A) and their foreign affiliates using separate surveys (survey form BE-11B, Long/Short Form). See BEA website for an overview of different surveys for US foreign direct investment abroad at http://www.bea.gov/surveys/diasurv.htm. 38 See Mann and Kirkegaard (2006) for the IT hardware sector, as well Bensidoun and Ünal-Kesenci (2008). 39 See annual table III-F3 and III-F9 in the BEA’s comprehensive financial and operating data for US multinationals abroad.

Draft Paper
15
It cannot immediately be judged which of the two methodologies of affiliate classification is the most valid for capturing the “true level of economic activities of foreign affiliates” in any given industry. However, it seems probable that a significant risk of “double-counting” economic activities exists, when classifying all foreign affiliates according to the industry of the US parent company (for instance when the same service activity is transacted and re-sold through multiple foreign affiliates in different “primary sectors” – from say primary producing to a wholesale to a financial holding affiliate – within a single multinational group). Subsequently, this methodology will unduly inflate the true level of economic activities in foreign affiliates. In the aggregate, this latter risk of inflated estimates is for the industries analyzed in this paper likely larger than the former risk of missing some economic activities from classification of affiliates in other industries. Forced to choose on an admittedly weak methodological basis, this paper will therefore present data only classified according to the primary industry of the individual foreign affiliate. Less detailed data is generally available for affiliates of foreign parent companies operating in the US and while it is certain that these data will be affected by the same validity issues just discussed, it is frequently not possible to gauge the degree to which this is the case. One final data issue concerning only inward investment data for the US must further be mentioned; the BEA geographically classifies affiliates of foreign multinational companies operating in the United States according to residence of the “Ultimate Beneficial Owner” (UBO), defined as “that person, proceeding up a US affiliates ownership chain, beginning with and including the foreign
parent, that is not owned more than 50 percent by another person.”40 This definition has the implication that in a very limited number of cases, a company classified as a “foreign-owned affiliate in the United States” may be ultimately owned by American investors. In 2005, 0.5 percent of all assets of majority-owned foreign affiliates had an UBO resident in the US41.
II.d C&IS Mode IV; Presence of Natural Persons
Mode IV trade in services involves the supply of services through the non-permanent movement and presence of foreign nationals, or “natural persons”. These may work as independent service providers or as employees of domestic companies, foreign affiliates or foreign companies with no lasting presence in the country of supply42. Of the three modes of supply described in this section, by far the most daunting data availability and validity issues concerns mode IV and the movement and presence of natural persons. Rather than facing issues of incompatible data classifications as modes 1 and III, mode IV suffers instead from a near complete lack of relevant data collected with the aim of measuring and analyzing trade flows. The MSITS, p. 24 is quite forthright in its assessment when stating; “Mode 4 services supplied through the presence of natural persons pose particular measurement problems that cannot be fully resolved within the BPM5 and FATS framework. In addition, no simple correspondence can be readily established between any existing statistical framework and the part of GATS mode 4 services that is not covered by the BPM5 concept of trade in services. The trade-related movement of natural persons has given rise to a need for information collected on a new conceptual basis. Although not a new phenomenon, the concept of mode 4
40 See Anderson (2007:195). 41 See table III-A3 in BEA comprehensive operating and financial data for foreign direct investment in the United States. This applied to approximately $28.5bn out of a total foreign-owned asset base of $5.9tr. in 2005. 42 See the MSITS, annex 1.

Draft Paper
16
delivery of services in trade is new; it must first be defined, and then a new statistical framework must be elaborated for measuring it”. Analysis of mode IV will therefore invariably have to rely on data providing only indirect, auxiliary and supplementary information. Some such data is available through the general BPM5 framework, which specifies two non-trade data categories of labor related resource flows relevant to mode IV trade; “Compensation of Employees” and “Worker Remittances”43. For papers concerned with relatively detailed services trade, both these however present challenges. First of all, as discussed above, the BPM5 concerns itself with transactions between residents and non-residents and similar to the 1993 SNA draws the distinction at 1 year of residency – if present in a foreign country for more than 12 months, visitors are considered residents here and thus outside the BPM5 subject area. Unfortunately, this BPM5 definition of “non-permanent presence” as less than a year, is at odds with the implied definition hereof in the GATS, where countries’ “non-permanent” commitments are usually rooted in diverse national regulations and typically operationalized as lasting between 2-5 years44. It is not possible to align these two definitions in a satisfactory manner. Secondly, neither “Compensation of Employees” nor “Workers’ Remittances” data are collected in a fashion that distinguishes between compensation to individuals working in services-producing activities and those working in other sectors. As such, for the purposes of this paper, US data of this type are of limited value45. Somewhat resembling the situation in mode 3 it is in order provide the basis for quantifying US mode IV trade, instead necessary to establish a link between trade and data describing temporary foreign nationals present in the US. For this purpose, US data from the Department of Homeland Security, covering the characteristics of recipients of temporary US employment-based visas, such as the H-1B and L-1 visa, is useful. This data provides some information concerning the industry of the employing firm, as well as the occupational circumstances of temporary visa holders’ employment in the United States. Subsequently, it is for the purposes of this paper possible for several recent years to identify the number of temporary visa holders employed in the same industries as identified for mode 3 trade, namely 5112 Software Publishers, NAICS (2002) 514: Information Services and Data Processing Services; and NAICS 5415 Computer Systems Design and Related Services. A reasonable degree of sectoral classification overlap between trade in computer services in mode IV and other modes can therefore be established. The details of the utilized methodology will be described in section IV of this paper, but it is pertinent here to highlight an important conceptual issue; US temporary employment visa data (and visa-based data in general) contains information about when a foreign individual is given
43 Both are part of the BPM5 Current Account classification, but not the trade balance. “Compensation of Employees” is part of the Income Category of the BPM5 and covers wages salaries and other benefits, in cash or in kind, and includes those of border, seasonal and other non-resident workers. “Workers Remittances” are part of Current Transfers in the BPM5 classification and involve transfers between residents and non-residents which do not involve a quid pro quo in economic value. See BPM5, chapter VIII. 44 Ibid, p. 12. 45 See World Bank (2008) for the most recent estimates of the scope of the remittances.
Draft Paper
17
permission to enter and take up temporary employment in the United States46. Methodologically, this type of data is subsequently akin to gross employment data for job openings. Meanwhile, temporary visa-based data contains no information regarding the duration and termination of the employment relation. This type of temporary visa-based data should therefore be treated as fundamentally distinct from the most prevalent type of labor market data, which measures net employment and changes in employment47. Only through the use of explicit assumptions about the expected duration and termination of the employment relation can the economic impact of temporary visa-based data be estimated. III Recent Trends in US Trade Patterns in Computer and Information
Services – Modes 1 and III: III.a Mode 1 Trade
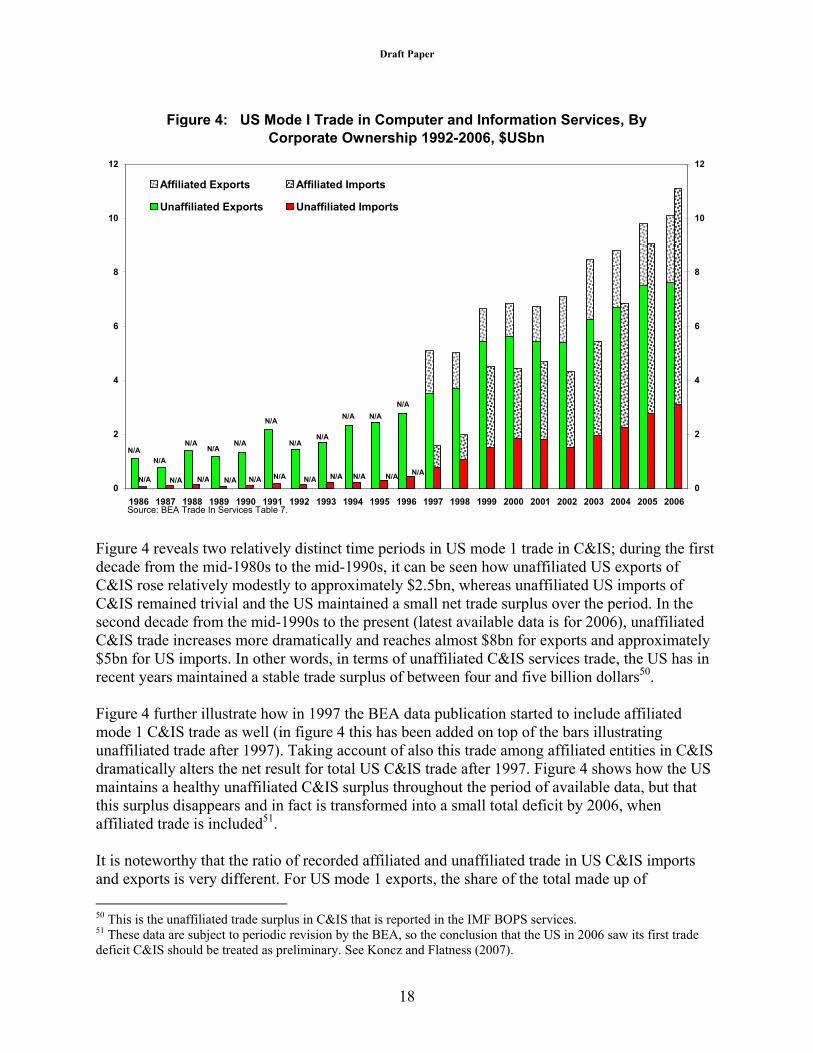
Powered by the frequently mentioned drivers of globalization from Moore’s Law48 and declining costs of communication49, we saw in figure 2 how measured global mode 1 trade in C&IS has risen rapidly in recent years. The same is true for US mode 1 trade in C&IS, which has risen from close to zero to a combined total exports and imports of over $20bn during the 21y from 1986-2006 period for which US data has been collected. Available data for both affiliated and unaffiliated trade are shown in figure 4;
46 Data on the issuance of employment visas granting access to permanent migration – “green cards” in the case of the United States – should instead by treated as additions to a country’s labor force. 47 See Pinkston and Spletzer (2004). 48 Moore’s Law states that the number of transistors on a chip will double about every two years. See http://www.intel.com/technology/mooreslaw/. 49 See for instance OECD (2008) figure 6.4 for estimates showing how international communications prices across the OECD have fallen dramatically since 1973.
Draft Paper
18
Figure 4: US Mode I Trade in Computer and Information Services, By
Corporate Ownership 1992-2006, $USbn
0
2
4
6
8
10
12
1986 1987 1988 1989 1990 1991 1992 1993 1994 1995 1996 1997 1998 1999 2000 2001 2002 2003 2004 2005 2006
0
2
4
6
8
10
12
Affiliated Exports Affiliated Imports
Unaffiliated Exports Unaffiliated Imports
Source: BEA Trade In Services Table 7.
N/AN/AN/AN/AN/AN/AN/AN/A
N/AN/A
N/A
N/AN/A
N/AN/A
N/A
N/AN/A
N/A
N/A
N/A
N/A
Figure 4 reveals two relatively distinct time periods in US mode 1 trade in C&IS; during the first decade from the mid-1980s to the mid-1990s, it can be seen how unaffiliated US exports of C&IS rose relatively modestly to approximately $2.5bn, whereas unaffiliated US imports of C&IS remained trivial and the US maintained a small net trade surplus over the period. In the second decade from the mid-1990s to the present (latest available data is for 2006), unaffiliated C&IS trade increases more dramatically and reaches almost $8bn for exports and approximately $5bn for US imports. In other words, in terms of unaffiliated C&IS services trade, the US has in recent years maintained a stable trade surplus of between four and five billion dollars50. Figure 4 further illustrate how in 1997 the BEA data publication started to include affiliated mode 1 C&IS trade as well (in figure 4 this has been added on top of the bars illustrating unaffiliated trade after 1997). Taking account of also this trade among affiliated entities in C&IS dramatically alters the net result for total US C&IS trade after 1997. Figure 4 shows how the US maintains a healthy unaffiliated C&IS surplus throughout the period of available data, but that this surplus disappears and in fact is transformed into a small total deficit by 2006, when affiliated trade is included51. It is noteworthy that the ratio of recorded affiliated and unaffiliated trade in US C&IS imports and exports is very different. For US mode 1 exports, the share of the total made up of
50 This is the unaffiliated trade surplus in C&IS that is reported in the IMF BOPS services. 51 These data are subject to periodic revision by the BEA, so the conclusion that the US in 2006 saw its first trade deficit C&IS should be treated as preliminary. See Koncz and Flatness (2007).

Draft Paper
19
unaffiliated trade is relatively steady after 1997 at about 75-80 percent. However, for US mode 1 imports, this ratio starts at approximately half in 1997 and then drops to only slightly above 25 percent by 2006. Hence, US mode 1 imports of C&IS have thus in recent years come to be overwhelmingly made up of transactions between affiliated entities, while for US mode 1 C&IS exports transactions among unaffiliated persons consistently dominate. Another way to interpret figure 4 is that for affiliated mode 1 trade in C&IS, the US has in recent years built up a substantial trade deficit of by 2006 more than $5bn. This of course stands in sharp contrast to the unaffiliated trade surplus discussed above. When attempting to explain the reason for these inverse trends in affiliated and unaffiliated trade, it is useful to further breakdown affiliated trade into its main components. Conceptually, all affiliated trade can be thought of as occurring between a parent company and its foreign affiliates52. Hence, US affiliated exports are made up of two types of exports; exports by US parent companies to their US-owned foreign affiliates abroad, and exports by foreign affiliates in the US to their foreign parent group abroad. And vice versa for US affiliated imports. This is illustrated in figure 5. Figure 5: US Affiliated Exports and Imports by Corporate Ownership
52 Some trade takes place between different foreign affiliates of the same parent group across international borders. In the case of such mode 1 trade occurring across US international borders, it will always, due to the BEA’s use of the UBO-concept tracing it back and allocating this trade with the ultimate foreign owner, be recorded as between a parent group and a (majority-owned) foreign affiliate. See Anderson (2007).

Draft Paper
20
Detailed BEA data for US mode 1 trade in C&IS is available from 1997-2006 for the relative importance of the two types of affiliated exports and imports. These data are presented in figure 6.
Figure 6: US Intra-Firm Trade in Computer and Information Services,
By Corporate Ownership 1997-2006, $USbn
0.0
1.0
2.0
3.0
4.0
5.0
6.0
7.0
8.0
9.0
1997 1998 1999 2000 2001 2002 2003 2004 2005 2006
0.0
1.0
2.0
3.0
4.0
5.0
6.0
7.0
8.0
9.0
Affiliated Exports: Receipts By US Foreign Affiliates From Their Foreign Parent Group
Affiliated Imports: Payments By US Affilates To Their Foreign Parent Group
Affiliated Exports: Receipts by US Parents From Their Foreign Affiliates
Affiliated Imports: Payments By US Parents To Their Foreign Affiliates
Source: BEA Trade In Services Table E. Figure 6 shows how US affiliated mode 1 exports of C&IS amounting to just over $2bn in 2006 is overwhelmingly made up of exports from US parent companies to their foreign affiliates in other countries, with exports from US-located foreign affiliates back to their foreign parent groups are very small. The relative importance is roughly similar for US affiliated imports of C&IS with imports from foreign affiliates going to their US parent group dominating. It is striking however that in 2005 and 2006 the relative importance of US affiliated C&IS imports in the form of payments by US-located foreign affiliates to their foreign parent group has been increasing rapidly. This rise is consistent with an increase in the level of foreign direct investment coming into the US in the computer and information services sector in recent years53. An increase establishment of operations of foreign IT services multinationals in the US market would further point to the need for foreign suppliers to be directly present “on-site with US clients” and in illustrate how non-US IT services multinationals are in their servicing of the US
53 See also OECD (2008b: 349ff), which is demarcated by ISIC rev. 3 industries and thus different from the data utilized in this paper. Country data for the US shows how for US foreign affiliates in ISIC 72 “Computer and Related Services” employment, turnover and value-added rose by 76, 66 and 109 percent respectively from 2001 to 2004. Unfortunately, the ISIC classification at the two-digit level is not compatible with NAICS industries, preventing more direct comparisons of these different data sets. See US Census Bureau at http://www.census.gov/epcd/naics/concordances/index.html#ISIC for a detailed comparison.

Draft Paper
21
market gradually imitating the global delivery model of established US IT services multinationals. It is clear from figure 6 that in terms of US affiliated mode 1 C&IS trade, parent companies of US multinationals are running a trade deficit with their affiliates abroad, something mirrored after 2005 for US-located foreign affiliates with their foreign parent group, too. For the latter group, the presence of a “head quarter services effect” would predict this to be the case, with the headquarter in multinational companies typically running a services trade surplus with the rest of the group54. As foreign IT services companies expand in the US market, this effect seems to be having an increasing effect. The surprising thing is that since 1999 there has been no “headquarter effect” for US parents in C&IS trade. This is potentially an indication that in this trade category offshoring of traditional head quarter services in the “back-office” to captive overseas located units has counterbalanced the traditional positive services trade impact of the location of a multinational group head quarter55. III.b Mode 3 Trade
Section II discussed the methodological issues concerning mode 3 trade data and identified the appropriate NAICS industries for analysis in this paper. Figure 7 shows the relevant mode 3 exports in the form of annual adjusted local services sales by US majority-owned US IT services foreign affiliates from 1999 to 200556.
54 See for instance Ekholm (1998). 55 The BEA table E for intra-firm trade for different sub-categories of “other private services” shows that this reversal of the traditional positive services trade effect of the company head quarter is also found in the financial services industry, another industry in which relatively intense adoption of offshoring and offshore outsourcing has occurred in recent years. See Deloitte Research (2004). 56 Raw data for local market services sales for the industries in question are overwhelmingly suppressed by the BEA for confidentiality reasons. As a result, local services sales are in figure 7 approximated as “adjusted local services sales” equaling 70 percent of total foreign affiliate sales.

Draft Paper
22
Figure 7; US Mode III C&IS Exports - "Adjusted Local Services Sales"
By US Foreign Affiliates in Computer Services Industries 1999-2005,
by Industry of Affiliate, $USbn
28.1 29.3 30.9 29.236.6
43.447.9
10.011.3
12.4 13.9
18.1
21.0
23.7
10.510.6
12.2 13.3
14.0
16.9
18.9
0
10
20
30
40
50
60
70
80
90
100
1999 2000 2001 2002 2003 2004 2005(p)
$U
Sbn
NAICS Meta-group Internet and Information Services
NAICS 5112 Software Publishers
NAICS 5415 Computer Systems Design and Related Services
Notes: NAICS 1997/2002 break is between 2003 and 2004. No NAICS based data available before 1999. Source: BEA Comprehensive
Financial and Operating Data, Table III A2 Figure 7 shows how total US mode 3 C&IS exports almost doubles from 1999 to 2005 with a total rise of more then 85 percent to a total of over $90bn. The relative importance of individual industries in total mode 3 C&IS trade is quite stable with NAICS 5415 making up approximately 50 percent of the total, with the two remaining NAICS industries roughly splitting the other half57. It is immediately obvious that the magnitude of mode 3 C&IS exports at over $90bn by 2005 is very different from that of C&IS trade in mode 1 shown in figure 4. The C&IS mode 3 export data in figure 7 makes no distinction between affiliated and unaffiliated exports. It can be shown from the BEA’s detailed table III.F.3 for the ultimate destination of affiliate sales that local sales to affiliated entities makes up only a trivial share of
57 It is possible by combining the information for US foreign affiliate C&IS sales to affiliated entities in the United States (which BEA’s table III.F.3 shows that up to maybe 5 percent of total foreign affiliate sales go back to the US parent), with the data in figure 7 to carry out a rough validity test of some of the trade data presented so far. Ideally, the share of total US foreign affiliate C&IS sales destined to go to their US parent group should be “mirror data” of affiliated C&IS mode 1 imports in the form of payments by the US parent to its foreign affiliates in figure 6. Comparing the data for the two data series reveals that estimated foreign affiliate sales back to their US-located parent group are slightly higher (between $1-2bn annually over the period of available data) than published affiliated mode 1 C&IS mode 1 imports from figure 6. This would be in line with the general assumption that BEA surveys somewhat underestimate the level of US C&IS mode 1 imports. Given the magnitude of local foreign affiliate services sales of over $90bn by 2005, an annual discrepancy of $1-2bn can, ceteris paribus, nonetheless be considered reasonable and adds some validity to the methodology adopted so far in this paper. The estimated asymmetry coefficient for these two “mirror data series” fluctuates between 0.25 and 0.50 in the 1999-2005 time period.

Draft Paper
23
total local sales, while the overwhelming share is local sales to unaffiliated entities. As such, one might validly compare the US C&IS mode 3 export data with both unaffiliated only or total mode 1 exports. Table 2 presents a comparison of the total magnitudes of the two modes of trade.
Table 2 highlights two things concerning US C&IS exports by mode; first of all that mode 3 outstrips mode 1 by about an order of magnitude; and secondly – surprisingly given the large difference in starting levels – that the relative growth rate of US C&IS mode 3 exports is higher than that of US C&IS mode 1 exports over the period of available data from 1999-2005. When turning the attention to US C&IS mode 3 imports, the analysis is hampered by the less detailed operating and financial data available for foreign affiliates operating in the US. Relevant industry data are further much more frequently suppressed for confidentiality reasons. At the same time, the analysis is aided by the separate publication by the BEA of foreign “majority-owned US affiliate” (MOUSA) sales data to US persons (i.e. local sales) disaggregated by product category, which, unlike the similar data for US foreign affiliate sales abroad, is not suppressed for confidentiality reasons. These unadjusted data for US mode 3 C&IS imports are presented in figure 8.

Draft Paper
24
Figure 8; US Mode III C&IS Imports - Sales of Services to U.S. Persons
by Foreign MNC's Through Their Nonbank MOUSA's in Computer
Services Industries 1997-2005, by Industry of Affiliate, $USbn
3.7 4.1 4.3 5.06.2
5.0
10.8 11.3 11.2
0.6 0.72.2
2.2
2.23.0
3.74.4 4.3
8.4 8.8
2.73.0
4.0
5.1
9.1
0
5
10
15
20
25
30
1997 1998 1999 2000 2001 2002 2003 2004 2005
$U
Sbn
NAICS Meta-group Internet and Information Services
NAICS 5112 Software Publishers
NAICS 5415 Computer Systems Design and Related Services
Notes: NAICS 1997/2002 break is between 2003 and 2004. No NAICS based data available before 1997. Source: BEA US International
Services Transactions, table 11b.
(D) (D)
Figure 8’s data for US mode 3 C&IS imports shows how these increased very rapidly at a total of about 250 percent from a low starting point of $7bn in 1997 to about $25bn in 2005, although the rate of increased slowed dramatically after 2003. As with US mode 3 C&IS exports, NAICS 5415 accounts for about 50 percent of the total, while US mode 3 imports in NAICS 5112 is relatively less important than US mode 3 exports in this sector. No information is available concerning the breakdown of US mode 3 C&IS imports by ownership and the data in figure 8 can therefore be compared to both unaffiliated US mode 1 C&IS imports and the total hereof. This is done in table 3.
Table 3 illustrates how – as with US C&IS exports – mode 3 is the dominant mode of delivery. However, the dominance of mode 3 is less pronounced than for US C&IS exports and, unlike for US C&IS exports, appears relatively stable over the 1997-2005 period. A noticeable difference

Draft Paper
25
concerns the increasing dominance of affiliated trade in US mode 1 C&IS imports, illustrated above in figure 4. Focusing on the ratio with total mode 1 imports in the denominator, table 3 shows how it, from the time in 1999 when figure 4 showed it to become dominated by affiliated mode 1 imports, grows about as rapidly as US mode 3 C&IS imports through the period to 2005. Unlike for US C&IS exports, US mode 1 C&IS affiliated imports thus roughly keeps track with the expansion of US mode 3 C&IS imports. At least three issues become clear from this section. First of all that mode 3 reveals itself to overwhelmingly be the delivery mode of choice for US C&IS trade, particularly on the export side. Table 3 showed how more than 90 percent of combined US mode 1 and mode 3 C&IS exports were delivered through mode 3, while the share for US C&IS imports is only marginally lower58. This makes C&IS delivery far more reliant on mode 3 than aggregate US services exports, where Mataloni (2007:table A) shows that total US mode 3 services exports in 2005 were $528bn, compared to $368bn in mode 1, thus accounting for just 59 percent of the aggregate total. Secondly, for US C&IS exports at least, it becomes clear that the dominance of mode 3 is increasing with mode 3 C&IS exports growing faster than mode 159. Both these findings may surprise some, as mode 1 C&IS services – which one intuitively would predict to be among if not the single individual service most easily digitizable, transportable and tradable cross-border via international telecommunication – should have benefitted most from technological innovation and plummeting costs of international communication in the US60, and hence seen a rapid increase in cross-border mode 1 C&IS trade. To a degree this has in fact happened in a relative sense vs. other services categories. Cave (2006) finds that C&IS services trade within the OECD has expanded more rapidly from 1999-2005 than trade in any other individual services category. For the US, however, it is clear that C&IS mode 3 exports – when measured by local market affiliate sales – has expanded even faster. As such, the relative mode 1 tradability of C&IS services vs. other services categories may have risen since 1999, but at least for US C&IS trade, “relative tradability of mode 1 vs. mode 3” has not. It must therefore – with the continued and increasing dominance of mode 3 delivery – be the conclusion that the cross-border tradability revolution concerning US C&IS exports is frequently overstated. “Distance” at least in US C&IS trade seems far from dead. Thirdly, this section casts some light on the issue of whether for US C&IS trade, delivery through modes 1 and 3 are complementary in nature or substitute for each other. The finding in table 2 that the US mode 3 C&IS exports rise faster than US mode 1 exports, points to that mode 3 might act as a substitute for US C&IS mode 1 exports (however, see next section indicating
58 Data in Bensidoun and Ünal-Kesenci (2008) for aggregate US services trade in modes 1(+4), 2 and 3 for 2000-2001 reveals a similar relative magnitude of aggregate US mode 1(+4) and mode 3 trade. Figure 1 in this paper indicates that mode 1 accounted for 12 percent and 9 percent of the combined US mode 1and 3 exports and imports respectively. This issue is explored in section VI. 59 Table 3 showed how mode 3 C&IS exports grew a total of 85 percent from 1999 to 2005, against less than 50 percent for mode 1. 60 OECD (2008: figure 6.4) shows how the cost of a one minute international phone call from the United States fell by more than 98 percent from 1973 to 2004 and by more than 75 percent during the period in question for this paper from 1999-2004.

Draft Paper
26
that perhaps it is rather a matter of US IT MNCs selling differentiated products though each mode of supply). Similarly, the finding in table 3 that US affiliated imports of mode 1 C&IS services rise in relatively close tandem with US mode 3 imports, and from figure 6 that the rise in affiliated mode 1 services increasingly come from imports destined to foreign affiliates operating in the US market, indicate that US affiliated mode 1 C&IS imports and C&IS mode 3 imports are complementary in nature. Affiliated mode 1 C&IS imports could thus be speculated to increasingly act as input to mode 3 sales by foreign multinational IT services companies in the US market. This would indicate that US C&IS import trade is increasingly mirroring the US manufacturing sector, where an extensive literature has high-lighted the rise in intermediate goods trade and the increasing role of foreign multinationals herein61. III.c Revealed Comparative Advantage in US C&IS Trade
A standard empirical methodology for the analysis of trade patterns is that of Revealed Comparative Advantage (RCA), first developed in Balassa (1965). Based on standard Henkscher-Ohlin theory, a country’s RCA is assumed to be a function of relative factor endowments, as well as affected by various trade relevant public policies. Due to the data scarcity highlighted elsewhere in this paper, empirical work on RCA in the services sectors and by modes of supply especially has been scarce. Hoekman (2006)’s recent survey of services trade literature lists only one such paper – Langhammer (2004) – covering select services sectors for the US, EU and Japan and different modes of supply only for a subset of the US services sectors. This section will utilize the data presented in the previous section to estimate available RCA in US C&IS trade by mode of supply from 1986-2006. It will utilize the standard “own country” RCA formula from Balassa (1965), also relied upon in Langhammer (2004)62; RCA = ln[(Xi/Mi)/(X/M)]*100, with Xi/Mi denoting US exports and imports of mode 1 C&IS and
X/M denoting total US mode 1 exports and imports of private services.
With the data available it is possible to estimate mode 1 RCAs for both total, unaffiliated and affiliated US C&IS trade for different time spans. Computing RCA for US mode 3 C&IS trade will rely on the sectoral data from tables 2 and 3 above and total sales of services to foreign persons by U.S. MNC's through their nonbank MOFA's (X) and total sales of services to U.S. persons by foreign MNC's through their nonbank MOUSA's (M). Available RCAs for US C&IS trade by modes of supply is presented in figure 9;
61 See for instance Markusen (1992), Hanson et al. (2001), Borga and Zeile (2004) and Bernard et al. (2005). 62 Due to the dearth of data, only “own country” versions of RCA can be computed. This formulation of RCA recognizes the possibility of simultaneous exports and imports with commodity. See Vollrath (1991) and Utkulu and Seymen (2004) for an overview of different versions of RCA formulae.

Draft Paper
27
Figure 9: RCA in US C&IS Trade 1986-2006
-200
-100
0
100
200
300
400
1986 1987 1988 1989 1990 1991 1992 1993 1994 1995 1996 1997 1998 1999 2000 2001 2002 2003 2004 2005 2006
Mode 1 Total Mode 1 Uaffiliated Mode 1 Affilated Mode 3
Source: Author, based on BEA Data Several things are visible in figure 9; First of all that US RCA in mode 1 trade has been generally declining since 1986. This decline becomes particularly pronounced with the inclusion of intra-firm affiliated trade after 1997. Unlike in the case of mode 1 unaffiliated C&IS trade, which viewed separately remains (if declining) a comparative advantage for the US throughout the 1986-2006 period, the US has had a comparative disadvantage in affiliated mode 1 C&US trade since 1997. This by 1999-2000 reduced US comparative advantages in total mode 1 C&IS trade to zero and turned it negative in the most recent years in 2005-06. Figure 9’s mode 1 RCAs thus broadly reflect the findings in figure 4 and 6 of a dwindling US trade surplus in mode 1 C&IS, caused largely by surging imports of affiliated C&IS services. Secondly, figure 9 shows that US RCA in mode 3 C&IS trade remains both strong and relatively stable throughout the shorter timeframe of 1999-2005 where data are available. This again follows the finding above that US mode 3 C&IS exports has grown strongly in recent years. This continued US competitiveness can also been illustrated by computing the “US mode 3 trade balance” from the data in figures 7 and 8. During the period of available data, this “mode 3 balance” in US C&IS trade almost doubled from $38bn in 1999 to $66bn by 2005. RCA methodology inherently relies on raw trade data to uncover a country’s “revealed” comparative advantage and thus offer few insights, apart from the theoretically assumed relative factor endowments and trade policies, into the underlying sources of these. Hoekman (2006:10) describes how relative factor endowments can be expected to dominate the determination of mode 1 RCAs, while services characteristics affecting the need for producer-consumer proximity

Draft Paper
28
and public policies governing various domestic regulations and FDI attractiveness should explain most of mode 3 RCAs63. Following from this, one can speculate that the decline found in figure 9 in US mode 1 RCA in C&IS trade reflects the expansion of supply hereof in other countries after 1990. And further that the continued comparative disadvantage in US affiliated mode 1 C&IS trade indicates the very rapid expansion of both US multinationals abroad (especially in India64), as well as the increasing penetration of foreign multinationals of the US C&IS market. Both trends would increase foreign factor intensity by adding C&IS supply under multinational ownership outside the US borders to the market. Continued US RCA in mode 3 C&IS trade can similarly be speculated to origin in things like a strong advantage among US IT services multinationals in advanced, high value-added, non-standardized C&IS, which requires consumer-producer adjacency for delivery. Following Langhammer (2004:7), which notes that early-stage non-standardized services typically will favor mode 3 delivery, while later-stage standardization of a service will facilitate mode 1 cross-border supply, figure 9 might therefore illustrate a trade pattern where US multinational IT services companies retain a strong competitive position in all types of C&IS services, but that this position manifests itself very differently depending on the mode of supply. Persistent US RCA in mode 3 indicates that US IT services multinationals continue to deliver high value-added C&IS mostly through commercial presence, while persistent US negative RCA in affiliated mode 1 trade in more standardized C&IS indicates that these are supplied cross-border to the US market from overseas sources of supply. The latter development would be indicative of increased offshoring of this type of services. Increased cross-border imports of affiliated C&IS would further be a channel through which increases in productivity could diffused in the domestic US economy. In other words, it is possible that figure 9 illustrates a trade pattern that is very advantageous to US (and non-US) multinational IT services companies, which optimizes company productivity and profitability through delivery of high-end services through mode 3 and supplies the US market with standardized services through mode 1 from abroad, but perhaps less fortuitous when viewed from the perspective of the traditional accounting of the US trade balance. Mode 3 supplies of advanced C&IS would not be included herein, whereas cross-border affiliated imports of mode 1 C&IS would65, with the result, ceteris paribus, that the traditional US services trade balance appear worse, the more standardized and thus cross-border tradable a C&IS become. III.d US Bilateral C&IS Trade in Modes 1 and 3
Shifting the analysis from aggregate US C&IS trade to the more detailed level of bilateral US trade is inhibited by both the availability of bilateral C&IS trade data and the increased risk at this finer level of detail that individual data points are suppressed by the BEA for confidentiality reasons.
63 We shall see below how, when measured in WTO commitments, C&IS trade is relatively unconstrained. 64 IBM, Intel, Dell and HP have all expanded rapidly in India in recent years. See for instance BusinessWeek “Multinationals: Are They Good For America?”, February 28th 2008. 65 Mann and Kirkegaard (2006) finds a similar development among US multinationals in the IT hardware sector.

Draft Paper
29
Most geographic detail is available for C&IS mode 1 trade, where regional and select individual country data goes back to 1986. However, this detail is available only for unaffiliated mode 1 C&IS trade, whereas only aggregate data exists for affiliated trade. As we saw in figure 4, this means that the validity of geographic analysis of particularly US mode 1 C&IS imports will be adversely affected as it can cover only a relatively small minority of total US mode 1 C&IS imports. The situation for US mode 1 C&IS exports is relatively better, as geographic detail (per figure 4) will include approximately three quarters of total US mode 1 C&IS exports. Figure 10 shows US unaffiliated C&IS mode 1 exports by region.
Figure 10: US Unaffiliated C&IS Mode 1 Exports, By Region
1986-2006
0
1,000
2,000
3,000
4,000
5,000
6,000
7,000
8,000
1986 1987 1988 1989 1990 1991 1992 1993 1994 1995 1996 1997 1998 1999 2000 2001 2002 2003 2004 2005 2006
$U
Sm
n
Europe Asia-Pacific Canada Latin America Middle East Africa
Source: BEA International Trade in Services, table 7 Figure 10 shows how Europe has consistently been the largest market for US unaffiliated mode 1 C&IS exports with over half of total exports, while Asia-Pacific and Canada account for most of the rest. Figure 11 shows the corresponding data for US unaffiliated mode 1 C&IS imports;

Draft Paper
30
Figure 11: US Unaffiliated Mode 1 C&IS Imports, By Region
1986-2006
0
500
1000
1500
2000
2500
3000
3500
1986 1987 1988 1989 1990 1991 1992 1993 1994 1995 1996 1997 1998 1999 2000 2001 2002 2003 2004 2005 2006
$U
Sm
n
Europe India Other Asia-Pacific
Canada Latin America Middle East
Africa
Source: BEA International Trade in Services, table 7 Figure 11 shows that the US imports over half of its unaffiliated mode 1 C&IS from Canada and that Canada accounts for the overwhelming majority of the increase in unaffiliated imports after 1997. The frequently discussed issue of increased US C&IS imports from India is revealed as, at least in unaffiliated mode 1 import terms, to be of a substantially smaller magnitude. After 1997 a relatively modest increase in occurs in unaffiliated US C&IS mode 1 imports from India, reaching approximately one third of the level of Canadian imports by 2006. Sections V and VI will suggest an explanation for this finding. Analysis of US bilateral trade in C&IS mode 3 is harder. The BEA publishes US foreign affiliate operations data at the industry-level for only nine individual and relatively large countries66 (Canada, Germany, France, Netherlands, United Kingdom, Brazil, Mexico, Japan and Australia) and five regions (Europe67, Latin America68, Middle East69, Africa and Asia-Pacific70). During the period of available data from 1999-2005 in numerous instances individual annual industry and country data are moreover suppressed for confidentiality reasons, meaning that for Australia and Asia-Pacific no data is actually publicly available and for no country or region is a complete 66 See annual tables III-F18 and III-F20 in the BEA’s comprehensive financial and operating data for US multinationals abroad. 67 Comprises of EU-27, the EEA, the CIS states and former Yugoslavian states, as well as Turkey, Albania, Andorra, Gibraltar, Liechtenstein and Moldova. 68 Includes all countries in Central and South America, as well as the Caribbean. 69 Includes Israel, Saudi-Arabia, UAE, Iran, Iraq, Jordan, Qatar, Bahrain, Kuwait, Lebanon, Oman, Syria and Yemen 70 Includes ASEAN, Australia, New Zealand, Japan, China, Hong Kong, India, South Korea, other South Asian nations and all Pacific Island nations.

Draft Paper
31
time-series available. Table 4 summarizes the publicly available data for US C&IS mode 3 exports by geographic entity;
Looking between the holes in the data presented in table 4, a few things are noteworthy. The bilateral data for countries and entities where “actual time-series” exists, such as Canada, France, Germany, Netherlands, Latin America and Mexico, show relative stable levels of US C&IS mode 3 exports at the bilateral level. This is in contrast to rapidly rising aggregate US C&IS mode 3 exports and points to that this aggregate growth is occurring in countries for which no bilateral data is available. Table 4 further indicates that relatively low levels of US C&IS mode 3 exports goes to Africa, the Middle East and Latin America, meaning that the overwhelming majority of US C&IS mode 3 exports goes to advanced economies in Europe and the Asia-Pacific71. The scarcity of bilateral data mode 3 data further severely restricts the opportunities for analysis of the relative importance of mode 1 and mode 3 in US bilateral C&IS exports. Figure 12 combines available mode 1 and mode 3 data (see table 4) and plots individual country data and country averages by their level of economic development to provide an overview72.
71 This assertion is supported by geographically distributed asset data from the BEA for the three NAICS industries chosen. These show that roughly two thirds of US foreign affiliate assets are located in Europe, one quarter in the Asia-Pacific and the remainder split across the rest of the world. See BEA comprehensive financial and operating data, table IIIB-5. See also Hamilton and Quinlan (2005). 72 Figure 12 plots the ratio of mode 3 and mode 1 unaffiliated exports on the Y axis. For Europe, Africa and the UK, only one data point is available, making the period average equal hereto. Period averages are estimated as the average of only the years in which data is available. Note that for the UK, data is only available for 2005. This biases the UK data upwards and is the reason that the UK is shown with the highest average per capita income of the countries included in figure 12. Similarly, the category “Europe” includes many low income countries and is only for the year 2000. This will explain the low per capita GDP value.

Draft Paper
32
Figure 12: US C&IS Exports 1999-2005, By Modes and Country
World/Total
Canada
France
Germany
Netherlands
United Kingdom
Latin AmericaBrazil
Mexico
AfricaMiddle East
Japan
Europe
0
5
10
15
20
25
30
35
$- $5,000 $10,000 $15,000 $20,000 $25,000 $30,000 $35,000
GDP per Capita, $US PPP, 1999-2005 and Average
Ratio o
f U
S M
ode 3
/Mode 1
C&
IS E
xport
s, 1999-2
005 a
nd
Avera
ge
Average 1999-2005 World/Total Canada France Germany
Netherlands UK Latin America Brazil Mexico
Africa Middle East Japan
Source: BEA and IMF WEO
y = 0.0004x + 1.4507
R2 = 0.3684
t=4.77
P|t| > 0.000
Several things can be seen in figure 12, although the dearth of data points prevent meaningful statistical validation of these visual observations; First there seems to be some correlation between the relative importance of mode 3 (ratio of mode 3/mode 1 higher) and level of economic development. The higher a country’s GDP per capita, the higher the relative importance of C&IS mode 3 exports. This would support the proposition made above that US IT services companies supply high-end services to economically advanced clients mostly via mode 373. At the same time, the relatively lower ratio of mode 3 to mode 1 exports for both Canada and the UK relative to other developed nations indicates that a shared English language reduces the relative importance of mode 3 by boosting to relative attractiveness of direct supply from the US via mode 1 exports. Evidently sharing a common language matters when US IT services MNCs choose the mode through which to supply their services. Similarly, it is noteworthy that geographic proximity and sharing a common border is important and tends to increase the relative importance of mode 1 exports. Seemingly, distance does matter in US C&IS export mode determination. The US’s two neighboring markets in Canada and Mexico have – relative to their peers in Latin America and among developed nations respectively – a lower relative importance of C&IS mode 3 exports. We shall return to this issue in section 4 concerning NAFTA.
73 The issue of the importance of importing country GDP per capita is discussed in Egger (2008). See also Nordas (2008) presented at this conference.

Draft Paper
33
The standard findings from gravitational regression work on trade flows that sharing a language and a common border boosts bilateral trade is therefore visually verified in figure 12, as these characteristics also affect the relative importance of the mode of supply for US C&IS exports.
Table 5 shows available bilateral data for US C&IS mode 3 imports and shows that at least in the early period from 1997-1999, the data indicates that US mode 3 imports came overwhelmingly through European owned multinationals, with Japan accounting for most of the rest. However, table 5 also shows that while total US mode 3 imports have risen sharply after 2000, imports from both Japan and UK have been relatively stagnant. As with mode 3 exports above, growth in recent years have therefore come from countries not covered by bilateral data. One can thus speculate that much of the increase in recent years in total US mode 3 C&IS imports might origin with Indian multinational IT services companies recently established in the US market. Given the increasing dominance of affiliated trade in US C&IS mode 1 imports found in figure 4, for which no bilateral data is available, it is not meaningful to pursue the analysis of the relative importance of bilateral modes of supply, based on unaffiliated mode 1 imports only. IV C&IS Trade Restrictions in Modes 1 & 3 and US Domestic Regulation
IV.a US C&IS Mode 1 and 3 Trade and GATS Trade Commitments
The findings above that US C&IS trade in mode 3 trade is generally far more prevalent than US C&IS mode 1 trade, while at the same time some geographic and country wealth-level variation exists to this trend, leads to the question whether this might be caused by variation in countries’ services trade commitments under the GATS in this area? The further finding that US RCA in mode 1 has been declining in recent years could also hypothetically be linked to a potential increase in trade restrictions among destination countries for US C&IS mode 1 exports. Data on GATS commitments in the C&IS sector can shed light on the extent of at least some of the traditional explicit “at-the-border” type trade restrictions.
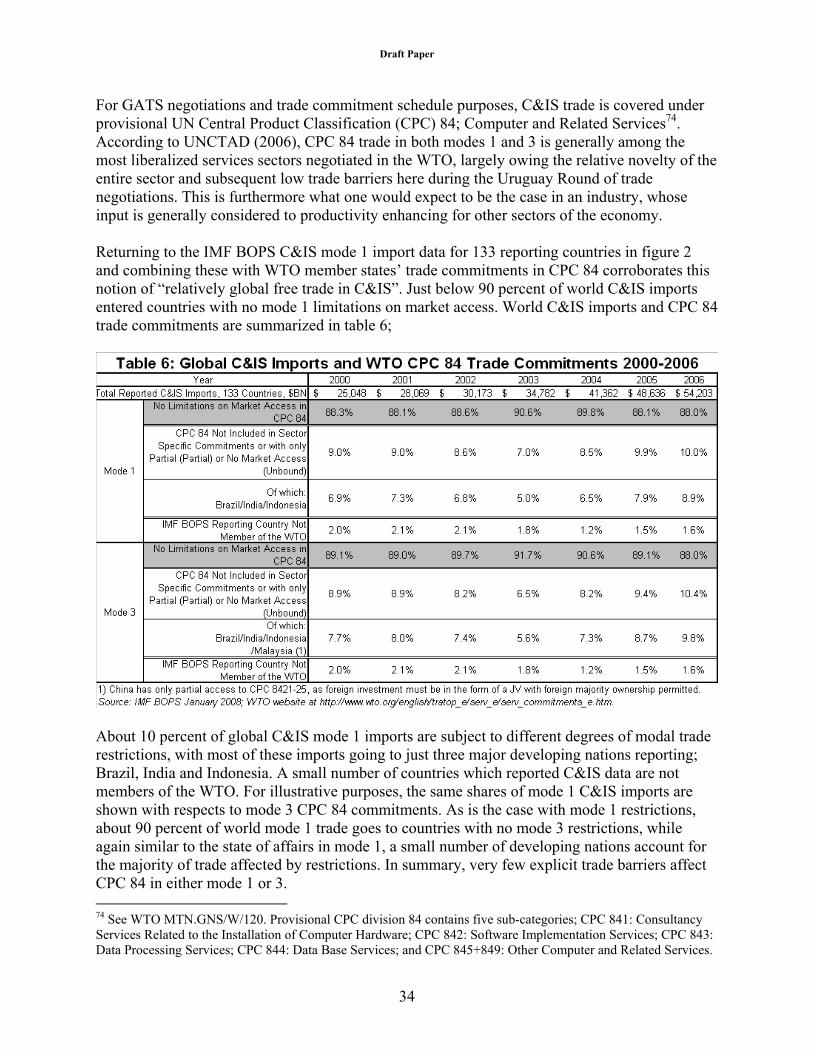
Draft Paper
34
For GATS negotiations and trade commitment schedule purposes, C&IS trade is covered under provisional UN Central Product Classification (CPC) 84; Computer and Related Services74. According to UNCTAD (2006), CPC 84 trade in both modes 1 and 3 is generally among the most liberalized services sectors negotiated in the WTO, largely owing the relative novelty of the entire sector and subsequent low trade barriers here during the Uruguay Round of trade negotiations. This is furthermore what one would expect to be the case in an industry, whose input is generally considered to productivity enhancing for other sectors of the economy. Returning to the IMF BOPS C&IS mode 1 import data for 133 reporting countries in figure 2 and combining these with WTO member states’ trade commitments in CPC 84 corroborates this notion of “relatively global free trade in C&IS”. Just below 90 percent of world C&IS imports entered countries with no mode 1 limitations on market access. World C&IS imports and CPC 84 trade commitments are summarized in table 6;
About 10 percent of global C&IS mode 1 imports are subject to different degrees of modal trade restrictions, with most of these imports going to just three major developing nations reporting; Brazil, India and Indonesia. A small number of countries which reported C&IS data are not members of the WTO. For illustrative purposes, the same shares of mode 1 C&IS imports are shown with respects to mode 3 CPC 84 commitments. As is the case with mode 1 restrictions, about 90 percent of world mode 1 trade goes to countries with no mode 3 restrictions, while again similar to the state of affairs in mode 1, a small number of developing nations account for the majority of trade affected by restrictions. In summary, very few explicit trade barriers affect CPC 84 in either mode 1 or 3. 74 See WTO MTN.GNS/W/120. Provisional CPC division 84 contains five sub-categories; CPC 841: Consultancy Services Related to the Installation of Computer Hardware; CPC 842: Software Implementation Services; CPC 843: Data Processing Services; CPC 844: Data Base Services; and CPC 845+849: Other Computer and Related Services.

Draft Paper
35
To the degree that bilateral US C&IS trade data is available, a similar situation emerges for US C&IS exports. Over 95 percent of (unaffiliated) mode 1 and 98 percent of mode 3 exports75 go to countries with no limitations on market access. While it of course could be argued that such high percentages of US “free trade C&IS exports” indicates precisely how distorting existing GATS market barriers are in the few countries that have them, the more relevant implication is that market access under the GATS is not a particularly important hindrance for US C&IS trade. Instead, relevant trade barriers for US C&IS trade are similarly to most professional services be found in the form of behind-the-border regulations. IV.b US Domestic Regulatory and Other Barriers to Mode 1 and 3 Trade in C&IS
C&IS as analyzed in this paper is a relative novel product category and further characterized by a very high degree of dynamism and rapidly changing product characteristics and capabilities. As a result hereof, government regulation hereof in general can be expected to struggle to “catch up with developments in the C&IS market place” and the sector correspondingly be relatively lightly regulated. The C&IS product category further benefits from its intangible character, which inherently places it outside the jurisdiction of most product safety regulation. It is simply not a worry to US regulators whether imported C&IS services might contain too much lead. Similarly, this author has found no instances of official professional certification requirements for workers taking up employment in the IT services industry76. In total, this points to C&IS being a relatively lightly domestically regulated sector. At the same time, however, C&IS is potentially a high-tech product for which trade might potentially be regulated on the grounds of national security. The United States is a participant in the so-called Wassenaar Arrangement on Export Controls for Conventional Arms and Dual-Use Goods and Technologies77. The aim of the Wassenaar Arrangement is to ensure that transfers of for instance advanced technology products do not contribute to the development or enhancement of military capabilities which undermine and international security and stability, and are not diverted to support such capabilities78. On the Wassenaar “Control List” of regulated “dual-use products” as well as the associated lists of “Sensitive Items” and “Very Sensitive Items”, trade and exchange of software for the development, production and use of a series of high-tech products is regulated and restricted79. 75 More aggregate asset data suggests that more than 80 percent of analytically relevant US investments are in countries with no restrictions on CPC 84 mode 3 market access. Asset data is only available for NAICS higher two-digit categories. 81 percent of assets in categories “51; Information” and “54; Professional, technical and scientific services”, which includes all three C&IS industries chosen for this paper were in 2005 in countries with no limits on mode 3 market access in CPC 84. Source: BEA comprehensive financial and operating data, table IIIB-5. 76 In fact, many initial workers in the IT services industry were self-taught and had relatively few direct formal educational qualifications. The Indian IT services industry association, NASSCOM, has a voluntary program to combat the risk of data theft in which employees are subjected to background screenings before being employed in the industry. See www.nasscom.org. for details. 77 The Wassenaar Arrangement consists of 40 countries and includes all OECD and most EU countries as well as Russia and the Ukraine. 78 See http://www.wassenaar.org/introduction/index.html. 79 See the full Control Lists for the Wassenaar Agreement at http://www.wassenaar.org/controllists/index.html.

Draft Paper
36
US national law – the so-called Exports Administration Regulations (EAR) – administered by the Department of Commerce’s Bureau of Industry and Security implements the Wassenaar rules in the US80. Yet, as information concerning the precise implementation of EAR is overwhelmingly confidential, it is not immediately possible to gauge the scope of its potential inhibiting effect on US C&IS trade. However, as the Wassenaar Arrangement explicitly do not cover software, which is generally available to the public81 or already in the public domain, and covers only software related to very high-performance items82, the direct quantitative impact of these national security related trade restrictions can be expected to be relatively modest. EAR concerns itself only US C&IS exports, but a related national security worry of potential relevance to foreign investments in the US, i.e. C&IS mode 3 imports, is the so-called CFIUS process. The Committee for Foreign Investments in the United States has since 1977 regulated foreign acquisitions of US companies83. The CFIUS is an inter-agency committee led by the US Treasury, which reviews proposed foreign takeovers of US companies and may advice the US president that the executive “suspend or prohibit any foreign acquisition, merger or takeover of a U.S. corporation that is determined to threaten the national security of the United States”84. Companies about to engage in cross-border acquisitions which fears that their plans may be deemed to pose a risk to “US national security” will notify the CFIUS of their intentions, submit supporting material to the Committee and hope to receive an official clearance for the transaction to go through85. What “national security” actually means was, however, not defined precisely in the original US law. Several subsequent amendments to the original regulation86 has since provided several factors that the CFIUS may consider in determining whether a threat to US national security arises from a particular proposed transaction87;
(1) Domestic production needed for projected national defense requirements;
(2) The capability and capacity of domestic industries to meet national defense requirements, including the availability of human resources, products, technology, materials, and other supplies and services;
(3) The control of domestic industries and commercial activity by foreign citizens as it affects the capability and capacity of the U.S. to meet the requirements of national security;
80 See http://www.bis.doc.gov/. 81 Defined as being sold from stock at retail selling points without restriction. 82 The US Department of Commerce, Bureau of Industry and Security’s Commerce Control List states that US export controls concerns only computers and software with a capacity of more than 0.75 Weighted TeraFLOPS (WT). See US Export Administration Regulations at http://www.access.gpo.gov/bis/ear/pdf/ccl4.pdf. 83 The discussion of CFIUS in this section draws extensively on the authoritative analysis in Graham and Marchick (2006). 84 See http://www.ustreas.gov/offices/international-affairs/cfius/. 85 The “voluntary aspect” of the CFIUS notification process is of course strongly incentivized by the desire of transacting companies to ensure that their transaction is not revisited and annulled by US authorities post-facto for national security reasons. 86 Executive Order 11858 from 1975. 87 See http://www.ustreas.gov/offices/international-affairs/cfius/.

Draft Paper
37
(4) The potential effects of the transaction on the sales of military goods, equipment, or technology to a country that supports terrorism or proliferates missile technology or chemical and biological weapons;
(5) The potential effects of the transaction on U.S. technological leadership in areas affecting U.S. national security.
(6) The acquirer is controlled by or acting on behalf of a foreign government; and
(7) The acquisition "could result in control of a person engaged in interstate commerce in the U.S. that could affect the national security of the U.S."
The CFIUS legislation and the potential for the US government to block foreign acquisitions of high-tech US IT Services companies and thereby inhibit C&IS mode 3 imports is in theory as can be seen quite broad. However, in reality this sweeping authority is countered by the stated desire of US authorities to maintain an open investment policy and the actual instances of CFIUS blocking foreign acquisitions of US companies have been very few. As laid out in Graham and Marchick (2006:56ff), out of a total 1,593 notifications CFIUS from 1988-2005 (accounting for approximately 10 percent of total FDI in the US over this period), the CFIUS carried out just 25 investigations, resulting in 13 voluntary withdrawals of proposed transactions and just a single formal presidential rejection of a transaction. In reality therefore the overall direct impact of CFIUS on investments in the US has been very limited and in the IT services sector non-existing88. At the same time, however, the in-direct pre-emptive effect of the CFIUS legislation – i.e. the number of foreign investments that were never attempted, or voluntarily withdrawn very early after initial informal inquiries with US authorities, or submitted for notification in an altered reduced form so as to gain CFIUS approval – cannot be gauged, but according to Graham and Marchick (2006) might be substantial. The extent to which this has affected US mode 3 C&IS imports cannot however be immediately quantified. Similarly it is clear that with acquisitions made by foreign entities controlled by or acting on behalf of a foreign government explicitly targeted by the CFIUS process, many if not most companies from for instance China as well as some European companies may find it difficult to gain regulatory approval of acquisition of US IT services companies89. In summary, it is appropriate to conclude that US domestic regulation and national security concerns raises few direct barriers to US C&IS trade. However, this relative scarcity of explicit US domestic regulations directly affecting C&IS trade, in all probability masks another and likely much larger effect that indirect domestic regulation of IT services products has on the scope of C&IS trade. The key issue here is the characteristic of C&IS as an intermediate input to other traded products and services, and as facilitator and vehicle of transmission for frequently regulated information flows. This occurs when for instance domestic regulation requires that web-site interfaces and audiovisual services are made available in multiple (local) languages.
88 None of the transactions that were voluntarily withdrawn or the single rejection according to Graham and Marchick (2006) occurred in the IT services industry. 89 See discussion in Graham and Marchick (2006: 104ff) and Bottilier (2004).

Draft Paper
38
Another example of regulation indirectly affecting US C&IS trade – this time not even US domestic regulation – is the EU Directive for Data Protection (DDP)90, which since 1998 has prohibited the transfer of personal data to non-EU countries (including the US) that is deemed to not meet the EU adequacy standard for privacy protection. The EU DDP has mattered profoundly for US C&IS trade, even if this effect does not come from regulation applicable directly to the US IT services sector. A brief discussion of the DDP therefore provides an illustrative example of how an indirect effect on C&IS trade flows origins with the domestic regulation of other sectors. The DDP requires a high level of protection of personal information91 within the EU and forbids the transmission to and processing of such data by non-EU entities not adhering to this standard. Moreover, the DDP is very far reaching in its jurisdiction as it employs a wide-ranging definition of “processing” of personal data. The legal definition describes that “processing” goes far beyond collection of personal data and takes the following meaning: “processing of personal data' ('processing') shall mean any operation or set of operations which is
performed upon personal data, whether or not by automatic means, such as collection, recording, organization,
storage, adaptation or alteration, retrieval, consultation, use, disclosure by transmission, dissemination or
otherwise making available, alignment or combination, blocking, erasure or destruction; 92”
Essentially the DDP therefore covers almost any type of action carried out involving a very extensive list of personal information (see definition in footnote 93) and effectively excludes non-EU (as well as non-complying domestic EU companies) companies from engaging in such transactions. The US Department of Commerce notes diplomatically that;
“As a result of …. different privacy approaches, the Directive could have significantly hampered the ability
of U.S. companies to engage in many trans-Atlantic transactions”93.
Flowing from the potential for the DDP to act as a regulatory barrier to trade, the US and EU regulators in 2000 set-up the so-called “safe harbour” arrangement, where US companies can voluntarily submit to a series of requirements that are deemed by the European Commission to guarantee “adequate” protection of EU personal data. According to the on-line listing provided by the US Department of Commerce, 1,487 US organizations have registered with the “safe harbour ”since its start in 200094. Breaking down the registered companies by industry illustrates just how important the “safe harbour” has been for the US IT services industry since 2000 and by extension illustrates how hard relative to other industries this type of domestic EU regulation
90 EU Directive 95/46/EC, available at http://ec.europa.eu/justice_home/fsj/privacy/law/index_en.htm. 91 EU Directive 95/46/EC article 2 has the following definition of personal information: “personal data' shall mean any information relating to an identified or identifiable natural person ('data subject'); an identifiable person is one
who can be identified, directly or indirectly, in particular by reference to an identification number or to one or more
factors specific to his physical, physiological, mental, economic, cultural or social identity”. Available at http://eur-lex.europa.eu/LexUriServ/LexUriServ.do?uri=CELEX:31995L0046:EN:HTML. 92 EU Directive 95/46/EC article 2. 93 See Department of Commerce Website at http://www.export.gov/safeharbor/SH_Overview.asp. 94 List accessed on June 13th 2007. Available at http://web.ita.doc.gov/safeharbor/SHList.nsf/WebPages/Safe+Harbor+List?OpenDocument&Start=1.

Draft Paper
39
would have hit the US IT services industry’s ability to trade with the EU. Figure 13 provides the top-20 industries registered in June 200795.
Figure 13: US Companies Registrered With Department of Commerce
"Safe Harbour" List June 2007, By Top-20 Industries
435422
355
152
11297
8879 78 74
63 62 54 52 4737 33 31 27 26 26
466
0
50
100
150
200
250
300
350
400
450
500
Com
puter S
ervice
s
Com
puter S
oftw
are
Info
rmation Se
rvices
Gen
eral S
ervice
s
Man
agem
ent C
onsu
lting
Ser
vice
s
Adv
ertis
ing Se
rvices
Employ
men
t Service
s
Dru
gs &
Pha
rmac
eutic
als
Educ
ation & Training
Teleco
mmun
ications
Ser
vice
s
Com
puter &
Per
iphe
rals
Fina
ncial S
ervice
s
Trav
el &
Tou
rism Ser
vice
s
Biotech
nology
Hea
lth C
are Se
rvices
Med
ical E
quipmen
t
Con
sumer
Electro
nics
Gen
eral C
onsu
mer
Goo
ds
Indu
stria
l Che
micals
Acc
ounting Se
rvices
Elec
tron
ic C
ompo
nent
s
All Oth
er In
dustrie
s
Num
ber
of C
om
panie
s
Source: US Department of Commerce Figure 13 shows how the top-3 industries in which US companies have registered for “safe harbour” status in order to be able to conduct their business within the EU or with EU entities roughly approximates the US IT services industry96. While it is very difficult to quantify the impact hereof, figure 13 shows how a domestic data privacy regulation in Europe has clearly directly affected the ability of the US C&IS industry to trade in and deliver its services. A similar instance of a large indirect effect of domestic regulation on US C&IS trade would have occurred when the US government in late 2006 banned internet gambling97. Suddenly an entire US industry, whose product – gambling over the internet – can only be delivered utilizing C&IS products was outlawed. Or for instance, when the American Registry of Radiologic
95 In the online Department of Commerce listing, individual companies are registered frequently in multiple individual industries. This reflects the same issue of individual companies conducting business in multiple sectors of the economy as illustrated with IBM in figure 3 above. The Department of Commerce list for “safe harbour” registration, however, unlike the BEA’s surveys is not administered on a “primary industry of operations basis”, but instead registers individual companies in all of their principal industries of operation. IBM for instance is registered in both “computer services”, “computer software” and “computer and peripherals” (hardware) in this list. As a result, the total sum of individual industry registrations significantly surpass the number of registered companies. 96 A similar dominance of US IT services companies is found in the “safe harbour” list provided in Greer (2007). The industry classification system used in the Department of Commerce online list is not provided by the Department of Commerce. 97 See for instance MSNBC News “Will ban end Internet gambling? Don’t bet on it”, October 17th 2006.

Draft Paper
40
Technologists (ARRT) requires that readers of certain medical radiologic scans of US patients are certified in the US to carry out this task98. Were this not the case, this service could likely otherwise by offshored more easily to other destinations utilizing products and services provided by US or foreign C&IS companies. Domestic regulation in the medical sector in this instance directly blocks the potential business of US C&IS providers. As C&IS continues to develop, the list of such indirect effects of domestic regulation on the C&US sector is likely to continue to expand. At the same time, however, it is crucial to note that domestic regulation need not necessarily always act to block C&IS trade. It might just as well in fact create a novel market niche for new products. Just as is the case in the financial sector, where new products – such as off-balance sheet special purpose vehicles (SPVs) – are constantly developed to attempt to circumvent fiduciary regulation and accounting rules, government regulation of other sectors can also create new demand for C&IS. A high-profile US example of new government regulation in another sector suddenly creating a new market for C&IS products is the 2002 Sarbanes-Oxley Act. This law implemented sweeping changes in US corporate governance, accounting and disclosure rules, and required that all US public companies put in place far reaching new internal controls and disclosure procedures. This spurred the creation of an entire new market for “Sarbanes-Oxley compliance software” for US corporate clients, which quickly became a multi-billion dollar market for the US software and IT services industry99. In brief summary, US C&IS trade seems to face few explicit trade barriers at the border and are similarly subject to limited direct C&IS specific domestic US regulation and national security concerns. However, the demand for C&IS is invariably heavily affected by the domestic regulation in the US or abroad of other sectors and products and changes herein. Such regulatory changes have a large indirect impact on C&IS trade, although the quantitative scope hereof is very difficult to estimate. V US C&IS Trade in Mode 4 V.a Towards An Empirical Methodology For Estimating US C&IS Trade in Mode 4
As mentioned in section II.d above and stated repeatedly in the MSITS (2002) annex 1, no existing national or international statistical system satisfactorily captures the scope of mode 4 from a trade perspective100. This section sketches out a preliminary methodology for approximating US C&IS trade in mode 4. Two substantial constraints must, however, be made immediately clear; First of all that no estimates can be made for US C&IS mode 4 exports, as no data is available describing the temporary presence abroad of either US citizens or employees of US companies. Secondly, that this section must adopt the definition of “temporary presence” defined in US domestic immigration laws, as the source of data for this section is immigration records provided by the US Department of Homeland Security.
98 See the ARRT website at http://www.arrt.org/index.html. 99 See for instance BusinessWeek “The Sarbanes-Oxley Software Race”, July 12th 2005; Wall Street Journal “Software for Sarbanes”, April 25th 2005; or SearchCIO.com “Spending on Sarbanes-Oxley software climbs”, February 8th 2006; 100 See also Dobson (2002), Lemaitre (2004) and Singh (2005) for explorative evidence and discussion of mode 4.

Draft Paper
41
US immigration law operates with two main temporary visa categories that are of interest to the analysis of C&IS mode 4 trade; the L-1101 visa for intra-company transferees and the H-1B102 visa for high-skilled workers103. The temporary L-1 visa is available to transfer foreign workers who have been employed at a (by definition) multinational company outside the US for a minimum of 1year to a US location within the same company. As such it corresponds with the US horizontal GATS commitments for intra-company transferees, as described in US schedule of specific commitment104. Figure 14 shows how issuance of L-1 visas have increased rapidly in recent years and how L-1 visas issued to Indian nationals account for essentially the entire increase after 2000.
101 The L-1 visa category is classification applies to intra-company transferees who, within the three preceding years, have been employed abroad continuously for one year, and who will be employed by a branch, parent, affiliate, or subsidiary of that same employer in the U.S. in a managerial, executive, or specialized knowledge capacity. It is valid for up to 7 years (5 years for specialized knowledge capacity). No labor certification is necessary. See http://travel.state.gov/visa/temp/types/types_1271.html. 102 The H-1B visa category applies to persons in a specialty occupation which requires the theoretical and practical application of a body of highly specialized knowledge requiring completion of a specific course of higher education, generally the equivalent of a bachelor’s degree. It is valid for three years and renewable once. 103 In addition, US law provides foreign graduates of US universities with a temporary 1 year “Optional Practical Training” (OPT) opportunity for employment after receiving their degree. However, as no data is available on the sectoral and occupational characteristics of foreign students temporarily employed in the US under OPT, it cannot be included in the analysis in this paper. See Kirkegaard (2005) and (2007) for a detailed discussion of the characteristics of these visa categories and OPT. 104 GATS/SC/90, available at the WTO database at http://www.wto.org/english/tratop_e/serv_e/serv_commitments_e.htm#commit_exempt.

Draft Paper
42
Figure 14: Issuance of L-1 Visas at US Consular Offices
FY1996-FY2006
26,49231,913
34,496 36,379
44,547 46,385
38,836 38,02340,860 39,211 38,961
1,350
1,6282,276
4,206
9,306
11,908
17,812 18,124
20,648 24,926
31,787
0
10,000
20,000
30,000
40,000
50,000
60,000
70,000
80,000
1996 1997 1998 1999 2000 2001 2002 2003 2004 2005 2006
All Other China India
Source: US Department of State - Bureau of Consular Affairs Annual Reports of the Visa Office 2000-2006 No data is available on the total sectoral breakdown of L-1 visa recipients. However, as the L-1 visa is granted at the company-level, data is available for the most recent years on the use of L-1 visas by individual companies. This is also the case for the H-1B visa category. Table 6 shows the top-25 company recipients of L-1 and H-1B visas in fiscal year 2006.

Draft Paper
43
Table 6 shows several things; First of all that the most intensive company users of either the L-1 and H-1B visa are IT services/software companies. As such, it is evident that US mode 4 C&IS imports are concentrated in C&IS, while far less prevalent in other individual sectors. Secondly, it is evident that a relatively limited number of Indian IT services companies dominate the very top as the most intensive users of both the L-1 and H-1B visas. As such, it is reasonable to assume that vast majority of the increase in the issuance L-1 visas to Indian nationals since 2000 shown in figure 14 is accounted for by an increase in L-1 recipients in the IT services industry. Thirdly and of most immediate relevance here, the fact that it is largely the same IT services companies that are the most intensive users of both the L-1 and H-1B systems (12 companies in total and nine IT services/software were among the top-25 users of both the L-1 and H-1B in FY2006) indicates that the two visas in the IT services industry functions as close substitutes for each other. An estimate of both L-1 and H-1B visa usage should therefore be included in any US C&IS mode 4 import approximation. This would further indicate that the working conditions for foreign workers on L-1 and H-1B visas in the IT services are likely to be quite similar. This is important, as information on average wages for temporary workers in the IT services sector are only available for H-1B workers and not for L-1 workers. However, based upon table 6, this paper will argue that it is reasonable to assume that foreign temporary workers on L-1 visas in the IT services industry earn roughly the same wages as their colleagues toiling on H-1B visas105.
105 The GATS mode 4 covers foreign workers temporarily employed at both foreign-owned and domestically-owned companies. In GATS mode 4 terms, there is subsequently no distinction between a US and an Indian IT services company operating in the US market. See MSITS (2002:p.74). However, in terms of the potential overlap between modes 3 and 4 in estimated C&IS imports, whether the ownership is American or Indian makes a very large difference. This issue is discussed in section VI.

Draft Paper
44
More detailed data is generally available describing the population of foreign workers on H-1B visas in the United States. An H-1B visa is valid for initially three years and then extendable for a continuing 3 years. The H-1B visa hereby accounts for the US horizontal commitment in mode 4 for “specialty occupations”106. The Department of Homeland Security from 2000-2005 published an annual report called “Characteristics of Specialty Occupation Workers (H-1B)”, which included detailed data by fiscal year (in the US from October to September) on the number of H-1B recipients by own occupation and sector of employer, as well as the wages they receive107,108. Data for the number of H-1B recipients working in the sectors of interest for this paper and their average annual wages allows for the estimation of the approximate total annual wage income received by H-1B holders working in the IT services industry in the US. Annual H-1B visa issuance numbers and wage data for the IT services industry, as well as cumulative wages received estimates, are presented in table 7.
A large number of simplifying methodological assumptions underlie the data in table 7. The most important are: 1) As all visa data should be treated as gross data, the “departure assumption” in table 7 is that all H-1B recipients remain employed in the US for the entire three year duration of their H-1B visas109; 2) It is assumed that all H-1B recipients received their H-1B 106 See GATS/SC/90, available at the WTO Website at http://www.wto.org/english/tratop_e/serv_e/serv_commitments_e.htm#commit_exempt. 107 All wage estimates are base wages, and do not include the value of employment benefits (healthcare coverage etc.) or bonuses. 108 Note that all data utilized for H-1 visas in this paper are from official US government sources and refers only to actual H-1B visas issued. This sets the data in this paper apart from “data” presented on H-1B visa recipients coming from the US Department of Labor’s Foreign Labor Certification Database at www.flcdatacenter.com. The data in this database includes submitted data for all “potential H-1B recipients”, rather than the far smaller sub-category of foreign workers who actually go on and ultimately receive their H-1B visa. As such, use of the Department of Labor database for work analyzing the actual population of US H-1B workers is misleading and should be avoided. See Kirkegaard (2005) for a discussion of this issue. At the same time, the accuracy of the DHS data presented here should not be overestimated and very significant degrees of uncertainty correspondingly surround all estimated values in this section. 109 See for instance Lindsey (2000) for earlier estimates that include other assumptions for H-1B departure times.

Draft Paper
45
visa on the first day of the fiscal year; 3) It can be seen in table 7 that H-1B recipients on continuing visas earn significantly higher wages than do initial H-1B visa recipients ($68,000 vs. $52,000 in 2005). This is unsurprising, as a continuing H-1B visa recipient will usually at that time have at least 3years of additional work experience. For cumulative wage estimations, it is subsequently assumed that H-1B recipients have annual linear wage increases throughout their full 6 year stay in the United States, equivalent in scope to 1/3 of the increase between initial and continuing H-1B recipients. Table 7 shows how there were a very large drop in H-1B usage in the US IT services industry after the internet bust and the end of Y2K from FY2001-2002. This shows how mode 4 trade – perhaps indicating that “companies let go of foreigners first” – is strongly affected by the business cycle110. Table 7 further presents estimates for the total wages received by H-1B visa holders employed in the US IT services industry; they amounted to about $15bn annually from FY2003-2005. The decline from FY2003 to FY2004 is a delayed echo-effect of the large decline in H-1B visa issuance after 2001. Note that with data from 2001 only and a three year duration of the H-1B visa, cumulative estimates cannot be computed for 2001 and 2002. Table 6 showed how a large number of L-1 recipients are also temporarily employed in the US IT services industry. How many cannot be accurately discerned from available data. However, as a very rough approximation this paper will highly arbitrarily assume that a conservative 50 percent of the total number of Indian L-1 recipients take up 5 year employment in the US IT services industry at wages equivalent to similar workers employed in H-1B visas. Employing the same methodological assumptions as for table 7, this indicates that foreign workers on L-1 visas in the US IT services industries received an approximate total wage remuneration of $1.8bn, $2.3bn and $2.9bn annually from 2003-2005. A very tentative total approximate wage income for the foreign workers temporarily employed in the US IT services industry on L-1 and H-1B visas, based on limited available data, therefore lies in the $16-$19bn range from 2003-2005. As discussed in section II, the BPM5 captures aggregate compensation for the provision of cross-border labor in the entry “compensation of employees” if earned from employment lasting less than 1y and in the entry “workers’ remittances” for employment over longer durations. With the purpose of estimating the value of services provided by natural persons in mode 4, it is not just wage income that must be included, but rather an estimate of the total value of the service or services package delivered. Wage costs will make up the largest share of the total value of services delivered by natural persons, but in order to approximate the total service value a mark-up profit margin should be added to aggregate wage costs. How large such an aggregate mark-up for mode 4 services delivered in the IT services industry in the US ought to be is a difficult empirical question. The IT services industry is generally known to be a relatively high margin industry. A quick look at the financial statements of the top companies in table 6 confirms this and reveals that the gross profit margins111 at Infosys from
110 Kirkegaard (2005 and 2007) discusses the cyclical aspects of H-1B program usage in greater detail. 111 Gross profit margin refers to company revenues minus the cost of goods sold (COGS). COGS refers to the costs of production directly attributable to the product sold (i.e. variable costs). As such, it will include direct labor costs and materials, but not indirect (fixed) costs, such as buildings, distribution and administration. For the purposes of

Draft Paper
46
2003-2008 were over 40 percent112, Wipro over 30 percent in the same period113, Tata Consulting Systems in 2006-08 at about 44 percent114 and IBM over 40 percent from 2005-07115. Based on company total gross profit margins in the IT services sector, a sizeable mark-up on wage costs to reach the total value of services delivered by natural persons in the US market through mode 4 would seem justified. However, as it is not possible to estimate the specific margins involved in the work carried out by L-1 and H-1B visa holders, and as the profit margins for leading industry firms are likely higher than for the industry as a whole, this paper will settle for a more conservative 20 percent gross profit margin to be added to mode 4 wage costs. This produces an approximate estimate for the total value of US mode 4 C&IS imports from 2003-2005 in the range of $20-23bn annually. This estimate is highly dependent on the assumptions made in its estimation and should therefore be treated with substantial caution concerning its validity. The issue of overlap between mode 4 and other modes of supply in US C&IS imports will be analyzed in section VI. V.b The Impact of US Visa Regulations on Mode 4 C&IS Trade
Immigration policies have been the subject of intense domestic debate in the US in recent years and the L-1 and H-1B visas have not been exceptions116. This raises the issue of the degree to which the regulation of these two visa programs may have acted as a domestic regulatory barrier to trade in mode 4 by limiting the access of temporary foreign workers to the US market. This is particularly an issue with the H-1B program, which have been regulated by an annual quota since its inception with the Immigration and Naturalization Act of 1990117. The L-1 program has no numerical limits or quotas and therefore offers relatively free access to intra-company transfers to the US under the L-1 guidelines described above. Undoubtedly, this is one of the reasons that the IT services companies in table 6 are heavy users of this visa and that the inflow of Indian nationals on L-1s have been rising rapidly in recent years118. The H-1B program has always had an annual quota attached to it of initially 65,000 and up to 195,000 from FY2001 to FY2003. Since FY 2004, the annual quota has been 65,000 with an
mode 4 trade, fixed costs can by definition be expected to be relatively small and use of gross profit margins is most appropriate. All financial data directly referred to in this paper will be reported on the basis of US GAAP. 112 See Infosys 2008 20-F filing with the SEC, available on the SEC website at http://www.sec.gov/Archives/edgar/data/1067491/000106749108000015/form20f.htm. 113 See Wipro 2008 20-F filing with the SEC, available on the SEC website at http://www.sec.gov/Archives/edgar/data/1123799/000095013408010518/f41205e20vf.htm. 114 See TCS financial report from Q4 2007-08, available at the TCS website at http://www.tcs.com/investors/Documents/Financial%20Statements/TCS_USGAAP_2007-08.PDF. 115 See IBM statement of consolidated earnings at http://www.ibm.com/investor/financials/index.phtml. 116 See the numerous statements and legislative activities of for instance US Senator Grassley at http://grassley.senate.gov/public/index.cfm?FuseAction=Issues.View&Issue_id=162d578c-0862-4135-a0ed-da0f73a9fee2. See also Kirkegaard (2005) and (2007), Hanson (2005) for listings of media coverage of this issue. 117 This section will discuss only the quantitative impact of explicit restrictions on visas in the L-1 and H-1B visa programs and not consider any potential trade impact of the general tightening of “security at US borders” since September 2001 and the subsequent creation of the Department of Homeland Security. 118 The L-1 visa is also in some respects cheaper for companies to use than is the H-1B visa, which is subject to specific fees of several thousands dollars per visa. See Kirkegaard (2007) for details.

Draft Paper
47
additional 20,000 H-1B visas made available to foreign graduates of US universities in 2005. However, it is important to realize that the annual H-1B quota is not comprehensive and does not cover all types of H-1B applications. Several important exceptions to the quota exist, meaning that the annual total number of H-1B visas actually issued each fiscal year to foreign workers is far higher than the annual quota. The two most important exceptions are that the quota applies for initial H-1B visas only and does not apply to H-1B visa extensions, nor does it does it apply for educational and non-profit research organizations. Table 8 has the most recent available data;
Table 8 shows how – despite the H-1B quota – over 250,000 H-1B visas were issued in FY2004-2005 with over 100,000 issued for initial employment in each year. In a broad quantitative sense, the impact of the H-1B quota on the ability of foreign temporary workers to enter the US is therefore evidently smaller than the headline 65,000 quota would suggest. Similarly it can be seen that the IT services industry especially in 2004 and 2005 accounts for a very large share of the total number of H-1B visas issued for initial employment. The dominance of the IT services industry in terms of “getting available H-1B visas” increases, if one assumes not unreasonably that most prospective employers in the IT services industry are subject to the H-1B quota. The aggregate data from FY2000-2005 in table 8 therefore confirms the large role of the IT services industry in the H-1B program found also at the company level in table 6 in FY2006. At the same time table 8 shows that in for instance FY2002 and FY2003 (when the quota was 195,000), there were large numbers of unused H-1B visas under the quota available. This again illustrates the cyclicality in company use of temporary work visas, as it is not simply a matter of US businesses always snapping up all available visas. It is the business cycle, rather than H-1B quotas and availability, that largely determines how many temporary visas IT services companies require. This points to the perhaps surprising conclusion that while quotas in the H-1B program clearly has a restricting impact on the scope for foreign workers to temporarily enter the US on an H-1B visa in the aggregate – something that can be seen in the right hand side of table 8 where as the number of petitions for H-1B visas under the quota have far exceeded availability in both FY2007 and FY2008 – this does likely not impact the IT services industry very much, as IT services companies seems consistently able to acquire a very large number of H-1B visas. So large, in fact that it seems unlikely that the quantitative restrictions on H-1B visas have had a material impact on the IT services industry’s ability to “trade in mode 4” in recent years.

Draft Paper
48
This ability of IT services companies to secure large numbers of H-1B visas for their temporary foreign workers is in all probability directly related to the very substantial resources individual IT services companies spend on immigration lawyers and other visa related costs. Infosys, the top company in FY2006 for H-1B usage for instance states in its 2008 annual 20-F filing with the SEC that it incurred up to $16mn per financial quarter in costs directly related to the obtainment of US work visas. The willingness of profit oriented IT services companies to incur such high visa related expenses is at the same time likely indicative of the high importance of temporary workers and mode 4 trade for their business models (see section VI below). In brief summary, while not immediately quantifiable, it seems unlikely that US visa rules have acted as a significant restriction on mode 4 C&IS trade in recent years. IT services companies have at considerable costs consistently been able to acquire such a large number of US temporary work visas – both in absolute terms and relatively to other industries – that the adverse impact from quantitative H-1B restrictions largely will have fallen outside the C&IS sector. Certainly, IT services companies would have been more profitable in the absence of any quantitative restrictions on US temporary work visas, but it is unlikely that US mode 4 C&IS trade would have expanded much. VI Total US C&IS Trade Broken Down by Mode of Supply
With all modes of supplies for US C&IS trade now approximated to the extent data availability allows, it is possible to present rough values for the relative share of US C&IS trade by mode of supply. This is done in table 9, which also presents several modal estimates of services trade from other sources.
As mentioned earlier, it is clear that for US C&IS exports, mode 3 is the increasingly dominant means of delivery. In table 9, it can be seen that it is far more important than the frequently cited aggregate shares of services trade from Karsenty (2002) would imply. The 90 percent figure for US C&IS mode 3 exports is relatively close to level found for aggregate services exports from four leading industrial nations in Bensidoun and Űnal-Kesenci (2008), even if the slightly higher value again indicates little support for any cross-border tradability revolution in US C&IS
Draft Paper
49
exports. Of particular relevance, however, is the comparison with the survey in Reserve bank of India (2005), which covered Indian exports of computer services119. Comparing US and Indian export figures leads to several conclusions; first that it, as this paper has done, is appropriate to disregard the analysis of mode 2 as a means of delivery for C&IS. Secondly that the Indian data reports a far higher importance of mode 1 delivery than do the US export data. This supports the interpretation from section 3 of C&IS trade stratified by mode with the more standardized C&IS services in which India excels relatively more cross-border deliverable through mode 1, while the higher value-added C&IS services dominated by US IT services multinationals require a higher share of local content, making mode 3 the increasingly preferred choice for delivery. So far on the C&IS import side, due to lack of available data, this paper attempted no analysis of the potential for overlap between US C&IS imports in modes 3 and 4 as estimated in this paper. Such an overlap through double-counting would for instance occur if foreign majority-owned affiliates in the US markets sold services in mode 3, overwhelmingly delivered by a foreign workforce temporarily employed at these foreign affiliates and thus in theory also counting towards mode 4 trade as defined in this paper. While the available data does not allow for a sensible quantification of the scale of any such double-counting for the entire industry, table 6 makes it clear that at least for Indian IT services companies operating in the US, this overlap between modes 3 and 4 is extremely high. The vast majority of employees at Indian IT services affiliates operating in the US market are without doubt Indian nationals employed temporarily in the US120. As such, it is overwhelmingly likely that substantial overlap exists between the estimates made in this paper of US C&IS imports in mode 3 and mode 4. Comparing the different estimates in table 9 further, irrespective of the scale of the overlap between modes 3 and 4 in US C&IS imports, lends support to the conclusion from section V that mode 4 trade seems much more important for C&IS trade than for services trade in general. Similarly, mode 1 delivery for US C&IS imports is relatively less important than for services in general.
VII US C&IS Trade and the Impact of NAFTA The NAFTA went into effect in 1994 and through its negative list liberalized most services trade and investment between Canada, Mexico and the US121. We saw in figure 10, 11 and 12 how Canada is the biggest unaffiliated mode 1 C&IS exporter to the US, takes a limited number of US mode 1 unaffiliated C&IS exports, and how US C&IS exports to both Canada and Mexico are less mode 3 intensive relatively to mode 1, suggesting that sharing a common border increases the importance of mode 1 deliveries. The question is, whether any of this has anything to do with the provisions in NAFTA or not?
119 See RBI (2006) and (2008) for later estimates of Indian exports of C&IS. 120 The SEC filings of the top Indian IT services companies supports the data in table 6 and indicates that each has thousands of Indian IT professionals temporarily employed in the US. See also Commander, Chanda, Kangasniemi and Winters (2008). 121 The discussion of NAFTA in this sections draws upon the analysis in Hufbauer and Schott (1992) and (2005). None of the NAFTA members have any GATS restrictions on CPC84.

Draft Paper
50
Hufbauer and Schott (2005:25) notes that in a relative sense, the services component of NAFTA has been a disappoint with both NAFTA merchandise trade and two-way services trade with non-NAFTA countries growing faster than intra-NAFTA services trade after 1994. A detailed analysis of the impact of NAFTA on C&IS trade is made difficult by the ubiquitous lack of bilateral trade data at this level of detail. No bilateral data is available from Canadian or Mexican sources. Figure 15 illustrates US two-way trade with Mexico and Canada in unaffiliated mode 1 C&IS trade. This is the only available unbroken data series that includes both the period before and after the start of NAFTA.
Figure 15: US Bilateral Mode 1 Unaffiliated C&IS Trade with NAFTA
Members, 1986-2006, $USmn
0
200
400
600
800
1,000
1,200
1,400
1,600
1,800
1986 1987 1988 1989 1990 1991 1992 1993 1994 1995 1996 1997 1998 1999 2000 2001 2002 2003 2004 2005 2006
0
200
400
600
800
1,000
1,200
1,400
1,600
1,800
Exports To Mexico Imports From Mexico
Exports To Canada Imports From Canada
PRE-
NAFTAPOST-
NAFTA
Source: US Bureau of Economic Analysis Figure 15 illustrates that bilateral unaffiliated mode 1 C&IS trade between the US and Canada is quite small (less than $3bn in total in 2006) and trivial between US and Mexico. A strong increase in US imports of this category of services is visible in figure 15, but only by 1997, indicating that it is likely not related to NAFTA provisions122. Similarly, table 4 indicated that US C&IS mode 3 exports to both Canada and Mexico have been flat after 1999. NAFTA contains provisions in mode 4 concerning the so-called TN or “Trade NAFTA” visa, which allows Canadian and Mexican citizens to take up professional occupations on the so-called “NAFTA Professional Job List” in the US, provided several specific provisions are met123.
122 There were no gradual phase-ins of NAFTA provisions in C&IS after 1994. 123 Three criteria must be met for occupations on the list; The alien possesses the specific criteria for that profession; the prospective position requires someone in that professional capacity; and the alien is going to work for a U.S. employer. See US Consular services in Ottawa at http://www.amcits.com/nafta.asp. The NAFTA visa is valid for one year at a time, but renewable in theory indefinitely.

Draft Paper
51
Among the 25 professional occupations on the “general NAFTA” list is “Computer Systems Analyst”, indicating that these NAFTA provisions might have had some impact on the temporary cross-border labor in IT services124. No data is available for visa issuance by individual professional occupation, but the US Department of State’s Bureau of Consular Affairs do publish annual aggregate data for the total TN visa category. These are provided in table 10 from 1997-2006.
As can be seen the aggregate uptake of the TN visa since 1997 has been decisively modest, particularly for Canadian citizens. There is subsequently few indications that any NAFTA provisions have had any noteworthy impact on mode 4 trade in C&IS, as computer systems analysts is just one occupation out of many making up the small total for the TN program. At the same time, survey data of the domestic Canadian IT services industry indicates that it has experienced continued strong growth with operating revenues, employment and numbers of companies in the sector close to trebling from 1997-2006125. Total sales of the Canadian IT services industry reached $CA33bn in 2006, which when compared to US unaffiliated mode 1 imports of C&IS from Canada of just $US1.7bn (a little over 5 percent), indicates that despite rising exports to the US, the Canadian IT services industry is not strongly engaged in C&IS trade. In summary therefore, available data indicates that NAFTA has had very limited impact on regional trade in C&IS after 1994.
Not everything that can be counted counts; and not everything that counts can be counted
Albert Einstein VIII Conclusion
This paper carefully evaluates the statistical strengths and weaknesses of available data on US C&IS trade and estimates the scope of delivery through GATS mode 1, 3 and 4. Estimated trade values adheres to the greatest extent possible to the definitions of modes of supply in the 2002 Manual on Statistics of International Trade in Services and mode 3 is approximated though an adoption of a narrow definition of “commercial presence”, based on sales-in-the-local-market data, closely aligned with the traditional mode 1 definition of cross-border C&IS trade.
124 See full list of NAFTA categories on the NAFTA website at http://www.nafta-sec-alena.org/DefaultSite/index_e.aspx?DetailID=167#Ap1603.D.1. 125 See Statistics Canada (2008) and Statistics Canada online database Table 354-0005.

Draft Paper
52
This paper finds that US exports of C&IS are overwhelmingly and increasingly delivered through mode 3, which at approximately $90bn in 2005 accounts for about 90 percent of the aggregate total. US C&IS imports are also found to be mostly delivered through mode 3, reaching $24bn in 2005, although a strong increase in affiliated mode 1 imports are also found. 2006 is the first year in which the US has runs a mode 1 trade deficit in C&IS, predominantly due to this strong increase in affiliated imports. This suggests that concerning US C&IS exports, modes 1 and 3 are to a degree substitutes for each other, while for US C&IS imports, some complementarity between mode 3 and affiliated mode 1 imports seems to exists. The US is found to have experienced declining overall Revealed Comparative Advantage (RCA) in unaffiliated C&IS trade from 1986-2006, while having a constant negative RCA for affiliated C&IS trade after 1997. A strong and stable positive RCA is estimated for US C&IS trade through mode 3. These results are interpreted to indicate that the US retains a strong competitive position in high value-added non-standardized C&IS that require a large share of local content and therefore are preferably delivered through mode 3. Meanwhile, the US is increasingly importing more standardized C&IS services as intermediate inputs through intra-firm mode 1 delivery. Bilaterally, Europe is found to be the largest US C&IS trading partner by a significant margin in both modes 1 and 3 and no recent surge in US C&IS mode 1 imports from India can be discerned from available data. In terms of relative importance of modes 1 and 3 in US bilateral C&IS exports limited data indicates a positive relationship between the level of economic development in the destination market and delivery through mode 3. This is taken as support for the finding of strong US competitiveness in high value-added C&IS for which demand predominantly exists in economically advanced countries. Indications are also found that a shared (English) language and a common border boost the relative importance of mode 1 delivery of US C&IS exports. The general trade pattern in modes 1 and 3 for US C&IS trade clearly points to that distance and local content requirement continues to play a crucial role, despite this category of services being intrinsically among the most digitizable of traded services. US C&IS trade face few explicit GATS trade barriers at the border, as only a limited number of developing countries have any mode 1 and 3 restrictions in this category. Similarly, US C&IS is found to be subject to limited direct specific domestic US regulation and national security concerns. However, the demand for US C&IS is invariably heavily affected by the domestic regulation in the US or abroad of other sectors and products and changes in such regulation, such as revealed by an analysis of the impact of EU regulation of data privacy. US C&IS imports in mode 4 is explored through the utilization in recent years of the L-1 and H-1B visa programs. Both programs are found to be dominated by companies in the IT services industry, indicating that mode 4 plays a significantly larger role in C&IS than in other business service categories. US C&IS imports are tentatively approximated to have reached $20-23bn in 2003-2005. Due to the employment of large numbers of foreign temporary workers by particularly Indian IT services companies operating in the US market, the overlap between US C&IS mode 3 and mode 4 imports as estimated in this paper is likely to be substantial. Overall, the importance of mode 3 in US C&IS trade is found to be larger than estimates of the relative weight of modes of supply in more aggregate services categories. Due to the ability of IT

Draft Paper
53
services companies to consistently secure a very large share of available US temporary work visas, the adverse impact of US immigration regulation on US C&IS mode 4 imports is deemed to be quite modest. Instead, the trade impact of restrictions on US temporary migration can be expected in other economic sectors. With limited data available for analysis from the pre-NAFTA period, the impact of the 1994 regional FTA is found to small. US mode 1 imports of Canadian C&IS starts to rise only in the late 1990s and US mode 3 exports are stagnant. C&IS trade is of limited importance to the Canadian IT services industry. NAFTA’s limited provisions in mode 4 have had very little impact on C&IS trade. References Used: Anderson, Thomas (2007). US Affiliates of Foreign Corporations: Operations 2005. Survey of Current Business August 2007 p.194-211. Bureau of Economic Analysis, Washington D.C. Balassa, B. (1965), “Trade Liberalisation and ‘Revealed’ Comparative Advantage”, The Manchester School, 33, 99-123. Bensidoun, Isabelle and Deniz Ünal-Kesenci (2008). Globalisation in Services: From Measurement to Analysis. OECD Statistics Directorate Working Paper STD/DOC(2008)3/REV1. OECD, Paris Bernard, Andrew B., J Bradford Jensen and Peter K. Schott. “Importers, Exporters, and Multinationals: A Portrait of Firms in the U.S. that Trade Goods.” National Bureau of Economic Research (Cambridge, MA), Working Paper No. 11404, June 2005. Bottelier, Pieter (2004). Testimony Before the US-China Economic and Security Commission, April 16, 2004. Washington D.C. Borga, Maria and William Zeile. “International Fragmentation of production and the intra-firm trade of U.S. Multinational Companies.” Bureau of Economic Analysis Working Paper 2004-02, January 2004. Bureau of Economic Analysis Online Database for US International Trade in Services, available at http://www.bea.gov/international/intlserv.htm. Bureau of Economic Analysis Annual Financial and Operating Data Tables For Foreign Direct Investment in the US, available at http://www.bea.gov/international/index.htm#omc. Bureau of Economic Analysis Annual Financial and Operating Data Tables For US Direct Investment Abroad, available at http://www.bea.gov/international/index.htm#omc.

Draft Paper
54
Cave, William (2006). How are services being internationalized? Paper presented at 7TH OECD International Trade Statistics Export Meeting ITS, 11-14 September 2006. OECD, Paris Cave, William (2007a). Asymmetries in the OECD Trade in Services By Partner Country Dataset. Presentation at OECD-Eurostat Meeting of Experts in Trade in Services Statistics (TIS), Paris, 18-19 September 2007 Commander, Simon, Rupa Chanda, Mari Kangasniemi and L. Alan Winters (2008). The Consequences of Globalisation: India’s Software Industry and Cross-border Labour Mobility. The World Economy 187-211. Blackwell Publishing Deloitte Research. 2004. The Titans Take Hold. Deloitte Research Financial Services Report by Chris Gentle. Deloitte Research, New York, NY. Dobson, Howard R. (2002). Movement of Natural Persons (Mode 4) Under the GATS. Paper presented at Joint WTO-World Bank Symposium. Available at www.wto.org/english/tratop_e/serv_e/symp_apr_02_dobson_e.doc. Ekholm, Karolina (1998) Headquarter Services and Revealed Factor Abundance Review of International Economics 6 (4) , 545–553. Egger, P. (2008). On the Role of Distance for Bilateral Trade. The World Economy, 653-662. Eurostat (2008). European Union Trade In Services: Analytical Aspects 2008 Edition. Eurostat, Luxembourg. GAO (Government Accountability Office). (2005). U.S. and India Data on Offshoring Show Significant Differences. GAO Report to Congressional Committees GAO-06-116. Washington. Graham, Edward M. and David M. Marchick (2006). US National Security and Foreign Direct Investment. Peterson Institute for International Economics, Washington D.C. Greer, Damon (2007). The US-EU Safe Harbour Framework: Cross Border Data Flows, Data Protection and Privacy. Presentation Given at Department of Commerce/European Commission Conference on Cross Border Data Flows, Data Protection and Privacy, October 15-16, 2007. FTC Conference Center, Washington D.C. Hamilton, Daniel S. and Joseph P. Quinlan (eds.) (2005). Deep Integration How Transatlantic Markets are Leading Globalization, Center For Transatlantic Relations and Centre For European Policy Studies, Washington D.C. Hanson, Gordon H. (2005). Why Does Immigration Divide America? Public Finance and Political Opposition to Open Borders. Peterson Institute For International Economics, Washington D.C.

Draft Paper
55
Hanson, Gordon H., Raymond J. Mataloni, Jr., and Matthew J. Slaughter. “Expansion Strategies of U.S. Multinational Firms," in Dani Rodrik and Susan Collins (eds) Brookings Trade Forum 2001, 2001, pp. 245-294. Hoekman, Bernard (2006). Liberalizing Trade in Services: A Survey. World Bank Policy Research Working Paper 4030. World Bank, Washington D.C. Hoekman, Bernard, Joseph Francois and Julia Woerz (2007). Does Gravity Apply to Intangibles? Measuring Openness in Services Trade. Presentation at CEPII-OECD workshop 23 November 2007. OECD, Paris. Hufbauer, Gary Clyde and Jeffrey J. Schott (1992). North American Free Trade: Issues and Recommendation. Peterson Institute For International Economics, Washington D.C. Hufbauer, Gary Clyde and Jeffrey J. Schott (2005). NAFTA Revisited: Achievements and Challenges. Peterson Institute For International Economics, Washington D.C. IBM Annual 10-K Filings with the SEC 1991-2007. Available at http://www.sec.gov/edgar/searchedgar/companysearch.html. IMF (1995) Balance of Payments Manual, Fifth Edition. IMF, Washington D.C. IMF (2000) World Economic Outlook, April 2000. IMF, Washington, D.C. IMF (2006) Issues Arising from the Update of Balance of Payments Manual, Fifth Edition. Contribution by the IMF Statistics Department for the Nineteenth Meeting of the IMF Committee on Balance of Payments Statistics Frankfurt, October 23-26, 2006. BOPCOM-06/37, IMF, Washington D.C. IMF Balance of Payments Statistics, CD-Rom January 2008. IMF, Washington D.C. INS (US Immigration and Naturalization Service). 2002a. Characteristics of Specialty Occupation Workers (H-1B): Fiscal Year 2000. Washington. INS (US Immigration and Naturalization Service). 2002b. Characteristics of Specialty Occupation Workers (H-1B): Fiscal Year 2001. Washington. Jorgenson, Dale W., Mun S. Ho and Kevin J. Stiroh (2007). A Retrospective look at the U.S. productivity growth resurgence. Staff Reports 277, Federal Reserve Bank of New York Karsenty, Guy (2002) Assessing Trade in Services by Mode of Supply. in Pierre Sauvé and Robert M. Stern (eds.) GATS 2000 – New Directions in Services Trade Liberalization, p. 22-55. Washington DC: Brookings Institution.

Draft Paper
56
Kirkegaard, Jacob Funk (2005). Outsourcing and Skill Imports: Foreign High-Skilled Workers on H-1B and L-1 Visas in the United States. Peterson Institute Working Paper 05-15. Peterson Institute, Washington D.C. Kirkegaard, Jacob Funk (2007). The Accelerating Decline in America’s High-Skilled Workforce: Implications for Immigration Policy. Peterson Institute Policy Analysis 84. Peterson Institute, Washington, D.C. Koncz, Jennifer and Anne Flatness (2007). U.S. International Services Cross-Border Trade in 2006 and Sales Through Affiliates in 2005. Survey of Current Business, October 2007, p. 94-113. Bureau of Economic Analysis, Washington D.C. By Kozlow, Ralph (2006). Globalization, Offshoring, and Multinational Companies: What Are the Questions, and How Well Are We Doing in Answering Them? Paper Presented at American Economic Association, Allied Social Science Associations, 2006 Annual Meeting, Boston, MA January 6, 2006. Langhammer, Rolf (2004). Revealed Comparative Advantage in Services Trade in the USA, EU and Japan. What Do They Tell Us?. Journal of World Investment and Trade 5(6): 887-96. Lemaitre, George (2004). Migration Statistics and the Movement of Natural Persons under GATS Mode 4. Presentation given at UN Statistics Division Meeting September 2004. Available at unstats.un.org/unsd/tradeserv/TSG%2009-04-Paris/tsg0409-25.ppt. Lipsey, Robert E. (2006). Measuring International Trade in Services, NBER Working Paper 12271. NBER, Cambridge Massachusetts Lowell, Lindsay B. 2000. H-1B Temporary Workers: Estimating the Population. Washington: Institute for the Study of International Migration, Georgetown University. Mann, Catherine L. and Jacob F. Kirkegaard (2006). Accelerating the Globalization of America: The Role for Information Technology. Peterson Institute For International Economics, Washington D.C. Markusen, James R. and Robert Feenstra and William Zeile, "Accounting for Growth with New Inputs: Theory and Evidence", American Economic Review, Papers and Proceedings, 82 (1992), 416-421. Marquez, Jaime and Workman, Lisa, "Modeling the IMF's Statistical Discrepancy in the Global Current Account" (September 2000). International Finance Working Paper No. 678. Mataloni, Ray (2007). Operations of U.S. Multinational Companies in 2005. Survey of Current Business November 2007, p. 42-64. Bureau of Economic Analysis, Washington D.C.
Draft Paper
57
National Academy of Sciences (2007). Rising Above the Gathering Storm – Energizing and Employing America for a Brighter Economic Future. Washington. D.C> National Academies Press. Nordas, Hildegunn Kyvik (2008). Trade and Regulation: Computer Services and Other Business Services. Paper Presented at the OECD Services Expert Meeting on Business Services on 24 June 2008. OECD, Paris OECD (2004). International Trade in Services Statistics: Monitoring Progress in Implementation of the Manual and Assessing Data Quality. Paper presented at OECD-EUROSTAT Expert Meeting on Trade-in-Services Statistics, 28 April - 29 April 2004. STD/NAES/TASS/SERV(2004)3, OECD, Paris.
OECD (2006). OECD Information Technology Outlook 2006. OECD, Paris OECD (2008) Going For Growth 2008 Edition. OECD, Paris. OECD (2008b). Measuring Globalization: Activities of Multinationals Volume II: Services 2000-2004. OECD, Paris OECD International Trade in Services Database, available at www.sourceoecd.org.
Oliner, Stephen D., Daniel E. Sichel and Kevin J. Stiroh (2007). Explaining a Productive Decade. Finance and Economics Discussion Series 2007-63, Board of Governors of the Federal Reserve System, Washington D.C. Pinkston, Joshua P., and James R. Spletzer. 2004. Annual Measures of Gross Job Gains and Gross Job Losses. Monthly Labor Review (November): 3–13. Washington: Department of Labor. Reserve Bank of India. 2005. Computer Services Exports from India: 2002–03. RBI Monthly Bulletin (September). Mumbai, India. Reserve Bank of India. 2006. Invisibles in India’s Balance of Payments. RBI Monthly Bulletin (November). Mumbai, India. Reserve Bank of India. 2008. Invisibles in India’s Balance of Payments. RBI Monthly Bulletin (February). Mumbai, India. Shaw, J.E.H. (2001). Some Quotable Quotes For Statistics. Available at http://www.ewartshaw.co.uk/. Sicsic, Pierre (2006). Are There Missing Imports of Services? Paper presented at the 7th OECD International Trade Statistics Expert Meeting, 11-14th September 2006. OECD, Paris

Draft Paper
58
Singh, Bhupal (2005). Services Exports Under Mode 4 of GATS: Exploratory Evidence from India. Paper presented at the Meeting of the Technical Subgroup on Movement of Natural Persons, Paris, January 31- 1 February 2005. TSG 2/14 United Statistics Division Department of State. 1997. Report of the Visa Office 1997. Washington. Department of State. 1998. Report of the Visa Office 1998. Washington. Department of State. 1999. Report of the Visa Office 1999. Washington. Department of State. 2000. Report of the Visa Office 2000. Washington. Department of State. 2001. Report of the Visa Office 2001. Washington. Department of State. 2002. Report of the Visa Office 2002. Washington. Department of State. 2003. Report of the Visa Office 2003. Washington. Department of State. 2004. Report of the Visa Office 2004. Washington. Department of State. 2005. Report of the Visa Office 2005. Washington. Department of State. 2006. Report of the Visa Office 2006. Washington. Statistics Canada (2008). Annual Survey of Software Development and Computer Services. The Daily, May 23rd 2008. Statistics Canada, Ottawa. Sturgeon, Timothy J., Frank Levy, Clair Brown, J. Bradford Jensen, and David Weil Services Offshoring Working Group Final Report. MIT IPC Working Paper 06-006. Boston UNCTAD (2006). Information Economy Report (2006): The Development Perspective. UNCTAD, Geneva. United Nations, European Commission, IMF, OECD, UNCTAD and WTO (2002). Manual on Statistics of International Trade in Services. Geneva, Luxembourg, New York, Paris, Washington, D.C. USCIS (US Citizen and Immigration Services). 2003. Characteristics of Specialty Occupation Workers (H-1B): Fiscal Year 2002. Washington: Department of Homeland Security. USCIS (US Citizen and Immigration Services). 2004. Characteristics of Specialty Occupation Workers (H-1B): Fiscal Year 2003. Washington: Department of Homeland Security. USCIS (US Citizen and Immigration Services). 2006a Characteristics of Specialty Occupation Workers (H-1B): Fiscal Year 2004 Washington: Department of Homeland Security.

Draft Paper
59
USCIS (US Citizen and Immigration Services). 2006b Characteristics of Specialty Occupation Workers (H-1B): Fiscal Year 2005 Washington: Department of Homeland Security. Utkulu, Utku and Dilek Seymen (2004). Revealed Comparative Advantage and Competitiveness: Evidence for Turkey vis-à-vis the EU/15. Paper presented at the European Trade Study Group 6th Annual Conference, ETSG 2004, Nottingham, September 2004 Vollrath, T.L. (1991), “A Theoretical Evaluation of Alternative Trade Intensity Measures of Revealed Comparative Advantage”, Weltwirtschaftliches Archiv, 130, 265-79. World Bank (2008). Migration & Remittances Factbook 2008. World Bank, Washington D.C. Yuskavage, Robert E., Erich H. Strassner and Gabrial W. Medeiros (2006). Outsourcing and Imported Services in BEA’s Industry Accounts. Paper presented for the NBER Conference of Research in Income and Wealth Conference on International Services Flows, April 28-29, 2006. Bethesda, MD.


![[YIDLUG] Computer/Software Design patterns](https://img.dokumen.tips/doc/110x75/54b7aac24a7959d3328b45f0/yidlug-computersoftware-design-patterns.jpg)


