Embed Size (px)
Citation preview

NBER WORKING PAPER SERIES
TRADE, FOREIGN INVESTMENT, AND INDUSTRIAL POLICY FOR DEVELOPINGCOUNTRIES
Ann HarrisonAndrés Rodríguez-Clare
Working Paper 15261http://www.nber.org/papers/w15261
NATIONAL BUREAU OF ECONOMIC RESEARCH1050 Massachusetts Avenue
Cambridge, MA 02138August 2009
The views expressed herein are those of the author(s) and do not necessarily reflect the views of theNational Bureau of Economic Research.
NBER working papers are circulated for discussion and comment purposes. They have not been peer-reviewed or been subject to the review by the NBER Board of Directors that accompanies officialNBER publications.
© 2009 by Ann Harrison and Andrés Rodríguez-Clare. All rights reserved. Short sections of text, notto exceed two paragraphs, may be quoted without explicit permission provided that full credit, including© notice, is given to the source.

Trade, Foreign Investment, and Industrial Policy for Developing CountriesAnn Harrison and Andrés Rodríguez-ClareNBER Working Paper No. 15261August 2009JEL No. F0,O0
ABSTRACT
In this paper we explore the popular but controversial idea that developing countries benefit from abandoningpolicy neutrality vis-a-vis trade, FDI and resource allocation across industries. Are developing countriesjustified in imposing tariffs, subsidies, and tax breaks that imply distortions beyond the ones associatedwith optimal taxes or revenue constraints? We refer to this set of government interventions as "industrialpolicy". We explore the theoretical foundation for industrial policy and then review the related empiricalliterature. We follow this with a broader look at the empirical work on the relationship between tradeand FDI and growth. In this review, we find little evidence that countries benefit from "hard" interventionsthat distort prices to deal with Marshallian externalities, learning-by-exporting, and knowledge spilloversfrom FDI. We discuss an alternative set of "soft" industrial policies that deal directly with the coordinationfailures that may arise within the sectors or clusters where the country has a comparative advantage.
Ann HarrisonUniversity of California, Berkeley329 Giannini HallBerkeley, CA 94720and [email protected]
Andrés Rodríguez-ClarePennsylvania State UniversityDepartment of EconomicsUniversity Park, PA 16802and [email protected]

1 Introduction
�. . . growth was not a passive, trickle-down strategy for helpingthe poor. It was an active, pull-up strategy instead. It requireda government that would energetically take steps to accelerategrowth, through a variety of policies including building infrastruc-ture such as roads and ports and attracting foreign funds."
Jagdish Bhagwati, In Defense of Globalization (2004)
During the last three decades, developing countries have made enormousstrides in opening up their protected domestic markets to international tradeand foreign investment. Yet most countries have not simply opened up theirmarkets. They have also instituted a range of policies to encourage exports,attract foreign direct investment (FDI), promote innovation, and favor someindustries over others. This leads to the following question: is opennessto trade and FDI alone su¢ cient to achieve high growth rates in develop-ing countries? If harnessing the gains from globalization requires additionalpolicies, can we identify them? While some types of complementary policies,such as building roads and ports, are not controversial, others are. Bhag-wati�s suggestion to "attract foreign funds" implies tilting incentives in favorof foreign investors, which means abandoning policy neutrality. Our goal inthis chapter is to explore the popular but controversial idea that developingcountries bene�t from abandoning policy neutrality vis-a-vis trade, FDI andresource allocation across industries.Policy neutrality does not necessarily mean free trade, or a neutral stance
regarding taxation of multinational corporations, or even a common taxstructure for all industries. Both optimal tax theory and practical �scalconsiderations imply that countries (especially poor ones) will often want torely on tari¤s as a source of revenue or set di¤erent tax rates across indus-tries. Are developing countries justi�ed in imposing tari¤s, subsidies, and taxbreaks that imply distortions beyond the ones associated with optimal taxesor revenue constraints? We refer to this set of government interventions as"industrial policy".The presence of externalities is the main theoretical justi�cation for de-
viating from policy neutrality. Learning externalities from exports couldjustify export subsidies; knowledge spillovers from foreign companies couldjustify tax breaks for FDI; production externalities in "advanced" sectors
1

could justify infant-industry protection or other measures to expand thoseindustries. We begin this review with a series of simple models to highlightthe role of Marshallian and inter-industry externalities, industry-level rents,sector-speci�c coordination failures and information spillovers as a rationalefor industrial policy ("IP").The main message that emerges from this review is that the theoretical
justi�cation for infant-industry protection requires at a minimum either thatthe country have a latent comparative advantage in the protected industryor that the international price for this industry is higher than warranted bythe true opportunity cost of this good in the rest of the world. Moreover, forprotection to deliver large gains, the protected industry must exhibit largeMarshallian externalities. In contrast to the temporary trade barriers as-sociated with infant-industry protection, permanent protection of a sectormay raise welfare if it generates positive externalities to other sectors. In allthese models, however, other policies may be more e¢ cient than protection.Even when protection could improve welfare, a production subsidy would bemore e¢ cient since it avoids the temporary consumption losses associatedwith protection. In addition, protection may not work if the market failureis due to sector-speci�c coordination problems, since tari¤-induced growthdoes not necessarily help to solve coordination failures. Finally, just as R&Dsubsidies can address the externalities arising from innovation spillovers, poli-cies to promote entry into new industries can address information spilloversassociated with the discovery of new pro�table activities.While government intervention could address a number of market failures
in theory, one key question is whether IP has been successful in practice. Thetheoretical discussion is followed by a review of the empirical literature onindustrial policy in Section 3. One challenge that we face in evaluating theempirical literature is the large gap between the theoretical justi�cation forIP and the quantitative work that has been done to evaluate its e¤ectiveness.Even if we could show that protected sectors grow faster, for example, thisis not su¢ cient evidence to claim that IP increases welfare.Despite this shortcoming, we proceed in Section 3 to evaluate three di¤er-
ent approaches to measuring the e¤ectiveness of infant-industry protection.The �rst approach focuses on particular industries that have received protec-tion, such as the steel rail industry in the US and the semiconductor industryin Japan. The few existing studies of this nature suggest that the conditionsnecessary to generate positive net welfare gains from infant industry protec-tion are di¢ cult to satisfy in developing countries.
2

A second empirical strategy exploits the variation in productivity growthand di¤erent measures of support (including protection and production sub-sidies) across industries to see whether supported industries exhibit fastergrowth. The challenge here is that tari¤s and quotas are frequently imposedfor reasons other than the pursuit of industrial policy. If we cannot identifythe motive for protection, then it is di¢ cult to evaluate the consequences ofIP via trade policy instruments. Generating �scal revenue, improving termsof trade, and political considerations (rent-seeking) are likely to be just asimportant as infant-industry considerations in explaining the pattern of tradepolicy and other measures of support.Finally, a third approach studies the connection between trade policy and
economic growth, both by focusing on particular countries (e.g., South Koreaand Taiwan) and by considering the entire cross section of countries. Whilethe literature on trade and growth linkages faces many challenging problems,in Section 4 we suggest two general lessons that may be drawn from the vo-luminous evidence. First, there was no signi�cant relationship in the secondhalf of the twentieth century between average protection levels and growth.Second, there is a positive association between trade volumes and growth.We interpret the lack of a signi�cant association between average tari¤s andgrowth, combined with the strong relationship between trade shares andgrowth, to suggest that any successful IP strategy must ultimately increasethe share of international trade in GDP. The fact that so many countrieshave been unsuccessful in o¤setting the anti-trade bias of their interventionsmay explain why so many have failed to succeed at IP.We also review a new set of studies that emphasize the complementarity
between trade and FDI reforms and other government policies. These studiessuggest that trade liberalization will not generate faster growth unless accom-panied by changes in other parts of the economy, such as reducing barriersto new �rm entry, encouraging more �exible labor markets, and improvinginfrastructure. These new studies are consistent with one of the most im-portant new theoretical developments in international trade: the emphasison heterogeneous �rms. The new heterogeneous trade models suggest a newmechanism through which trade a¤ects productivity growth: greater com-petition forces less productive �rms to exit and increases the market shareof more productive �rms. In this framework, gains from trade cannot berealized when there are barriers to �rm exit and expansion, which suggestsa need to take into account complementary policies on entry and exit. We�nish Section 4 with an analysis of whether learning-by-exporting seems to
3

be quantitatively important, and a discussion of the empirical evidence re-garding other mechanisms through which trade policy might a¤ect growth.Aside from intervening in trade, many developing countries deviate from
policy neutrality by introducing tax breaks and other policies to attract for-eign direct investment (FDI). While economists are generally skeptical re-garding the bene�ts of intervening in trade, they are much more likely tohave interventionist priors when it comes to FDI. In Section 5, we review themicro studies which have identi�ed a number of important e¤ects of inwardforeign investment �ows. While most of the empirical literature focuses onproductivity spillovers, there is also a growing literature that examines ex-port promotion through foreign investment, input linkages, and labor markete¤ects. We argue that FDI is associated with technology transfer and pos-itive labor market outcomes in developing countries, but that the empiricalliterature on FDI does not show evidence of horizontal spillovers, and thatbene�ts from vertical spillovers may not exceed the cost of FDI subsidies.
2 The Theoretical Justi�cation for IndustrialPolicy
The textbook model of IP is based on the idea that some sectors or in-dustries exhibit Marshallian externalities, which are local externalities thatincrease with the size of the industry. These externalities can arise throughlocalized industry-level knowledge spillovers, input-output linkages togetherwith transportation costs to ensure that the externalities remain local, andlabor pooling (see Marshall, 1920, and Krugman, 1991). Marshallian exter-nalities give rise to geographic agglomeration of industries (e.g., software inSilicon Valley), which have been emphasized in the literature on economicgeography.The simplest model of IP entails a small-open economy with two sectors,
1 and 2. Sector 1 has constant returns to scale while Sector 2 has Marshallianexternalities. The key result is that under some conditions there are mul-tiple equilibria, with the equilibrium with complete specialization in Sector2 being superior to the one with complete specialization in Sector 1.1 One
1Multiple Pareto-ranked equilibria can also arise in a closed economy, although thebehavior of prices makes this less likely. This is because as one sector is expanding, therelative price moves against this sector, and this may rule out multiplicity. See Murphy,
4

could say that the economy has a "latent" comparative advantage in Sector2 but that a coordination failure prevents it from exploiting this advantage.2
Since the realization of Marshallian externalities is likely to take some time,it is customary to talk about countries having a "dynamic" comparative ad-vantage (Wade 1990, Amsden 1989) in sectors other than the ones in whichthey are currently specialized, and to think of industrial policy as the way toundertake the necessary transformation to capitalize on that dynamic advan-tage. We think of this as the main theoretical justi�cation for infant-industryprotection.The following subsection presents a simple static model that formally
captures this idea for an economy facing exogenous international prices. Wethen move on to endogenize these prices based on production costs in the restof the world, and then show how the results extend to a dynamic framework.If the South does not have a latent comparative advantage in the advanced
sectors likely to have Marshallian externalities, is there still a case to bemade for an IP that would promote a structural transformation towardsthose sectors? In Subsection 2.2 we show that there are indeed conditionsunder which this is the case. In particular, IP can increase welfare in twoscenarios: �rst, when there are rents associated with the advanced sector, sothat its international price is high relative to its cost; and second, when thereare inter-industry externalities, so that a large advanced sector increases theeconomy�s productivity across the board.Marshallian externalities arise as an automatic consequence of the scale
of the sector: a sector necessarily experiences an increase in productivity asit becomes larger. As argued by Baldwin (1969), however, the expansion of asector does not always bring about positive agglomeration externalities. Suchagglomeration e¤ects may instead depend on the way in which productionis carried out. In other words, externalities may not be intrinsic to sectors,but to the way in which they are organized (Rodríguez-Clare, 2007). In thiscase, a sectoral reallocation of resources is not enough; import substitution,for example, may allow an economy to expand its manufacturing sector, butproduction may take place in unsophisticated ways and no "clustering" ben-e�ts may materialize. In Subsection 2.3 we present a model where, insteadof Marshallian externalities, sectors present opportunities for collective ac-
Shleifer and Vishny (1989).2There are other rationales that have been discussed for industrial policy, including
�nancial market imperfections. We ignore these arguments in this chapter (see Baldwin1969 for an early criticism, and Pack and Saggi, 2006, for a recent survey).
5

tion that increases their productivity by a certain amount (which may bedi¤erent across sectors). If there are no rents (i.e., if international pricesperfectly re�ect production costs in the North), then the best policy is sim-ply to exploit the opportunities for collective action in the sectors where theeconomy is specialized. Under more general conditions, we show that sectorsthat could bene�t most from IP would be ones that have large opportunitiesfor productivity-enhancing collective action, or that have high world demandrelative to the combined size of countries that have achieved such collectiveaction.In Subsection 2.4 we turn to IP aimed at "diversi�cation." This is some-
thing that is often stated as a goal by many countries. We present a simplemodel where diversi�cation is linked to productivity and argue that if thereis a market failure reducing the level of diversi�cation below the optimal one(as in Hausmann and Rodrik, 2003), then a policy of encouraging discoveryand diversi�cation would indeed be welfare enhancing.
2.1 Multiple Equilibria and Latent Comparative Ad-vantage
We �rst present a static model with exogenous prices, and then discuss theimplications of the model when prices are determined by production costs inthe rest of the world.
2.1.1 Exogenous international prices
There is a small economy, which we call "South," two goods and one factor ofproduction, labor, in �xed supply, L.3 Good 1 is produced with constant re-turns to scale (CRS) and no aggregate externalities: a unit of labor produces�1 units of good 1. Good 2 is produced with constant returns to scale at the�rm level, but there are aggregate externalities, so that labor productivityis:
�2�1 + �Min(�L;L2)
�with � > 0 and � � 1 + ��L > 1. The term 1 + �Min(�L;L2) capturesMarshallian externalities that are increasing with industry-wide employment,
3This subsection follows Rodríguez-Clare (2007). Models of multiple equilibria in asmall open economy include Okuno-Fujiwara, 1988, Rodríguez-Clare, 1996, Rodrik, 1996,Ciccone and Matsuyama, 1996.
6

L2, but that are exhausted once the labor force in a sector reaches the level�L. The term � can be seen as the maximum bene�ts of clustering in sector2.4 We assume that the total labor supply in South is higher than �L, so thatif there is complete specialization in good 2 then productivity is ��2.Let p�i be the international price of good i and let p
� � p�2=p�1. Let us derivea condition under which there are multiple equilibria, with one equilibriumcharacterized by complete specialization in good 1 and the other by completespecialization in good 2. We �rst check that specialization in good 1 is anequilibrium. Letting w denote the wage in South, then w = p�1�1 if Southis specialized in good 1. The unit cost of producing good 2 in South giventhat all labor is devoted to production of good 1 (and hence no bene�ts ofclustering are realized) is w=�2. Hence complete specialization in good 1 isan equilibrium if and only if �1=�2 � p�. Similarly, complete specializationin good 2 implies p�2 = w=��2, and hence this is an equilibrium if and onlyif �1=�2 � �p�. Thus, there is multiple equilibria if and only if the followingcondition holds,
p� � �1=�2 � �p� (1)
Without loss of generality, in the following discussion we restrict attentionto the case in which this condition holds with strict inequalities. If there aremultiple equilibria, which equilibrium yields higher wages? In the equilibriumwith complete specialization in good 1 the wage is w = p�1�1, whereas in theother equilibrium we have w = �p�2�2. If condition (1) is satis�ed with strictinequalities then �p��2 > �1, so wages are higher in the equilibrium withcomplete specialization in good 2.5
4In the traditional model, L is in�nite, so labor productivity is simply �2(1 + �L2).The alternative assumption that these aggregate externalities are bounded is not onlymore realistic, but also leads to a simpler analysis. Moreover, this assumption allows us tofocus on the issue of latent comparative advantage, as opposed to advantages arising fromdi¤erences in size or scale. For an analysis where scale (but not infant-industry protection)takes center stage, see Ethier (1982), which formalizes the discussion relating to FrankGraham�s argument for protection (Graham, 1923). Scale e¤ects could be captured in themodel presented here by assuming that L is large; in this case small countries could notexhaust the Marshallian externalities even if they specialized completely in industry 2.
5The result of multiple Pareto-ranked equilibria can be converted into one of devel-opment traps by introducing proper dynamics in the model (see Krugman, 1991 andMatsuyama, 1991). Under some conditions, the economy may be specialized in the goodin which it doesn�t have latent comparative advantage, and there may be no equilibriumtaking it to specialization in the other good. Government intervention in this case wouldrequire more than simple coordination to select the good equilibrium.
7

We will say that South has a latent comparative advantage in good i ifthe opportunity cost of this good given the realization of all Marshallianexternalities is lower than the international price.6 For good 1 this entails��2=�1 � 1=p�, whereas for good 2 this is �1=��2 � p�. Thus, condition (1)with strict inequalities implies that South has a latent comparative advantagein good 2. The equilibrium with specialization in good 1 is possible becausein this case Marshallian externalities are not realized, and hence the latentcomparative advantage of South in good 2 is not what determines the pat-tern of specialization. Thus, the previous results (i.e., existence of multipleequilibria and the fact that generally the equilibrium with specialization ingood 2 yields higher wages than the one with specialization in good 1) can bereinterpreted as saying that a country may be specialized in a sector where itdoesn�t have a latent comparative advantage, and that in this case a policythat induces the economy to switch to the equilibrium with specializationin the good where there is a latent comparative advantage could be welfareenhancing (see discussion below).Figure 1 illustrates the previous results. The curve labeled PPF repre-
sents the Production Possibilities Frontier for South, which is convex whenL2 < �L (or Q2 < �2��L) and becomes linear when L2 � �L (or Q2 � �2��L).The curve labeled PPFNC is the hypothetical Production Possibilities Fron-tier when there are no Marshallian externalities (i.e., � = 0), given simplyby a line with slope �1=�2, as in the standard Ricardian model. Note thatthe slope of the PPF is the same as the slope of PPFNC at the corner wherethere is complete specialization in good 1. Thus, if the international relativeprice of good 2 (i.e., p�2=p
�1) is lower than �1=�2 there is an equilibrium with
complete specialization in good 1, whereas if p�2=p�1 is higher than the slope of
the PPF along its linear segment - namely, �1=��2 - then there is an equilib-rium with complete specialization in good 2. Clearly, then, if (1) is satis�ed,there are multiple equilibria, with the equilibrium with specialization in good2 delivering a higher consumption possibilities frontier for South.The standard case for infant industry protection or IP can now be stated
simply by saying that if the South is specialized in good 1, then a highenough tari¤ would lead this economy to satisfy its own consumption ofgood 2. This would allow the South to realize the bene�ts of the Marshallianexternalities associated with this sector, and thereby shift the equilibrium
6If Marshallian externalities take time to be realized, then one could talk about adynamic comparative advantage. See Redding (1999).
8

Figure 1: Marshallian Externalities and Multiple Equilibria
towards complete specialization in good 2.7 At that point the tari¤ wouldno longer be needed, and the economy could maintain free trade.Sauré (2007) presents an interesting and novel argument for why protec-
tion may fail to generate the results predicted by this model. He assumesthat goods 1 and 2 are tradable inputs into the production of a �nal non-tradable good via a "modern technology." The key assumption is that the�nal good can also be produced directly from labor with a "traditional tech-nology" which exhibits CRS (no Marshallian economies). Under some con-ditions protection makes the modern technology unpro�table because of theincrease in the price of input 2. Thus, rather than increasing productionof the good with Marshallian externalities, protection leads to the contrac-tion of the whole modern sector and a reallocation of resources towards thetraditional sector.
2.1.2 International prices determined in North
The previous discussion takes international prices as exogenous. But pricesare (at least in part) determined by productivity levels in the rest of the world.
7We assume here that the South is su¢ ciently large that under autarky it would haveL2 � �L.
9

One would imagine that rich countries are already enjoying the lower costsassociated with clustering in sector 2, so these lower costs would be re�ectedin p�. Thus, for a small country to have a latent comparative advantage insector 2, it must have some deep parameters that confer it such an advantage.To see this, imagine now that there are two countries, North and South,which may di¤er in the productivity parameters, �1 and �2, so that there areexogenous international productivity di¤erences (independent of Marshallianexternalities) in the production of both goods 1 and 2. Imagine further thatSouth is small, so that prices are determined in North as if it were a closedeconomy. Choosing labor in North as the numeraire, international pricesare simply given by the North�s unit labor requirements. Assuming that inequilibrium L2N � �L then p�1 = 1=�1N and p
�2 = 1=��2N , so p
� = �1N=��2N .Note that the bene�ts of clustering are re�ected in a lower internationalrelative price of good 2. This will be important in the analysis that follows.Imagine �rst that there are no Ricardian productivity di¤erences, �ji = 1
for all j = S;N and i = 1; 2. Using (1) it is easy to con�rm that there aremultiple equilibria in South (since p� = 1=� then condition (1) is 1=� � 1 �1), but since the second part of (1) is satis�ed with equality, then the wage isthe same in both equilibria. Thus, although there are multiple equilibria, thewage is not higher in the equilibrium with specialization in good 2. This isbecause even though the economy bene�ts from clustering in this equilibrium,this is exactly compensated by the lower price of this good, which in turnarises from the higher productivity in North derived from clustering.The equilibrium with specialization in good 2may yield higher wages than
the one with specialization in good 1 if we allow for exogenous productivitydi¤erences. In particular, the equilibrium with specialization in good 2 willhave higher wages if the South has a latent comparative advantage in thegood subject to clustering. To see this, drop the assumption that �ji = 1 forall j; i, and assume instead that
�2S=�1S > �2N=�1N (CA)
The condition for multiple equilibria (i.e., condition (1)) is now (using p� =�1N=��2N)
�1N=��2N � �1S=�2S � �1N=�2N (2)
The second inequality is satis�ed given (CA), so there is always an equilib-rium with specialization in good 2. The �rst inequality (needed for there to
10

be an equilibrium with specialization in good 1) is satis�ed if and only if
�2S=�1S�2N=�1N
� � (3)
That is, the South�s comparative advantage in sector 2 must be weaker thanthe bene�ts of clustering.The analysis here is exactly as above, with condition (2) replacing condi-
tion (1). Condition (CA) is necessary for South to have a latent comparativeadvantage in good 2, and this is necessary for the wage with specializationin good 2 to be higher and for IP to raise wages for South.An important point to note is that for the gains from IP to be large we
need South to have a strong latent comparative advantage in good 2. Butthen condition (3) implies that Marshallian externalities must also be highfor there to be multiple equilibria. We can conclude that IP generates largegains only if the sector that would be promoted exhibits both a strong latentcomparative advantage and large externalities.One can enrich the model to generate some additional implications. For
example, if sector 2 is intensive in physical and human capital relative tosector 1, then if South is specialized in 1 this goes together with low levels ofboth types of capital and a lower level of TFP than if it were specialized insector 2 (Ciccone and Matsuyama, 1996, Rodríguez-Clare, 1996). A policyto shift resources towards sector 2 would then generate endogenous accumu-lations of capital, as observed in East Asian countries. In other words, someLDCs may have low capital stocks as well as low TFP as a consequence ofnot exploiting their latent comparative advantage.8
2.1.3 Dynamic externalities
Here we extend the model to allow for dynamic Marshallian externalities,as in Bardhan (1970), Krugman (1987), Lucas (1988), Redding (1999) andMelitz (2005). To do so, we assume that productivity in sector 1 in countryi is �1i, just as above, whereas productivity in sector 2 in country i at timet is now Ait�2i
�1 + �Min(�L;L2it)
�. Letting aSt � max fASt=ANt; 1g and
aNt � max fANt=ASt; 1g, we assume that Ait grows thanks to both learningby doing (which happens if country i has a cluster in sector 2, i.e. L2it > 0)
8One problem with this idea as a way to think about income di¤erences across countriesis that it would imply that poor countries have a lower physical capital share, which is notconsistent with the data (see Gollin, 2002).
11

and international spillovers (which happens if ait < 1). Formally, we assumethat
_Ait = (g=�L)min(�L;L2it)Ait + "(1� ait)Aitwhere " > g > 0. Productivity increases caused by dynamic externalities inone country eventually di¤use to the other country even if there is no clusterthere. Thus, in this model clusters are important to generate knowledge butare not critical to bene�t from knowledge spillovers.Note that if the North has a cluster but the South does not, then _ASt =
"(1 � aSt)ASt. There are "bene�ts of backwardness," in the sense that alower relative productivity in South (i.e., lower aSt) leads to a faster rateof productivity growth. This implies that given " > g there is a steadystate productivity gap ASt=ANt = a given implicitly by g = "(1 � a): ifaSt < a (aSt > a) then aSt increases (decreases) towards a. For futurereference, note that the productivity of North relative to South in this steadystate is (�2N=�2S)�=a: the �rst term captures pure Ricardian productivitydi¤erences, whereas the second and third terms capture the impact of staticand dynamic bene�ts of clustering, respectively. Starting from such a steadystate, if South acquires a cluster in sector 2, so that now L2St � �L, thenthere will be full convergence as aSt increases from a towards 1.As before, assume that prices are wholly determined in North. Then
p�1 = 1=�1N and p�2t = 1=A2Nt��2N , and assume that condition (CA) holds.
Focusing on the South, complete specialization in 1 is a steady state equilib-rium if
�2S=�1S�2N=�1N
� �=a (4)
On the other hand, complete specialization in good 2 is necessarily a steadystate equilibrium (given condition (CA)). Thus, there are multiple steadystates if and only if condition (4) is satis�ed. It can be readily veri�ed thatthe steady state with specialization in good 2 entails a higher wage for Souththan the steady state with specialization in good 1. This is because condition(CA) implies that South has a latent or "dynamic" comparative advantagein good 2.9
Imagine that this condition is satis�ed and that the system is in steadystate with South completely specialized in good 1. Is there an equilibrium in
9Formally, we would say that a country has a latent or dynamic comparative advantagein a good if its opportunity cost given the realization of all static and dynamic Marshallianexternalities is lower than the international price.
12

which South moves to the steady state with specialization in good 2? If Southbecomes specialized in good 2 then it realizes the static externalities, but itwill take some time for it to catch up to the North in terms of productivity(i.e., aSt < 1 for some time). During this period, specialization in good 2 isan equilibrium if
�2S=�1S�2N=�1N
� 1=aSt
This implies that if
1=a � �2S=�1S�2N=�1N
� �=a
then there are multiple steady states, and also an equilibrium in which sim-ply South switches from specialization in good 1 to specialization in good2 and eventually reaches the steady state with complete specialization ingood 2. The government could achieve this switch with trade protection foran in�nitesimally short time, and the gains would necessarily outweigh anyassociated costs (see below).On the other hand, if
�2S=�1S�2N=�1N
< 1=a
then this is no longer the case. In order to guarentee specialization in good2, there would need to be temporary protection until aSt increases from a toa level a0 de�ned implicitly by
�2S=�1S�2N=�1N
= 1=a0
After that, complete specialization in good 2 would be an equilibrium forSouth. Eventually the system would reach the steady state with aSt = 1.
2.1.4 Discussion
The simple model presented here captures the notion that temporary pro-tection may induce an economy in a bad equilibrium to switch towards theequilibrium where specialization is according to its latent or dynamic com-parative advantage. Of course, this is nothing more than the classic case forinfant-industry protection, where policy is supposed to turn a latent com-
13

parative advantage into an e¤ective one.10 Such a policy would be welfareenhancing provided it passes both the Mill and Bastable tests: the Mill testis that the protected sector can eventually survive international competitionwithout protection, whereas the Bastable test is more stringent in requir-ing also that the discounted future bene�ts compensate the present costs ofprotection (see Kemp, 1960, and Corden, 1997). In the model above, infant-industry protection passes the Mill test if and only if the South has a latentcomparative advantage in the protected sector. The Bastable test requiresthat the discounted gains from IP compensate the temporary consumptionloses associated with protection during the period in which the economy isgenerating the (dynamic) productivity gains associated with clustering. Thisis the period when aSt is increasing from a to a0. Bardhan (1971), Redding(1999) and Melitz (2005) - among others - explore the conditions on thelearning process under which the bene�ts of protection justify these initiallosses. Bardhan (1970) and Melitz (2005) explore the optimal way in whichprotection should be granted.Of course, protection does not directly target Marshallian externalities. A
production subsidy would be more e¢ cient, as it would avoid the temporaryconsumption losses mentioned above. The whole discussion of infant-industryprotection is based on the presumption that a production subsidy is simplynot feasible, either for �scal, political or practical considerations (see Section3). If this were not the case, then the analysis would be quite simple: providea (Pigovian) subsidy such that the marginal subsidy is equal to the marginalexternality. Naturally, if the source of the externality is not production butsome more speci�c activity (e.g., R&D) then the subsidy could be directedthere.The condition that the South have a non-exploited latent comparative
advantage to justify protection is speci�c to the simple Ricardian modelwe presented, where the production possibilities frontier (PPF) is linear andthere is a tendency for complete specialization. If the PPF is strictly concaveand international prices are such that under free trade the economy is diver-si�ed, then the presence of Marshallian externalities in the import competing
10John Stuart Mill (1848, reference 1909) is generally credited for being the �rst toexpress this idea in a clear and simple way, although it was Friedrich List (1885) who vig-orously argued for the adoption of infant-industry protection of manufacturing in Europeancountries. See Corden (1997) for a discussion of the di¤erent arguments for and againstinfant-industry protection, and Irwin (1996) for an excellent treatment of its intellectualhistory.
14

sector implies that a small tari¤would necessarily be welfare increasing. Butthis kind of "marginal intervention" is not what people commonly associatewith infant-industry protection.Another possibility that arises with a strictly concave PPF is multiple
equilibria where the bad equilibrium has a low (but positive) productionlevel, whereas the good equilibrium has a higher production level but notenough for any of this production to be exported. Even if the economydoes not have a latent comparative advantage, temporary protection maybe welfare enhancing in this case as long as the Mill and Bastable tests aresatis�ed.Although it is a speci�c result to the simple Ricardian model presented
here, the result that a latent comparative advantage is necessary for infant-industry protection to be welfare-enhancing is of general interest. First, inall cases in which infant-industry protection has supposedly been successful,the infant sector eventually generates signi�cant exports. It is simply hardto imagine otherwise. Second, if there are resource constraints that preventthe sector from becoming large, then the theoretical framework suggests thatthe bene�ts of IP would be small while the associated costs and risk wouldbe relatively large. For this reason, in the rest of this section we restrictattention to the Ricardian model (linear PPF).
2.2 Industrial Policy without Latent Comparative Ad-vantage
Can a policy to promote specialization in a good with Marshallian exter-nalities (i.e., good 2 in the model above) be welfare-enhancing in spite ofnot having latent comparative advantage in that sector? For this analysisand the rest of this section we again restrict attention to the simpler staticanalysis.
2.2.1 Sector-level rents
Imagine that prices are determined not in a single economy, but in a collec-tion of economies. In particular, assume that North is partitioned into tworegions, N1 and N2, with labor quantities L1N and L
2N . Everything else is as
above. Without loss of generality, assume that region N2 is the one that willproduce good 2. If L2N is su¢ ciently large relative to the world�s demandfor good 2 then it will not be completely specialized in that good, in which
15

case prices will be determined by technology levels (inclusive of clusteringe¤ects), so that p� = �1N=��2N , just as in the previous case. But if L2N issmall relative to the world demand for good 2, then in equilibrium one canhave
�1N=�2N > p� > �1N=��2N (5)
In contrast to what we have with an integrated North, here p� can be strictlyhigher than �1N=��2N . The di¤erence can be interpreted as the "rents"associated with good 2. To capture this, let
R � p�
�1N=��2N
Condition (5) can now be stated as
� > R > 1 (6)
Consider again a "small" South, which takes international prices as given.The condition for multiple equilibria is again given by (1), with p� satisfying(5). This can be written as
R=� � �1S=�2S�1N=�2N
� R (7)
We are interested in the case where South does not have a latent comparativeadvantage in good 2, or
�1S=�2S > �1N=�2N (8)
In this case, the LHS inequality in (7) is always satis�ed (given (6)), whilethe RHS inequality, which is necessary for specialization in good 2 to be anequilibrium, is satis�ed if R > CA, where CA � �1S=�2S
�1N=�2Nis a measure of
comparative advantage in South in good 1. In other words, there are mul-tiple equilibria in South if its comparative advantage in good 1 is smallerthan the rents associated with international prices. Moreover, just as in theprevious cases, the equilibrium with specialization in the good with Marshal-lian externalities sustains a higher wage.11 This result is reminiscent of the11Another way to think about rents is if South were no longer a small economy. Consider
Figure 1 again and imagine that there are no productivity di¤erentials between South andNorth. Imagine further that these two regions have equal size, and that demand for good2 is su¢ ciently high that the equilibrium entails one country fully specialized in good 2and the other fully specialized in good 1. Then, if condition (1) is satis�ed, the countrythat specializes in good 2 has higher welfare than the country that specializes in good 1.
16

literature on strategic trade policy, where increasing returns and imperfectcompetition leads to the existence of rents which governments try to capturevia trade policy.An alternative way to get a similar result is by assuming the existence
of a wage premium in sector 1.12 To see this, assume again that North isa single integrated region, but with a wage premium in sector 2, so thatw2 = Rw1. Then it is easy to verify that p� = R�1N=��2N , which is the sameas above.13,14
2.2.2 Inter-industry externalities
We have so far focused on intra-industry externalities. Consider insteadaggregate externalities, so that all sectors in the country bene�t from the ex-ternalities realized in a sector (see Succar, 1987, Young, 1991, and Greenwaldand Stiglitz, 2006).15 Assume that now productivity in good i in country jis
�ij�1 + �iMin(�L;L2j)
�with �1 < �2, so that intra-industry externalities are stronger than inter-industry externalities. Let �i � 1+�i �L and note that �1 < �2. We return tothe case of FPE in North with no rents, so that p�i = 1=�i�iN , and assumethat South has a latent comparative advantage in good 1. It is readily veri�ed
12Yet another way to have rents would be through the existence of pure pro�ts, as in theliterature on "strategic trade policy" (Brander and Spencer, 1983, Eaton and Grossman,1989).13We have assumed here that there is no wage premium in South. If there were a
wage premium in South of equal magnitude as in North, then in the absence of a latentcomparative advantage in good 2, there would not be multiple equilibria, but it could bewelfare-enhancing for South to implement a policy to specialize in sector 2. This wouldno longer be a case of Marshallian externalities and infant-industry protection, but rathera standard application of the theory of domestic distortions and trade policy.14One di¤erence with the case analyzed above, where rents arise from lack of FPE, is
that with wage premia we no longer have the restriction that R < �. The reason is thatnow the opportunity cost of good 2 given that region is specialized in good 1 is R�1N=�2N ,and we need this to be higher than p�, which is possible even if �1N=�2N < p�. Note thatin this case then there is no equilibrium with specialization in good 1 in South.15Perhaps the most important type of inter-industry externalities are generated by in-
dustries that supply specialized inputs that are used intensively by �rms in many othersectors. According to Wade (1990), this kind of reasoning was quite important in Taiwan,where the government promoted several sectors that were deemed to provide critical inputsfor many other industries. Noland and Pack (2003) disagree with this view.
17

in this case that the only equilibrium in South entails specialization in good1.16 But specialization in good 2 implies w = �2�2Sp
�2 = �2S=�2N , while
specialization in good 1 implies w = �1Sp�1 = �1S=�1�1N . The �rst is higherthan the second if and only if
1=�1 <�2S=�1S�2N=�1N
If this is satis�ed, then forcing the economy towards specialization in good 2,even if this is not an equilibrium, is welfare-enhancing compared to stayingin the equilibrium with specialization in good 1. In this case, the losses fromgoing against comparative advantage by specializing in sector 2 are domi-nated by the gains associated with the economywide externalities generated.This may be one way of interpreting the argument in the late 1980s in favorof protecting the semiconductor industry in the United States (see Borrus,Tyson and Zysman, 1986).
2.3 Industrial Policy as Sector-Speci�c Collective Ac-tion
We have so far focused on Marshallian and inter-industry externalities asreasons for IP. A more general conceptual framework for thinking about IPis the existence of coordination failures at the industry or sector level. Ofcourse, coordination failures arise in the presence of Marshallian externali-ties. The di¤erence is that the distortions associated with these externalities(at least as modeled above) disappear when the sector gets su¢ ciently large,whereas this is not the case with other types of coordination failures. Forexample, in Rodríguez-Clare (2007) positive spillovers arise only when "mod-ern" technologies are used in a sector. Thus, even sectors that are seen as"advanced" in developed countries can behave as backward sectors when theyoperate in LDCs, and hence fail to generate any externalities. This capturesthe idea that what matters for productivity is not "what you produce, buthow" (Porter, 1998, De Ferranti et. al., 2001). In these circumstances, a
16The condition for specialization in good 1 to be an equilibrium is �2S=�1S�2N=�1N
< �2�1,
which is clearly satis�ed given �2S=�1S�2N=�1N
< 1 together with 1 < �2�1. On the other hand,
specialization in good 2 implies that w=�2�2S = p�2. This is an equilibrium if w=�1�1S > p�1,
or �2S�1S
> �2N�1N
, which cannot be satis�ed if South has CA in good 1.
18

sector can expand and still fail to experience an increase in productivity.17
Protection or export subsidies would fail to be welfare-enhancing, and otherpolicies would be called for.18
The existence of coordination failures implies that collective action at thesector level may lead to productivity gains. A concrete example of collec-tive action is the eradication of foot and mouth disease in Uruguay�s cattleindustry, which generated signi�cant bene�ts by allowing the industry to ex-port beef to the United States (see Hausmann, Rodríguez-Clare and Rodrik,2005). Simply providing a production or export subsidy to the cattle indus-try would not have led to more exports. A speci�c policy to deal with thecoordination failure associated with strong externalities was introduced. An-other example is the case of �ower exports from Ecuador (Hernández et. al.2007). Several attempts to export �owers in the 1960s and 70s failed in partbecause of the lack of reliable air transport to the main destinations. A keydi¤erence in the 1980s was an e¤ort by the association of �ower exporters,EXPOFLORES, to convince the government and the national airline to setup the required number of cargo �ights for this activity. Thanks in part tothis e¤ort, the value of �ower exports boomed from less than half a milliondollars in 1984 to more than $400 million in 2006.19
2.3.1 A simple model
We now want to explore a model where policy can induce higher productivityin a sector through some kind of industry-level collective action, and whereprices are determined in a collection of economies (not only in "the North"),so that there may be rents. The goal is not to model the speci�cs of collective
17This may explain the existence of cases of geographic concentration of sectors thatfailed to experience signi�cant agglomeration economies(e.g., concentrations of footwearand textile producers). Perhaps these are cases of clusters that failed to achieve Marshal-lian externalities (see Altenburg and Meyer-Stamer, 1999).18An appropriate policy could be to subsidize production but only to the extent that it
is done using modern technologies.19Another example, also from Ecuador, concerns the development of new exports of
broccoli and mangoes, where �nding the best seeds and meeting international phytosani-tary standards presented producers with signi�cant coordination problems. As stated byHernández et. al. (2007), collective action fostered and implemented by several private,public and mixed agencies was important in dealing with such problems and in facilitatingthe development of these new sectors. Similar cases are documented for Chile in Agosínand Bravo-Ortega (2007) and for several countries in Chandra and Kolavalli (2006).
19

action, but rather to examine the conditions under which this may increasea country�s income level.There are N countries, indexed by j. Labor is the only factor of pro-
duction, and is available in total quantity Lj in country j. There are Mindustries indexed by m. There are opportunities for collective action ineach industry. Collective action increases productivity in industry m by thefactor xm; otherwise, productivity is one in all industries in all countries. Werefer to xm as the level of complexity in industry m, since it seems reason-able to expect that more complex industries will bene�t more from collectiveaction. A country that has achieved high productivity in industry m thanksto collective action will be said to have HP (for high productivity) in thatindustry. Let kjm be the indicator function for whether country j has HP inindustry m , and assume
PLj = 1 so that Lj is also the share of worldwide
labor living in country j. Then sm �P
j kjmLj is the share of labor in coun-tries with HP in industry m. Also, country j0s productivity in industry mcan be written as xjm � (1� kjm) + kjmxm. Preferences are Cobb-Douglas,with a share vm devoted to industry m, and
Pvm = 1. Thus, we can think
of vm equivalently as the "size" of industry m, or the extent of the world�sdemand for its output.The model described thus far is a Ricardian model with N countries and
M industries, where productivity can be either low or high in each industry.The equilibrium is easy to describe: it consists of a set of wages, wj, prices,pm, and an allocation, Ljm, for j = 1; :::; N and m = 1; :::;M such that forall j and m the following conditions hold: wj � xjmpm and if Ljm > 0 thenwj = xjmpm (zero pro�ts), and pm
Pj xjmLjm = vm
Pj wjLj (i.e., the value
of sales of m equals total expenditures on m) for all m.It is useful to describe an equilibrium without rents. Choosing labor as
the numeraire, this entails wj = 1 for all j and pm = 1 if sm = 0 andpm = 1=xm if sm > 0; it requires that for each industry either no countryhas HP or there are enough countries (adjusting for their size) with HP thatthe large supply drives the price to its marginal cost with unitary wages.20
Note that in this case a country that does not achieve HP in any industrywould still enjoy the same wage as other countries. We can think of this asa case in which Factor Price Equalization (FPE) holds.
20Formally, if sm > vm for all m then there is an equilibrium with wj = w for all j. Tosee this, simply assume that wj = 1 all j, and pm = 1=xm, and Ljm > 0 only if kjm = 1.We only need to check that (1=xm)
Pj xmLjm = vm with
Pj Ljm = vm holds for all m.
One can choose Ljm in such a way that this holds as long as sm � vm all m.
20

Rents arise when sm is small relative to vm. For example, imagine anequilibrium where sm = 0 for all m 6= 1, and only country 1 has HP inindustry 1. Then wj = 1 for j = 2; :::; N while w1 > 1 if and only if v1 > s1:there are rents in industry 1 (i.e., the price of industry 1 is higher than themarginal cost at unitary wages, p1 > 1=x1).21
Industries di¤er with respect to three variables: complexity (measured byxm), size (measured by vm), and the share of people in the world that livein countries that have HP (measured by sm). We will refer to the later as"prevalence," since it measures the extent to which HP is widespread acrossthe world in an industry. The previous result suggests that industries willhave rents if they are large relative to their prevalence. Apart from thisresult, one can learn more from this model only by considering special cases.Instead of doing this, we introduce some additional assumptions to "smoothout" the kinks in the Ricardian model and obtain more general results.Assume that each industry is composed of a continuum of goods with
varying productivity levels. Preferences remain Cobb-Douglas, but now withequal shares across all goods. Thus, assuming that industrym has a measurevm of goods, then (as above) expenditures on industrym are vm with
Pvm =
1. (Note that it is natural to think of vm as the "size" of industry m becauseit measures both the share of total expenditures devoted to this industryand the measure of goods belonging to that industry.) More importantly,we assume that productivity di¤ers across goods within an industry as inEaton and Kortum (2002). Speci�cally, productivity for any particular goodin sector m in country j is xjmz, where xjm is as above and z is an additionalproductivity that is independently drawn from the Fréchet distribution withparameters Tj and �, i.e. Prj(z � Z) = exp[�Tjz��].22 This distributionhas sound microeconomic foundations (see Eaton and Kortum, 2001), butunderstanding those foundations or its several convenient properties is notimportant for our purposes here; it is su¢ cient to know that a higher Tj21The equilibrium could have goods in industry 1 produced by both country 1 and
other countries, in which case it is obvious that w1 > 1. Otherwise, if country 1 isthe only country with positive production in industry 1, then the equilibrium conditionp1L1x1 = v1 (1� L1 + w1L1) together with p1x1 = w1 and s1 = L1 imply that w1 =v1(1� s1)=s1(1� v1), hence v1 > s1 implies w1 > 1. If s1 = L1 > v1 then w1 > 1 cannotbe sustained, because country 1 cannot specialize completely in the good in which it hasa superior productivity.22To simplify the discussion, we assume that Tj = Lj for all j. Otherwise, countries
with a higher ratio Tj=Lj would tend to have higher wages for reasons that don�t relateto IP (although see next subsection).
21

implies better productivity draws for country j (on average).Since each good is in�nitesimally small and there are no transportation
costs, then each good will be supplied to the whole world by the countrywith the lowest cost. If we consider a particular good in industry m withproductivity draws (z1m; z2m; :::; zNm) in countries (1; 2; :::; N) then this goodwill be supplied by country j = argminl fwl=xlmzlmg. Eaton and Kortum(2002) show that a country with wage wj and productivity parameter xjmwill capture a share
Djm =(wj=xjm)
�� TjPl (wl=xlm)
�� Tl(9)
of total sales in industry m. A country with a lower Tj, a higher wj, or alower xjm will capture a smaller market share in industrym. Contrary to thestandard Ricardian model, however, a country will have positive productionin all industries because it will always have a few goods within any industrywhere its productivity draws are very high. Letting Y =
PwjLj denote
worldwide income, then the trade balance conditions areP
mDjmvmY =wjLj (value of sales equal value of purchases for country j). These conditionsdetermine the equilibrium wages w1; :::; wN .How is the wage in a country a¤ected by acquiring HP in an industry?
If a country had a choice, in which industry would achieving collective ac-tion have the greatest impact on wages?23 These are key questions for IP.Note that we have assumed that there are no deep sources of comparativeadvantage, so this would not be an issue in this choice. Then it seems reason-able that countries would be able to increase wages more by focusing theire¤orts in industries that have higher complexity, are larger (or have higherdemand), and have a lower prevalence: higher complexity means that thereis more to gain from collective action, while larger demand combined withlow prevalence implies higher rents. Under some conditions, one can in factprove this result. In particular, assume that countries 1 and 2 are identicalexcept that they have HP in industries 1 and 2, respectively, with no HP inthe rest of industries (i.e., country 1 has HP only in industry 1 and country2 has HP only in industry 2). Then one can show that if xj1 = xj2 for allj = 3; :::; N then the wage in country 1 is higher than in country 2 if x1 > x223If the costs of collective action di¤er across industries, then this clearly would have to
be taken into account in this choice. To simplify the analysis, we assume that the cost ofachieving collective action is included in the xm.
22

or if v1 > v2. Also, assuming that x1 = x2 and v1 = v2, then w1 > w2 ifs1 < s2 (see Appendix).24
We have assumed thus far that there are no di¤erences in industry-levelproductivity across countries. If this were not the case, then it is clear thata country may want to go against its latent comparative advantage andspecialize in goods with combinations of high complexity, high demand andlow prevalence. Thus, this model may be suitable to think about IP, althoughit is important to note that trade protection is not an e¤ective policy in thisframework.
2.3.2 Relation of the model to some recent contributions
We now show how to place some recent arguments for IP in the contextof this simple analytical framework. Hausmann, Hwang and Rodrik (2006)argue that the varied economic performance of di¤erent countries is partlyexplained by the goods that they produce. Other things equal (includingphysical and human capital stocks), countries that specialize in what theycall "rich country goods" are richer. Their explanation is that such goodsprovide more opportunities for learning by doing (similar to Young, 1991)and for technological and institutional upgrading that ultimately bene�ts thewhole economy.The model presented here can capture this notion in a slightly di¤erent
way. In this model we may talk about "rich country industries" as onesthat are more complex, have higher worldwide demand, or exhibit lowerprevalence. Countries that achieve HP in these industries would be able tosustain higher income levels, and getting there would entail higher growthrates.Hausmann and Klinger (2006) argue that goods are connected, so that
productivity in one good would be higher if the country has already achievedHP in a related good. This has similar implications as inter-industry exter-nalities (think of "industries" as "goods"). For example, coming back to therole of specialized inputs, if such inputs exist for one good, this would also
24One could imagine a situation in which countries understand this model and implementIP to maximize their income. If collective action had no cost, then obviously all countrieswould simply achieve HP in all industries. But imagine that collective action is costly. Inthe resulting equilibrium sectors with higher complexity and/or larger demand would bematched by high prevalence in such a way that the return to collective action would bethe same in all sectors.
23

help in the production of a similar or related good. Hausmann and Klingershow that some goods are connected to many other goods, while other goodsare relatively isolated. They think of the space of goods as a forest, witheach good being represented by a tree, and talk about how this forest ismore dense in some areas. Hausmann and Klinger (2006) and Hausmannand Rodrik (2006) suggest that if a country could choose, it would want tolocate in the denser parts of the forest.The idea that there are regions in the forest that are more dense is cap-
tured in the model above by having industries di¤er in their size or worldwidedemand. The suggestion that countries in dense part of the forests are bettero¤ corresponds to the result above that countries are better o¤ if they man-age to achieve HP in an industry with a high measure of goods, vm, sincethis corresponds to high demand. But the model reveals a weakness of thisnotion: industries with high demand would not be attractive if they alsohave high prevalence. Returning to the forest metaphor, being in a densepart of the forest would not be better if this is also more crowded. For ex-ample, although the electronics industry may be a "highly connected area"of the forest, there may also be many countries (and large ones, e.g. China)participating in this area. In principle, it could be better for a country toremain in an isolated but relatively uncongested part of the forest.The measure of the "income level" of an industry developed by Haus-
mann, Hwang and Rodrik (2006) takes this into account: an industry withhigh prevalence would exhibit low prices and would thus be classi�ed as onewith a lower income level. Thus, in principle, this measure may be seenas a reasonable way to guide countries in choosing industries that are idealfor productivity-enhancing collective action. Unfortunately, however, thismay be a noisy measure of the relevant notion needed for IP because it maybe capturing capital (physical, human, or knowledge capital) intensity, whichleads countries with good conditions for capital accumulation to produce andexport these goods. In other words, if there is an exogenous variation in con-ditions for capital accumulation across countries, and if goods di¤er in theircapital intensity, then rich countries will tend to produce and export capi-tal intensive goods, and this will have nothing to do with industry-speci�ccollective action and IP. The same association between rich countries andcertain sectors may arise because of an exogenous variation in the qualityof institutions. For example, if rich countries have institutions that are con-ducive to capital market development, then they would tend to specialize ingoods that rely heavily on outside capital (Manova, 2006). If one could some-
24

how adjust Hausmann, Hwang and Rodrik�s measure to isolate the incomecorrelation of goods that is not explained by capital intensity or exogenousvariation in institutions, then this could be a useful measure for IP. In par-ticular, countries could consider inducing collective action in sectors with ahigh "adjusted income level."
2.4 Self-discovery and diversi�cation
The notion of IP that we have emphasized so far is that there are "specialindustries," and that countries can increase welfare by reallocating resourcesto those industries. An alternative idea that we now explore is to think of apolicy to increase diversi�cation. This has been a particular concern in coun-tries that specialize in natural-resource intensive industries (see De Ferranti,2001, and CAF, 2007, for recent treatments focusing on Latin America). Di-versi�cation could be desirable as a way to reduce volatility, or as a way toincrease productivity. Here we focus on the later.To think about the connection between diversi�cation and productivity,
consider the Eaton and Kortum (2002) model of trade. As explained above,Eaton and Kortum model productivities as being drawn from a distributionthat is common across countries except for a technology parameter T . Thistechnology parameter determines the location of the productivity distribu-tion: countries with a higher T have "better" distributions in the sense that,on average, productivity draws will be higher (formally, this entails �rst-order stochastic dominance). Apart from T , countries also di¤er in size, L.Assuming away trading costs for simplicity, wages are determined by the ra-tio of technology to size, T=L. A high T=L means that the country wouldhave many sectors in which it has absolute advantage relative to its size,leading to a high equilibrium wage. Moreover, given L, a higher T impliesthe production (and export) of more goods, or more diversi�cation.Of course, higher productivity and higher wages may not go together with
diversi�cation. For example, high productivity in a sector that is not "di-versi�ed" or "di¤erentiated" would draw resources away from the diversi�edsector and reduce overall diversi�cation even as it increases overall produc-tivity and wages. It is also important to recall that the data reveals thatafter a certain level of development, higher income goes together with less,not more diversi�cation (see Imbs and Wacziarg, 2003).An interesting way to think about diversi�cation is via what Hausmann
and Rodrik (2003) call "self-discovery." They argue that countries don�t re-
25

ally know their cost structure, and hence they don�t know the goods in whichthey have comparative advantage. This must be discovered through costlyexperimentation, which is plagued by information spillovers that render itsprivate bene�ts low relative to its social bene�ts. The following model showsa simple way to capture the connection between diversi�cation and produc-tivity, and then between self-discovery and diversi�cation.Consider an economy with labor as the only factor of production and two
sectors: agriculture and manufactures. Agriculture is a homogenous good,produced with decreasing marginal returns to labor, with QA = �F (LA).There are a continuum of manufacturing goods indexed with j 2 [0; 1] thatare produced from an input H = "L (" converts raw labor units L intoe¢ ciency units H) with productivities as in Eaton and Kortum (2002): oneunit of H produces z units of manufactures, with z for each good j 2 [0; 1]drawn from the Fréchet distribution with parameters T and �, as above.Assuming no transportation costs for either agriculture or manufacturing,and letting agriculture serve as numeraire, then the wage is w = �F 0(LA).The cost of producing a manufacturing good with productivity draw z isw="z, and, analogous to the expression in (9), the share of manufacturesthat will be exported by a country with wage w, labor e¢ ciency ", andtechnology parameter T , is
(w=")��TP(wl="l)��Tl
Consider now two countries that di¤er only in �, " or T . The country withhigher � will exhibit a higher wage, but will also devote more resources toagriculture and less to manufacturing, with a smaller share of manufacturinggoods exported and a lower level of diversi�cation (i.e., the number of goodsexported is lower). This is a case of "good concentration." On the other hand,a country with a lower " or a lower T would also have a higher share of laborin agriculture, with higher concentration, but in this case the equilibriumwage would be lower. This is a case of "bad concentration."Now let us think about the determinants of T . In a dynamic setting, T
can be seen as the stock of ideas (see Eaton and Kortum, 2001). Imaginethat there is a worldwide stock of ideas, T �, that grows at rate n. Discov-ery can be seen as the process by which a country adopts these worldwideideas to the national environment. This is not exactly as in Hausmann andRodrik (2003), where productivity is determined ex-ante, and experimenta-tion simply reveals what that productivity is. But the basic implications are
26

the same. If x is the rate of discovery, then _T = xT �, and in steady stateT=T � = x=n. Thus, a higher rate of discovery leads to diversi�cation and ahigher equilibrium wage.25
The rate of discovery depends on its cost and associated private returns.If there are knowledge spillovers, as in Hausmann and Rodrik (2003), so thatonce an entrepreneur adopts a foreign idea then it di¤uses rapidly to othersin the economy, then the market by itself would lead to a suboptimal levelof discovery and a level of diversi�cation that would be too low. Polices toencourage discovery would lead to more diversi�cation and higher welfare.
2.5 National and Global Gains from IP
The gains from IP for a country could come at the expense of other countries,or they could lead to global e¢ ciency gains. We now explore the nature ofthe gains from IP for the di¤erent models discussed above.Consider �rst the case in which the existence of Marshallian externalities
leads to multiple equilibria. Above we considered a small country, but toexplore whether gains are national or international we have to allow for thepossibility that a country�s IP hurts other countries. Consider a model withtwo countries (A and B) and two goods (1 and 2). As above, good 2 exhibitsMarshallian externalities. In this context, IP entails a shift from an equilib-rium in which countries are not specialized according to their comparativeadvantage to one in which they are. Clearly such a shift increases worldwidee¢ ciency. What happens to welfare in each of the two countries? First notethat the country that implements IP (country A) experiences an increase inproductivity in industry 2. If the terms of trade didn�t change, country Awould be better o¤ (as in Subsection 2.1.2). But if A is not small, then therelative price of good 2 will fall, and this will erode some of A�s productivitygains. Even if A was so large that the terms of trade were now equal to itsdomestic prices, however, it would still gain, so country A necessarily gainsfrom IP.26 This is a simple application of Helpman and Krugman�s (1984)
25This is not consistent with what happens for rich countries, where higher productivitygoes together with falling diversi�cation. One way to think about this is that at some pointa third sector emerges, a high-tech sector, which is a simple CRS sector where researchimplies increasing productivity. When T and productivity in high-tech is su¢ ciently high,the agriculture sector disappears, and increasing productivity in high tech leads now tofalling exports of manufactures and increasing concentration.26A key ingredient in generating this result is that country A0s opportunity cost of good
27

proposition that a country necessarily gains from a move to an equilibriumin which it allocates more resources to a sector with positive externalities.For the other country (country B) welfare can decrease. To see this, notethat for this country the e¤ect of IP is exactly the same as the e¤ect of anincrease in productivity in industry 2 in country A. This could be eitherpositive or negative for country B. For example, if the opportunity cost ofgood 2 in country A is just barely lower than the opportunity cost of good 2in country B when both countries fully exploit the Marshallian externalities,then it is clear that country B loses from the IP implemented in country A.Di¤erent results arise when IP is geared towards the appropriation of
rents or broad (inter-industry) externalities associated with certain goods, asin the literature on strategic trade policy (see Brander, 1995). In this case,the use of IP by di¤erent countries entails essentially a zero-sum game, orworse, as it could lead to an allocation of resources in which countries arenot specialized according to comparative advantage.Consider next the model where IP entails industry-speci�c collective ac-
tion. If collective action is costless, then the answer is very simple: IPnecessarily increases global welfare, although it may hurt another country byworsening its terms of trade. Things become more interesting when collectiveaction entails costs. If countries bargain e¢ ciently among themselves regard-ing trade barriers, then (by de�nition) only IP that increases global welfarewill be implemented. One could optimistically argue that global negotiationsthat include trade and other policies actually take into account the abilityof countries to implement IP, and that the resulting agreements allow onlypolicies that increase global welfare. In this case, countries that can followIP that increases their own welfare but lowers global welfare would be paid(perhaps though better trade access to other countries) not to do it, andcountries that can implement IP that lowers national welfare but increasesglobal welfare would be paid to do it. In fact, this is the way that tradeagreements work in Bagwell and Staiger�s (1998) model of GATT.Bagwell and Staiger show that as long as countries choose their policies
while disregarding their e¤ects on international prices, then they will leadto a globally e¢ cient outcome. If international agreements are not e¢ cientin this sense, however, then countries would evaluate the impact of IP onwelfare while taking into account its e¤ect on international prices. Clearly,this could lead to a decline in global welfare. For example, imagine that
2 falls below that of country B, a result of A0s latent comparative advantage in good 2.
28

countries have committed to free trade. If IP for some good X implies areduction in the supply of some other good Y then the price of this goodwould increase. If IP just barely makes the Home country implementing itbetter o¤, then for the world as a whole (which necessarily sees a declinein TOT) this entails a loss. Note, however, that this is a general feature ofdomestic policies implemented by countries that a¤ect international prices,and not something particular to IP.Finally, we turn to the model where IP aims at promoting diversi�cation.
As in the cases discussed above, the problem for global welfare may arise fromthe in�uence of IP on international prices. Imagine that the cost of a policyto encourage "self-discovery" just barely justi�es the associated bene�ts. Ifsuch bene�ts include an improvement in a country�s terms of trade (whichwould arise from the decline in the supply of the non-diversi�ed good), thenthe global e¢ ciency would decline. Again, global e¢ ciency would necessarilyincrease from IP only if countries evaluate it while disregarding its impacton international prices.
3 Empirical Evidence on Infant-Industry Pro-tection and other forms of IP
Since the best known form of IP is infant-industry protection, we devote mostof this section to a critical review of the empirical literature on this type ofIP. As discussed in Section 2, the theoretical justi�cation for infant-industryprotection relies on the existence of Marshallian externalities. There isextensive evidence that these externalities exist and are signi�cant (Rosenthaland Strange (2004)). When such externalities exist, temporary protectionmay help the country switch towards a better equilibrium, and this may bewelfare improving if the short-run costs are not too high. Protection mayalso be welfare enhancing if the protected industry generates positive (inter-industry) externalities to the rest of the economy.27
As we outlined in Section 2, such a policy would be welfare enhancingonly if it passes both the Mill and Bastable tests. Recall that the Milltest requires that the protected sector can eventually survive internationalcompetition without protection, whereas the Bastable test requires that the
27It is important to note that this is not infant-industry protection, however, since theprotected industry is not presumed to become competitive at some future period.
29

discounted future bene�ts compensate the present costs of protection. Weemphasize in our review that very few studies of IP have examined whetherindustries pass either the Mill or the Bastable test. Consequently, even if wecould show that protected sectors grow faster, this is not su¢ cient evidenceto claim that IP is welfare-improving.Even if the conditions necessary for protection to increase welfare are sat-
is�ed, protection is not the most e¢ cient policy. The theory of targeting (seeBhagwati and Ramaswami (1963)) suggests that a government�s objectivescan be met more e¢ ciently using instruments other than tari¤s, and thatwhen these instruments target the distortion at the source, a tari¤ of zeromaximizes welfare for a small economy. Unless there are speci�c distortionsor externalities associated with trade, the most e¢ cient policy instrument toconduct industrial policy is not likely to be tari¤s. In a recent review on the�scal implications of trade reform, Pelzman and Shoham (2006) point outthat "in the theoretical public �nance literature it is well established thatan optimal policy for a small open economy is to reduce tari¤s to zero andraise consumption taxes (see Dixit (1985) and Diamond-Mirrlees (1971)),thus maintaining production e¢ ciency" (p. 9).In practice, however, there are several reasons why countries have con-
tinued to use tari¤s to promote domestic industry. The most direct policyinstruments are frequently not available in countries with limited abilities tocollect income, consumption, or production taxes. Anderson (1996) showsthat in a budget constrained economy, where it is di¢ cult to compensate tar-i¤ cuts with increases in consumption or other taxes, tari¤ reductions leadto a curtailment of government spending and a resulting under-provision ofpublic goods, which lowers welfare. Irwin (2007) compares the deadweightlosses per dollar of revenue raised by tari¤s with other forms of taxation inthe United States. He argues that although the deadweight losses (per dollar)for tari¤s were high in the 19th century, "import duties were probably mucheasier to collect and enforce... than other modes of taxation" (p. 19). Irwin(2002) draws similar conclusions for Argentina and Canada at that time. Forthe same reasons, it could be argued that in some developing countries tradeprotection could be an e¤ective tool to implement IP. An important impli-cation is that if �scal considerations are the reason to use trade protectionrather than production subsidies, then clearly tari¤s would be the e¢ cientpolicy and not quantitative restrictions.In the rest of this section we review the empirical research on the ef-
fectiveness of infant-industry protection. We begin by discussing case stud-
30

ies where protection was clearly motivated by infant-industry considerationsand then move on to other approaches that exploit the cross-industry andcross-country variation in trade barriers to see whether protection had theconsequences predicted by infant-industry models.
3.1 Single-Industry Studies
There are very few detailed evaluations of infant-industry protection. Someimportant papers that explicitly take into account learning e¤ects includeBaldwin and Krugman (1986, 1988), Head (1994), Luzio and Greenstein(1995), Hansen, Jensen, and Madsen (2003), and Irwin (2008). Baldwin andKrugman (1986) study protection to the semi-conductor industry in Japan.They use a simulation model to show that the Japanese semi-conductor in-dustry in Japan could not have emerged as a global player without the pro-tected domestic market. Protection was needed in order to achieve the kindsof economies of scale and learning e¤ects that would allow the industry tomove down its marginal cost curve and be competitive on world markets.However, Baldwin and Krugman (1986) also �nd that the costs to Japaneseconsumers outweighed the bene�ts, leading to net welfare losses for bothJapan and the US. Thus, although the semi-conductor sector in Japan sat-is�ed the Mill test, it did not satisfy the Bastable test.Baldwin and Krugman (1988) estimate the impact on US and European
welfare of Airbus�s entry into the imperfectly competitive aircraft model.They show that subsidies to Airbus may have resulted in net welfare gainsfor Europe, primarily due to the high degree of imperfect competition (andmonopoly rents) that characterized the industry. However, their simulationalso makes clear that these results depend heavily on the assumed parame-ters, including the elasticity of demand. In any case, it is possible to evaluatethat sector in such a way that the European subsidy to Airbus passes boththe Mill and the Bastable test.Head (1994) studies the e¤ect of tari¤ protection on the emergence of the
steel rail industry in the United States. This case �ts the infant-industryprotection view almost perfectly: the local industry was initially uncompet-itive (1860s), but a few decades after the imposition of an import tari¤ theUnited States was the world leader in this market and the duty was repealed.Head concludes that "the domestic industry did �grow up�and the duty waseventually removed. Hence, protection certainly did not cause stagnationand gross ine¢ ciencies. Furthermore, the duty led to long-run reductions in
31

domestic prices. While the savings to railroad builders were too small andcame too late to yield a net gain to consumers, the overall e¤ect on welfareappears to have been positive" (p. 163).Hansen, Jensen and Madsen (2003) examine the e¤ect of production sub-
sidies in Denmark for the production of electricity from wind power. Theyconclude that the subsidies elicited strong learning-by-doing in the industry,which achieved a dominant position in the world market. Moreover, accord-ing to their calculations, the direct and indirect (environmental) bene�tsoutweighed the overall costs of the policy.Irwin (2008) evaluates the e¤ects of protection in the tinplate industry in
the United States. The industry �ourished after receiving tari¤ protectionin 1890. Whereas there were no US producers at all prior to the impositionof the tari¤, after the imposition of the tari¤ (at rates exceeding 70 percent)the industry became entirely self-su¢ cient. According to his counterfactualsimulations, the tari¤ accelerated the industry�s development by about tenyears, which would have developed anyway due to falling costs of iron ore.However, the costs to consumer surplus were so large that welfare declinedas a consequence of protection. Irwin concludes that a lower tari¤ of around50 percent could have improved welfare, but that the actual tari¤ imposedexceeded the optimal level and actually decreased welfare.All the previous studies are for cases of protection or subsidies in devel-
oped countries. One single-industry study of infant-industry protection in adeveloping country is that of Luzio and Greenstein (1995), who study thee¤ects of protection of the microcomputer industry in the 1980s in Brazil.They show that although there was rapid productivity growth in the pro-tected industry, it never caught up with the also rapidly growing technolog-ical frontier. As a result, welfare declined by a signi�cant amount (around20 per cent of domestic spending on microcomputers) and the policy wasabandoned in the early 1990s.More studies like these analyzing the welfare implications of infant in-
dustry protection would be very useful. Yet even this brief review makesit clear that protection may lead to higher growth but result in net welfarelosses. For tinplate, steel rail, wind power, semi-conductors and aircraft,protection allowed domestic producers to grow and eventually become worldclass producers. Yet for tinplate, semiconductors, microcomputers, and pos-sibly aircraft, protection led to net welfare losses. These case studies suggestthat designing policies that increase overall welfare is very di¢ cult.
32

3.2 Cross-Industry Studies
The theoretical framework makes a number of predictions for cross-countryempirical studies. If the conditions necessary for infant-industry protectionto improve welfare are satis�ed (see Section 2) are satis�ed, then protectedsectors should experience faster productivity growth than non-protected sec-tors. With time, protected sectors should increase their importance in theeconomy, and eventually become exporters. Under these conditions, onewould expect to �nd a positive correlation between trade protection andproductivity growth.One of the �rst studies to look for a correlation between trade protection
and productivity growth is Krueger and Tuncer (1982). Using cross-industrydata on protection and productivity growth for Turkey in the period 1963- 1976, these authors conclude that the empirical evidence does not providesupport for the infant industry argument. However, Harrison (1994) usestheir data to show that more protected sectors did in fact exhibit higher pro-ductivity growth. As pointed out by Harrison, "Krueger and Tuncer (1982)applied no statistical tests to support their conclusion...If one runs simplecorrelations..one obtains striking results: Krueger and Tuncer�s data showa statistically signi�cant positive relationship between increased protectionand higher productivity growth. In contrast to their stated conclusions, itis possible to show that, in Turkey, protected industries did in fact achievegreater productivity gains during the sample period."While Krueger and Tuncer�s results appear to show some support for
infant industry protection, most studies �nd little support. Cross-industrystudies usually show that the removal of protection generates both intra-�rm and intra-industry productivity gains (possibly through market sharereallocations, just as in Melitz, 2003). This includes work by Pavcnik (2002),Tybout and Westbrook (1995) for Mexico, Harrison (1994) for Cote d�Ivoire,Nishimizu and Page (1982) for Yugoslavia, Kim (2000) for South Korea,Topalova (2004) for India, Muendler (2003) for Brazil, Beason and Weinstein(1996) for Japan, and others.Rodrik (2007) has criticized the use of cross-industry studies to test for the
success of IP on the grounds that if IP is designed to deal with market failuresthat impede sector growth, then one should not be surprised to �nd a negativecorrelation between protection and growth. He assumes that gi = (1� �i)A,where gi is the growth rate of industry i, �i is an index of market failures,and A is a parameter that captures productivity growth that is common
33

across industries. In this framework, industries with stronger market failureswould exhibit slower productivity growth. If there are political or �scalcosts associated with the promotion of an industry then in equilibrium onewould �nd industries with a higher �i exhibiting stronger promotion and lowergrowth. Rodrik�s point is that lower growth could be perfectly consistent witha successful IP, just as it is consistent with a politically motivated policy ofpromoting sunset sectors. Rodrik�s argument may be correct for certaintypes of IP, but not for IP associated with the infant industry argument (asde�ned in Section 2), since this would generate a positive correlation betweenprotection and productivity growth. Even if Rodrik were correct in the shortrun, we would expect that in the longer term successful examples of infantindustry protection would lead eventually lead to growth.In any case, there is a more fundamental problem with existing tests of
infant industry protection. There is no evidence to suggest that interventionfor IP reasons in trade even exists. If intervention were motivated by IPreasons, we would expect the pattern of protection to be skewed towardsactivities where positive externalities or market failures are largest. Instead,existing evidence suggests that protection is motivated by optimal tari¤ con-siderations (Broda, Limao, and Weinstein, 2006), for revenue generation, orto protect special interests (Goldberg and Maggi, 1999, Gawande, Krishnaand Olarreaga, 2005). Tari¤ protection is frequently granted to less suc-cessful �rms or declining industries. Beason and Weinstein (1996) study thepattern of industrial targeting in Japan and speci�cally ask whether the gov-ernment targeted industries with increasing returns or emerging sectors suchas electrical machinery. They �nd the opposite result: protection and otherforms of targeting such as capital subsidies were highest for declining indus-tries and industries without increasing returns. Most tari¤ protection washeavily concentrated in processed food and textiles, while most subsidizedloans and tax relief went into mining. Beason and Weinstein conclude that"industrial policy considerations were dominated by the desire to aid declin-ing sectors or protect the interests of large unproductive industries". Lee(1996) reaches similar conclusions for South Korea.Harrison and Hanson (1999) �nd that in Mexico in the 1980s the pattern
of trade protection was skewed towards food processing and garments, pre-sumably for political economy reasons since these were sectors where Mexicoalready had a comparative advantage. More recently, Mobarak and Pur-basari (2006) use a database on �rms granted import licenses for raw mate-rials and commodities in Indonesia to show that politically connected �rms
34

are more likely to be granted protection. However, �rms that export aresigni�cantly less likely to be granted support. This suggests that �rms mostlikely to succeed on world markets in Indonesia were in fact penalized byrestricting their access to import licenses.
There are a number of other areas where additional research is needed.To properly test the type of model presented in Section 2, we would expectinitial output and productivity gains from the imposition of tari¤s; laterremoval of these tari¤s would generate no e¤ects. We are not aware ofany studies that test for these asymmetric e¤ects of imposing protectionand later removing tari¤s through trade reform. Nor do existing empiricalstudies address the many other reasons why infant industry protection maynot work. Domestic demand in LDCs may lack the level of sophistication thatwould induce �rms to meet the quality standards necessary for penetratingricher markets (Porter, 1990). Porter also argues that weak competitionin small protected markets may not provide the incentives that �rms needto upgrade their technologies and increase their e¢ ciency. Small marketsmay also fail to reach a critical mass where Marshallian externalities arefully exploited. Moreover, as mentioned above, industries that use simpleproduction methods may expand without the generation of any externalities,even if those same industries do exhibit strong Marshallian externalities inrich countries (Baldwin, 1969, Rodríguez-Clare, 2007). Firms may believethat protection will fail to create a cluster, and so they may decide notadopt the production methods that lead to externalities but are pro�tableonly within a cluster. In other cases protection may actually favor the useof backward technologies that do not contribute to the generation of higherindustry-level productivity (Sauré, 2007).The realization of Marshallian externalities is a much more complex process
than what the model in Section 2 suggests. As argued by Rosenthal andStrange (2005), "there are many di¤erent aspects of a location that maymatter to �rms. A well-intentioned policy could easily fail because it failedto attend to one or two of these... it may not be possible to duplicate else-where the circumstances that led to a successful agglomeration in anotherplace... This is not to say that government policy has never contributed tothe formation of clusters. It certainly has, but the formation of clusters hasbeen a side-e¤ect rather than the primary goal of the policy..." (p. 19). Inother words, the econometric evidence regarding Marshallian externalitiesmay in fact be telling us that agglomeration may be necessary but not suf-�cient for increased productivity. If a certain factor, policy or institution
35

is necessary for geographic concentration of an industry to lead to higherproductivity, then we may observe Marshallian externalities taking place inadvanced countries, but not in LDCs. To put it crudely, subsidizing thesoftware sector may not generate a Silicon Valley in a developing country.
3.3 Cross-Country Studies
There are a number of cross-country studies evaluating the success of IP.These can be grouped into (1) testing for an association between protectionand country performance and (2) qualitative case study evidence. A numberof recent studies emphasize the importance of the pattern of protection inunderstanding possible linkages between IP and economic growth. Theseinclude O�Rourke (2000), Clemens and Williams (2001), Chang (2002), Irwin(2002), Lehmann and O�Rourke (2008),O�Rourke (2000) and Clemens and Williamson (2001) both �nd a posi-
tive correlation between import tari¤s and economic growth across countriesduring the late nineteenth century. These two studies hypothesize thatprotection was associated with growth because it allowed countries to ac-celerate the growth of what were then "emerging" sectors (industry) out of"declining sectors" (agriculture). These emerging sectors were character-ized by learning e¤ects and the kinds of Marshallian externalities modelledin Section 2. These new explanations for the observed positive relationshipbetween growth and protection at the turn of the twentieth century couldalso be used to explain how �rst Britain, and then the United States, wereable to emerge as economic leaders in conjunction with tari¤s that were veryhigh in the eighteenth and nineteenth centuries. Chang (2002) claimed thatprotection was essential in the transformation of the United States into anindustrialized economy in the 19th century. Others (for one such view,see Sir Arthur Lewis, 1955) have argued that Latin America�s relatively highgrowth rates during the 1960�s and early 1970�s in a time of high e¤ectiverates of protection was also no coincidence.Irwin (2002) casts doubt on the meaning and robustness of such correla-
tions, arguing that rather than a causal relationship from protection for IPreasons to growth, the positive correlation comes from the fact that a fewfast growing countries (e.g. the United States, Canada, Argentina) imposedhigh tari¤s as a means of raising �scal revenues. Lehmann and O�Rourke(2008) are able to address this criticism by purging their results of tari¤simposed for revenue purposes.
36

As pointed out by Lehmann and O�Rourke (2008), what you protectmatters. If the pattern of protection is skewed towards increasing returnssectors where there are important externalities, then IP would be much morelikely to work than if protection is given to declining sectors or sectors with-out externalities. In their book analyzing whether openness to trade is likelyto be associated with higher growth, Grossman and Helpman (1991) makea similar point. Lehmann and O�Rourke examine the pattern of protectionand growth for a sample of developed countries during the period between1875 and 1913. They �nd that while agricultural tari¤s were negatively cor-related with growth, industrial tari¤s were positively correlated with growth.Lehmann and O�Rourke also separately examine the relationship betweengrowth and what they refer to as "revenue tari¤s"�tari¤s imposed on goodsnot produced at home and applied to raise revenue. They �nd no relation-ship between tari¤s imposed to raise revenue and economic growth. They donot, however, estimate the impact of protection on productivity growth, nordo they calculate the net welfare e¤ects of these policies.Two other recent studies that emphasize that it is the pattern of protec-
tion which matters and not the average level of protection include Nunn andTre�er (2004) and Estevadeordal and Taylor (2008). Nunn and Tre�er (2004)�nd that countries which protect skill-intensive sectors grow more rapidlythan countries which protect unskilled-labor-intensive industries. Estevade-ordal and Taylor disaggregate tari¤s into consumption, capital goods, andintermediate goods tari¤s. For the 1970s through the current decade, Es-tevadeordal and Taylor show that tari¤ protection a¤ects growth negativelyby more if tari¤s are on capital or intermediate goods than on consumptiongoods. We continue and expand this discussion to include a more generalevaluation of the literature on trade and growth in Section 4.Another approach relies on qualitative case study evidence to contrast
the apparent success of East Asia countries relative to Latin America andelsewhere in the use of industrial policy. There is signi�cant debate overwhether the use of a range of industrial policy instruments, including infant-industry protection, helped or hurt development in East Asia. A commonview is that East Asian countries used export subsidies whereas Latin Ameri-can countries used import tari¤s, and that this explains part of the di¤erencein performance in these two regions. In fact, East Asian countries used bothimport tari¤s and export subsidies, and this created a setting in which the in-centives were neutral regarding import substitution versus exports, althoughmanufacturing as a whole enjoyed some net promotion (World Bank, 1993).
37

China�s policies over the last twenty �ve years could similarly be describedas using both import tari¤s and export subsidies.South Korea and Taiwan had tremendous rates of physical and human
capital accumulation over the 60s, 70s and 80s, and this went together withrapidly changing comparative advantage towards capital intensive goods. Ofcourse, the standard explanation of this experience is that capital accumula-tion caused by some exogenous factors led to a changing comparative advan-tage. But an alternative interpretation, consistent with the model presentedin Section 2.1.2, is that such a structural transformation was not inevitablebecause of multiple equilibria. In particular, without protection or promotionof the capital intensive sectors, countries would have remained specialized inthe sectors where they enjoyed a static comparative advantage; since thesesectors were not capital intensive, then capital accumulation would not havetaken place. Amsden (1989) and Wade (1990) have argued that IP was cru-cial for some East Asian countries to capitalize on their latent comparativeadvantage in advanced manufacturing.It is clear that East Asian countries indeed pursued several policies to
encourage particular sectors, such as production subsidies, subsidized credit,�scal incentives, and trade protection. But what was the actual e¤ect of thesepolicies relative to what would have happened in their absence? Can IP becredited with bringing about the successful industrialization experienced inEast Asia? One approach in the literature has been to check whether theindustries that received most support are the ones that have grown mostrapidly.28 As we discussed above, protection is typically motivated by politi-cal or terms of trade reasons rather than prospects for higher growth throughIP. In the late twentieth century, in contrast to the last century when indus-trial countries protected emerging industries, it appears that trade barriersare often designed to protect "sunset" industries rather than to encourage"sunrise" industries (see Noland and Pack, 2003).
3.4 Export subsidies and other forms of IP
We have focused our discussion of the empirical evidence regarding the ef-fectiveness of IP on infant-industry protection. But clearly there are manyother forms of IP: countries could subsidize exports across the board or in
28Beason and Weinstein (1996) perform this exercise for Japan while Lee (1996) does itfor Korea. See Noland and Pack (2003) for a comprehensive review of this literature.
38

particular industries, they could impose di¤erential taxes, as well as di¤eren-tiated production, credit and R&D subsidies. Since a comprehensive reviewof all forms of IP is not possible, in the rest of this section we focus ourdiscussion on export subsidies.Consider again the case in which some sectors exhibit Marshallian ex-
ternalities. An overall export subsidy would simply preserve the allocationassociated with the current pattern of comparative advantage. If export sub-sidies are targeted to the sectors that exhibit Marshallian externalities, thenthey could also be e¤ective in switching the economy to the equilibrium withhigher welfare. Again, production subsidies are less distortionary than exportsubsidies but they impose stronger �scal demands. Thus, for governmentswith great �scal needs or where taxation is very distortionary at the margin,export subsidies could be a reasonable option, although import tari¤s wouldbe less costly.In any case, the advantages of export subsidies relative to import tari¤s
in improving productivity are threefold: (1) that by promoting exports, acountry makes sure that �rms are subject to the "discipline of the inter-national market," which forces �rms to become more productive; (2) thatby subsidizing only exporting �rms, a country e¤ectively limits the subsidyto �rms with high productivity; and (3) that domestic markets may be toosmall to allow the protected industry to reap the full bene�ts of Marshallianexternalities. All of these arguments are relevant but require some qual-i�cation. First, the discipline of the international market applies both to�rms that export and to those that sell in domestic markets as long as thereare no quantitative restrictions. Second, there is in principle no reason tosubsidize highly productive �rms over low productivity �rms (see Demidovaand Rodríguez-Clare, 2007), unless there are barriers that prevent resourcesfrom �owing from the latter to the former, in which case the most e¢ cientpolicy would be to remove those barriers. Finally, if the economy is smallin relation to the industry size needed to fully exploit the Marshallian ex-ternalities, this is not going to be �xed by an export subsidy. A di¤erentand more reasonable argument is that domestic demand is not su¢ cientlysophisticated, hence �rms selling to domestic consumers will not develop thenecessary level of sophistication needed for success in international markets.Export orientation for infant industries would avoid this problem.29
29Although we have focused on trade policies, the use of local-content requirementson foreign producers can also be justi�ed by appealing to Marshallian externalities. In
39

One could rede�ne the case for industrial policy as trying to change in-centives to produce (or export) some goods and not others. What evidence isthere that what a country exports (or imports) matters? There are a numberof studies listed in Table 2 which suggest that the growth e¤ects of opennesshinge on the composition of trade. These include Dodaro (1991), Giles, Gilesand McCann (1992), Hansen (1994), Ghatak, Milner, and Utkulu (1997),Pineres and Ferrantino (1997), Xu and Wang (1999), Choudhri and Hakura(2000), Khalafalla and Webb (2001), and An and Iyigun (2004). With oneexception, all these studies �nd that exports are more likely to lead to growthif they are in non-traditional sectors such as manufacturing or skill-intensivegoods rather than primary products or raw materials; studies also �nd thatgreater export diversi�cation is more likely to be associated with growth.Hausmann, Hwang and Rodrik (2005) develop a measure of the sophisti-
cation of a country�s exports based on the level of GDP per capita associatedwith the export of di¤erent goods worldwide. Once they have attached alevel of GDP per capita to each detailed export category based on whichcountries export the good, they can then derive the implied GDP level of acountry�s exports. Countries whose export baskets contain items typicallyproduced by higher income countries have a "high" level of export sophistica-tion relative to what would be expected given their level of development. Inprinciple, one could construct a measure of the distance between the impliedincome level of a country�s exports and the country�s actual level of GDPper capita. In a related paper, Rodrik (2006) shows that China�s exports in1992 were associated with an income level more than six times higher thanChina�s per-capita GDP at that time. Rodrik suggests that the gap betweenthe implied level of income of China�s exports and China�s actual GDP percapita is too large to have occurred naturally and is one outcome of China�sactivist industrial policy.These studies suggesting that what a country exports is more impor-
tant than how much the country exports for long run growth are suggestivethat IP has played an important role in country growth experiences, but arenot conclusive. No researchers have identi�ed an association between theexistence of Marshallian externalities in particular sectors, industrial promo-tion of those sectors, consequent changes in the commodity composition of
fact, such requirements force multinationals to buy local inputs just as protection inducesdomestic consumers (and �rms) to buy from local producers. A major di¤erence, of course,is that local-content requirements are quantitative restrictions rather than explicit tari¤sor subsidies.
40

a country�s export basket, and growth. Consequently, we can only looselyinfer that rapid changes in the composition of a country�s exports towardsmore sophisticated products could be indicative of IP.
4 Trade and Economic Development
Countries intervene in trade for many reasons, including the desire to shiftproduction towards sectors with positive externalities (industrial policy), toraise revenue, to a¤ect terms of trade, and to satisfy special interests. Wereviewed in Section 3 some of the studies that explicitly evaluate the suc-cess of IP. There is almost no research that has been able to isolate thee¤ects of IP on welfare, taking into account all the other motives for pro-tection. However, there is a large literature which estimates the reducedreform relationship between openness to trade and economic growth. Inthis section, we review nearly 200 prominent studies that use some kind ofreduced form approach. We identify the di¤erent measures of openness usedin this literature, the datasets, the identi�cation strategies, and the resultsCan we use this vast literature to cast light on the IP debate? In de�ning
openness to trade, we make a distinction between trade volumes, such asexports or imports, and trade policy, such as tari¤ reductions or changesin quotas. Most of the studies we review below �nd a positive relationshipbetween trade volumes and growth. While there are far fewer studies thatevaluate the linkages between tari¤s and growth, they tend to get insigni�cantor weak e¤ects. This should not be surprising given the mixed motivesfor imposing tari¤ protection. We hypothesize that these di¤erent resultsimply that industrial policy is more likely to induce growth it is "pro-trade".Yet from a practical standpoint, it is di¢ cult to envision a successful setof policies that are both pro-trade and protectionist; at a minimum, thiswould require policies that fully o¤set any anti-trade biases. The positivecorrelation between trade shares and growth is consistent with our hypothesisthat IP implemented via export promotion and encouragement of FDI hasgenerally led to higher productivity and growth outcomes, relative to IPimplemented through protection from trade. Before we turn to the literatureon trade volumes, trade policies, and country outcomes, we begin with somestylized facts.
41

4.1 Stylized Facts on Trade policies, 1980-2004
If we use a conventional measure of trade volumes such as export sharesin GDP, developing countries are now more integrated into the world econ-omy than the industrial countries. Figure 2 shows that export shares fordeveloping countries overtook industrial countries in the early 1990s.
10 .0
12 .5
15 .0
17 .5
20 .0
22 .5
25 .0
1980 8 2 84 86 88 1 99 0 92 9 4 9 6 98 2000 2
Source: G EP 200 3, W o rld B ank data .
D evelo pin g cou n tr ies
H ig h in com e co u n tr ies
Figure 2: Export Shares in Developing and High-Income Countries
Table 1 shows the evolution of country trade policies over the last twenty�ve years. Countries are ranked according to the net change in tari¤ levelsbetween 1985 and 2004. We have included both developing and developedcountries to provide an indication of how protection changes at di¤erentstages of development. The �rst four columns indicate the ratio of tari¤revenues to trade �ows, taken from the World Bank. The next four columnsreport the actual administrative tari¤s, averaged across import categoriesbetween 1980 and 2004. The last three columns report changes in thesetari¤s between 1985 and 2004. The last column indicates the change in thestandard deviation of tari¤s over time; this measure is an indication of thechange in the dispersion of tari¤s.It is evident from Table 1 that there has been a dramatic decline in tari¤
protection among developing countries. Average tari¤s in India declined from
42

98.8 percent in 1980 to 28.1 percent in 2004; in Bangladesh from 86 to 16.4percent; in Costa Rica from 53 percent to 5.7 percent; in China from 49.5percent in 1980 to 9.8 percent in 2004; in Turkey from 44 to 2.6 percent, andin Chile from 30 percent in 1985 to 4.9 percent. Not all countries had suchenormous declines, however: in Algeria, average tari¤s only declined slightly,from 21 to 18 percent.There are several other features worth noting in Table 1. The last column
of Table 1 shows that there has been a dramatic decline in tari¤dispersion, asindicated by the fall in the standard deviation of tari¤s. There is also a largediscrepancy between tari¤ revenues as a percentage of trade �ows ("revenuetari¤s") and actual statutory tari¤s. Revenue tari¤s are reported in the�rst 5 columns of Table 1, while statutory tari¤s are reported in columns 6through 10. To illustrate the di¤erence, Table 1 shows that average tari¤sin India in 1985 were 98.8 percent but tari¤ collections as a percentage oftrade were only 24.4 percent. In Paraguay, average tari¤s were 71 percentin 1980, while tari¤ collections were 6 percent; in Costa Rica, tari¤s were 55percent and collections were 5.3 percent; in Chile, average tari¤s in 1985 were30 percent but tari¤ collections were 5.7 percent. The di¤erence betweenthese two measures re�ects in part the role of tari¤ exemptions�typicallystate enterprises were exempt from paying tari¤s, as were many exportersand foreign enterprises� as well as selective imposition of duties by customso¢ cers and the negative impact of high tari¤s on imports.We also highlight the historically high levels of protection in China. China
has arguably had the most spectacular success in integrating into the worldeconomy in the last two decades. Yet in 1990, it was still one of the mostprotected economies in the world, with an average tari¤ rate of 40 percent.According to Table 1, in 1990 China was tied for �fth place in average levelsof tari¤ protection, behind Bangladesh, India, Pakistan, and Kenya. Thedispersion of tari¤ levels was also high, and the maximum tari¤ exceeded200 percent. Figure 3, taken from Rodrik (2006) documents that much ofChina�s export surge occurred simultaneously with the imposition of hightari¤s. Nevertheless, countries such as China and India� because they hadsuch high tari¤s to begin with� also exhibited the highest tari¤ reductionsbetween 1985 and 2004.
43

Figure 3: Exports as a share of GDP
44

4.2 Cross-country Evidence on Trade Policies, TradeVolumes, Productivity, and Growth
A standard approach in the cross-country literature is to regress an outcomeof interest for country i at time t (GDP growth, real GDP per worker, ortotal factor productivity growth) on a preferred measure of openness and aset of controls Z,
Yit = Constant+ �OPENNESSit + �Zit + �i + � t + "it (10)
Most controversies have arisen over the following three issues:
1. How to measure OPENNESS
2. How to account for the endogeneity between Y and OPENNESS.
3. Which variables to include in the set of controls Z.
(1)How to measure openness. There is a large debate over how to measureopenness. The ideal measures for understanding the linkages between tradepolicies and outcomes are measures of policies themselves� such as tari¤sand quotas, but until recently, these measures were hardly ever used (seeHarrison (1996) for a discussion). How much of a problem is the lack ofinformation on statutory tari¤s (in contrast to revenue tari¤s) in practice?If the di¤erence between actual tari¤s and revenues are due to exemptionsin the tari¤ schedule, then the tari¤ schedule is misleading, and it wouldactually be better to use revenues as a share of import value. But if thedi¤erential between revenue tari¤s and statutory tari¤s highlighted in Table1 re�ects the restrictive impact of high barriers on trade volumes, barriers, orcorrupt practices which impose rent-seeking costs not re�ected in revenues,then using trade revenues to proxy for tari¤s is not ideal.A more fundamental problem which has plagued the literature on the
relationship between trade policies and growth is the continued use of tradevolumes as a proxy for policy. Trade volumes are a¤ected by many di¤er-ent factors, including policies, distance to neighbors and trading partners,country size, exchange rate movements, terms of trade changes, and barriersto entry. Consequently, simply using trade volumes to proxy for changesin trade policies may be misleading. We evaluate the relationship betweenthese di¤erent openness measures in Table 3. We present correlations be-tween actual tari¤s, trade taxes as a percentage of trade, two measures of
45

trade volumes, the nominal exchange rate, and the ratio of foreign investmentin�ows to GDP using annual data from 1980 through 2004. For trade shares,we include both nominal and real trade shares, where real trade shares arede�ned as the ratio of trade to GDP in constant prices from the Penn WorldTables (version 6.1). Table 4 repeats the same exercise, but restricts thesample to developing countries. The correlations reported in Tables 3 and 4highlight the following:
� Although Table 1 indicates a big di¤erence in magnitude between theratio of tari¤ revenues to trade and actual administrative tari¤s, thecorrelation coe¢ cient reported in Table 3 between the two measures isactually quite high at .63 and statistically signi�cant.
� There is a signi�cant negative correlation between trade shares andtari¤s. The correlation with nominal openness is -.25. The correlationwith real openness about the same, between -.2 and -.3, depending onwhich measure of tari¤s is used.
� The negative correlation coe¢ cient between trade policies (tari¤s) andoutcomes (trade shares) does not depend on how tari¤s or trade sharesare measured.
� Tari¤ levels are highly (negatively) correlated with the ratio of foreigninvestment in�ows to GDP, and trade volumes are highly (positively)correlated with foreign investment in�ows. In fact, trade �ows aremore highly correlated with foreign investment in�ows than they arewith tari¤s. These correlations suggest that measures of openness mayalso be capturing the gains from foreign investment in�ows.
� The correlations are the same or stronger if we restrict the sample todeveloping countries (see Table 4). Trade taxes as a share of trade �owscontinue to be highly correlated with actual tari¤s. The correlationcoe¢ cient between trade shares and both tari¤ measures increases to(negative) .36.
These stylized facts suggest that trade taxes as a share of trade are amuch better proxy for average tari¤s than trade shares. The correlationcoe¢ cient of statutory tari¤s with revenue tari¤s is signi�cantly higher thanthe correlation of statutory tari¤s with trade shares (.70 versus -.35). Yet
46

researchers continue to rely on trade shares as a measure of trade policy,despite the easily available (World Bank or IMF) tari¤ revenue measure.The other broad conclusion we can draw from these data is that there isa signi�cant positive relationship between less restrictive trade policies andhigher trade shares. Pritchett (1996) suggested that:
�alternative objective measures of trade policy are completelyuncorrelated across countries. This result has serious implica-tions for empirical research that attempts to assess the e¤ects ofliberalization on economic performance using comparisons acrosscountries; it also highlights the di¢ culties of interpretation inthese types of empirical studies�.
We would argue that this is not the case: statutory tari¤s are highlycorrelated with revenue tari¤s, indicating that they are excellent measuresof trade policy There is also a signi�cant and negative correlation betweentari¤measures and outcome measures such as real or nominal trade shares inGDP. Nevertheless, the magnitude of the (inverse) correlation between tradeshares and trade policies is not nearly large enough to allow proponents offree trade to argue that high trade shares always re�ect a free trade stance.Most studies listed in Table 2 use trade volumes as a measure of openness,
but trade volumes are outcomes of trade policies as well as a host of factorsincluding geography, shifts in terms of trade, exchange rate shocks, andchanges in transport and communication costs. Much of the criticism inthe important and widely cited Rodriguez and Rodrik (1999) NBER MacroAnnual paper is directed at the inadequacy of typical proxies for openness.Rodriguez and Rodrik �nd fault with Dollar (1992), Edwards (1998), andSachs and Warner (1995) for using exchange rate distortions as measures oftrade policy, since exchange distortions re�ect macro-economic distortions,not trade policies per se. They also critique Edwards (1998) for using aWorldBank classi�cation of trade regimes which is subjective. While Dollar�s (1992)openness measure seems ideal because it directly measures the deviation ofdomestic from international prices, Rodriguez and Rodrik argue the measureis primarily correlated with swings in the exchange rate. Dollar (1992) usesthe following de�nition of openness:
OPENNESSi = 100
�Pi
EiPUSA
�47

OPENNESS is the relative price level compared to the United States,with all price levels converted to US dollars, using Summers-Heston country-speci�c consumption price indices. A higher price level should indicate ahigher degree of distortions. Rodriguez and Rodrik (1999) argue that thelaw of one price does not hold in general, and that domestic prices could behigh for reasons other than trade policy. These could include high transportcosts or monopolies in distribution channels. In practice, Rodriguez andRodrik show that there is no relationship between the openness measurecalculated by Dollar and actual tari¤s or non-tari¤ barriers. In fact, tari¤sand non-tari¤barriers enter with the wrong sign if this measure of openness isregressed on tari¤s and non-tari¤barriers. They then show that this measureis primarily capturing exchange rate movements.Both Rodriguez and Rodrik (1999) and Harrison and Hanson (1999) cri-
tique a heavily used measure of openness created by Sachs andWarner (1995).The Sachs and Warner measure has been updated by Wacziarg and Welch(2007), but the updated measure may su¤er from the same shortcomings asthe Sachs and Warner measure. Harrison and Hanson show that the Sachsand Warner (1995) measure of OPENNESS does not pick up di¤erences intrade policy but instead re�ects di¤erences across countries in exchange ratepolicies and political regimes. One way to reinterpret the evidence presentedin Dollar (1992) and Sachs and Warner (1995) is that real exchange rate over-valuation is bad for growth, a theme recently emphasized by Rodrik (2007).One obvious implication for researchers is that any study which measuresthe impact of real price distortions on growth due to protection should alsocontrol for exchange rate movements.
(2) Endogeneity problems. Endogeneity problems could arise for manyreasons. Policy makers may prefer not to open up to trade until �rms arecapable of competing on world markets, suggesting that the causality runsfrom incomes to openness. Even statutory measures of trade policy (tari¤s,quotas) are endogenously determined. The pattern of protection is likelyto be skewed towards protecting weak sectors,promising infant industries,special interests or vocal minorities.While empirical work in the 1970s and 1980s largely ignored endogeneity
problems, newer studies give much greater weight to constructing plausibleidenti�cation strategies. This progress is evident in Table 2, which listsprominent studies on the linkages between openness and growth from the1980s onwards. Most of the early studies had no identi�cation strategy at
48

all, as indicated in column (4). More recent work addresses this omission,using one of two general approaches.The �rst approach is to use granger-causality tests that exploit lags in
studies that use time-series datasets. As indicated in Table 2, these studies of-ten �nd that causality runs in the reverse direction, from Y toOPENNESS:more successful economies (or sectors) are more likely to open up to globalcompetition. Related to this approach is the use of lags as instruments, whichdepends on some strong assumptions about the lack of correlation betweenthe instruments and the error term.The second general approach to identi�cation has been to seek additional
instruments for OPENNESS. One path-breaking study along these lines isFrankel and Romer (1999). Frankel and Romer use the insights from gravitymodels to derive an instrument based on geographic proximity. Gravitymodels predict that countries closer to each other trade more with each other.This means that distance can be used as an instrument for bilateral trade.In the �rst stage regressions, Frankel and Romer regress the log of countryi�s trade with country j as a share of country i�s GDP on distance and othervariables:
ln (� ij=GDPi) = a0Xij + � ij
The vectorX includes the log of distance between country i and j, the logof population and area in both countries, and dummy variables indicatingwhether the two countries share a common border and whether they arelandlocked. There are no subscripts for time in this speci�cation: this is apure cross-section using data for 1985. Frankel and Romer show that greaterdistance from a trading partner reduces bilateral trade, and they are able toexplain 36 percent of bilateral trade in the �rst stage. Using the �rst stageestimates, Frankel and Romer then generate an OPENNESS variable byaggregating predicted bilateral trade with all of country i�s trading partners.In the second stage, Frankel and Romer regress log of income per capita in1985 on the predicted trade share, log of population and log of area. Theyshow that OPENNESS positively a¤ects income per capita.The beauty of this approach is that geographic proximity is without ques-
tion exogenous with respect to income. There are several problems, how-ever. Since distance does not change over time, the authors cannot allowfor country-speci�c �xed e¤ects �i in equation (1) and are restricted to purecross-section estimation. While one solution in principle would be to con-trol for factors that vary across countries but remain �xed over time� such
49

as cultural or institutional di¤erences� it may be di¢ cult to control for allthese omitted determinants of income. Another concern is that Frankel andRomer�s original results are not very robust: the statistical signi�cance onpredicted openness disappears once we add continent dummies, which is notsurprising since all the identi�cation is from the cross-section. Frankel andRomer also omit observations with zero bilateral trade in the �rst stage,which probably contributes to the poor �rst stage R-square and the result-ing weak instrument problem. Rodriguez and Rodrik (1999) are also criticalof Frankel and Romer because they argue that greater openness to trade gen-erated through geographic proximity may have di¤erent e¤ects from tradegenerated through trade policy interventions. One further concern is thatthe instrumental variable estimates magnify the impact of trade on incomes,in contrast to what one would expect if trade is a positive function of income.The explanation given by Frankel and Romer is that the bias goes in the op-posite direction because of measurement error, but one is still left wonderingwhether or not the authors have successfully addressed the endogeneity oftrade to income.Alcala and Ciccone (2004) use the insights of Frankel and Romer to im-
prove on their initial speci�cation. They use all bilateral trade data availablein the �rst stage, including those bilateral trade pairs with zero trade, whichimproves the �rst stage F-statistic from 3.06 using Frankel and Romer�s bilat-eral trade pairs to 11.66. This gives them two and a half times the number ofobservations in the �rst stage relative to Frankel and Romer. Consequently,the second stage relationship between their chosen measure of openness andtheir dependent variable Y (the log of PPP GDP per capita in 1985) is morerobust. They also add a measure of institutional quality to the Z vector,which addresses the concern that trade is positively correlated with incomeor growth because greater openness is correlated with better institutions.They instrument institutional quality with language and settler mortalitydata, drawn from Hall and Jones and Acemoglu, Johnson and Robinson.Nevertheless, any analysis which uses geography as an instrument is stillrestricted to a pure cross-section analysis, which requires the researcher to�nd all possible covariates which could induce a spurious correlation betweenOPENNESS and Y .There are other aspects to Alcala and Ciccone (2004) which suggest that
the relationship between openness and income in a pure cross-section is notvery robust. Trade openness is only signi�cantly correlated with Y if theauthors use a �real�measure of openness, de�ned as the ratio of PPP trade
50

to GDP. Nominal trade shares are not signi�cantly associated with GDP percapita, which leads Rodrik, Subramanian, and Trebbi (2004) to suggest thatAlcala and Ciccone�s results are driven by movements in the price level, notby trade. It is di¢ cult to be sure, however, since Rodrik, Subramanian andTrebbi do not use exactly the same speci�cation as Alcala and Ciccone.Romalis (2007) suggests another clever instrument for a country�sOPENNESS:
tari¤s imposed by a country�s trading partners. In particular, Romalis usesUS most-favored nation (MFN) tari¤s as an instrument for developing coun-try trade shares. Using this instrument, he shows that the change in realper capita GDP is positively and signi�cantly a¤ected by trade, and thatthe magnitude is economically important. Using MFN tari¤s is particularlyclever, since these are unlikely to be in�uenced by developing country behav-ior and are consequently exogenous. This is at the same time a limitationof the approach: the instrument only varies over time, not across countriessince the US must apply the same MFN tari¤s to all its trading partners.The results also could be interpreted to suggest that other country poli-cies matter for developing country growth, but sheds less light on whetherown developing country policies to lower their trade barriers is bene�cial forgrowth. What Romalis shows is that access for developing country exports isbene�cial for growth, but his research does not indicate whether opening upimport-competing sectors to competition through reductions in protectionare also bene�cial for growth.Two very recent studies which make an important contribution to resolv-
ing the endogeneity of trade and growth are Feyrer (2009) and Donaldson(2009). Feyrer (2009) suggests a solution to the problem faced by Frankeland Romer in using geography as an instrument. To overcome the fact thattheir instrument did not vary over time, which made it impossible to controlfor country �xed e¤ects, Feyrer allows the importance of air and sea distanceacross countries to vary over time. In the �rst stage of his estimation, Feyrerallows the coe¢ cient on air and sea distance to be time-varying in explainingbilateral trade. He then uses those time varying coe¢ cients to construct timeand country-speci�c instruments for the �rst stage. Feyrer shows that tradehas important, robust e¤ects on growth using a panel of countries for 1960through 1995. Donaldson (2009) uses historical data for 1861 through 1930across Indian districts to estimate the impact of the introduction of railroadson trade costs, income volatility, price convergence, and economic growth.He traces out the mechanisms through which railroads a¤ected income andshows that the reduction of trade costs through the introduction of railroads
51

had large and important e¤ects on economic growth.(3) Which variables to include in the set of controls Z : The third major
area of controversy in this literature is which variables to include in the set ofcontrols Z. There is a growing literature which claims that two key omittedvariables from the Z vector, leading to omitted variable bias in early stud-ies, are institutions and geography. Indeed a recent literature has sought todistinguish between institutions, economic geography, and trade as sourcesof economic growth, including Easterly and Levine (2003), Rodrik, Subra-manian, and Trebbi (2004), and Alcala and Ciccone (2004). Only Alcalaand Ciccone �nd that openness matters; the other two studies �nd that �in-stitutions rule�. There are several reasons for why Alcala and Ciccone getvery di¤erent results from Rodrik et. al. (2004). First, Alcala and Cicconeuse real trade shares while Rodrik et. al. use nominal trade shares as theirmeasure of openness. Second, Alcala and Ciccone improve upon the Frankeland Romer measure by expanding the �rst-stage and using more countries,improving the �rst-stage F and reducing the fragility of the instrument.None of these three studies, which have been extensively cited in the
empirical literature on the determinants of growth, uses trade policy as ameasure of openness. Easterly and Levine (2003) use the Sachs and Warner(1995) and Dollar (1992) measures to proxy for openness; the �aws of thesetwo measures are discussed above. Rodrik et. al. use the average of nominaltrade shares for 1950 through 1998 as their openness measure. All threepapers focus on a pure cross-section of countries. As pointed out by Harrison(1996), trade policies and trade shares have changed too much over the lastforty years to make long run averages very meaningful.Given the problems inherent in the openness measures, and the reliance on
pure cross-sectional estimation, it is not surprising that openness is trumpedby institutions in two of these three studies. This research also highlightsthe tremendous problems associated with measuring institutions in a waywhich is distinct from trade policy. The correlation between the opennessand institutions measures in Easterly and Levine (2003) is .68, which suggeststhat multicollinearity is likely to be a signi�cant problem. Both Rodrik et.al. and Alcala and Ciccone use the Kaufmann, Kraay and Zoido-Lobatonmeasure of institutions, which is constructed fromWorld Bank surveys basedon responses for 1997-1998. Yet the dependent variables in these two studiesare PPP GDP per capita prior to that period: 1985 PPP GDP per workerfor Alcala and Ciccone and PPP GDP per capita in 1995 for Rodrik et. al.It seems odd to try to understand growth in 1985 or 1995 using measures
52

of institutions based on data from the end of the 1990s, unless institutionschange very little. Yet if institutions are not time-varying, then they maysimply be capturing the country �xed e¤ect �i in equation (1).While this survey has highlighted some of the shortcomings of cross-
country work on openness and growth, there are several promising new areasof research which deserve mention. Most of the work surveyed so far usesa measure of real GDP per capita or per capita growth as a measure of Y .Yet a number of studies have suggested that openness is important becauseit allows countries to invest more. Levine and Renelt (1992) show that thereis no robust relationship between di¤erent measures of openness and averageper capita GDP growth in their cross-country sample. Replacing Y withinvestment shares in GDP, however, they �nd that openness is robustly cor-related with investment rates. They conclude that �the relationship betweentrade and growth may be based on enhanced resource accumulation and notnecessarily on the improved allocation of resources�.Levine and Renelt show that trade matters for growth because it increases
investment. One mechanism could be by reducing the price of investmentgoods. Delong and Summers show that countries with lower investmentprices grow faster, and Lee (1995) shows that a higher share of importedcapital goods in total investment are associated with higher growth. Morerecently, Hsieh and Klenow (2007) argue that on the contrary there is no linkbetween lower relative prices of investment goods and trade policy. They citeas evidence the fact that the actual level of prices for investment goods inpoor countries are not higher than in the rest of the world. Instead, theyargue that investment rates are low in poor countries because the relativeprice of investment is high relative to non-traded consumption goods, suchas services.The importance of barriers to investment in understanding linkages be-
tween trade and growth is taken up once more by Estevadeordal and Taylor(2008). They estimate a version of equation (1) in di¤erences, but separatetheir measure of openness into tari¤s on consumption goods, intermediates,and capital goods. They also allow for a country �xed e¤ect in di¤erences,leading to a di¤erence-in-di¤erence speci�cation for (1). They show that thisapproach successfully addresses the problem of whether institutions or tradepolicy is responsible for higher incomes, since in �rst di¤erences there is noclear correlation between the two. In addition, they address the potentialendogeneity of changes in openness by using as instruments for the changethe level of tari¤s in 1975 interacted with two measures of what they refer to
53

as �GATT potential�: GATT membership in 1975 and a measure of diplo-matic pressure constructed from number of diplomats. Estevadeordal andTaylor show that tari¤ protection a¤ects growth more negatively if tari¤sare on capital goods or intermediates, which is consistent with Levine andRenelt�s 1992 hypothesis that openness matters because it a¤ects resourceaccumulation.A second promising area of research is related to an emerging consensus
on the need for openness to trade to be accompanied by key complementarypolicies. Recent research emphasizing the importance of complementaritiesbetween trade and other policies includes Chang, Kaltani, and Loayza (2005),Bolaky and Freund (2006), and Ja¤ee and Sutherland (2003). One reasonwhy the relationship in (1) may be fragile could be because openness to tradeis most successful if implemented in conjunction with other policies�whichmake it possible for �rms to e¤ectively compete on world markets. If such apolicy can be characterized as X (there could be overlap between X and Z),then it would lead to a slightly di¤erent speci�cation:
Yit = Constant+ �OPENNESSit + �Zit + �Xit
+�(OPENNESS �X)it + �i + � t + "it
Figure 4, taken from Bolaky and Freund (2006), makes this point graphi-cally. Bolaky and Freund use three di¤erent measures of openness, includingreal and nominal trade shares, and tari¤s. In countries with low barriers toentry, there is a positive relationship between openness to trade and growth;in regulated economies, there is a negative relationship. The importance ofother policies� in this case, low entry barriers� provides one explanation forwhy it is so di¢ cult to �nd a robust relationship between openness to tradeand good performance. There is simply too much heterogeneity in outcomes,in large part because other types of policies are so di¤erent. The necessity foropenness to trade to be accompanied by low barriers to entry and exit can beunderstood in light of new trade theories that emphasize �rm heterogeneity,as illustrated by Melitz (2003). In his model, gains from trade occur throughreallocation of market share from less productive to more productive �rms.If �rms cannot easily expand or exit, this important source of productivitygains through trade reforms is lost.Two other studies also �nd that gains from trade are contingent on other
policies. Chang, Kaltani, and Loayza (2005) use panel data instead of across-section and trade shares corrected for country size are their measure of
54

Figure 4: Trade, Growth, and Regulation of Entry.
openness. In their work, the key complementary policies for ensuring thatopenness to trade is associated with growth include infrastructure develop-ment, labor market �exibility, and low barriers to entry. Given the cur-rent levels of those variables, they conclude that �there are many countriesthat currently stand to lose from opening their markets�. Chang, Kaltaniand Loayza argue that other types of reforms are not so critical for ensur-ing growth gains from openness, including educational attainment, �nancialdepth, and good governance. DeJong and Ripoll (2006), using tari¤s asa measure of openness, also �nd that the e¤ect of openness on growth isconditional on the level of income. In particular, using cross-country datafor 1975-2000, they �nd a positive relationship between tari¤s and growthrates for the world�s poorest countries, but a negative relationship for richcountries.These three papers have several implications for trade policy. When elim-
inating both trade and other distortions simultaneously is not possible, thesepapers suggest that bene�ts depend on the existence and the degree of non-trade distortions and the feasibility of removing them. Packages tailored tothe speci�c circumstances of each country may be more appropriate than a
55

"one size �ts all" policy. Another implication is that opening up to tradeis not enough to ensure growth; in particular, key complementary reformsinclude lowering barriers to new �rm entry, encouraging more �exible labormarkets, and improving infrastructure.
4.3 What can the di¤erent e¤ects of trade volumesversus trade policy tell us about the success of IP?
Our review of recent evidence on trade policies, trade volumes, and growthsuggests that researchers face several challenges. In particular, measuringopenness to trade, identifying the direction of causality between opennessand growth, and identifying additional controls to include in cross-countryestimation are ongoing concerns. Nevertheless, our review of the studies inTable 2 suggests the following broad conclusions:
� Studies that use trade volumes as a measure of openness generally �nda positive relationship between changes in openness and growth.
� Studies that use tari¤s as a measure of openness for the post WorldWar II period generally �nd an insigni�cant e¤ect of average tari¤s ongrowth. However, the pattern of protection matters. High tari¤s onintermediates or investment goods may be negatively associated withgrowth.
Existing studies suggest that in the post World War II period, tari¤s onaverage have not been successful in generating higher growth. We con�rmthese general conclusions using a panel dataset on non-OECD countries, forthe 1960 through 2000 period. In particular, we contrast the results us-ing trade shares (X+M/GDP) as our openness measure relative to using theWorld Bank�s revenue tari¤s (tari¤ revenue divided by imports). The de-pendent variable is log income per capita. The use of a panel of annualobservations allows us to control for country-speci�c �xed e¤ects and alsofor time e¤ects. Country �xed e¤ects are one approach to controlling forcountry characteristics that vary across countries (such as institutions) thatare not perfectly measured and do not vary systematically from one year tothe next. Time e¤ects allow us to control for world-wide shocks, such as anoil price shock or a world�wide currency crisis.The top two rows in Table 5 show that openness measured using trade
shares is positively and signi�cantly associated with growth. These results
56

are consistent with the majority of the studies listed in Table 2 that use tradeshares as a measure of openness and generally �nd that changes in tradeshares are associated with higher growth. However, the bottom two rowsshow that revenue tari¤s are not signi�cantly associated with growth. Evenskeptics, such as Rodriguez (2007), generally conclude that there is a strongcorrelation between trade volumes and growth, while the association betweentrade policy�as measured by the World Bank�s revenue tari¤ measure�andgrowth is weak.The positive correlation between trade shares and growth is very strong
and remains after we add other controls. The negative correlation betweentari¤s and growth is signi�cant in some speci�cations but is not a robust�nding. What should we make of this? As we discussed in Section 3, tari¤sare imposed for many reasons. Foremost among these reasons are the need toraise revenue, political economy considerations, and infant industry concerns.Either IP via protection has increased growth, or protection on average hasbeen imposed for other reasons, leading to no net gains in output.A promising area for new research is to move beyond reduced form evi-
dence on the linkages between openness and growth so that we can identifyhow openness to trade a¤ects growth. This is particularly important froma policy perspective. If openness yields bene�ts because it allows �rms toimport new technology embodied in capital goods, the policy implicationsare quite di¤erent than if openness is bene�cial because it forces �rms tocompete internationally or leads to market share reallocation towards moree¢ cient �rms. Identifying the mechanisms leading from openness to growthis precisely the focus of new micro-based studies of �rms (see, for example,Melitz (2003) or Acemoglu, Antras, and Helpman (2007)). These theoreticaladvances have been accompanied by a growing empirical literature, to whichwe now turn.
4.4 Identifying the mechanisms for gains from trade
Much of the new research evaluates the importance of international trade forgrowth using micro models of consumer and �rm behavior. This new researchfocuses on the following mechanisms for understanding the linkages betweenopenness to trade and growth: (1) gains from consumption of increased va-riety (2) gains from importing goods that embody new technology (3) gainsfrom increasing competition (4) gains from reaping economies of scale (5)gains through reallocation of market shares to the most productive �rms and
57

(6) learning by doing through exporting. We describe these in more detailbelow.30
Gains from consumption of increased variety Quantitative models areuseful for measuring gains from trade coming from increased variety, as inRomer (1994). Romer (1994) and Feenstra (1994) showed that these gainscould be large, while Arkolakis et. al. (2008) show that Romer�s resultsare sensitive to modeling assumptions. Under heterogeneity, gains could besmall, as the new varieties that are imported after liberalization are "mar-ginal varieties," in the sense that total consumption of these goods is small.Moreover, the bene�ts from the increase in foreign varieties could be com-pensated by the losses associated with the displacement of domestic varieties.Another important paper in this literature is Broda and Weinstein (2006).Broda and Weinstein show that an important part of growth comes from theincrease in imported variety over the last decades. While this may in partresult from a country�s own trade reforms, it is also driven by diversi�cationon the part of exporting countries like China.Gains from importing goods that embody new technology Eaton and Ko-
rtum (1999) argue that tari¤s a¤ect the price of capital, and through thisthey a¤ect the capital-labor ratio in steady state. Coe and Helpman (1995),Keller (1998) and others reviewed in Keller (2004) study the role of trade asa vehicle for "international R&D spillovers." The idea is that by importingintermediate and capital goods, a country bene�ts from the R&D done in theexporting countries. This is a key feature of the model of R&D and tradein Eaton and Kortum (2001). A di¤erent notion is that trade acceleratesthe international �ow of technical know-how (see Grossman and Helpman,p. 165). Several papers have explored this empirically with mixed results(see Rhee et. al., 1984, Aitken et. al., 1997, and Clerides et. al., 1998, andBernard and Jensen, 1999).A number of theoretical papers have explored the role of intermediate
inputs in raising productivity growth (Ethier (1979,1982), Markusen (1989),Romer (1987, 1990), and Grossman and Helpman (1991)). Some recent stud-ies �nd that increasing intermediate goods inputs or lowering input tari¤s areassociated with large productivity gains. This includes Goldberg, Khandel-wal, Pavcnik, and Topalova (2008), Kasahara and Rodrigue (2008), Amiti
30A note of caution: the fact that we discover more mechanisms through which tradeleads increasing welfare does not necessarily imply that the overall gains from trade arelarger �there are likely to be important "crowding out" e¤ects. See Arkolakis, Costinotand Rodríguez-Clare (2009).
58

and Konings (2007), Halpern, Koren, and Szeidl (2006) and Broda, Green-�eld and Weinstein (2008). Goldberg, Khandelwal, Pavcnik and Topalova(2008) use Indian data to show that accounting for new imported varietieslowered the price index for intermediate goods by 4.7 percent per year rela-tive to conventional gains from lower import prices. They also �nd that lowerinput tari¤s account for a third of the new products introduced by domesticIndian �rms, suggesting potentially large gains from trade.Gains from increasing competition Levinsohn (1993), Harrison (1994),
and Muendler (2005) show that increasing competition due to lowering oftrade barriers reduced price-cost margins, using micro-level data for Turkey,Cote d�Ivoire, and Brazil. Enhanced competition may encourage �rms toengage more in innovative activity, or may simply lead to lower prices forconsumers. One important implication is that studies which measure theproductivity gains from trade reforms without allowing mark-ups to fall postreform are likely to mismeasure the productivity gains from trade, as pointedout by Harrison (1994). Harrison shows that the direction of the bias inproductivity measurement cannot be identi�ed a priori. She also shows thata simple way to address this problem is to allow measured factor shares tovary with changes in trade policy when doing production function estimation.Gains through reallocation of market shares to the most productive �rms
New heterogeneous trade models suggest that trade enhances productivity byreallocating output towards more e¢ cient �rms. In the original frameworkdeveloped by Melitz (2003), �rms are endowed with di¤erent productivitydraws, which are pre-determined and unchanging over time. When a countryopens up to international trade, only the more productive �rms remain asthe less productive �rms are forced to exit.There are a number of implications of this framework which could be
tested using �rm-level data. As we discussed earlier, these models whichemphasize reallocation of �rm shares imply a critical role for other comple-mentary policies that make it easy for �rms to expand, contract, enter, orexit the market. Another implication is that productivity gains from tradereforms should operate through market share reallocation. An early studyfor the United States by Baily, Hulten, and Campbell (1992) did not focuson trade policy per se but provided a framework for decomposing productiv-ity growth into components due to within-�rm changes versus reallocationof output. They concluded that the bulk of growth in aggregate total factorproductivity (TFP) was accounted for by the reallocation of output shares.For developing countries, this decomposition has been performed by Pavcnik
59

(2002) for Chile and by Van Biesebroeck (2003) for Colombia.Since Pavcnik�s sample begins at the end of the Chilean trade reforms, she
cannot use changes in trade policy as her openness measure. Instead, she sep-arates enterprises into import-competing, export-competing, and non-tradedsectors. She then examines whether import or export-competing �rms hadhigher productivity relative to other types of �rms. Using the Olley-Pakes(1993) approach to estimating productivity, Pavcnik �nds that import com-peting �rms improved their productivity over time, while export competing�rms did not. This suggests that in Chile there was no learning among ex-porters, but import-competing �rms did exhibit productivity growth. Pavc-nik calculates that two-thirds of productivity growth in Chile was due toreallocation of market shares towards more e¢ cient producers, and the re-maining one-third was due to improved productivity among surviving �rms.Van Biesebroeck (2003) uses a variety of methods to compute productivity
growth and �nds that for Colombia the majority of changes in productivityoccur within the same plant. Van Biesebroeck �nds that between two thirdsand three quarters of the total change comes from within plant changes. Thesecond most important e¤ect is the entry of more productive plants intothe economy. While Pavcnik (2002) �nds that two-thirds of the increasesin productivity growth are due to reallocation of market shares, Van Biese-broeck �nds the opposite: in Colombia, the bulk of aggregate increases inproductivity growth are driven by within-plant changes in productivity.One possible explanation for these di¤erent results is that entry and exit
barriers (due to restrictions on hiring and �ring) in Colombia were higherthan in Chile during this period. Barriers to entry or exit make it di¢ cultfor a reallocation of market share towards more e¢ cient producers to occur.More case studies are needed before we can reach any de�nitive conclusions.However, the limited evidence suggests that productivity growth stems fromboth (1) a reshu ing of production towards more e¢ cient producers and(2) increasing productivity within the �rm. Consequently, Melitz�s (2003)simplifying assumption that �rms receive an exogenous productivity drawwhich is unchanging over time is not consistent with actual �rm behavior.The latest heterogeneous �rm research modi�es Melitz (2003) to allow �rm-level productivity to evolve over time, instead of being �xed at the initialdistribution. Atkeson and Burstein (2006), Costantini and Melitz (2007),Lileeva and Tre�er (2007), and Ederington and McCalman (forthcoming) alldevelop models with heterogeneous �rms where productivity is allowed toevolve within the �rm. Lileeva and Tre�er (2007) allow reductions in foreign
60

tari¤s to induce lower-productivity �rms to invest in raising labor produc-tivity, engage in more product innovation, and increase their adoption ofadvanced manufacturing technology, which in turn leads to within-�rm pro-ductivity gains. Bernard, Redding and Schott (2006) have also developed amodel where �rms produce multiple goods, and trade liberalization may leadthem to focus on the goods in which they are most productive. Empiricallythis would be seen as an increase in productivity within �rms, even thoughthe mechanism is essentially the same as in Melitz (2003).Learning by doing through exporting One likely channel through which
international trade leads to productivity gains is through learning by doingfor exporters. Yet a �rst round of empirical studies suggested that therewas very little, if any, learning from exporting. Instead, these �rst gener-ation studies found that the best �rms select into exporting, leading to astrong positive correlation between productivity levels and export status.This research included case studies of Colombia (Clerides, Lach, and Tybout(1998)), Spain (Delgado, Farinas, and Ruano (2002)), Germany (Bernard andWagner (1997)),and the United States (Bernard and Jensen (1999)). Pavc-nik (2002) also found a similar result: �rms operating in export-competingsectors are the most e¢ cient in manufacturing, but these �rms do not showproductivity improvements over time.This �rst-generation evidence is drawn from primarily high and upper
middle income countries. A second wave of empirical studies casts doubton the hypothesis that there is no learning by doing for exporters. Fordeveloping countries, this includes Aw, Chung, and Roberts (2000) for Korea,Van Biesebroeck (2005) for 9 African countries, Lileeva (2004), Blalock andGertler (2004) for Indonesia, Hallward-Driemeir, Iarossi, and Sokolo¤ (2005)for East Asian countries, Fernandes and Isgut (2006), Park, Yang, Shi andJiang (2006) for China, Aw, Roberts and Winston (2007), and De Loecker(2007) for Slovenia.All of these second generation studies �nd evidence of learning through
exporting. Blalock and Gertler (2004), for example, test for whether ex-porting confers productivity gains using a panel of Indonesian manufactur-ing enterprises. They �nd strong evidence that �rms experience a jump inproductivity of 3 to 5 percent following the initiation of exporting. VanBiesebroeck (2006) examines the evidence in favor of learning by exportingin Africa and also �nds a causal link from exporting to productivity. Aw,Roberts and Xu (2009) also �nd evidence of learning by exporting in theTaiwanese electronics industry.
61

Blalock and Gertler argue that previous tests of learning by exportingwere done on industrialized or middle income developing countries. Theypoint out that �while �rms in developed and middle income countries arelikely to be as e¢ cient as those in their trading partners� countries, �rmsin the poorest countries may have much more to gain from exposure to in-ternational export markets�. Lileeva and Tre�er (2007) propose a similarexplanation for these disparate �ndings using Canadian data. They showthat lower productivity �rms are more likely to invest and learn in orderto access foreign markets, in contrast to higher productivity �rms that areable to export without additional investment. De Loecker (2007) �nds thatfor Slovenian �rms, there was evidence of a di¤erent kind of selection intoexport markets: only the most productive �rms began exporting. He thenuses nonlinear matching estimation to test whether there was learning by ex-porting during the 1994-2000 period. He �nds that while there was evidenceof selection into export markets, these same exporters increased productivityas a result of exporting. The identi�cation strategy uses both matchingtechniques and the di¤erence in productivity growth for those who beganexporting this period relative to a control group that did not. De Loeckeralso �nds that learning by exporting was higher for �rms exporting to highincome destinations.All of the identi�cation problems present in (10) for the cross-country
literature are challenges for these micro studies as well. How can we distin-guish between selection into exporting (i.e. the most productive �rms chooseto become exporters) and the impact of exporting on learning and produc-tivity? A number of studies exploit the panel nature of the data, testingwhether �rms were more productive prior to becoming exporters. This in-volves constructing an indicator for the period prior to when the �rm becomesan exporter and testing whether it is statistically signi�cant in a regressionof productivity on export status. Another approach has been to �nd an in-strument for export status. Van Biesebroeck (2005) uses as instruments forlagged export status the location of the �rm, ethnicity of the owner, foreignownership and state ownership, although the validity of these instruments isnot completely clear. Lileeva and Tre�er (2007) use US tari¤ cuts mandatedby the Canada-US Free Trade Agreement as an instrument for Canadianexport status.Despite ongoing controversies regarding the importance of learning by
doing through exporting, it is probably safe to conclude the following:
62

1. The most productive �rms are likely to become exporters.
2. While there is selection into exporting, there is also learning throughexporting.
3. Learning from exporting is most likely in technologically backwardcountries and among less productive �rms.
5 Foreign Direct Investment
Many countries encourage inward FDI because they expect that foreign �rmswill enable domestic enterprises to become technologically more advanced.This is nothing other than industrial policy, although it is rarely identi�edas such. As pointed out in our introduction, attracting foreign funds typ-ically means tilting incentives in favor of foreign investors. Hanson (2001)reviews the many incentives o¤ered to foreign �rms, which include incometax holidays, tari¤ exemptions, and subsidies for infrastructure. In 1998, 103countries o¤ered tax concessions to foreign companies that set up productionor other facilities within their borders. Some of these concessions were enor-mous: the Government of Alabama paid the equivalent of 150,000 dollars peremployee to Mercedes for locating its new plant there in 1994; the Britishgovernment provided between 30,000 and 50,000 dollars per employee to at-tract Samsung and Siemens in the late 1990s; Ireland o¤ered until recentlya corporate tax rate of 10 percent to all foreign manufacturers who chose tolocate there (Gorg and Greenaway (2003)). Until 2008, China o¤ered sig-ni�cantly lower corporate tax rates to foreign companies locating there, andcontinues to subsidize infrastructure investments for multinationals locatingin foreign enterprise zones.Most countries encourage FDI in�ows to speci�c sectors; typically these
are sectors which are technologically more advanced. Chandra and Kolavalli(2006) document that "attracting FDI has been an important strategy intechnological adaptation" in a number of cases (p. 33) Table 6 from Alfaroand Charlton (2008) identi�es the speci�c sectors targeted by 29 countriesfor the 1985-2000 period. The most targeted sectors include machinery,computers, telecommunications, and transport equipment.Alfaro and Charlton �nd that FDI in�ows are likely to be higher in tar-
getted sectors, and that FDI in these sectors generates higher growth. Theirstudy suggests support for the argument that IP with respect to FDI has
63

been successful at generating growth, possibly because governments appearto target sectors with positive externalities. Nevertheless, it is di¢ cult toeconometrically identify whether targeting has worked, since FDI may beattracted to sectors with high potential for growth.Aggregate cross-country studies on FDI and growth are reviewed in greater
detail in another chapter of this volume. Given the strong correlation be-tween FDI in�ows as a share of GDP and openness to trade reported inTables 3 and 4, identifying a separate impact of FDI from trade on countryoutcomes is likely to be challenging. All of the problems associated withthe cross-country evidence on trade and growth� measuring policies, identi-fying the direction of causality, and omitted variable bias�are present in thisliterature as well. Researchers typically use FDI �ows, rather than policiestargeted at FDI, to measure its e¤ects, since panel data on FDI policies iseven more di¢ cult to obtain than data on tari¤s. Reverse causality is alsoa problem, since extensive evidence suggests that FDI is attracted to large,less risky, and growing local markets. Nevertheless, there is generally mixedevidence on the relationship between FDI and a country�s growth (Carkovicand Levine (2002), Bosworth and Collins (1999), Borenzstein et al (1998)).Recent work on FDI and growth suggests that other complementary policiesneed to be in place to maximize the gains from inward foreign investment,reinforcing the theme introduced in Section 4 on trade. Important policiesthat need to be in place for a country to bene�t from FDI include a minimumlevel of human capital (Borenzstein et al, 1998), developed �nancial markets(Alfaro et al, 2004) and openness to trade (Balasubramanyam, Salisu, andDapsoford, 1996).There is signi�cant research interest in FDI as a vehicle through which
developing country �rms learn about new technology. While most of theempirical literature focuses on productivity e¤ects of FDI, there is also agrowing literature that examines the impact of FDI on factor markets. Wereview these two research areas below.
5.1 FDI and Productivity
To justify special treatment, foreign enterprises would need to confer sometype of positive externality which is not internalized by �rms. A typical testof whether foreign �rms transfer technology to domestic enterprises would beto estimate �rm-level productivity, and measure whether a more extensiveforeign presence increases domestic �rm productivity. As an illustration,
64

Aitken and Harrison (1999) estimate the following production function for�rm i in sector j at time t:
Yit = Constant+ �1DFI_Plantijt + �2DFI_Sectorjt+�3 (DFI_Plantijt � �2DFI_Sectorjt) + �4Zijt + �i + � t + "it
where
DFI_Sectorjt =
Pi2j DFI_Plantijt � EmploymentijtP
i2j Employmentijt
The dependent variable could be log of output, in which case the Z vectorwould control for input use, leaving foreign investment to a¤ect the resid-ual determinants of output, which is typically interpreted to be total factorproductivity (TFP) levels. Alternatively, the dependent variable Y couldbe output per worker or TFP, and the vector Z could include a number ofother controls, such as size, openness, or other determinants of productiv-ity. DFI_Plant is typically measured as the share of the plant which isforeign-owned. The coe¢ cient �1 then measures whether �rms with foreigninvestment are more productive than other plants. Most researchers �ndthat the own-plant e¤ect is large and signi�cant. In other words, �rms withforeign equity participation typically have higher output, higher output perworker, or higher levels of TFP.This is an important point which has not been emphasized enough in
the literature on FDI. While many researchers are focused on identifyingsome sort of externality or technology spillover, probably the most impor-tant contribution that foreign �rms make is the direct e¤ect captured bythe coe¢ cient �1 on DFI_Plant. Ramondo (2008) develops a model wherecountries gain access to foreign technologies through the activities of multi-nationals. In counterfactual exercises with her estimated model she �ndsthat for small countries the associated bene�ts can be quite large.Policies that promote joint venture activity are consistent with the em-
pirical results showing productivity gains from FDI that are internalized byjoint ventures. As an illustration, promoting joint ventures has been the coreof China�s policy to bene�t from inward foreign investment. Foreign investorsin key sectors (mobile phones, computers) were required to enter into jointventures with domestic �rms (Rodrik, 2006). In electronics, Huchet (1997)writes that China�s technology strategy has been clear: �allow foreign �rmsaccess to the domestic market in exchange for technology transfer through
65

joint production or joint ventures.�Wholly owned foreign �rms are a rarity inChina; most �rms are joint ventures between local (frequently state-owned)and foreign enterprises.China is a particularly interesting case to study in seeking to understand
the role played by technology transfer via FDI. Since opening its economy tothe outside world in late 1978, China has absorbed an increasing amount ofFDI and is now among the world�s largest hosts of FDI in�ows. A numberof recent papers use Chinese �rm-level data to evaluate the the own-plant ef-fect (the coe¢ cient �1 that measures whether �rms with foreign investmentare more productive than other plants). All these studies, including Huand Je¤erson (2002), Du, Harrison, and Je¤erson (2008), and Lin, Liu, andZhang (2008) �nd that joint ventures in China exhibit not only higher pro-ductivity levels than other enterprises but also higher productivity growth.Du, Harrison, and Je¤erson (2008) �nd that these e¤ects are largest for state-owned enterprises that form partnerships with foreign �rms. The impact ontheir productivity is 10 times that on privately-owned enterprises. Du, Har-rison, and Je¤erson (2008) suggest that forming joint venture partnershipsfor Chinese state-owned enterprises has provided an alternative approach toprivatization as a way of increasing public sector performance. Bartel andHarrison (2004) also �nd that public sector enterprises in Indonesia improvedperformance after forming joint ventures with foreign enterprises.Although there is a strong relationship between foreign ownership and
productivity levels, that e¤ect often cannot be separately identi�ed froma �rm �xed e¤ect. So if the equation above is estimated either in �rst-di¤erences or with �rm speci�c e¤ects, then the coe¢ cient on DFI_Plantmay not be signi�cant. What this implies is that �rms with foreign equityparticipation are at a higher level of technology, but technological change isnot always higher for these enterprises. This should not be surprising, sincemany of these �rms are already at the technology frontier.Evidence suggests that encouraging less productive state enterprises to
make alliances with foreign �rms may raise productivity. However, mostresearch has not used any sort of identi�cation strategy to tease out the di-rection of causality. One possibility is that foreign �rms acquire the mostproductive domestic enterprises, or form alliances with the most productive�rms. Arnold and Javorcik (2006) attack this problem by asking whether for-eign �rms are simply acquiring the most productive domestic enterprises (inIndonesia) or whether they cause these enterprises to become more produc-tive. Combining di¤erences-in-di¤erences estimation with nonlinear match-
66

ing techniques, they show that the acquired �rms outperformed the controlgroup in every observable dimension, including exhibiting higher productiv-ity growth, higher investment, and higher sales growth. They conclude thatforeign equity infusions do confer bene�ts to domestic enterprises, and thatthe e¤ect is not simply one of picking winners. However, more studies in thisregard would be useful.The coe¢ cient �2 on DFI_Sector measures the extent to which foreign
ownership in the sector positively a¤ects the productivity of domestic enter-prises. This e¤ect is sometimes referred to as a horizontal spillover, since itmeasures the extent to which foreign investment in the same sector a¤ectsthe productivity of domestic �rms. Early studies, such as Blomstrom andWol¤ (1994) for Mexico, typically estimated a pure cross-section or failed toinclude �rm or industry-speci�c e¤ects. Consequently, the coe¢ cient �2 wasalways positive and frequently signi�cant, indicating the presence of positivehorizontal spillovers. Aitken and Harrison (1999) showed that this positivecoe¢ cient for Venezuelan manufacturing enterprises was spurious, indicatingthat foreign �rms were attracted to highly productive sectors. When theyinclude �rm or sector e¤ects, the coe¢ cient on DFI_Sector switched frompositive to negative. Aitken and Harrison interpreted the negative coe¢ -cient as indicative of market-stealing: foreign �rms grab market share fromdomestic �rms, driving them up their cost curves in sectors with economiesof scale.Other recent studies measuring the extent of horizontal spillovers are
listed in Table 7. In contrast to earlier studies which generally found sup-port for positive (horizontal) spillovers, more recent studies that have at-tempted to reproduce Aitken and Harrison (1999) for other countries havetypically found insigni�cant or negative horizontal externalities. This in-cludes Djankov and Hoekman (2000) for the Czech Republic, Smarzynska(2002) for Lithuania, Lopez-Cordova (2003) for Mexico, Damijan et al (2001)for eight transition economies, Kathuria (2000) for India, Hu and Je¤erson(2002) and others. Most studies published since 1999 has found negative orinsigni�cant horizontal externalities.31
One explanation for the lack of positive horizontal spillovers is that for-eign �rms have no incentives to transfer knowledge or technology to competi-
31One interesting exeption in Poole (2008), who uses a matched establishment-workerdatabase from Brazil to present evidence consistent with the existence of positive multi-national spillovers through worker mobility in Brazil.
67

tors within the same industry. They should, however, have an incentive tohelp the productivity of their suppliers, by transferring knowledge to them(see Kugler (2001)). More recent work has sought to identify what is now re-ferred to as vertical spillovers, which are positive externalities stemming fromthe relationships of foreign enterprises with domestic suppliers or customers.Forward spillovers could occur if foreign �rms that locate domestically sup-ply inputs that embody new technologies or processes. Backward spilloverscould occur if domestic suppliers to downstream foreign �rms bene�t fromcontacts with the �rms to increase productivity. Smarzynska (2004) de�neshorizontal, forward, and backward FDI spillovers as follows:
HorizontalFDIjt =
Pi2j DFI_Plantijt �OUTPUTijtP
i2j OUTPUTijt
and
ForwardFDIjt =Xm6=j
�jm
Pi2mDFI_Plantijt � (Yijt �Xijt)P
i2m(Yijt �Xijt)
where �jm is the share of inputs purchased by industry j from industry m intotal inputs sourced by sector j. Finally, if �jkt is the proportion of sectorj�s output that is supplied to sector k (taken from the input-output matrix),then backward FDI spillovers are de�ned as:
BackwardFDIjt =Xk 6=j
�jk �HorizontalFDIkt
Smarzynska �nds a zero or negative impact from forward linkages, anda positive impact of backward linkages, indicating that technological gainsfrom FDI are primarily concentrated among domestic suppliers interactingwith downstream foreign �rms. Recent studies on other countries (Table7) also �nd these positive backward FDI spillovers, including Blalock andGertler (2003) for Indonesia, Liu for China (2005), Gorodnichenko, Svejnar,and Terrell (2006) for 15 transition economies, and Lopez-Cordova (2003) forMexico. The evidence in favor of backward spillovers may be one factor thatcould explain China�s emphasis on the use of domestic content requirements.Sutton (2004) describes the use of domestic content requirements in bothIndia and China as follows:
68

"From the early �90s onwards, a wave of multinational �rmsentered both markets. In both countries, these entrants wererequired to achieve a high level of domestic content within a spec-i�ed period (typically, 70 percent within 3 years). For at leastsome of the new entrants, this was seen as an unreasonable tar-get, as domestic suppliers could not meet the price and qualityrequirements of the car makers. Achieving the 70 percent tar-get required the car makers to switch rapidly from a reliance onimported components to sourcing from local vendors; and this inturn gave the car makers a strong incentive to work closely with(�rst-tier) suppliers, to ensure that quality standards were met,within an acceptable price."
These requirements illustrate how IP has been actively used to shapeChina and India�s auto sector through the use of domestic content require-ments. Even if there are backward spillovers, however, these spillovers couldbe captured by subsidizing domestic input purchases by foreign �rms insteadof imposing them through domestic content requirements. Domestic contentrequirements could deter some investments that would have created back-ward spillovers, and may lead to ine¢ cient outcomes by protecting domesticsuppliers from import competition.A related approach is to think of the bene�ts of FDI through their im-
pact on the variety of non-tradable inputs available in the host country.Rodríguez-Clare (1996) presents a model to explore this idea. Under full em-ployment, multinationals expand at the expense of domestic �rms, so whatmatters is the demand for domestic inputs per unit of labor hired, a term thatRodríguez-Clare labels the linkage coe¢ cient.32 If multinationals�linkage co-e¢ cient is higher than that of domestic �rms, the multinationals�backwardlinkage e¤ect is positive and FDI would lead to an increase in input varietyand host-country productivity.33
Using �rm-level data for several Latin American countries, Alfaro andRodríguez-Clare (2004) show that although multinationals source a lowershare of their inputs domestically than domestic �rms, they nevertheless tend
32This is in contrast to most of the literature on multinationals and linkages, whichfocused instead on the share of inputs that multinationals source domestically.33The positive productivity e¤ect relies on the presence of love of variety for inputs, as
in Ethier (1982) and Romer (1990).
69

to have a higher linkage coe¢ cient thanks to the fact that they use moreroundabout production methods, requiring more inputs per unit of labor.Still, to date there is only anecdotal evidence that multinationals indeed leadto an increase in the variety of inputs available in the host country. Moreover,one concern is that if multinationals generate positive backward linkages thenthis should bene�t domestic �rms that use similar inputs as multinationals.One would then expect to see positive horizontal externalities, but this isgenerally not what the literature �nds (at least in LDCs).To summarize, the evidence seems to consistently indicate that:
1. Firms that receive FDI (joint ventures) or are acquired by multination-als generally exhibit higher productivity levels.
2. There is evidence of positive vertical spillovers from foreign buyers todomestic suppliers (backward linkages) and from foreign suppliers todomestic buyers (forward linkages).
3. There are generally insigni�cant horizontal spillovers to �rms withinthe same industry.
Anecdotal evidence and new research (Chandra and Kolavalli (2006), Al-faro and Charlton (2008)) suggests that FDI has been particularly importantin cases where governments were actively engaged in strategies of technologi-cal upgrading in certain sectors, and brought in foreign companies as part ofthose strategies. Typically, these e¤orts were part of a set of complementarypolicies that included increasing the supply of skilled workes in a targettedindustry, improving regulation and infrastructure, promoting new activitiesand innovation, and increasing exports. In many of those cases, the govern-ment probably encouraged joint ventures, but the direction of causality isnot so clear.Given these results, do the bene�ts of �scal incentives for foreign enter-
prises outweigh the costs? If the primary reason for giving these incentivesis to encourage technology transfer, then the answer is likely to be no: ifforeign �rms are the only ones that use the inputs that bene�t from back-ward spillovers and there are no horizontal spillovers, then FDI will occurwithout subsidies. Yet there is clearly a further need to understand themechanism through which foreign �rms generate vertical spillovers. Even ifvertical spillovers do exist, Pack and Saggi (2006) argue that "the magnitudeof some of the incentives being used seems di¢ cult to justify�. (p. 281).
70

They also point out that �investment incentives and tax breaks to multi-national investors work against their local competitors. Thus, if there arelocal �rms that could potentially compete with multinationals, the adversee¤ect on such �rms of tax incentives to multinationals needs to be taken intoaccount. The e¢ cacy of investment incentives is also unclear� such policiescould easily end up transferring rents to foreign investors without a¤ectingtheir investment decisions.�(Pack and Saggi (2006), p. 281)
5.2 FDI and host country factor markets
One robust result in the literature on foreign ownership and productivityis that �rms with foreign equity have higher productivity levels. Foreign�rms are also typically more capital intensive, and spend more on workertraining. As long as �rms do not face a perfectly �at labor supply schedule,it is likely that these di¤erent �rm characteristics will translate into higherwages. There could also be other imperfections in the labor market, such assearch costs for �rms seeking skilled workers, or e¢ ciency wage setting, thatcould result in foreign �rms paying higher wages. To the extent that there isworker mobility or productivity spillovers, these wage e¤ects for workers atforeign enterprises could also spill over to other workers.Almost all studies �nd that workers in foreign �rms are paid higher wages,
which may re�ect the fact that foreign �rms or joint ventures have higherproductivity levels. In perfect markets more productive �rms would not payhigher wages, but market imperfections (such as search costs or informationalasymmetries) could generate such a link. Evidence showing higher wages paidby multinationals includes Aitken, Harrison and Lipsey (1996) for Mexicoand Venezuela, Lipsey and Sjoholm (2004) for Indonesia using a pure cross-section, Harrison and Scorse (2004) for Indonesia using a panel, Velde andMorrisey (2003) for a set of African economies, Martins and Esteves (2007) forBrazil, and Earle and Telegdy (2007) for Hungary. Studies of industrializedcountries also �nd large wage gaps between domestic and foreign enterprisewages when researchers do not condition for worker or �rm characteristics.This includes Almeida (2003) for Portugal, Girma, Greenaway and Wakelin(2001) and Dri¢ eld and Girma (2003) for the United Kingdom, and Felicianoand Lipsey (1999) for the United States. The unconditional wage gap, whichis the gap in wages paid by foreign versus domestically owned enterpriseswithout controlling for worker or �rm characteristics, is typically large. It isfrequently as high as 40 percent (for Hungary) or 50 percent (for Brazil).
71

When researchers control for worker and �rm characteristics, then thewage premium paid by foreign �rms declines dramatically, to around 10 per-cent. Earle and Telegdy (2007) �nd that the wage gap between workersemployed at foreign and domestic enterprises is not much a¤ected by condi-tioning on worker characteristics, but that controlling for industry reducesthe premia to 34 percent, and controlling for �rm size further reduces it to 28percent. (Robert Lipsey has questioned whether it makes sense to control forcharacteristics such as �rm size: if foreign �rms are larger and consequentlypay higher wages than domestically owned enterprises, workers are neverthe-less better o¤.) When Earle and Telegdy control for unobserved �xed e¤ectsby exploiting changes in �rm ownership to identify its e¤ect on wages, thepremium is further reduced to 7 percent. Harrison and Scorse (2004) also�nd that the premium falls to between 5 and 10 percent when worker and�rm characteristics are controlled for. Ibarraran, using data for Mexicanmacquilas in 1992 and 1999, �nds no premium in 1992 but a small premiumin 1999.Martins and Esteves (2007) use matched worker and �rm panel data for
1995 through 1999 to analyze the impact of foreign ownership on wags inBrazil. Like Earle and Telegdy (2007) they use changes in �rm ownership asa way to control for unobserved �rm-speci�c e¤ects that could be correlatedwith wage premia. They also follow workers who move to or leave foreignenterprises, to control for unobserved worker-speci�c e¤ects. They �nd thatworkers moving from foreign to domestic �rms typically take wage cuts whenthey move, while movers form domestic to foreign �rms increase their pay.However, compared to the unconditional wage gaps of 50 percent, the wagepremium associated with working for a foreign �rm falls to between 3 and 7percent once worker and �rm characteristics are controlled for. The authorsconclude that their results support a positive impact of foreign �rms onBrazilian wages.To summarize, the evidence suggests that foreign �rms pay a small wage
premium of between 5 and 10 percent. While the earlier literature foundlarger wage premia of more like twenty percent, these earlier estimates failedto adequately control for individual characteristics of workers, such as edu-cation and experience. Consequently, part of the wage gap stems from thefact that foreign �rms tend to hire better educated and more skilled work-ers. Nevertheless, we can safely conclude that foreign enterprises do not payworkers below what their domestic counterparts would pay. In fact, mostof the evidence suggests that foreign �rms tend to pay higher wages than
72

comparable domestic �rms. There is also evidence that foreign �rms aremore susceptible to pressure from labor groups, leading them to be exhibitgreater compliance with minimum wages and labor standards. Harrison andScorse (2008) �nd that foreign �rms in Indonesia were much more likelythan domestic enterprises to raise wages and adhere to minimum wages as aconsequence of the anti-sweatshop campaigns there. They also �nd that theemployment costs of the anti-sweatshop campaigns were minimal, as garmentand footwear subcontractors were able to reduce pro�ts to pay the additionalwage costs without reducing the number of workers.While most of the emphasis on the role of FDI in local factor markets
is on the relationship between FDI and host country wages, there is also anemerging literature on FDI�s e¤ect on local capital markets. One reasonpolicy makers give for promoting foreign investment in developing countriesis the scarcity of capital for new investment. This argument is based on theassumption that incoming foreign investors provide additional capital whenthey set up new enterprises in local markets. However, as exchange ratevolatility has continued to rise many foreign investors have found ways tohedge by borrowing on local capital markets. This increase in local �nancingfor incoming foreign investors may lead to crowding out of domestic �rms.Harrison and McMillan (2003) and Love, Harrison, and McMillan (2004)
test whether or not borrowing by local multinationals is crowding out do-mestic enterprises. The framework in both papers uses an Euler equationapproach combined with Generalized Method of Moment estimation. WhileHarrison and McMillan (2003) is a country case study which analyzes thebehavior of mostly French multinationals operating in Cote d�Ivoire, Love,Harrison and McMillan (2004) use company level data across a panel ofcountries. The results suggest that in a country such as the Cote d�Ivoire,which was riddled with market imperfections and where access to credit wasrationed due to interest rate ceilings, foreign investors did indeed crowd do-mestic enterprises out of local credit markets. However, Love, Harrison, andMcMillan (2004) found that foreign investors tended to �crowd in�domes-tic enterprises� i.e., as foreign investment increased, the amount of creditavailable to domestically-owned �rms actually rose. The contrasting resultsagain point to the important role of policy complementarities: in a countrywith credit market imperfections such as the Cote d�Ivoire, FDI exacerbatedthese problems. These studies using micro-data are consistent with macro-level evidence on the importance of complementarities with �nancial marketdevelopment for ensuring productivity gains from FDI (Alfaro et al, 2004).
73

6 Concluding Remarks
Given the varied experiences across countries and time periods, the di¤er-ent interpretations possible, and the di¢ culties in conducting clean empiricalanalyses, it is not easy to synthesize the literature on industrial, trade, andFDI policy in development. Our survey of the theory and the evidence nev-ertheless suggests some tentative conclusions.There are instances where infant-industry protection led to higher growth
�particularly in the late nineteenth and early twentieth centuries� but ourreview suggests that the conditions needed for infant-industry protection toproduce higher growth in developing countries are not often satis�ed. Theframework in Section 2 shows that the theoretical justi�cation for interven-tion requires at a minimum either industry-level rents or a latent comparativeadvantage, as well as large Marshallian externalities from production. Thesenecessary conditions are not easy to identify for policy makers ex ante. Nor isthere evidence suggesting that developing countries have generally protectedsectors with latent comparative advantage andMarshallian externalities. Thetypes of sectors where there are important Marshallian externalities may notbe those where developing countries have a latent comparative advantage(i.e., sectors that are intensive in knowledge and human capital). It is alsolikely that protection has been used as a tool to protect sunset industries in-stead of sunrise industries; hence, there is an inherent bias against promotingsectors with a latent comparative advantage.For infant-industry protection to improve welfare it must pass both the
Mill and Bastable tests. The Mill test requires that the protected sector caneventually survive international competition without protection, whereas theBastable test requires that the discounted future bene�ts compensate thepresent costs of protection. This means that the dynamic forces which in-crease industry productivity must operate quickly. In practice, most researchassessing the success of IP has ignored these tests. Even if studies could showthat protected sectors grew faster, this would not be su¢ cient evidence toclaim that IP is justi�ed from a welfare standpoint. There are other prob-lems as well. In all the models presented in this review, protection is neverthe �rst-best policy. In addition, the infant-industry framework typicallyassumes that the mere expansion of a sector will generate all sorts of posi-tive e¤ects that will increase industry-wide productivity. But this may nothappen, and the economy may simply end up with a larger version of theine¢ cient sector it began with. We discussed an alternative set of policies
74

aimed directly at eliciting the investments that will increase productivity.Such investments may not occur without public intervention because of co-ordination failures.The hundreds of studies on trade policies, trade shares, productivity, and
growth show a strong correlation between increasing trade shares and countryperformance, and no signi�cant correlation between tari¤s on �nal goods andcountry outcomes. The only exception is for intermediate or capital goods,where a higher tari¤ is associated with lower growth. Putting aside theserious problems of reverse causality identi�ed in our review, we interpretthis evidence as suggesting that trade and FDI policies have generated thegreatest welfare gains when they are associated with increasing exposure totrade. One implication is that interventions that increase exposure to trade(such as export promotion) are likely to lead to higher welfare gainsthan othertypes of interventions (such as tari¤s or domestic content requirements).New evidence suggests that IP through FDI promotion may lead to higher
welfare gains than intervention in trade, in part because FDI-promotion poli-cies focus on new activities rather than on protecting (possibly unsuccess-ful) incumbents. Still, as Chandra and Kolavalli (2006) have concluded intheir overview of 10 cases of successful technology upgrading, �without host-country policies to develop local capabilities, MNC-led exports are likelyto remain technologically stagnant, leaving developing countries unable toprogress beyond the assembly of imported components� (p. 19). Chandraand Kolavalli go on to state that �the role of government was most e¤ectivewhen its support for speci�c industries was embedded in institutions andpolicies that were internally consistent, had an explicit purpose, and wereblessed with political commitment� (p. 39). Rodrik refers to this charac-teristic as �embeddedness.�Chandra and Kolavalli conclude that �in everycase, getting it right depended upon the degree of synchronization betweeninstitutions and government policies to motivate learning among exporters.The hallmark of these policies was industry speci�city, which o¤ers someuseful lessons for other developing countries�(p. 41).34
34Harrison and Rodríguez-Clare (2009) expands on the current paper and discusses someof the policy implications of these �ndings.
75

AppendixWe �rst show how size vm matters for wages. We assume that x1 = x2 =
x. Also, to simplify, we assume that Tj = Lj = 1 all j. In this case
�m �Xj
x�jmw��j (11)
We also have x11 = x22 = x, while v1 > v2 and xj1 = xj2 = zj for anyj = 3; :::N . Then it is clear that �1 > �2 () w1 < w2. Assuming tosimplify notation that Y = 1 then
w1+�j =Xm
xjm�vm=�m (12)
Thus,w1+�1 =
Xm=3
vm�m
+v1�1x� +
v2�2
andw1+�2 =
Xm=3
vm�m
+v1�1+v2�2x�
In equilibrium �1 and �2 solve the following system of equations
�1 = x�
Xm=3
vm�m
+v1�1x� +
v2�2
!��=1+�+
Xm=3
vm�m
+v1�1+v2�2x�
!��=1+�+ A
�2 =
Xm=3
vm�m
+v1�1x� +
v2�2
!��=1+�+ x�
Xm=3
vm�m
+v1�1+v2�2x�
!��=1+�+ A
where A =P
j=3 z�jw
��j . If v1 = v2 then the solution of the system entails
�1 = �2. Also, if �1 = �2 then necessarily v1 = v2. Now we show thatwhen v1 > v2 the solution of the system is such that �1 < �2: We consider(�1 � �2)0v1 at the point v1 = v2 and �1 = �2. At the point v1 = v2 and�1 = �2 we have
(�1 � �2)0v1 =��1 + �
Xm=3
vm�m
+v1�1x� +
v1�1
!��=(1+�)�11
�1
�x2� + 1� 2x�
�< 0
This establishes that a small increase in v1 implies that �1 < �2. Nowsuppose there exist v1 > v2 such that �1 > �2. Due to continuity there
76

would exist v1 > v2 such that �1 = �2. But this contradicts v1 = v2 ()�1 ��2 = 0. Thus, the solution of the system above implies that if v1 > v2,then �1 < �2: Thus, we have that �1 < �2 in equilibrium, and this impliesw1 > w2.Now consider two countries such that country 1 has HP in the �rst indus-
try and country 2 has HP in the second industry. We assume that v1 = v2 = vand (as above) that xj1 = xj2 = zj for any j = 3; ::; N . We will showthat x1 > x2 implies w1 > w2. From 12 we see that w1 > w2 is equiv-alent to
�x�1 � 1
��2 >
�x�2 � 1
��1. Obviously, x1 = x2 () �1 = �2.
We can write �1 = f(x1; x2) and �2 = g(x1; x2). Moreover, f(x1; x2) =g(x2; x1):This implies that
�x�1 � 1
��2 �
�x�2 � 1
��1 =
�x�1 � 1
�g(x1; x2) ��
x�2 � 1�f(x1; x2) = 0 if and only if x1 = x2: We have that
�x�1 � 1
��2 ��
x�2 � 1��1 is equal to
NXj=3
z�jw��=1+�j
�x�1 � x�2
�+�x�1 � 1
� Xj=1;2
x�j2w��=1+�j �
�x�2 � 1
� Xj=1;2
x�j1w��=1+�j
Notice thatPN
j=3 z�jw
��=1+�j
�x�1 � x�2
�> 0, as x1 > x2: Consider then
A ��x�1 � 1
� Xj=1;2
x�j2w��=1+�j �
�x�2 � 1
� Xj=1;2
x�j1w��=1+�j
Using x�11 = x1, x�21 = 1, x
�12 = 1, x
�22 = x2, and 12, and simplifying, we get
A =
Xm=3::N
vm�m
+vx�1�1
+v
�2
!��=1+� �2x�1 � 1� x�1x�2
�� Xm=3::N
vm�m
+vx�2�2
+v
�1
!��=1+� ��x�2x�1 � 1 + 2x�2
�Di¤erentiating A w.r.t. x1 and evaluating at x1 = x2 = x and �1 = �2 = �yields
A0x1 =
Xm=3::N
vm�m
+vx�1�1
+v
�2
!��=1+��x��11
0@2� x� + x� � �1+�
�2x� � 1� x2�
�v�x��1
�1Pm=3::N
vm�m+
vx�1�1+ v
�2
1A=
Xm=3::N
vm�m
+vx�1�1
+v
�2
!��=1+��x��11
0@2 + �1+�
��2x� + 1 + x2�
�v�x��1
�1Pm=3::N
vm�m+
vx�1�1+ v
�2
1A > 0
77

This implies that if x1 > x2, then A > 0 and, thereby, x�1�1�1
>x�2�1�2: This
implies that w1 > w2:Now consider two industries with the same size. The only di¤erence is the
number of countries that have HP of size x in these two industries. Assumethat a set Ji of countries have HP in industry i = 1; 2, with J2 � J1. Wehave
�1 = x�w��1 + w��2 + x�Xj2J2
w��j + x�X
j2J1=J2
w��j +Xj 62J1
w��j
= x�
x�v
�1+v
�2+Xm�3
vm�m
!��=(1+�)+
v
�1+x�v
�2+Xm�3
vm�m
!��=(1+�)+x�
Xj2J2
w��j + x�X
j2J1=J2
w��j +Xj 62J1
w��j
and
�2 = w��1 + x�w��2 + x�Xj2J2
w��j +X
j2J1=J2
w��j +Xj 62J1
w��j
=
x�v
�1+v
�2+Xm�3
vm�m
!��=(1+�)+ x�
v
�1+x�v
�2+Xm�3
vm�m
!��=(1+�)+x�
Xj2J2
w��j +X
j2J1=J2
w��j +Xj 62J1
w��j
If J2=J1 = ; (which implies that J1 = J2) then �1 = �2. As J2=J1 becomesnon-empty, then �1 > �2. But recall that since x1 = x2 = x and v1 = v2 = vthen
w1 =
Xm
x�v
�1+v
�2+Xm�3
vm�m
!1=1+�and
w2 =
Xm
v
�1+x�v
�2+Xm�3
vm�m
!1=1+�This implies that w2 > w1.
78

ReferencesAbdulnasser, HI., 2002: Export Performance and Economic Growth Nexus
in Japan: A Bootstrap Approach, Japan and the World Economy, Vol. 14,No. 1, pp. 25-33.Abhayarathe, ASP., 1996: Foreign Trade and Economic Growth: Evi-
dence from Srilanka, Applied Economic Letters, Vol. 13, pp. 567-570.Afxentiou, PC. and A. Serletis, 1989: Long Term Trends in Canadian
Economic Development , Economic Notes, Vol. 3, pp. 362-375.Afxentiou, P. C. 1991. A time-series analysis of the relationship between
government expenditure and gdp in canada. Public Finance Review 19, (3):316.Afxentiou, P. C. and A. Serletis. 1991. Exports and GNP causality in
the industrial countries: 1950-1985. Kyklos 44, (2): 167.Agosín, M. and C. Bravo-Ortega, 2007: The Emergence of New Success-
ful Export Activities in Latin America: The Case of Chile, Department ofEconomics, Universidad de Chile.Ahmad, J and ACC. Kwan, 1991, Causality Between Exports and Eco-
nomic Growth: Empirical Evidence from Africa, Economics Letters, Vol. 37,pp. 397-416.Ahmad, J and S. Harnhirun and J. Yang, 1997, Exports and Economic
Growth in the ASEAN Countries, International Review of Economics andBusiness, Vol. 44, pp. 419-430.Ahmad, J and S. Harnhirun, 1995: Unit Roots and Cointegration in
Estimating Causality Between Exports and Economic Growth: EmpiricalEvidence from the ASEAN Countries, Economics Letters, Vol. 49, pp. 329-334.Aitken, B., A. Harrison and R.E. Lipsey. 1996. Wages and foreign own-
ership A comparative study of mexico, venezuela, and the united states.Journal of International Economics 40, (3-4) (5): 345-71.Aitken, B., G.H. Hanson and A.E. Harrison. 1997. Spillovers, foreign
investment, and export behavior. Journal of International Economics 43,(1-2) (8): 103-32.Aitken, Brian J., and Ann E. Harrison, 1999: Do Domestic Firms Ben-
e�t from Direct Foreign Investment? Evidence from Venezuela, AmericanEconomic Review, Vol. 89, pp. 605-618.Alam, MS. 1991, Trade Orientation and Macro Economic Preformance in
LDCs: An Empirical Studies, Economic Development and Cultural Change,
79

Vol. 39, pp. 839-848.Alcala, F. and Ciccone, A., 2001: Trade and Productivity, Quarterly
Journal of Economics, Vol. 119, No. 2, pp. 613-46.Alcalá, F. and A. Ciccone. 2004. Trade and productivity. Quarterly
Journal of Economics 119, (2) (05/01):613-46.Alege, SP. 1993, Export and Growth in the Nigerian Economy: Causality
Test, Indian Journal of Economics, Vol. 73, pp. 397-416.Alfaro, Laura and Andrés Rodríguez-Clare, Multinationals and Linkages:
an Empirical Investigation, Economia (Journal of LACEA), Spring 2004 (Vol-ume 4, Number 2)Al-Marhubi, F., 2000, Export Diversi�cation and Growth: An Empirical
Investigation, Applied Economics Letters, Vol. 7, pp. 559-562.Almeida, Rita. May 6, 2004. The labor market e¤ects of foreign-owned
�rms. World Bank Policy Research Working Paper no. 3300.Altenburg, T. and J. Meyer-Stamer (1999): How to Promote Clusters.
Policy Experiences from Latin America, World Development, Vol. 27, No.9.Alvarez, F. and R. Lucas (2005), General Equilibrium Analysis of the
Eaton-Kortum Model of International Trade, NBER Working Paper No.11764.Al-Yousif, YK., 1997: Exports and Economic Growth: Some Empirical
Evidence from the Arab Golf Countries, Applied Economics Letters, Vol. 29,pp. 263-267.Amirkhalkhali, S. and A. Dar.,1995: A Varing Coe¢ cients Model of Ex-
port Expansion Factor Accumulation and Economic Growth: The Case ofColumbia, Review of Development Economics, pp. 208-280.Amiti, Mary and Konings, Jozef. 2005. Trade liberalization, intermediate
inputs, and productivity: Evidence from indonesia. IMF Working Paper(July): 1-35.Amoateng, K.A. and Amosko-Adu, B., 1996: Economic Growth, Export
and External Debt Causality: The Case of African Countries, Applied Eco-nomics, Vol. 28, pp. 21-27.Amsden, A. H., 1989: Asia�s Next Giant: South Korea and Late Indus-
trialization, Oxford University Press.An, G. and MF. Lyingun, 2004: The Export Skill Content, Learning By
Exporting and Economic Growth, Economic Letters, Vol. 84, No. 1, pp.29-34.
80

Anderson, Kym. August 1996. Social policy dimensions of economicintegration: Environmental and labour standards. NBER Working Paperno. W5702.Andrew Atkeson & Ariel Burstein. 2007. Pricing-to-market, trade costs,
and international relative prices. Working Paper Series 2007-26, FederalReserve Bank of San Francisco.Anoruo, E. and Y. Ahmad, 1999-2000: Openness and Economic Growth:
Evidence From Selected Asian Countries, Indian Economic Journal, Vol. 47,No. 3, pp. 110-116.Antras, P. and E. Helpman. (January 2007). Contractual frictions and
global sourcing. CEPR Discussion Paper no. 6033.Anwer, MS. and RK. Sampath, 2000: Exports and Economic Growth,
Indian Economic Journal, Vol. 47, No. 3, pp. 79-88.Arkolakis, C., A. Costinot and A. Rodríguez-Clare, 2009: New Trade
Theories, Same Welfare Gains? Manuscript, Pennsylvania State University.Arkolakis, C., S. Demidova, P. Klenow, and A. Rodríguez-Clare, 2008:
Endogenous Variety and the Gains from Trade, American Economic ReviewPapers and Proceedings.Arnold, J. M., Javorcik, B.S. and Mattoo, A. September 21, 2006. Does
services liberalization bene�t manufacturing �rms? evidence from the czechrepublic. CEPR Discussion Paper no. 5902.Atesoglu. HS., 1994: An Application of A Kaldorian Export-Led Model
of Growth to the United States, Applied Economics, Vol. 26, pp. 479-83.Atkeson, Andrew and Ariel Burstein. May 2007. Pricing-to-market in
a ricardian model for international trade. American Economics Review 97,(2): 362-367.� � � . 2007. Innovation, �rm dynamics, and international trade. NBER
Working Papers 13326, National Bureau of Economic Research, Inc.� � � . 2007. Pricing-to-market, trade costs, and international relative
prices. Working Paper Series 2007-26, Federal Reserve Bank of San Francisco.Aw, B.Y., M.J. Roberts, and T. Winston. 2007. Export market partic-
ipation, investments in R D and worker training, and the evolution of �rmproductivity. The World Economy 30, (1): 83-.Aw, B.Y., S., Chung, and M. J. Roberts. 2000. Productivity and turnover
in the export market: Micro-level evidence from the republic of korea andtaiwan (china). The World Bank Economic Review 14, (1): 65.Aw, B.Y., M. Roberts and D. Xu, 2009, R&D Investment, Exporting,
and Productivity Dynamics, Pennsylvania State University.
81

Awokuse, TO., 2005a: Exports, Economic Growth and Causality in Ko-rea, Applied Economic Letters, Vol. 12, No. 11, pp. 693-696.Awokuse, TO., 2005b: Export-Led Growth and The Japaness Economy:
Evidence From VAR and Directed Acyclic Graphs, Applied Economic Let-ters, Vol. 12, No. 14, pp. 849-858.Bagwell, K., and R. W. Staiger. 1998. Will preferential agreements un-
dermine the multilateral trading system? The Economic Journal 108, (449):1162.Bailey, M.N., C. Hulten, D. Campbell. 1992. The distribution of produc-
tivity. Brookings Papers on Economic Activity 1: 187.Balaguer, J. and M. Cantavella-Jorda 2004: Structural Change in Ex-
ports and Economic Growth: Cointegration and Causality Analysis for Spain(1961-2000), Applied Economics, Vol. 36, No. 5, pp. 473-477.Balassa, B., 1985: Exports, Policy Choices, and Economic Growth in
Developing Countries After the 1973 Oil Shock, Journal of DevelopmentEconomics, vol 18, pp. 23-35.Balasubramanyam, V.N., M. Salisu, M and D. Sapsford. January 1996.
Foreign direct investment and growth in EP and IS countries. EconomicJournal, Royal Economic Society 106 (434): 92-105.Baldwin, R. E., 1969: The Case Against Infant Industry Protection, Jour-
nal of Political Economy 77 (May/June): 295-305.Baldwin, R. and P. R. Krugman. September 1986. PERSISTENTTRADE
EFFECTS OF LARGE EXCHANGE RATE SHOCKS. NBER Working Pa-per Series 2017�NATIONAL BUREAU OF ECONOMIC RESEARCH.Baldwin, R. and P. Krugman. November 1989. Persistent trade e¤ects
of large exchange rate shocks. The Quarterly Journal of Economic 104 (4):635-654.Bardhan, P. 1970. Economic growth, development, and foreign trade: A
study in pure theory. Wiley Interscience (New York).Bardhan, Pranab, 1971. On Optimum Subsidy to a Learning Industry:
An Aspect of the Theory of Infant-Industry Protection. International Eco-nomic Review 12: 54-70.Barrios, Salvador and Eric Strobl, 2002: Foreign Direct Investment and
Productivity Spillovers: Evidence from the Spanish Experience, WeltwirtschaftlichesArchiv, Vol. 138, pp. 459-481.Bartel, A.P., and A. E. Harrison. January 2000. Ownership versus envi-
ronment: Disentangling the sources of public sector ine¢ ciency. World BankPolicy Research Working Paper no. 2272.
82

Bartel, A.P., and A.E. Harrison. 2005. Ownership versus environment:Disentangling the sources of public-sector ine¢ ciency. Review of Economicsand Statistics 87, (1) (02/01): 135-47.Beason, R. and D. E. Weinstein, 1996: Growth, Economies of Scale, and
Targeting in Japan (1955-1990) The Review of Economics and Statistics, Vol.78, No. 2. (May), pp. 286-295.Begum, S. and AFM. Shamsuddin, 1998: Exports and Economic Growth
In Bangladesh, Journal of Development Studies, Vol. 35, No. 1, pp. 89-114.Berg, H., 1997: The Relationship Between International Trade and Eco-
nomic Growth In Mexico, The North American Journal of Economics andFinance, Vol. 8, No. 1, pp. 1-21.Bernard, A.B. and J. Wagner. 1997. Exports and success in german
manufacturing. Weltwirtschaftliches Archiv 133, (1): 134.Bernard, A.B. and J.B Jensen. 1999. Exceptional exporter performance:
Cause, e¤ect, or both? Journal of International Economics 47, (1) (2/1):1-25.Bernard, Andrew B., Stephen J. Redding & Peter K. Schott, 2006. Multi-
Product Firms and Trade Liberalization, NBER Working Papers 12782, Na-tional Bureau of Economic Research.Bhagwati, J. and V.K. Ramaswami. 1963. Domestic distortions, tari¤s
and the theory of optimum subsidy. The Journal of Political Economy 71,(1): 44.Biesebroeck, J Van., 2003, Revisiting Some Productivity Debates, NBER
Working Papers, No. W10065.Biesebroeck, V., 2005: Exporting Raises Productivity In Sub-Saharan
African Manufacturing Firms, Journal of International Economics, Vol. 67,No. 2, pp. 373-391.Bigsten, A. et al, 2004: Do African Manufacturing Firms Learn from
Exporting? The Journal of Development Studies, Vol. 40, No.3, pp.115�141.Biswal, B. and U. Dhawan, 1998: Export-Led Growth Hypothesis: Coin-
tegration and Causality Analysis for Taiwan, Applied Economics Letters,Vol. 5, pp. 699-701.Blalock, Garrick and Paul Gertler, 2003: Technology from Foreign Direct
Investment and Welfare Gains through the Supply Chain, mimeo, CornelUniversity.Blalock, G. and P.J. Gertler. 2004. Learning from exporting revisited
in a less developed setting. Journal of Development Economics 75, (2) (12):
83

397-416.Blomstrom, Magnus and Hakan Persson, 1983: Foreign Investment and
Spillovers E¢ ciency in An Underdeveloped Economy: Evidence from theMexican Manufacturing Industry, World Development, Vol. 11, pp. 493-501.Blomström, M. 1986. Multinationals and market structure in mexico.
World Development 14, (4) (4): 523-30.Blomstrom, M. and E. N. Wol¤. 1994. Multinational corporations and
productivity convergence in mexico. NBER Working Papers 3141, NationalBureau of Economic Research, Inc.Blomstrom, Magnus and Fredrik Sjoholm, 1999: Multinational Corpora-
tions and Productive Convergence in Mexico, In Baumol, William J., RichardR. Nelson and Edward N. Wol¤ (eds): Convergence of Productivity: CrossNational Studies and Historical Evidence. Oxford: Oxford University Press,pp. 263-283.Bodman, PM., 1996: On Export-Led Growth In Australia and Canada:
Cointegration, Causality and Structural Stability, Australian Economic Pa-per, Vol. 35, pp. 282-99.Bolaky, B. and C. Freund, 2004: Trade, Regulations, and Growth, The
World Bank, Policy Research Working Paper Series: 3255.Boltho, A., 1996: Was Japaness Growth Export-Led?, Oxford Economic
Papers, Vol. 48, pp. 415-432.Borensztein, E., J. De Gregorio and j-W. Lee, 1998b: How Does For-
eign Direct Investment A¤ect Economic Growth?, Journal of InternationalEconomics, Vol. 45, pp. 115-135.Borrus, M., L. Tyson and J. Zysman. 1986. Creating advantage: How
government policies shape high technology trade, in Paul Krugman, editor,Strategic Trade Policy and the New International Economics.Borrus, M., Tyson, L. and J. Zysman, 1996: Creating Advantage: How
Government Policies Shape International Trade in the Semiconductor Indus-try, in Strategic Trade Policy and the New International Economics, editedby Paul R. Krugman, MIT Press.Bosco, Maria Goivanna, 2001: Does FDI Contribute to Technological
Spillovers and Growth? A Panel Data Analysis of Hungarian Firms, Transi-tional Corporations, Vol. 10. pp. 43-68.Bosworth, B. and S.M. Collins. 1999. Capital �ows to developing coun-
tries: Implications for saving and investment. Brookings Papers on Eco-nomics 1: 143-80.Brander, J., 1995, Strategic Trade Policy, in Handbook of International
84

Economics, Volume 3, editors Gene Grossman and Kenneth Rogo¤, North-Holland.Broda, Christian and Weinstein, David E. 2006. Globalization and the
gains from variety*. Quarterly Journal of Economics 121, (2) (05/01): 541-85.Broda, Christian M., Limão, Nuno and Weinstein, David E.,Optimal
Tari¤s: The Evidence(February 2006). NBER Working Paper Series, Vol.w12033, pp. -, 2006.Broda, Christian, Joshua Green�eld, and David Weinstein. 2006. From
groundnuts to globalization: A structural estimate of trade and growth.NBER Working Papers 12512, National Bureau of Economic Research, Inc.Broda, C., J. Green�eld, and D. E. Weinstein. From Groundnuts to
Globalization: A Structural Estimate of Trade and Growth, NBER WorkingPaper 12512, September 2006.Burney, NA., 1996: Exports and Economic Growth: Evidence fromCross-
Country Analysis, Applied Economic Letters, Vol. 3, pp. 369-373.CAF, 2007: Reporte Economia y Desarrollo 2006: Un Camino Hacia
la Transformación Productiva, Corporación Andina de Fomento, Caracas,Venezuela.Carkovic, M. and R. Levine, 2002: Does Foreign Direct Investment Ac-
celarate Economic Growth? University of Minnesota, Working Paper.Castellani, Davide and Antonello Zanfei, 2002a: technology Gaps, Ab-
sorptive Capacity and the Impact of Inward Investments on Productivity ofEuropean Firms, mimeo, University of Urbino (Italy).Caves, Richard E., 1996: Multinational Enterprise and Economic Analy-
sis. Second Edition. Cambridge: Cambridge University Press.Chandra, Vandana and Sashi Kolavalli, 2006: Technology, Adaptation,
and Exports: How Some Countres Got it Right, chapter 1 in Technology,Adaptation and Exports, edited by Vandana Chandra, World Bank Publica-tions.Chang, Ha-Joon, 2003, Kicking away the ladder: infant industry promo-
tion in historical perspective. Oxford Development Studies 31, 21� 32.Chang, R., Kaltani, L. and N. Loayza, 2005: Openness Can be Good
for Growth: The Role of Policy Complementarities, National Bureau of Eco-nomic Research, Inc, NBER Working Papers: 11787.Cheng, BS. and O. Chu, 1996: U.S. Exports and Economic Growth
Causality, Atlantic Economic Journal, Vol. 34, pp. 113-15.
85

Choudhn, EU. and DS. Hakura, 2000: International Trade and Produc-tivity Growth: Exploring the Sectoral E¤ects on Developing Countries, IMFSta¤ Papers, Vol. 47, No. 1, pp. 30-53.Chow, POY., 1987: Causality Between Export Growth and Industrial
Development, Journal of Development Studies, Vol. 26, pp. 55-63.Chuang, Yih-Chyi and Chi-Mei Lin, 1999: Foreign Direct Investment, R
& D and Spillover E¢ ciency: Evidence from Taiwan�s Manufacturing Firms,Journal of Development Studies, Vo. 35, pp. 117-137.Chuang, YC., 2002: The Trade-Induced Learning E¤ect on Growth:
Cross-Country Evidence, Journal of Development Studies, Vol. 39. No.2, pp. 137-154.Chuang, Y.C. and P.F. Hsu. 2004. FDI, trade, and spillover e¢ ciency:
Evidence from China s manufacturing sector. Applied Economics 36, (10):1103-.Ciccone, A. and K. Matsuyama, 1996: Start-up costs and pecuniary ex-
ternalities as barriers to economic development, Journal of Development Eco-nomics, Vol. 49, No. 1 (April).Clark, DP., 1995: Trade Orientation and Industrial Sector Growth in
Developing Countries, Journal of Developing Areas, Vol. 30, pp. 1-10.Clark, DP., Sawyer, WC. and L. Spriukle, 1999: Openness and Industri-
alization in Developing Countries, Applied Economics Letters, Vol. 6, pp.161-64.Clemens, Michael A., and Je¤rey G. Williamson. A Tari¤-Growth Para-
dox? Protection�s Impact the World Around, 1875-1997. NBER WorkingPaper No. 8459, September 2001.Clerides, Sofronis. K., Lach, S., James. R. Tybout, 1998: Is Learning By
Exporting Important? Micro-Dynamics Evidence From Columbia, Mexico,and Morocco, The Quarterly Journal of Economics, Vol. 113, No. 3, pp.903-947.Coe, David. T. and E.Helpman, 1995: International R&D Spillovers,
European Economic Review, Vol. 39, No. 5, pp. 859-896.Coe, David. T., Helpman, E. and W.A. Ho¤maister, 1997: North-South
R&D Spillovers, Economic Journal, Vol. 107, pp. 134-149.Connolly, M., 2003: The Dual Nature of Trade: Measuring Its Impact
On Immitation and Growth,Journal of Development Economics, Vol. 72, No. 1, pp. 31-55.Costantini, James, and Marc Melitz. 2007. The dynamics of �rm level
adjustment to trade liberalization. CEPR.
86

Coppin, A., 1994: Determinants of LDC Output Growth During the1980s, Journal of Developing Areas, pp. 219-28.Corden, M., 1997: Trade Policy and Economic Welfare, 2nd Edition,
Oxford University Press.Damijan, Loze P., Boris Majcen, Mark Knell and Matija Rojec, 2001: the
Role of FDI, Absorptive Capacity and Trade in Transferring Technology toTransition Countries: Evidence from Firm Panel Data for Eight TransitionCountries, mimeo, UN Economic Commission for Europe, Geneva.Dar, A. and S. Amirkhalkhali, 2003: On the Impact of Trade Openness
On Growth: Further Evidence From OECD Countries, Applied Economics,Vol. 35, No. 16, pp. 1731-1766.Darrat, Af. and Hsu, MK. and M. Zhong, 2000: Testing Export Exogene-
ity in Taiwan: Further Evidence, Applied Economics Letters, Vol. 7, No. 9,pp. 563-68.Darrat, AF., 1987: Are Exports An Engine of Growth? Another Look
At The Evidence, Applied Economics, Vol. 19, pp. 277-283.Dawson, PJ. and LD. Hubbard, 2004: Exports and Economic Growth
In Central And East European Countries During Transition, Applied Eco-nomics, Vol. 36, No. 16, pp. 1819-1824.De Ferranti, D., G. Perry, D. Lederman and W. Maloney, 2001: From
Natural Resources to the Knowledge Economy, World Bank.De Loecker, Jan. 2007. Do exports generate higher productivity? evi-
dence from slovenia. Journal of International Economics 73, (1) (9): 69-98.DeJong, D.N. and M. Ripoll. 2006. Tari¤s and growth: An empirical
exploration of contingent relationships. Review of Economics and Statistics88, (4) (11/01): 625-40.Delgado, Miguel A., Jose C. Fariñas, and Sonia Ruano. 2002. Firm
productivity and export markets: A non-parametric approach. Journal ofInternational Economics 57, (2) (8): 397-422.Demidova, Svetlana and Andrés Rodríguez-Clare, 2008, Trade Policy un-
der Firm-Level Heterogeneity in a Small Economy.Dhawan, U. and B. Biswal, 1999: Re-examining Export-Led Growth
Hypothesis: A Multivariate Cointegration Analysis for India, Applied Eco-nomics, Vol. 33, pp. 525-530.Diamond, P.A. and J.A. Mirrlees. 1971. Optimal taxation and public
production I: Production e¢ ciency. The American Economic Review 61,(1): 8-.
87

Dimelis, Sophia and Helen Louri, 2002: Foreign Direct Investment andE¢ ency Bene�ts: A Conditional Quantile Analysis, Oxford Economic Pa-pers, Vol. 54, pp. 449-469.Dixit, Avinash. 1985. Tax policy in open economies. In Handbook of
public economics., ed. A. J. Auerbach & M. Feldstein. 1st ed. Vol. 1,313-374, Elsevier.Djankov, S. and B. Hoekman. 2000. Foreign investment and productivity
growth in czech enterprises. The World Bank Economic Review 14, (1): 49.Dodaro, Santo. 1991. Comparative advantage, trade and growth: Export-
led growth revisited. World Development 19, (9) (9): 1153-65.Dollar, D. and A. Kraay. 2004. Trade, growth, and poverty. The Eco-
nomic Journal 114, (493): F22.Donaldson, D. 2009. Railroads of the Raj: Estimating the Impact of
Transportation Infrastructure. Working Paper, London School of Economics.Dri¢ eld, N. and S. Girma. 2003. Regional foreign direct investment
and wage spillovers: Plant level evidence from the UK electronics industry.Oxford Bulletin of Economics and Statistics 65, (4): 453-.Du, L., A. Harrison, and G. Je¤erson. 2008. Testing for horizontal and
vertical foreign investment spillovers in china, 1998-2005.Dutta, D. and M. Ahmed. 2004. An aggregate import demand function
for india: A cointegration analysis. Applied Economics Letters 11, (10): 607.Dodaro, S., 1991: Comparative Advantage, Trade And Growth: Export-
Led Growth Revisited, World Development, Vol 19, No. 9, pp. 1153-1165.Dodzin, S. and A. Vamvakidis, 2004: Trade And Industrialization In
Developing Economies, Journal of Development Economics, Vol. 75, No. 1,pp. 319-328Dollar, D., 1992: Ourward-Oriented Developing Economics Really Do
Grow More Rapidly: Evidence from 95 LDCs, 1976-85, Economic Develop-ment and Cultural Change, Vol. 40, No. 3, pp. 523-44Doraisami, A., 1996: Export Growth and Economic Growth: A Re-
Examination of Some Time Series Evidence of The Malaysian Experience,Journal of Developing Areas, Vol. 30, pp. 223-230.Doyle, E., 1998: Export-Ouput Causality: The Irish Case, 1953-1993,
Atlantic economic Journal, Vol. 26, pp.147-61.Dri¢ eld, Nigel, 2001: The Impact on Domestic Productivity of Inward
Investment in the UK, The Manchester School, Vol. 69, pp. 103-119.Dritsakis, N. 2004: Exports, Investment And Economic Development of
Pre-Accession Countries of The EU: An Empirical Investigation of Bulgaria
88

And Romania, Applied Economics, Vol. 36, No. 16, pp. 1831-1838.Duankov, Simeon and Bernard Heokman, 2002: Foreign Investment and
Productivity Growth in Czech Enterprises, World Bank Economic Review,Vol. 14, pp. 49-64.Dutt, SD. and D. Ghosh, 1994: Trade Libralization And Industrial Growth
In Pakistan: A Cointegration Analysis, Applied Economics, Vol. 36, No. 13,pp. 1421-1429.Dutt, SD. and D. Ghosh, 1996: An Empirical Investigation of The Export
Growth, Economic Growth Relationship, Applied Economics Letters, Vol. 1,pp. 44-48.Earle, John S. and Telegdy, Almos. March 2007. Ownership and wages:
Estimating public-private and foreign-domestic di¤erentials using leed fromhungary, 1986-2003. NBER Working Paper no. W12997.Easterly, W. and R. Levine. 2003. Tropics, germs, and crops: How en-
dowments in�uence economic development. Journal of Monetary Economics50, (1) (1): 3-39.Eaton, J. and G. Grossman. May 1986. Optimal trade and industrial
policy under oligopoly. The Quarterly Journal of Economics 101, (2): 383-406.Eaton, J. and S. Kortum. 1999. International technology di¤usion: The-
ory and measurement. International Economic Review 40, (3): 537-.Edwards, S. 1998. Openness, productivity and growth: What do we really
know? The Economic Journal 108, (447): 383-.Estevadeordal, A. and AlanM. Taylor. August 2008. IS THEWASHING-
TON CONSENSUS DEAD? GROWTH, OPENNESS, AND THE GREATLIBERALIZATION, 1970s-2000s. Working Paper ed. NATIONAL BU-REAU OF ECONOMIC RESEARCH 1050 Massachusetts Avenue Cam-bridge, MA 02138.Ethier, Wilfred J. September 1982. Decreasing costs in international
trade and frank graham�s argument for protection. Econometrica 50, (5):1243-68.� � � . November , 1986. The multinational �rm. The Quarterly Jour-
nal of Economics 101, (4): 805-33.� � � . June 1982. National and international returns to scale in the
modern theory of international trade. 72, (3): 389-405.� � � . 1982. The general role of factor intensity in the theorems of
international trade. Economics Letters 10, (3-4): 337-342.� � � . Dumping. Journal of Political Economy June 90, (3): 487-506.
89

Eaton, J. and S. Kortum (2001), Technology, Trade and Growth: A uni-�ed framework, European Economic Review 45, 742-755.Eaton, J. and S. Kortum (2002), Technology, Geography, and Trade,
Econometrica 70, 1741-1780.Findlay, R., 1995: Factor Proportions, Tradeand Growth, MIT Press.Ederington J. and Phillip McCalman, 2008, Endogenous Firm Hetero-
geneity and the Dynamics of Trade Liberalization, Journal of InternationalEconoimcs (74), pp.422-440.Edwards, S., 1992: Trade Orientation, Distortions, and Growth in Devel-
oping Countries, Journal of Development Economics, Vol 39, pp. 31-57Egwaikhide, FO. 1992: Oil Export and Economic Growth In Nigeria: A
Preliminary Investigation, Indian Journal of Economics, Vol. 73, pp. 221-232.Erlat, G., 2000: Measuring The Impact of Trade Flows On Employment
In The Turkish Manufacturing Industry, Applied Economics, Vol. 32, No. 9,pp. 1169-1180.Esfahani, FIS. 1991: Exports, Imports and Economic Growth In Semi-
Industrialized Countries, Journal of Development Economics, Vol. 35, pp.93-116.Falvey, R., Foster, N. and D. Greenaway, 2004: Imports, Exports, Knowl-
edge Spillovers And Growth, Economics Letters, Vol. 85, No. 2, pp. 209-213.Feenstra, R. 1994. New goods and index numbers: U.S. import prices.
Working Paper ed. NBER Working Papers 3610, National Bureau of Eco-nomic Research, Inc.Feliciano, Z. and Lipsey, R.E. (February 1999). Foreign ownership and
wages in the united states, 1987 - 1992. NBER Working Paper No. W6923.Fernandes, Anam and A. Isgut. March 22, 2007. Learning-by-exporting
e¤ects: Are they for real?Feyrer, J. 2009. Trad and income-exploiting time series in geography.
Working Paper, NBER and Dartmouth College.Freund, C. and B. Bolaky. October 2008. Trade, regulations, and income.
Journal of Development Economics 87, (2): 309-321.Feder, G., 1982: On Exports and Economic Growth, Journal of Develop-
ment Economics, Vol 12, pp. 59-73.Ferreira, PC. and JL. Rossi, 2003: New Evidence From Brazil On Trade
Liberalization And Productivity Growth, International Economic Review,Vol. 44, No. 4, pp. 1383-1405.
90

Fosu, AK., 1996: Primary Exports and Economic Growth in DevelopingCountries, World Economy, Vol. 19, pp. 466-475.Fosu, AX., 1990: Exports and Economic Growth: The African Case,
World Development, Vol. 18, pp.531-535.Francisco, F. and R. Ramos, 2001: Exports, Imports and Economic
Growth In Portugal: Evidence from Caulsality and Cointegration Analysis,Economic Modelling, Vol. 18, No. 4, pp. 613-623.Frankel, JA. and D. Romer, 1999: Does Trade Cause Growth, American
Economic Review, Vol. 89, No. 3, pp.379-399.Fu, Xiaolan., 2005: Exports Technical Progress and Productivity Growth
in A Transition Economy: A Non-Parametric Approach for China, AppliedEconomics, Vol. 37, No. 7, pp. 735-739.Ghartey, Edward. 1993. Causal relationship between exports and eco-
nomic growth: Some empirical evidence in taiwan, japan and the US. AppliedEconomics 25, (9) (09): 1145-.Goldberg, P. and G. Maggi. 1999. Protection for sale: An empirical
investigation. The American Economic Review 89: 1135-.Goldberg, P. and G. maggi. 1999. Protection for sale: An empirical
investigation. American Economic Review 89, (5): 1135-1155.Goldberg, P. and N. Pavcnik. 2007. Distributional e¤ects of globalization
in developing countries. Journal of Economic Literature 45, (1): 39-.Goldberg, Pinelopi, Khandelwal, Amit, Pavcnik, Nina and Topalova,
Petia B.,(June 2008). June 2008. Multi-product �rms and product turnoverin the developing world: Evidence from india. NBER Working Paper no.W14127.Goldberg, Pinelopi, Koujianou, Khandelwal, Amit, Pavcnik, Nina and
Topalova, Petia B. October 2008. Imported intermediate inputs and domesticproduct growth: Evidence from india. NBER Working Paper Series 14416.Gorg, H. and D. Greenway. 2004. Much ado about nothing? do do-
mestic �rms really bene�t from foreign direct investment? The World BankResearch Observer, 19, (2): 171-197.Gorodnichenko, Y., Jan Svejnar, and Katherine Terrell. 2008. Global-
ization and innovation in emerging markets. National Bureau of EconomicResearch, Inc.Graham, F. D. 1923. Some aspects of protection further considered. The
Quarterly Journal of Economics 37, (2):199-.Greenaway, D. and D. Sapsford. March 1994. What does liberalisation do
for exports and growth? Review of World Economics (Weltwirtschaftliches
91

Archiv) 130, (1): 152-174.Greenaway, D., W. Morgan and P. Wright. February 2002. Trade liber-
alisation and growth in developing countries. Journal of Development Eco-nomics 67, (1): 229-244.Grossman, G and E. Helpman. 1991. Innovation and growth in the global
economy. MIT Press, Cambridge MA and London UK.Grossman, G. M. 1992. Imperfect competition and international trade.
MIT Press.Gani, A., 1997: Economic Growth in Papua New Guinea: Some Empirical
Evidence, Paci�c Economic Bulletin, Vol. 12, No. 1, pp. 41-52.Gawande, K., Krishna, P. and M. Olarreaga, 2005, Lobbying Competition
over Trade Policy, manuscriptGharte, EE., 1993: Cause Relationship Between Exports and Economic
Growth: Some Empirical Evidence in Taiwan, Japan and the US, AppliedEconomics, Vol. 25, pp. 1141-1152.Ghatak, S., Miner, C. and U. Utkulu, 1997: Exports, Exports Expansion
and Growth: Cointegration and Causalit: Evidence for Malaysia, AppliedEconomics, Vol. 29, no. 2, pp. 213-23.Ghirma, T. and Grabowski, R. and SC. Sharma, 2001: Exports, Invest-
ment, E¢ ciency and Economic Growth in LDC: An Empirical Investigation,Applied Economics, Vol. 33, No. 6, pp. 599-700.Giles, DEA., Giles, JA. and E. McCann, 1992: Causality Unit Roots and
Export-Led Growth: The New Zealand Experience, Journal of InternaitonalTrade and Economic Development, Vol. 1, pp. 195-218.Girma, Sourafel and Holger Gorg, 2002: Foreign Direct Investment, Spillovers
and Aborptive Capacity: Evidence fromQuantile Regressions, GEPResearchPaper 02/14, University of Nottingham.Girma, Sourafel and KatharineWakelin, 2002: Are There Regional Spillovers
from FDI in the UK?, in Greenaway, David, Richard Upward, KatharineWakelin (eds.): Trade, Investment, Migration and labor Markets. Bas-ingstoke: Macmillan.Girma, Sourafel, 2002: Geographic Proximity, Aborptive Capacity and
Productivity Spillovers from FDI: A Threshold Regression Analysis, GEPResearch Paper 02/06, University of Nottingham.Girma, Sourafel, David Greenaway and Katharine Wakelin, 2001: Who
Bene�ts from Foreign Direct Investment in the UK. Scottish Journal of Po-litical Economy, Vol. 48, pp. 119-133.
92

Globerman, Steven, 1979: Foreign Direct Investment and �Spillover�E¢ -ciency Bene�ts in Canadian Manufacturing Industries, Canadian Journal ofEconomics, Vol. 12, pp. 42-56.Gokceus, O., 1997: Trade LIberalization and Productivity Growth: New
Evidence from the Turkish Rubber Industry, Applied Economics, Vol, 29.No. 5, pp. 639-645.Gollin, 2002: Getting Income Shares Right, Journal of Political Economy,
University of Chicago Press, vol. 110(2), pages 458-474, April.Gordon, DV. and K. Sakyi, 1993: Testing the Export-Growth Hypothe-
sis: Some Parametric and Non-Parametric Results for Ghana, Applied Eco-nomics, Vol. 25, No. 4, pp. 553-63.Gorg, Holger and Eric Strobl, 2002a: Spillovers from Foreign Firms
through Worker Mobility: An Empirical Investigation GEP Research Paper02/13, University of Nottingham.Gorg, Holger and Eric Strobl, 2002b: Multinational Companies and In-
digenous Development: An Empirical Analysis, European Economic Review,Vol. 46, pp. 1305-1322.Grabowski, R., Sharma, SC. and D, Dhakal, 1990: Exports and Japanese
Economic Development, Economics Letters, Vol. 32, No. 2, pp. 127-32.Greenaway, D. and D. Sapsford, 1994a: What Does Liberalization Do for
Exports and Growth, Weltwirschaftliches Archiv, pp. 152-174.Greenaway, D., Morgan, W. and P. Wright, 1997: Trade Liberalization
and Growth in Developing Countries: Some New Evidence, World Develop-ment, Vol. 25, No. 1, pp. 1885-97.Greenaway, D., Morgan, W. and P. Wright, 1999: Exports, Export Com-
position and Growth, Journal of International Trade and Economic Devel-opment, Vol. 8, No. 1, pp. 41-51.Greenwald and Stiglitz, 2006: Helping Infant Economies Grow: Founda-
tions of Trade Policies for Developing Countries, The American EconomicReview, Vol. 96, No. 2 (May).Gupta, S., 1985: Export Growth and Economic Growth Revisited, Indian
Economic Journal, vol 32, pp. 52-29.Hallward-Driemeier, M., and Giuseppe Iarossi & Kenneth L. Sokolo¤.
2002. Exports and manufacturing productivity in east asia: A comparativeanalysis with �rm-level data. NBER Working Paper Series W8894.NationalBureau of Economic Research, Inc.Halpern, L., M. Koren and A. Szeidl. Imports and productivity. CEPR
Discussion Paper No. 5139. July 2005.
93

Hanson, Gordon H. September 2001. U.S.-mexico integration and re-gional economies: Evidence from border-city pairs, Journal of Urban Eco-nomics 50, (2): 259-287.Harrison, A., and G. Hanson with Gordon Hanson. 1999. Who gains from
trade reform? some remaining puzzles. Journal of Development Economics59, : 125-154.Harrison, A., and J. Scorse. 2004. Globalization�s impact on compliance
with labor standards. In Brookings trade forum 2003., ed. Susan Collins andDani Rodrik,Brookings Institution Press 2004, Washington, D.C.Harrison, Ann E., I. Love, M. S. McMillan. 2004. Global capital �ows
and �nancing constraints. Journal of Development Economics 75, (1) (10):269-301.Haddad, Mona and Ann. Harrison, 1993: Are There Positive Spillovers
from Direct Foreign Investment? Evidence from Panel Data for Morocco,Journal of Development Economics, Vol. 42, pp. 51-74.Hansen, J., Jensen, D. and Madsen, E. 2003. The establishment of the
Danish windmill industry �was it worthwhile? Review of World Economics139, 324� 47.Hansen, P., 1994: The Government, Exporters and Economic Growth in
New Zealand, New Zealand Economic Papers, Vol. 28, No. 2, pp. 133-42.Harris, Richard and Catherine Robinson, 2002: Spillovers from Foreign
Ownership in the United Kingdom: Estimates for UK Manufacturing Usingthe ARD, mimeo, University Durham.Harrison, Ann E., An Empirical Test of the Infant Industry Argument:
Comment, The American Economic Review, Vol. 84, No. 4 (Sep., 1994), pp.1090-1095.Harrison, Ann E., 1994, February). Productivity, Imperfect Competi-
tion, and Trade Reform. Theory and Evidence. Journal of InternationalEconomics 36(1-2), 53-73.Harrison, Ann E., 1996: Openness and Growth: A Time-Series, Cross-
Country Analysis for Developing Countries, Journal of Development Eco-nomics, Vol. 48, pp. 419-47.Harrison, Ann E, and J. Scorse, 2008, Multinationals and Anti-Sweatshop
Activism American Economic Review, forthcoming.Harrison, Ann E, L, Inessa and Margaret S. McMillan, 2004, Global Cap-
ital Flows and Financing Constraints, Journal of Development Economics,75 (1): 269-301, Oct 2004.
94

Harrison, Ann E and Margaret McMillan, 2003, Does Direct Foreign In-vestment A¤ect Domestic Firm Credit Constraints?, Journal of InternationalEconomics, 61, pp. 73-100.Harrison, Ann E. and Margaret McMillan, 2007, On the Links Between
Globalization and Poverty, Journal of Economic Inequality (5), pp. 123-134.Hausmann, R., A. Rodríguez-Clare, and D. Rodrik, 2005, Towards a
Strategy for Economic Growth in Uruguay, Inter-American DevelopmentBank, Economic and Social Study Series, February 2005.Hausmann, Ricardo, Jason Hwang and Dani Rodrik, 2007, What You
Export Matters, Journal of Economic Growth, 12, pp. 1-25.Hausmann, R., and D. Rodrik, 2003: Economic Development as Self-
Discovery (with Ricardo Hausmann), Journal of Development Economics,vol. 72, December.Hausmann, R., and D. Rodrik, 2006: Doomed to Choose: Industrial
Policy as Predicament, John F. Kennedy School of Government, HarvardUniversity.Hausmann, R., Hwang, J. and D. Rodrik, 2005: What You Ex-port Matters, National Bureau of Economic Research, Inc, NBER WorkingPapers: 11905.Head Keith, 1994, Infant Industry Protection in the Steel Rail Industry,
Journal of International Economics (37), pp. 141-165.Helpman, Elhanan and Paul R. Krugman, 1985, Market Structure and
Foreign Trade, The MIT Press Cambrige, pp. 26.Henriques, I. and P. Sadorsky, 1996: Export-Led Growth or Growth-
Driven Exports? The Canadian Case, Canadian Journal of Economcis, Vol.29, No. 3, pp. 540-555.Hernández, I., N. Cely, F. González, E. Muñoz, and I. Prieto, 2007: The
Discovery of New Export Products in Ecuador, Stratega, Ecuador.Holman, J. A. and P. E. Graves, 1995: Korean Exports Economic Growth:
An Econometric Reassessment, Journal of Economic Development, Vol. 20,No. 2, pp. 45-56.Hsiao, Mei-chu. W., 1987: Tests of Causality and Exogeneity Between
Exports and Economic Growth: The Case of the Asian NICs, Journal ofEconomic Development, Vol 12, no. 2, pp. 143-159.Hsieh, Chang-Tai and Peter J. Klenow, 2007, Misallocation and Manu-
facturing TFP in China and India, NBER Working Paper No. 13290.Hu, Albert and Gary Je¤erson, 2002, FDI Impact and Spillover: Evidence
from China�s Electronic and Textile Industries, The World Economy, 25, pp.1063-1076.
95

Huchet, Jean-Francois, 1997, The China Circle and Technological Devel-opment in the Chinese Electronics Industry, Naughton Barry ed. The ChinaCircle: Economics and Electronics in the PRC, Taiwan, and Hong Kong.Washington, D.C., Brookings Institution Press, pp. 254-85.Hutchison, M. and N. Singh, 1992: Exports, Non-exports and External-
ities: A Granger Causality Approach, International Economic Journal, Vol.6, No. 2, pp. 79-94.Imbs, J. and R. Wacziarg, R., 2003: Stages of Diversi�cation, American
Economic Review, vol. 93, no. 1, pp. 63-86.Irwin, D., 1996: Against the Tide: An Intellectual History of Free Trade,
Princeton University Press.Irwin, Douglas, 1998. Did late-nineteenth-century U.S. tari¤s promote
infant industries? Evidence from the tinplate industry. Journal of EconomicHistory 60, 335� 60.Irwin Douglas, 2000, Did Late Nineteenth Century U.S. Tari¤s Promote
Infant Industries? Evidence from the Tinplate Industry, Journal of EconomicHistory (60), pp. 335-360.Irwin, Douglas, 2002, Interpreting the Tari¤-Growth Correlation in the
Late Nineteenth Century . American Economic Review, Papers and Pro-ceedings (May).Irwin Douglas, 2007, Tari¤ Incidence in America�s Gilded Age, Journal
of Economic History, 67, pp. 582-607.Iscan, Talan., 1998: Exports and Capital Accumulation: Some Empiri-
cal Evidence from the Mexican Manufacturing Industry, Applied EconomicsLetters, Vol. 5, No. 6, pp. 355-60.Islam, M. N., 1998: Export Expansion and Economic Growth: Testing
for Cointegration and Causality, Applied Economics, Vol. 30, No. 3, pp.415-425.Javorcik, B. S., 2003: Does Foreign Direct Investment Increase the Pro-
ductivity of Domestic Firms? In Search of Spillovers Through BackwardLinkages, American Economic Review, forthcoming.Jin, J. C. and Eden. S. H. Yu, 1995: The Causal Relationship Between
Exports and Income, Journal of Economic Development, Vol. 20, No. 1, pp.131-140.Jin, J. C. and Eden. S. H. Yu, 1996: Export-Led Growth and the US
Economy: Another Look, Applied Economics Letters, Vol. 3, No. 5, pp.341-344.
96
Jin, J. C., 1995: Export Led Growth and the Four Little Dragons, Journalof International Trade and Economics Development, Vol. 4, No. 2, pp. 203-215.Jin, J. C., 2000: Openness and Growth: An Interpretation of Empirical
Evidence from East Asian Countries, Journal of International Trade andEconomic Development, Vol. 9, No. 1, pp. 5-17.Jung, W. and P. Marchall., 1985: Exports, Growth, and Causality in
Developing Countries, Journal of Development Economics, Vol 18, pp. 241-250.Karunaratne, N. D., 1996: Growth and Trade Dynamics under Regime
Shifts in Australia, Journal of Economic Studies, Vol. 23, No. 2, pp. 55-69.Kasahara H. and J. Rodrigue, 2008, Does the Use of Imported Interme-
diates Increase Productivity? Plant-level Evidence, Journal of DevelopmentEconomics, 87, pp. 106-118.Kathuria, Vinish., 2000: Productivity Spillovers from Technology Trans-
fer to Indian Manufacturing Firms, Journal of International Development,Vol. 12, pp. 343-369.Kavoussi, R. M., 1985: International Trade and Economic Development:
The Recent Experience of Developing Countries, Journal of Developing Ar-eas, Vol. 19, No. 3, pp. 379-92.Keller, W., 1998: Are International R&D Spillovers Trade-Related? An-
alyzing Spillovers Among Randomly Matched Trade Parters, European Eco-nomic Review, Vol. 42, pp. 1469-1481.Keller, Wolfgang. and Stephen Yeaple., 2003: Multinational Enterprises,
International Trade, and Productivity Growth: Firm-Level Evidence fromthe United States, GEP Research Paper 03/13, University of Nottingham.Keller Wolfgang, 2004, International Technology Di¤usion, Journal of
Economic Literature (42), pp. 752-782.Kemp, M. C. 1960: The Mill-Bastable Infant Industry Dogma. Journal
of Political Economy, 68/1: 65-67.Ketels, C, G. Lindqvist, and O. Solvell, 2006: Cluster Initiatives in Devel-
oping and Transition Economies, Center for Strategy and Competitiveness,Stockholm.Khalafalla, K. Y. and A. J. Webb, 2001: Export-Led Growth and Struc-
tural Change: Evidence from Malaysiz, Applied Economics, Vol. 33, No. 13,pp. 1703-1715.Kim, E., 2000: Trade Liberalization and Productivity Growth in Ko-
rean Manufacturing Industries: Price Protection, Market Power, and Scale
97

E¢ ciency, Journal of Development Economics, Vol. 62, No. 1, pp. 55-83.Kinoshita, Yuko., 2001: R & D and Technology Spillovers through FDI:
Innovation and Absorptive Capacity, CEPR Discussion Paper DP2775.Kohli, I. and N. Singh, 1989: Exports and Growth: Critical Minimum
E¤ort and Dimishing Returns, Journal of Development Economics, Vol. 30,No. 2, pp. 391-400.Kokko, Ari., 1994: Technology, Market Characteristics, and Spillovers,
Journal of Development Economics, Vol. 43, pp. 279-293.Kokko, Ari., 1996: Productivity Spillovers from Competition between
Local Firms and Foreign A¢ liates, Journal of International Development,Vol. 8, pp. 517-530.Kokko, Ari., Mario Zejan and Ruben Tansini, 2001: Trade Regimes and
Spillover E¤ects of FDI: Evidence from Uruguay, Weltwirschaftliches Archiv,Vol. 137, pp. 124-149.Kokko, Ari., Ruben Tansini and Mario C. Zejan, 1996: Local Techno-
logical Capability and Productivity Spillovers from FDI in the UruguayanManufacturing Sector, Journal of Development Studies, Vol. 32, pp. 602-611.Konings, Jozef., 2001: The E¤ects of Foreign Direct Investment on Do-
mestic Firms: Evidence from Firm Level Panel Data in Emerging Economies,Economics of Transition, Vol. 9, pp. 619-633.Krueger, Anne O., and Baran Tuncer, An Empirical Test of the Infant
Industry Argument, American Economic Review, vol. 72, issue 5, 1982, pages1142-52.Krugman Paul R., 1987, Trigger Strategies and Price Dynamics in Equity
and Foreign Exchange Markets, NBER Working Paper No. 2459.Krugman, P. 1991: Geography and Trade, The MIT Press.Krugman, P., The Narrow Moving Band, the Dutch Disease, and the
Competitive Consequences of Mrs. Thatcher: Notes on Trade in the Presenceof Dynamic Scale Economies, J. Devel. Econ., 27: 41-55.Kugler, Maurice, 2001: The Di¤usion of Externalities from Foreign Di-
rect Investment: The Sectoral Pattern of Technologies Spillovers, mimeo,University of Southampton.Krugman Paul and M. Obstfeld, 2008, International Economics: Theory
and Policy, 8th, Harper Collins College Publisher.Kunst, R. M. and D. Marin, 1989: On Exports and Productivity: A
Causal Analysis, Review of Economics and Statistics, Vol. 71, No. 4, pp.699-703.
98

Kwan, A. CC. and B. Kwok, 1995: Exogeneity and the Export-LedGrowth Hypothesis: The Case of China, Southern Economic Journal, Vol.61, No. 4, pp. 1158-1166.Kwan, A. CC. and J. A. Cotsomitis, 1990: Economic Growth and the Ex-
panding Export Sector: China 1952-1985, International Economic Journal,Vol. 5, No. 1, pp. 105-117.Kwan, A. CC., J. A. Cotsomitis and B. Kwok, 1996: Exports, Economic
Growth and Exogeneity: Taiwan 1953-1988, Applied Economics, Vol. 28,No. 4, pp. 467-471.Lee, H. Y., Ricci, L. A. and R. Rigobon, 2004: Once Again, Is Openness
Good for Growth? Journal of Development Economics, Vol. 75, No. 2, pp.451-472.Lee, J. 1996, Government Interventions and Productivity Growth in Ko-
rean Manufacturing Industries, Journal of Economic Growth 1, no. 3, pp.391-414.Lee, J. W., 1995: Capital Goods Imports and Long-Run Growth, Journal
of Development Economics, Vol. 48, pp. 91-110.Leea, H. Y., Riccib, L. A., R. Rigobon, 2004: Once again, is openness
good for growth?, Journal of Development Economics, Vol. 75, pp. 451� 472.Lehmann Sibulle H. and Kevin H. O�Rourke, 2008, The Structure of
Protection and Growth in the Late 19th Century, NBER Working Paper,No. 14493.Levine, R and D. Renelt., 1992: A Sensitivity Analysis of Cross-country
Growth Regressions, American Economic Review, Vol 82, no. 4, pp. 942-963.Levinsohn James, 1993, Testing the Imports-As-Market-Discipline Hy-
pothesis, Journal of International Economics, 35, pp. 1-22.Lewis, Sir Arthur., 1955, The Theory of Economic Growth, London: Allen
and Unwin.Li, Xiaoying, Xiaming Liu and David Parker, 2001: Foreign Direct In-
vestment and Productivity Spillovers in the Chinese Manufacturing Sector,Economic Systems, Vol. 25, pp. 305-321.Lileeva Alla, 2004, Import Competition and Selection, Working Paper,
York University.Lileeva Alla and Daniel Tre�er, 2007, Improved Access to Foreign Markets
Raises Plant-Level Productivity. . . ...for Some Plants, NBERWorking Paper,No. 13279.Lipsey Robert E. and Fredrik Sjoholm, 2004, Foreign Direct Investment,
Education and Wages in Indonesian Manufacturing, Journal of Development
99

Economics, 73 (1), pp. 415-422.List, Friedrich, G.-A Matile, Henri Richelot, and Stephen Colwell. 1856.
National system of political economy. Philadelphia: J.B. Lippincott & Co.Liu, Ping, Liu, Zhuomin and Yifan, Zhang, 2008, Do Chinese Domes-
tic Firms Bene�t form FDI In�ow? Evidence of Horizontal and VerticalSpillovers, Working Paper, Lingnan University, Hong Kong.Liu, Xiaming, Pamela Siler, Changqi Wang and Yingqi Wei, 2000: Pro-
ductivity Spillovers from Foreign Direct Investment: Evidence from UK In-dustry Level Panel Data, Journal of International Business Studies, Vol. 31,pp. 407-425.Liu, Xiaming, Song, Haiyan and P. Romilly, 1997: An Empirical Invest-
gation of the Causal Relationship Between Openness and Economic Growthin China, Applied Economics, Vol. 29, No. 12, pp. 1679-1686.Liu, Zhiqiang, 2008, Foreign Direct Investment and Technology Spillovers:
Theory and Evidence, Journal of Development Economics (85), pp. 176-193.Lopez-Cordova, J. Ernesto., 2002: NAFTA and Mexico�s Manufacturing
Productivity: An Empirical Investigation Using Micro-Level Data, mimeo,International American Development Bank.Lopez-Cordova J. Ernesto and Christopher M. Meissner, 2003, Exchange-
Rate Regimes and International Trade: Evidence from the Classical GoldStandard Era, American Economic Review, 93 (1), pp. 344-353.Love, J., 1994: Engines of Growth: The Export and Government Sectors,
World Economy, Vol. 17, No. 2, pp. 203-218.Lucas, R. E. Jr., 1988: On the Mechanics of Development Planning.
Journal of Monetary Economics, Vol. 22, pp. 3-42.Luzio, E. and Greenstein, S. 1995. Measuring the performance of a pro-
tected infant industry: the case of Brazilian microcomputers. Review ofEconomics and Statistics 77, 622� 33.Markusen James R. 1989, Trade in Producer Services and in Other Spe-
cialized, Intermediate Inputs, American Economic Review, 79, pp. 85-95.Martins P. S. & Luiz A. Esteves, 2006, Is There Rent Sharing in Develop-
ing Countries? Matched-Panel Evidence from Brazil, Institute for the Studyof Labor (IZA) Discussion Papers 2317.Madden, G., Savege, S. J. and P. Bloxham, 2001: Asian and OECD
International R&D Spillovers, Applied Economics Letters, Vol. 8, No. 7, pp.431-435.Mallick, S. K., 1996: Causality Between Exports and Economic Growth in
India: Evidence from Cointegration Based Error Correction Models, Indian
100

Journal of Economics, Vol. 76, pp. 307-320.Manova, K. 2006: Credit Constraints, Heterogenous Firms, and Interna-
tional Trade, Harvard University.Markusen James R. 1989, Trade in Producer Services and in Other Spe-
cialized, Intermediate Inputs, American Economic Review, 79, pp. 85-95.Martins P. S. & Luiz A. Esteves, 2006, Is There Rent Sharing in Develop-
ing Countries? Matched-Panel Evidence from Brazil, Institute for the Studyof Labor (IZA) Discussion Papers 2317.Marin, D., 1992: Is the Export-Led Growth Hypothesis Valid for Indus-
trialized Countries, Review of Economics and Statistics, Vol. 74, No. 4, pp.678-688.Marshall, A. 1920: Principles of Economics, MacMillan, London.Matsuyama Kiminori, 1991, Increasing Returns, Industrialization, and
Indeterminacy of Equilibrium, The Quarterly Journal of Economics (106),pp. 617-650.Mbaku, J. M., 1989: Export Growth and Economic Performance in De-
veloping Countries: Further Evidence from Africa, Journal of Economic De-velopment, Vol. 14, No. 2, pp. 127-142.McCarville, M. and E. Nnadozie, 1995: Causality Tests of Export-Led
Growth: The Case of Mexico, Atlantic Economic Journal, Vol. 23, No. 2,pp. 140-145.McNab, R. M. and R. E. Moore, 1998: Trade Policy, Export Expansion,
Human Capital and Growth, Journal of International Trade and EconomicDevelopment, Vol. 7, No. 2, pp. 237-256.Melitz, M. 2003. EconometricaMelitz, M. 2005: When and how should infant industries be protected?,
Journal of International Economics 66 (2005), pp. 177� 196.Mill, J. S. 1909: Principles of Political Economy, London Longmans,
Green.Mobarak A. M. and Denni P. Purbasari, 2006, Do Multinational Cor-
porations Seek Out Politically Connected Firms? Firm Level Evidence onLocal Partner Search by Multinational Corporations, Working paper.Moosa, Imad. A., 1999: Is the Export-Led Growth Hypothesis Valid for
Australia? Applied-Economics, Vol. 31, No. 7, pp. 903-06.Moreira, M. Mesquita. and S. Najberg,2000: Trade Liberalisation in
Brazil: Creating or Exporting Jobs? Journal of Development Studies, Vol.36, No. 3, pp. 78-99.
101

Morley, B. and N. Perdikis, 2000: Trade Liberalisation, Government Ex-penditure and Economic Growth in Egypt, Journal of Development Studies,Vol. 36. No. 4, pp. 38-54.Moschos, D., 1989: Export Expansion, Growth and The Level of Eco-
nomic development, Journal of Development Economics, Vol 30, pp. 93-102.Muendler Marc-Andreas, 2001, Trade and Growth Revisited: Managing
to Converge, Agreeing to Diverge, University of California, San Diego, un-published manuscript.Muendler Marc-Andreas, 2004, Trade, Technology and Productivity: A
Study of Brazilian Manufacturers 1986-1998, CESifo Working Paper SeriesNo. 1148, University of California, San Diego.Muendler Marc-Andreas, 2007, Trade andWorkforce Changeover in Brazil,
NBER Working Papers, No. 12980.Mulaga, G. and J. Weiss,1996: Trade Reform and Manufacturing Perfor-
mance in Malawi, World Development, Vol. 24, No. 7, pp. 1267-78.Murphy, K. M., Shleifer, A., and R. W. Vishny, 1989: Industrialization
and the Big Push, Journal of Political Economy, Vol. 97, No. 5.Nishimizu, Mieko and J. Page, 1982: Total Factor Productivity Growth,
Technological Progress and Technical E¢ ciency Change: Dimensions of Pro-ductivity, The Economic Journal (92), pp. 920-936.Noland, M. and H. Pack, 2003: Industrial Policy in an ear of Globaliza-
tion: Lessons fromAsia, Institute for International Economics, WashingtonDC.Nunn, N. and D. Tre�er, 2004, The Political Economy of Tari¤s and
Long-term Growth, revision requested at the American Economic Journal:Macroeconomics.Okuno-Fujiwara, Masahiro., 1988, Interdependence of Industries, Coor-
dination Failture and Strategic Promotion of an Industry, Journal of Inter-national Journal (25), pp. 25-43.Olley, Steven and A. Pakes, 1993, A Limit Theorem for a Smooth Class
of Semiparametric Estimators, Cowles Foundation Discussion Papers, No.1066, Yale University.Onafowora, O. A. and O. Owoye, 1998: Can Trade Liberalization Stim-
ulate Economic Growth in Africa? World Development, Vol. 26, no. 3, pp.497-506.O�Rourke, Kevin H. Tari¤s and Growth in the Late 19th Century. Eco-
nomic Journal 110 (April 2000): 456-483.
102

Oskooee, B. M. and J. Alse, 1993; Export Growth and Economic Growth:An Application of Cointegration and Error-Correction Modeling, Journal ofDeveloping Areas, Vol. 27, No. 4, pp.535-42.Pack, Howard, and Kamal Saggi, Is There a Case for Industrial Policy?
A Critical Survey, TheWorld Bank Research Observer, 21(2), 2006, 267-297.Park, Albert, Dean Yang, Xinzheng Shi and Yuan Jiang, 2006, Exporting
and Firm Performance: Chinese Exporters and the Asian Financial Crisis,Working Paper, No. 549, University of Michigan.Park, J. H. and P. B. Prime, 1997: Export Performance and Growth in
China: A Cross-Provincial Analysis, Applied Economics, Vol. 29, No. 13,pp. 53-63.Paul, S. and K. Chowdhury, 1995: Export-Led Growth Hypothesis: Some
Empirical Testing, Applied Economics Letters, Vol. 2, No. 6, pp. 177-79.Pavcnik, Nina, 2002. Trade Liberalization, Exit, and Productivity Im-
provement: Evidence from Chilean Plants., Review of Economic Stuides,69(1), 245-276.Pelzman J. and Amir Shoham, 2006, De-linking the Relationship between
Trade Liberalization and Reduced Domestic Fiscal Budgets: The Experienceof the Israeli Economy: 1984-2005, Global Economy Journal (6), Article 2.Pereira, A. M. and Xu, Zhenhui, 2000: Export Growth and Domestic
Performance, Review of International Economics, Vol. 8, No. 1, pp. 60-73.Piazolo, M., 1996: Determinants of Indonesian Economic Growth, 1965-
1992, Seoul Journal of Economics, Vol. 9, No. 4, pp. 269-98.Pineres, A. de-Sheila. and M. J. Ferrantino, 1997: Export Diversi�cation
and Structural Dynamics in the Growth Process: The Case of Chile, Journalof Development Economics, Vol. 52, No. 2, pp. 375-91.Pomponio, X. Z., 1996: A Causality Analysis of Growth and Export
Performance, Atlantic Economic Journal, Vol. 24, No. 2, pp. 168-76.Poole, Jennifer, 2008, Multinational Spillovers through Worker Turnover,
UC Santa CruzPorter, M., 1990, The Competitive Adtantage of Nations, New York: Free
Press (republished with a new introduction, 1998).Porter, M., 1998: Clusters versus Industrial Policy in On Competition,
HBS Press.Pritchett, L., 1996, Measuring Outward Orientation in LDCs: Can It Be
Done?, Journal of Development Economics (49), pp. 307-335.Ram, R., 1987: Exports and Economic Growth in Developing Countries:
Evidence from Time-Series and Cross-Section Data, Economic Development
103

and Cultural Change, Vol 36, pp. 51-71.22.Sheehey, E., 1990: Exports and Growth: A Flawed Framework, Jounral
of Development Studies, pp. 111-116.Rana, P. B., 1988: Exports, Policy Changes, and Economic Growth in
Developing Countries after the 1973 Oil Shock: Comments, Journal of De-velopment Economics, Vol. 28, No. 2, pp. 261-64.Rashid, A. I., 1995: Trade, Growth, and Liberalization: The Indian Ex-
perience, 1977-1989, Journal of Developing Areas, Vol. 29, No. 3, pp. 355-70.Redding, S. 1999: Dynamic Comparative Advantage and the Welfare
E¤ects of Trade, Oxford Economic Papers, Oxford University Press, vol.51(1), pages 15-39, January.Rhee, Y.W. and Belot, T., 1990, Export Catalysts in Low-income coun-
tries, World Bank Discussion Paper, No. 72.Riezman, R. G., Whiteman, C. H. and P. M. Summers, 1996: The Engine
of Growth or Its Handmaiden? A Time-Series Assessment of Export-LedGrowth, Empirical Economics, Vol. 21, No. 1, pp. 77-110.Rodríguez-Clare, A. 1996: Multinationals, Linkages and Economic De-
velopment, American Economic Review.Rodríguez-Clare, A. 1996: The division of labor and economic develop-
ment, Journal of Development Economics, Vol. 49, No. 1 (April).Rodríguez-Clare, A. 2007: Clusters and Comparative Advantage: Impli-
cations for Industrial Policy, Journal of Economic Development, Volume 82,Issue 1, January 2007, Pages 43-57.Rodriguez, Francisco., 2008, Policymakers Beware: The Use and Misuse
of Regressions in Explaining Economic Growth, Policy Research Brief 5,International Poverty Centre.Rodriguez, Francisco and Dani Rodrik, 1999, Trade Policy and Economic
Growth: A Skeptic�s Guide to Cross-National Evidence, NBER WorkingPaper, No. W7081.Rodrik, Dani., 1996, Understanding Economic Policy Reform, Journal of
Economic Literature (XXXIV), pp. 9-41.Rodrik, D. 2004: Industrial Policy for the Twenty-First Century, Harvard
University.Rodrik, Dani., 2006, What�s So Special about China�s Exports?, China
and World Economy (14), pp. 1-19.Rodrik, Dani., 2007, Industrial Development: Stylized Facts and Policies,
in United Nations, Industiral Development for the 21st Century, U.N., NewYork.
104

Rodrik, Dani., A. Subramanian and F. Trebbi, 2004, Institutions Rule:The Primary of Institutions over Geography and Integration in EconomicDevelopment, Journal of Economic Growth (9), pp. 131-165.Romalis, J., 2007: Market Access, Openness and Growth, National Bu-
reau of Economic Research, Inc, NBER Working Papers: 13048.Romer, Paul., 1986, Increasing Returns and Long-run Growth, Journal
of Political Economy (94), pp. 1002-37.Romer, Paul., 1990, Endogenous Technological Change, Journal of Polit-
ical Economy (98), pp. s71-102.Romer, Paul., 1994, The Origins of Endogenous Growth, Journal of Eco-
nomic Perspectives (8), pp. 3-22.Rosenthal, S. S. and W. C. Strange, 2004: Evidence on the Nature and
Sources of Agglomeration Economies, Handbook of Regional and Urban Eco-nomics, Volume 4, edited by J.V. Henderson and J.F. Thisse.Rosenthal, S. S. and W. C. Strange, 2005: The Micro-Empirics of Ag-
glomeration Economies, in Blackwell Companion to Urban Economics, editedby R. Arnott and D. McMillen.Ruane, Frances and Ali Ugur., 2002: Foreign Direct Investment and Pro-
ductivity Spillovers in Irish Manufacturing Industry: Evidence from FirmLevel Panel Data, Trinity Economic Papers 02/06, Trinity College, Dublin.Sachs Je¤rey D. and Andrew M. Warner, 1995, Natural Resource Abun-
dance and Economic growth, NBER Working Paper, No. W5398.Salvatore, D. and T. Hatcher, 1991: Inward Oriented and Outward Ori-
ented Trade Strategies, Journal of Development Studies, Vol. 27, No. 3, pp.7-25.Salvatore, D., 1983: A Simultaneous Equations Model of Trade and De-
velopment with Dynamic Policy Simulations, A Model of Trade and Devel-opment, Vol 36, pp. 66-90.Sauré, P. 2007: Revisiting the Infant Industry Argument, Journal of De-
velopment Economics, Vol. 84, pp. 104-117.Sengupta, J. and J. R. Espana, 1994: Exports and Economic Growth in
Asian NICs: An Econometric Analysis for Korea, Applied Economics, Vol.26, pp. 41-51.Serletis, A., 1992: Export Growth and Canadian Economic Development,
Journal of Development Economics, Vol 38, pp. 133-145.Shan, Jordan and F. Sun, 1998a: Domestic Saving and Foreign Invest-
ment in Australia: A Granger Causality Test, International Economics Jour-nal, Vol. 12, No, 4, pp. 79-87.
105

Shan, Jordan and F. Sun, 1998b: On the Export-Led Growth Hypothesis:The Econometric Evidence from China, Applied Economics, Vol. 30, No.8,pp. 1055-65.Shan, Jordan and F. Sun, 1998c: On the Export-Led Growth Hypothesis
for the Little Dragons: An Empirical Reinvestigation, Atlantic EconomicJournal, Vol. 26, No.4, pp. 353-71.Sharma, S. C. and D. Dhakal, 1994: Causal Analysis Between Exports
and Economic Growth in Developing Countries, Applied Economics, Vol. 26,pp. 1145-1157.Sharma, S. C., Norris, M. and D. W. W. Cheung, 1991: Exports and
Economic Growth in Industrialized Countries, Applied Economics, Vol. 23,pp. 697-707.Sheehey, E. J., 1992: Exports and Growth: Additional Evidence, Journal
of Development Studies, Vol. 28, No. 4, pp. 730-34.Singer, H. W. and P. Gray,1988: Trade Policy and Growth of Developing
Countries: Some New Data, World Development, Vol. 16, No. 3, pp. 395-403.Singh, T., 2003: E¤ects of exports on productivity and growth in India:
an industry-based analysis, Applied Economics, Vol. 35, pp. 741� 749.Sjoholm, Fredrik., 1999a: Technology Gap, Competition and Spillovers
from Direct Foreign Investment: Evidence from Establishment Data, Journalof Development Studies, Vol. 36, pp. 53-73.Sjoholm, Fredrik., 1999b: Productivity Growth in Indonesia: The Role
of Regional Characteristics and Direct Foreign Investment, Economic Devel-opment and Cultural Change, Vol. 47, pp. 559-584.Smarznka, Beata K., 2002: Does Foreign Direct Investment Increase the
Productivity of Domestic Firms? In search of Spillovers through BackwardLinkages, World Bank Policy Rerearch Working Paper 2923.Smarzynska-Javorcik, B., 2004, Does Foreign Direct Investment Increase
Productivity of Domestic Firms? In Search of Spillovers through BackwardLinkages, American Economic Review 94 (3), pp. 605-627.Spencer, Barbara J. and Brander, James A. August 1983. International
R&D rivalry and industrial strategy. NBER Working Paper Series Vol.w1192, .Succar, P., 1987: The Need for Industrial Policy in LDCs - A Re-statement
of the Infant Industry Argument, International Economic Review, Vol. 28,No. 2 (June).
106

Thangavelu, S. M. and G. Rajaguru, 2004: Is There an Export or Import-Led Productivity Growth in Rapidly Developing Asian Countries? A Multi-variate VAR Analysis, Applied Economics, Vol. 36, No. 10, pp. 1083-93.Thornton, J., 1996: Cointegration, causality and export-led growth in
Mexico, 1895-1992, Economic Letters, Vol 50, pp. 413-416.Topalova, P., 2004, Trade Liberalization and Firm Productivity: The
Case of India, International Monetary Fund Working Paper, No. 04/28.Tybout, J. 1992. Linking Trade and Productivity: New Research Direc-
tions, World Bank Economic Review 6 (May), pp. 198-211.Tybout James R. and M. Daniel Westbrook, 1995, Trade Liberalization
and the Dimensions of E¢ ciency Change in Mexican Manufacturing Indus-tries, Journal of International Economics (39), pp. 53-76.Tyler, William G., 1981: Growth and Export Expansion in Developing
Countries, Journal of Development Economics, vol 9, pp. 121-130.41.Ukpolo, V., 1994: Export Composition and Growth of Selected Low-
Income African Countries: Evidence from Time-Series Data, Applied Eco-nomics, Vol. 26, pp. 445-449.Vamvakidis, A., 1998: Regional Trade Agreements Versus Board Lib-
eralization: Which Path Leads to Faster Growth? Time-Series Evidence,International Monetary Fund, IMF Working Papers: 98/40.Wacziarg R. and Karen H. Welch, 2003, Trade Liberalization and Growth:
New Evidence, NBER Working Papers, No. 10152.Wade, R., 1990: Governing the Market: Economic Theory and the Role
of Government in East Asian Industrialization, Princeton University Press.Weinhold, D. and J. E. Rauch, 1999: Openness, Specialization, and Pro-
ductivity Growth in Less Developed Countries, Canadian Journal of Eco-nomics, Vol. 32, No. 4., pp. 1009-27.Wilbur, William. L and Mohammed. Z. Haque., 1992: An Investigation
of the Export Expansion Hypothesis, Jounral of Development Studies, Vol28, no. 2, pp.297-313.World Bank, 1993, The East Asian Miracle: Economic Growth and Public
Policy, Oxford University Press.Xu. Bin and Xianmao. Wang, 1999: Capital Goods Trade and R&D
Spillovers in the OECD, The Canadian Journal of Economics, Vol. 32, No.5, pp. 1258-1274.Yaghmaian, B., 1994: An Empirical Investigation of Exports, Develop-
ment, and Growth in Developing Countries: Challenging the Neoclassical
107

Theory of Export-Led Growth, World Development, Vol. 22, No. 12, pp.1977-1995.Yanikkaya, H., 2003: Trade Openness and Economic Growth: A Cross-
Country Empirical Investigation, Journal of Development Economics, Vol.72, No. 1, pp. 57-89.Young, A., 1991, Learning by Doing and the Dynamic e¤ects of Interna-
tional Trade, Quarterly Journal of Economics (106), pp. 369-405.Zagha, Roberto and Gobind T. Nankani, 2005, Economic Growth in the
1990s: Learning from a Decade of Reform, World Bank Publication.Zukowska-Gagelmann, Katazyna, 2002: Productivity Spillovers from Foriegn
Direct Investment in Poland, Economic Systems, forthcoming.
108

Table 1 Cross‐country studies on openness and growth
Study author and date
Measure of openness Data description Identification strategy Does openness increase growth?
1. Tyler (1981) (1) Annual average real growth rate of total exports; (2) Manufacturing sector export earnings
Cross‐sectional data for 55 middle‐income developing countries from 1960 to 1977
No identification strategy Significant positive impact of exports on economic growth
2. Feder (1982) (1) Export growth export/GDP ratio; (2) Growth rate of exports (in specific inter‐sectoral externalities regression)
Pooled data from 31 semiindustrialized countries and 17 developed countries between 1964 and 1973
No identification strategy Significant positive impacts of exports on economic growth (exported‐oriented policies) bring the economy closer to an optimal allocation of resources
3. Salvatore (1983) Growth of percentage of exports in GDP
Pooling of cross section and time‐series data for 52 developing countries from 1961 to 1978
Full information maximum likelihood (FIML); uses consumer price index (CPI) and index of real GDP of all market economics as instruments for exports
No significant positive impact of exports on economic growth. Trade is very important to the development process, but more in the nature of a handmaiden than as an engine of growth. The policy implication is that excessively pursuing a policy of industrialization through import substitution can retard growth
4. Balassa (1985) (1) Export growth share of exports in GDP; (2) Trade orientation (the deviation of actual from hypothetical value of per capita exports)
Pooled data for 43 semiindustrialized countries from 1973 to 1979
No identification strategy The results show that the growth rate of GNP is higher with a greater extent of outward orientation at the beginning of the study period and the greater the extent of reliance on export promotion in response to the external shocks of the period
5. Gupta (1985) Growth rate of exports Time‐series data for (1) South Korea from the first quarter of 1960 to the last quarter of 1979 and (2) Israel from 1967 to 1981
Sims causality test Bidirectional causality between exports and economic growth for both countries

6. Jung and Marshall (1985)
Growth rate of real value of exports
Time series, annual data for 37 developing countries from 1951 to 1981
Granger causality test Export‐led growth in only five countries while no causality in 20 countries
7. Kavoussi (1985) (1) RX: growth of a specific country’s total export earnings; (2) RW: growth of a country’s export earnings due to expansion of world demand for its traditional commodities; (3) RC: a rise in the share of world markets for a country’s traditional commodities; (4) RD: an increase in the share of nontraditional commodities in a country’s total exports; (5) RCD: an indicator of the effect of trade policy (where
RCD = (1 + RC) (1 + RD) 1; values greater than or equal to 0 imply an outward trade orientation, while values less than 0 imply an inward trade orientation
Cross‐sectional data for 52 low‐ and middle‐income developing countries from 1967 to 1977
No identification strategy Firstly, the study shows that a rapid expansion of export earnings requires both favorable external markets and outward‐oriented commercial policies. Secondly, the results suggest that free trade appears to enhance growth only when external demand is favorable

8. Chow (1987) Export growth in manufactured goods
Time series, annual data for eight newly industrializing countries (NICs) from the 1960s and 1970s
Sims causality test Export‐led growth in only Mexico, strong bidirectional causality between export growth and industrial development in other seven countries
9. Darrat (1987) Growth rate of real value of exports
Time series, annual data for Hong Kong, Korea, Taiwan, and Singapore from 1955 to 1982
White’s causality test Exports and economic growth are significantly and positively correlated. Causality runs from exports to economic growth only in Korea. For the remaining three countries, the export‐led growth hypothesis is rejected
10. Goncalves and Richtering (1987)
(1) Annual average growth rate of total export volume in 1975 prices; (2) Average share of exports in GDP; (3) Change in share of exports in GDP in each period
Pooled data for 70 developing countries from 1960 to 1981
No identification strategy No significant positive impact of exports on GDP net of exports
11. Hsiao (1987) Exports Time series, annual data for Hong Kong, Korea, Taiwan, and Singapore during the 1960s, 1970s, and 1980s
Granger and Sims causality tests
The Sims’ test indicates a feedback relationship while the Granger’s test indicates no causal relation between the exports and GDP, except for Hong Kong where both tests indicate a unidirectional causality from GDP to exports
12. Ram (1987) (1) Export growth rates; (2) Export
growth rates export GDP shares Time‐series and cross‐sectional data for 88 countries from 1960 to 1972 and 1973 to 1982
No identification strategy Significant positive impact of exports on economic growth

13. Grabowski (1988)
(1) Growth of exports; (2) Share of exports in GDP
Time series, annual data for Japan from the 1880s to the 1940s
Single and simultaneous equations; uses the volume of world trade and the time period as instruments for the growth of exports
The results show that growth in Japan was not export led, in the sense that external demand stimulated rapid export growth resulting in substantial economic growth. Using a simulation analysis, it was found that policies aimed at export promotion had a positive impact on economic growth
14. Rana (1988) (1) Export growth rate; (2) Export
growth rate share of exports in GDP
Pooled data for 43 developing countries
No identification strategy Supports the view that exports would have less effect on growth when the world environment is unfavorable
15. Singer and Gray (1988)
(1) Growth of country’s total export earnings; (2) Trade policy
factor RCD = (1 + RC) (1 + RD), where RC is the competitiveness factor and RD is the diversification factor. Positive values of RCD represent outward trade orientation
Pooled data for 52 developing countries from 1967 to 1973 and 1977 to 1983
No identification strategy Positive impact of exports on economic growth under favorable world market conditions; however, this positive impact is weaker for low‐income countries
16. Kohli and Singh (1989)
(1) Growth of exports; (2) Export share in GDP; (3) Growth of
exports share of exports in GDP
Pooled data for 30 countries from 1960 to 1970 and 1970 to 1981
No identification strategy Significant positive impact of exports on economic growth in export‐oriented nations. The impact is subject to diminishing returns
17. Kunst and Marin (1989)
Manufacturing sector exports Time series, annual data for Australia
Granger causality test Positive causality from productivity to exports
18. Mbaku (1989) Growth rate of exports Pooled data for 37 African countries from 1970 to 1981
No identification strategy The results show that export expansion significantly enhances economic growth in Africa

19. Koschos (1989) Growth rate of real exports Cross‐sectional data for 71 developing countries from 1970 to 1980
No identification strategy The evidence contradicts the view that among “more advanced” developing economies the effect of export expansion on growth is stronger than among “less advanced” ones. In fact, among “less developed” countries output growth is mainly influenced by export expansion and capital formation, its response to labor growth being highly significant
20. Fosu (1990) Annual export growth Cross sectional data for 28 least‐developed countries (LDCs) in Africa from 1960 to 1970 and 1970 to 1980
No identification strategy Significant positive impact of exports on economic growth, but this positive relationship is smaller compared to other LDCs
21. Grabowski, Sharma, and Dhakal (1990)
Growth of exports Time series, annual data for Japan from 1885 to 1939 and 1952 to 1980
Granger causality test No export‐led growth in pre‐World War II period but export‐led growth in post‐World War II
22. Sheehey (1990) Export growth share of exports in GDP
Pooled data for 36 countries from 1960 to 1970
No identification strategy This is a critique of Balassa and Feder’s work particularly. The author argues that, since the link between sectoral growth and growth of GDP is common to all sectors, the growth clearly cannot be due to relative productivity differences and externality effects. By showing the same tests that support the “promotion” of all major components of GDP, the author argues that the previous tests have no bearing at all on the export‐promotion/import‐substitution controversy
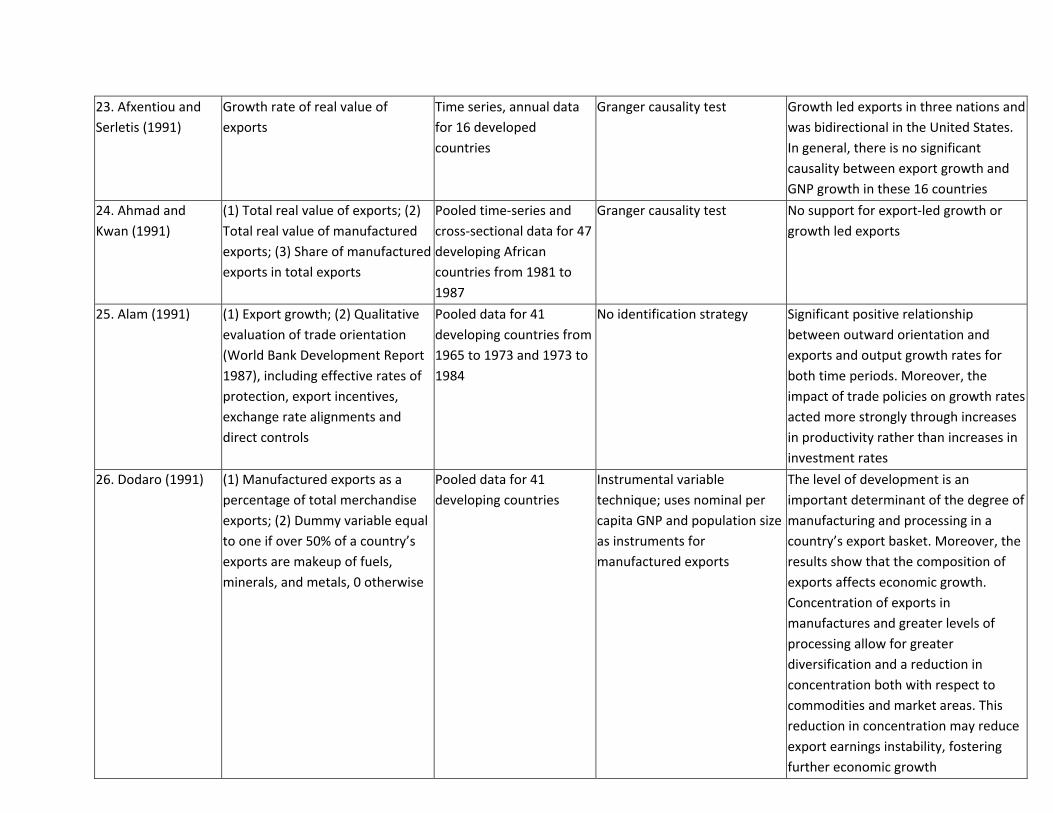
23. Afxentiou and Serletis (1991)
Growth rate of real value of exports
Time series, annual data for 16 developed countries
Granger causality test Growth led exports in three nations and was bidirectional in the United States. In general, there is no significant causality between export growth and GNP growth in these 16 countries
24. Ahmad and Kwan (1991)
(1) Total real value of exports; (2) Total real value of manufactured exports; (3) Share of manufactured exports in total exports
Pooled time‐series and cross‐sectional data for 47 developing African countries from 1981 to 1987
Granger causality test No support for export‐led growth or growth led exports
25. Alam (1991) (1) Export growth; (2) Qualitative evaluation of trade orientation (World Bank Development Report 1987), including effective rates of protection, export incentives, exchange rate alignments and direct controls
Pooled data for 41 developing countries from 1965 to 1973 and 1973 to 1984
No identification strategy Significant positive relationship between outward orientation and exports and output growth rates for both time periods. Moreover, the impact of trade policies on growth rates acted more strongly through increases in productivity rather than increases in investment rates
26. Dodaro (1991) (1) Manufactured exports as a percentage of total merchandise exports; (2) Dummy variable equal to one if over 50% of a country’s exports are makeup of fuels, minerals, and metals, 0 otherwise
Pooled data for 41 developing countries
Instrumental variable technique; uses nominal per capita GNP and population size as instruments for manufactured exports
The level of development is an important determinant of the degree of manufacturing and processing in a country’s export basket. Moreover, the results show that the composition of exports affects economic growth. Concentration of exports in manufactures and greater levels of processing allow for greater diversification and a reduction in concentration both with respect to commodities and market areas. This reduction in concentration may reduce export earnings instability, fostering further economic growth

27. Esfahani (1991) (1) Share of imports in
GDP growth rate of imports; (2)
Share of exports in GDP growth rate of exports
Cross‐sectional data for 31 semiindustrialized countries from 1960 to 1973, 1973 to 1981, and 1980 to 1986
Simultaneous equations; uses log GDP per capital and log labor as instruments for export and import variables
Export promotion is particularly important for countries that cannot obtain sufficient foreign aid or capital
28. Kwan and Cotsomotis (1990)
Ratio of exports to national income (the growth rate of exports to national income is used as a robustness check)
Time series, annual data for China from 1952 to 1985
Granger causality test Bidirectional causality between exports and economic growth for the postreform period (since 1978), but no causality for the prereform period
29. Oskooee, Mohtadi, and Shabsigh (1991)
Export growth Time series, annual data for 20 LDCs from the 1950s to the 1980s
Granger causality test with Akaike’s optimal lag criterion
The study indicates positive causality from economic growth to export growth in 4 out of 20 countries (Korea, Nigeria, South Africa, and Thailand) and negative causality in Indonesia. Korea and Thailand exhibit positive causality in both directions
30. Salvatore and Hatcher (1991)
Growth rate of real value of exports
Time series and pooled, annual data for 26 developing countries from 1963 to 1973 and 1973 to 1985
No identification strategy The econometric results only partially support the hypothesis that international trade benefits most developing countries and that an outward orientation leads to a more efficient use of resources and growth
31. Sharma, Norris, and Cheung (1991)
Export growth Time series, quarterly data for five industrialized countries from 1960 to 1987
Granger causality test Export‐led growth for Germany and Japan, while growth led exports for the United States and the United Kingdom. There was no causality in either direction for Italy

32. Dollar (1992) (1) Dollar measure of outward
orientation: RPLi = 100 ePi/Pu.s., where RPLi is the index of country is relative price level, e is the exchange rate, and Pi is the consumption price index for country i; (2) Variability of the real exchange rate
Cross‐sectional data for 95 countries from 1976 to 1985
No identification strategy Significant negative relationship between distortion in the real exchange rate and growth of per capita GDP after controlling for the effects of real exchange rate variability and investment level. Trade liberalization, devaluation of the real exchange rate and maintenance of a stable real exchange rate could improve growth performance in poor countries
33. Edwards (1992) (1) Index of trade intervention; (2) INVERV1, overall intervention index obtained when a homoskedastic (unscaled) model is used to predict trade flows for the 183 commodities in the sample; (3) INVERV2, overall intervention index obtained when a heteroskedastic (scaled) model with residuals proportional to GNP is used; (4) OPEN1, overall openness index obtained from the unscaled trade model; (5) OPEN2, overall openness index obtained from the residuals of the scaled trade model; (6) OPENM1, manufacturing sector openness index obtained from the unscaled trade model; (7) OPENM2, manufacturing sector openness index obtained from the scaled heteroskedastic trade model
Cross‐sectional data for 30 developing countries from 1970 to 1982
Instrumental variable technique; uses the average and coefficient of variation of the black‐market premium to identify the level of trade restrictions
A strong positive relationship exists between trade orientation and economic performance. The relationship is robust to the method of estimation, to correction for errors in variables and to the deletion of outliers

34. Egwaikhide (1992)
(1) Natural log of real value of oil exports; (2) Natural log of real value of oil imports
Time series, annual data for Nigeria from 1973 to 1978
Instrumental variable technique; uses the natural logs of the lags of real imports and the price for crude oil as instruments for real exports
Crude oil exports have only marginally stimulated the growth of output in Nigeria
35. Giles, Giles, and McCann (1992)
Real value of exports Time series, annual data for New Zealand from 1963 to 1991
Granger causality test The study finds mixed evidence for the export‐led growth hypothesis when they use growth rates of exports and output. While they reject the hypothesis at the aggregate level, there is some support for the ELG of certain exporting sectors (such as minerals, chemicals, plastics, metal, metal products, live animals, and meat). However, replacing levels of exports and output with growth rates, there is causality from real exports of manufactured goods, meat, and live animals to real GDP
36. Hutchison and Singh (1992)
Growth rate of real value of exports
Time series, annual data for 34 developing countries from the 1950s to the 1980s
Granger causality test 11 countries showed evidence of significantly positive export externality effects contributing to nonexport sector domestic growth. Three countries showed evidence of externalities in the nonexport sector contributing to export growth and three countries showed evidence of negative externalities

37. Levine and Renelt (1992)
(1) Exports as a percentage of GDP; (2) Imports as a percentage of GDP; (3) Leamer’s (1988) openness measure based on factor‐adjusted trade; (4) Leamer’s(1988) trade‐distortion measure based on H‐O deviations; (5) Black‐market exchange‐rate premium; (6) Dollar’s (1992) real exchange‐rate distortion for SH benchmark countries
Pooled data for 119 countries from 1960 to 1989
No identification strategy Significant positive correlation between share of investment in GDP and share of trade in GDP. None of the measures of openness are robustly correlated with growth when other explanatory variables are introduced
38. Marin (1992) Log of exports of manufacturing goods (quarterly observations)
Time‐series data for the United States, the United Kingdom, Japan, and Germany
Granger causality test Exports cause labor productivity in all the countries studied. The hypothesis of export‐led growth cannot be rejected
39. Serletis (1992) (1) Log of exports; (2) Log of imports
Time series, annual data for Canada from 1870 to 1985
Granger causality test Causality from exports to growth but no causality from imports to growth
40. Sheehey (1992) (1) Share of exports in GDP; (2) Growth rate of share of exports in GDP; (3) Average annual growth rate of exports
Pooled data for 53 nonoil exporting and six developed countries from 1960 to 1981
No identification strategy Significant positive impact of exports only during favorable world demand and in industrialized countries
41. Wilbur and Haque (1992)
Natural log of exports Time series, annual data for 11 developing and six developed countries from 1960 to 1972 and 1973 to 1987
No identification strategy Supports the “export expansion” hypothesis, emphasizing the significant importance of exports in the formation of savings for both highly developed and less developed countries

42. Alege (1993) (1) Real value of total exports; (2) Real value of oil exports
Time series, annual data for Nigeria from covering the period of 1960‐1985
Granger causality test The results show the existence of strict econometric exogeneity between exports and GDP and a unidirectional causality from GDP to oil exports. No causality from total export growth (or oil export growth) to GDP growth
43. Dodaro (1993) Manufactured exports as a percentage of total merchandise exports
Time series, annual data for a wide range of LDCs
Granger causality test The causality test shows very little support for the basic export‐promotion contention. There are two main results of this study: first, the level of development is an important determinant of the degree of manufacturing and processing in a country’s export basket; second, the efficiency of export‐led growth depends on the composition of exports and the stage of development
44. Ghartey (1993) Log of exports Time series, seasonally adjusted quarterly data for Taiwan, Japan, and the United States
Stepwise Granger causality test (Hsiao’s version of Granger causality test)
Exports cause economic growth in Taiwan; economic growth causes exports in the United States; and there is bidirectional causality in Japan
45. Gordon and Sakyi‐Bekoe (1993)
Real value of exports Time series, annual data for Ghana from 1955 to 1987
Granger causality test, Sims model, modified Sims model, Akaike final prediction (error model) and the nonparametric multiple rank F‐test model
Causality results vary depending upon the model used for testing and the lag specification defined. The violation of the normality assumption leads the Granger model to the apparently incorrect conclusion that GDP causes exports

46. Khan and Saqib (1993)
Natural log of real value of total exports, manufactured exports and primary exports
Time series, annual data for Pakistan from 1972 to 1988
Simultaneous equations; uses foreign income and the index of domestic export prices to world export prices to identify the export demand function, and uses the effective exchange rate index and the relative price index to identify the export supply function
A strong positive association between export performance and economic growth is found, but more than 90% of the contribution of exports to economic growth is indirect in nature
47. Oskooee and Asle (1993)
Real value of exports Time series, quarterly data for nine LCDs
Granger causality tests with the new techniques of cointegration and error‐correction models
The results indicate bidirectional causality for all countries (except for Malaysia for which there is no cointegration) between export growth and economic growth when the cointegrating properties of the time series are incorporated into the analysis
48. Oxley (1993) Natural log of real value of exports Time series, annual data for Portugal from 1833 to 1985
Granger causality test The export‐led growth hypothesis is rejected in favor of reverse causality
49. Sengupta (1993) (1) Export growth; (2) Export
growth share of exports in GDP Time series, annual data, mainly focused on newly industrialized countries (NICs) in Asia including Japan, the Philippines, South Korea, and Taiwan, from the 1960s to the 1980s
No identification strategy The empirical evidence supports the basic premises of the new growth theory in the case of the successful NICs in Asia and for Korea, in particular

50. Atesoglu (1994) Growth rate of real value of exports
Time series, annual data for the United States from the 1960s to the 1980s
Instrumental variables technique; uses the rate of growth of external prices and the rate of growth of the world’s real income to instrument for exports
The export‐led Kaldor growth model interprets and predicts the short‐run fluctuation in the growth rate of the US economy. Moreover, the dynamic Harrod foreign trade multiplier rule of Thirlwall is not preferable to the Kaldorian model for explaining annual changes in the US rate of growth
51. Coppin (1994) (1) Real exports; (2) Growth rate of real exports; (3) Share of manufactured exports in total exports; (4) Share of the growth rate of manufactured exports in total exports
Pooled data for 59 low‐ and middle‐income countries during the 1980s
No identification strategy Positive impact of exports (but not manufactured exports) on economic growth. The results also show that the growth in the labor force was an important factor in explaining growth
52. Dutt and Ghosh (1994)
Real value of exports Time series, annual data for 26 low‐, middle‐, and high‐income countries from 1953 to 1991
No identification strategy For the majority of the countries in the sample, export growth and economic growth have moved together
53. Greenaway and Sapsford (1994a)
Growth rate of share of exports in GDP
Cross‐sectional data for 104 countries from 1960 to 1988
No identification strategy The results support the hypothesis that exports and growth are positively correlated. This relationship is robust to variations in the composition of the country samples. Moreover, the strength of the association varies from subperiod to subperiod, but the positive association becomes stronger over time. Export growth does not always follow reform

54. Greenaway and Sapsford (1994)
Growth rate of share of exports in GDP
Time series, annual data for five developing countries from 1956 to 1988
No identification strategy Significant positive impact of exports on economic growth for Sri Lanka, but negative for Turkey
55. Hansen (1994) (1) Growth rate of
exports percentage of exports in GDP; (2) Growth rate of exports of manufactured goods and
services percentage of manufacturing and service exports in GDP; (3) Growth rate of “other”
commodity exports percentage of “other” commodity exports in GDP
Time series, annual data for New Zealand from 1968 to 1991
Engle‐Granger cointegration test
Exports of manufactures and services have had a greater effect on the economy’s recent growth experience than exports of primary products and raw materials
56. Hotchkiss, Moore, and Rockel (1994)
(1) Annualized growth rate of exports weighted by the proportion of exports in GNP; (2) Annualized growth rate of exports (unweighted)
Annual data for 85 countries from 1960 to 1986
No identification strategy The results indicate that exports contribute to growth through both a sector‐externality effect and a factor‐productivity effect for middle income countries, but only through a factor‐productivity effect for low‐income countries
57. Love (1994) Export growth Time series, annual data for 20 developing countries from the 1960s to the 1990s
Granger causality test Substantial support for the hypothesis that exports cause growth. In 14 out of 20 countries there is evidence of causality from export growth to GDP growth, with causality being positive for 10 countries and negative for 4. The export‐led results are highly sensitive to the definition of economic growth

58. Sengupta and Espana (1994)
(1) Time derivative of exports; (2) Average share of exports in GDP; (3) Real export growth
Time series, annual data for Japan, the Philippines, Taiwan, Thailand, and South Korea from the 1960s to the 1980s
Engle‐Granger cointegration test
The externality effect of exports and their productivity growth played the role of a catalyst for other sectors’ growth. Exports and output are cointegrated and there is evidence of a significant positive impact of exports on economic growth, particularly in South Korea
59. Sharma and Dhakal (1994)
Growth rate of real value of exports
Time series, annual data for 30 developing countries from 1960 to 1988
Granger causality test Causal relationship between export growth and output growth is found in five countries; export‐led growth is found in six; output growth causes export growth in eight; no causal relationship for remaining countries. No causal relationship between export and output growth for South Korea
60. Ukpolo (1994) Annual percentage growth rates of exports of fuel products
Time series, annual data for eight low‐income African countries from 1969 to 1988
No identification strategy Significant positive impact of nonfuel primary exports on economy
61. Yaghmaian (1994)
(1) Exports in constant prices; (2) Average annual growth rate of exports
Pooled and time‐series data for 66 developing countries from 1971 to 1980 and 1981 to 1990
No identification strategy A positive and statistically significant association was obtained between export growth and the growth of output when population statistics were used for the labor variable in the neoclassical growth model. However, when substituting employment for population, there was no statistical support for export‐led growth
62. Ahmad and Harnhirun (1995)
Real exports evaluated in per capita terms in 1980 prices
Time series, annual data for five Asian countries from 1966 to 1990
Granger causality test with error‐correction model
Causality between exports and economic growth in both directions for Singapore

63. Amirkhalkhaili and Dar (1995)
Growth rate of real value of exports
Time series, annual data for 23 developing countries from the 1960s to the 1990s
No identification strategy There is evidence of export‐led growth for all except the strongly inward‐oriented group of countries. No major difference between moderately inward‐oriented countries and moderately and strongly outward‐oriented countries in terms of the impact of export expansion on economic growth
64. Clark (1995) (1) Qualitative evaluation of trade orientation (World Bank Development Report 1987), including effective rates of protection, export incentives, exchange rate alignments, and direct controls; (2) Real export growth
Time series and pooled, annual data for 35 developing countries from 1973 to 1985
No identification strategy Significant positive impact of exports and outwardly oriented trade policy on industrial diffusion rather on output growth
65. Coe and Helpman (1995)
(Ratio of imports of goods and
services to GDP) (Natural log of foreign R&D capital stock)
Pooled data for 21 OECD countries and Israel from 1971 to 1990
No identification strategy Demonstrates the extent to which a country’s total factor productivity depends not only on domestic R&D capital but also on foreign R&D. Foreign R&D has beneficial effects on domestic productivity and the result is stronger when the country is more open to foreign trade
66. Holman and Graves (1995)
First difference of log of exports Time series, annual data for South Korea from 1953to 1990
Granger and Sims causality tests
The Sims results found consistent two‐way exogeneity between exports and GNP growth. The Granger causality results indicate that there is bidirectional causality between exports and economic growth

67. Jin (1995) (1) Natural log of real value of goods exported; (2) Natural log of world commodity price level for all exports (used as a proxy for foreign price shocks); (3) Natural log of industrial production index for all industrial countries (used as a proxy for foreign output shocks)
Time series, seasonally adjusted quarterly data for Hong Kong, Singapore, South Korea, and Taiwan from 1973 to 1993
Granger causality tests The results from the variance decompositions indicate significant feedback relations between exports and output for Hong Kong, Singapore, and South Korea, which can be interpreted to suggest that in the short run, economic growth and export growth reinforce each other. However, the Granger cointegration test suggests that no long‐run equilibrium exists between exports and the level of output
68. Jin and Yu (1995) Exports of goods and services Time series, seasonally adjusted quarterly data for Korea, Japan, Canada, and the United States
Granger causality test The results do not support the causal implication of the export‐led growth hypothesis. For Korea and Japan, there is bidirectional causality between export growth and GNP growth; for Canada and the United States, growth led exports
69. Kwan and Kwok (1995)
Export growth Time series, annual data for China from 1952 to 1985
Granger causality test Exports led growth including instantaneous causality

70. Lee (1995) (1) Ratio of imported to domestic capital goods; (2) Ratio of imports to investment; (3) Share of imports in GDP
Cross‐sectional data for 79 countries from 1960 to 1985
Instrumental variable technique; uses land size, distance from trade distortion as instruments for openness measures
The ratio of imported to domestically produced capital goods in the composition of investment has a significant positive impact on per capita income growth rates across countries, and for developing countries in particular. Moreover, the ratio of foreign to domestic components of investment is an important factor in economic growth. The policy implication is that any trade distortions that restrict the importance of capital goods hurt the economy in the long run
71. McCarville and Nnadozie (1995)
Real value of exports Time series, annual data for Mexico from 1926 to 1988
Granger causality test Supports the export‐led growth argument
72. Paul and Chowdhury (1995)
Natural log of growth rate of real exports
Time series, annual data for Australia from 1949 to 1991
Granger causality test There is evidence of Granger causality running from exports to GDP growth, implying that expansion of exports promotes economic growth in Australia
73. Rashid (1995) Growth of the real value of exports Time series, annual data for India from 1960 to 1989
2SLS, four equations multivariate simultaneous model; uses RER and LW to instrument for the growth rate of exports. Note: RER is the
nominal exchange rate producer prices in the United States divided by India’s CPI as a percentage change; LW is world income
The results support that idea that trade is the handmaiden of growth and suggest that domestic factors play a more important role in increasing growth rates. Furthermore, the study shows that liberalization has not had a significant effect on industrialization and investment in the study period
74. Abhayaratne (1996)
Logs of real exports and imports (measured in 1985 prices)
Time series, annual data for Sri Lanka from 1960 to 1992
Granger causality test The results reject the notion that foreign trade stimulates economic growth
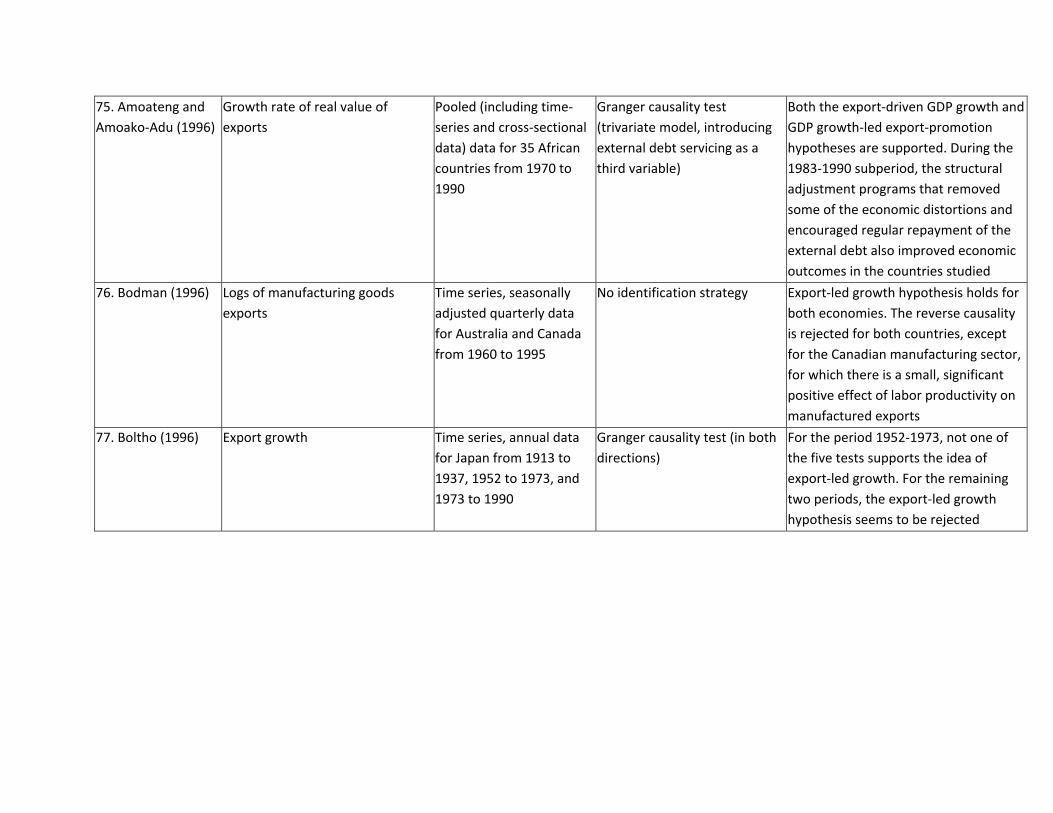
75. Amoateng and Amoako‐Adu (1996)
Growth rate of real value of exports
Pooled (including time‐series and cross‐sectional data) data for 35 African countries from 1970 to 1990
Granger causality test (trivariate model, introducing external debt servicing as a third variable)
Both the export‐driven GDP growth and GDP growth‐led export‐promotion hypotheses are supported. During the 1983‐1990 subperiod, the structural adjustment programs that removed some of the economic distortions and encouraged regular repayment of the external debt also improved economic outcomes in the countries studied
76. Bodman (1996) Logs of manufacturing goods exports
Time series, seasonally adjusted quarterly data for Australia and Canada from 1960 to 1995
No identification strategy Export‐led growth hypothesis holds for both economies. The reverse causality is rejected for both countries, except for the Canadian manufacturing sector, for which there is a small, significant positive effect of labor productivity on manufactured exports
77. Boltho (1996) Export growth Time series, annual data for Japan from 1913 to 1937, 1952 to 1973, and 1973 to 1990
Granger causality test (in both directions)
For the period 1952‐1973, not one of the five tests supports the idea of export‐led growth. For the remaining two periods, the export‐led growth hypothesis seems to be rejected

78. Burney (1996) Export growth Cross‐sectional data from 1965 to 1980 and 1980 to 1990, which consists of 89 and 95 countries, respectively
No identification strategy The study confirms that there is a positive relationship between exports and economic growth. However, the relationship is significant only for the period 1980‐1990. Moreover, the level of significance of the impact of exports on economic growth is relatively higher for high‐income economies
79. Cheng and Chu (1996)
Natural log of exports in constant dollars
Time series, annual data for the United States from 1940 to 1990
Granger causality test The results show bidirectional causality between exports and economic growth
80. Doraisami (1996) Growth rate of real values of exports
Time series, annual data for Malaysia from 1963 to 1993
Engle‐Granger causality test The study provides strong empirical support for bidirectional causality between exports and output and a positive long‐run relationship between exports and growth
81. Dutt and Ghosh (1996)
Real value of exports Time series, annual data for 26 developed and developing countries
Engle‐Granger cointegration and causality tests with error‐correction model
The study provides evidence of cointegration in only 14 countries. It shows that export causes growth in five countries, while growth causes exports in two countries. Bidirectional causality is found in three countries, and no causality is found in four countries

82. Fosu (1996) (1) Growth rate of real exports; (2) Mean annual growth rate of nonfuel primary exports; (3) Average annual nonfuel primary exports as a percentage of total exports
Pooled, time‐series and cross‐sectional data for 76 less developed countries from 1967 to 1986
No identification strategy The study shows that exports have a positive effect on GDP growth. Moreover, this positive impact generally remains positive when nonexport GDP is the dependent variable. Lastly, the growth of nonfuel primary exports exhibits little or no external impact on the nonexport sector (casting some doubt on the sustainability of primary product export‐led growth)
83. Harrison (1996) (1) Trade reform (1960‐1984); (2) Trade reform (1979‐1988); (3) Black‐market premium; (4) Price distortion; (5) Trade shares; (6) Unprotected agriculture; (7) Movement toward international prices
Pooled, time‐series and cross‐sectional data for developing countries
Granger causality test Significant positive impact of openness on economic growth. The Granger causality test shows that causality between exports and growth runs in both directions. However, the choice of time period for analysis is critical
84. Henriques and Sadorsky (1996)
Natural log of real value of exports Time series, annual data for Canada from 1870 to 1991
Granger causality test The results tend to favor the one‐way Granger causal relationship that the growth rate of GDP influences export growth
85. Jin and Yu (1996) Real value of exports Time series, quarterly data for the United States from 1959 to 1992
No identification strategy Based on the VAR techniques, no significant causal impacts are found between exports and output. This suggests that export expansion is neutral with respect to the growth of the US economy

86. Karunaratne (1996)
Growth rate of value of exports Time series, seasonally adjusted quarterly data from Australia from 1979 to 1994
Granger causality test with error correction
Trade operated as an engine of growth in Australia during the study period
87. Kwan, Cosotmitis, and Kwok (1996)
Growth rate of real value of exports
Time series, annual data for Taiwan from 1953 to 1988
No identification strategy The result shows that while the weak exogeneity assumption appears to be valid, the super exogeneity assumption is rejected. Thus, the results cast doubt on policy recommendations based on the export‐led growth hypothesis
88. Mallick (1996) Growth rate of real value of exports
Time series, annual data for India from 1950 to 1992
Engle‐Granger causality tests with error‐correction model
Cointegration and causality test results indicate the existence of strong cointegration and Granger causality between income and exports growth. Causality runs from income to export growth
89. Mollik (1996) Growth rate of real value of exports
Time series, annual data for Bangladesh from 1972 to 1992
Granger and Sims causality tests
Exports cause economic growth but not the opposite
90. Mulaga and Weiss (1996)
Growth rate of effective protection
(ERP): ERPi = (ti‐aij ij)/(1 aij) where ti and tj are the tariffs or tariff‐equivalents for goods i and j, respectively, and aij is the share of input j in the value of output i at world prices
Firm‐level data for Malawi from 1970 to 1991
No identification strategy The impact of a decline in protection on total factor productivity depends upon the way productivity growth is measured. The study finds a positive relationship for the simple TFP estimates. However, the growth seems unassociated with changes in protection when capital input is measured by capital services rather than capital stock

91. Piazolo (1996) (1) Real value of exports of goods and services; (2) Real value of imports of goods and services; (3) Trade orientation dummy variable (import‐substitution dummy variable is 0 from 1965 to 1982; export diversification dummy variable is 1 from 1983 to 1992)
Time series, annual data for Indonesia from 1965 to 1992
Engle‐Granger causality test Indonesian long‐run economic growth is more investment driven than trade‐ or export driven. However, the short‐run terms effects of exports are strongly positive
92. Pomponio (1996) Manufactured goods exports Time series, annual data for 66 developing and OECD countries from 1960to 1988
Granger causality test The bivariate causality tests show weak evidence supporting the idea that manufactured exports lead to output growth. However, when the investment factor is included in the trivariate causality test, there is mixed evidence in support of the trivariate causal relationships
93. Riezman, Whiteman, and Summers (1996)
(1) Growth rate of exports; (2) Growth rate of imports; (3) Share of exports + imports in GDP
Time series, annual data for 126 countries from 1960 to 1985
Granger causality test 30 out of 126 countries support the export‐led growth hypothesis; 25 out of 126 countries support the growth‐led exports hypothesis. Using a weaker notion of “support,” 65 out of 126 countries support the export‐led growth hypothesis. For the “Asian Tiger” countries, the relationship between export growth and output growth becomes clearer when conditioned on human capital and investment growth as well as import growth

94. Thornton (1996) Natural log of real value of exports Time series, annual data for Mexico from 1895 to 1992
Granger causality test Positive Granger causal relationship running from exports to economic growth
95. Al‐Youslf (1997) (1) Growth rate of value of exports; (2) Growth rate of
exports share of exports in GDP
Time series, annual data for Saudi Arabia, Kuwait, UAE, and Oman from 1973to 1993
No identification strategy Significant positive impact of exports on economic growth. However, economic growth is highly affected by oil
96. Berg (1997) (1) Growth rate of real value of exports (in Granger causality test); (2) Growth rates of real values of exports and imports (in simultaneous equations)
Time‐series data for Mexico from 1960 to 1991
Granger causality test; Simultaneous equations; uses the real exchange rate and the growth rate of real GDP of the United States to instrument for exports; uses the real exchange rate and a measure of foreign capital inflows to instrument for imports
During the period 1960‐1991, trade and real output growth were positively related in Mexico. Simultaneous equation regressions suggest that both exports and imports significantly explain the growth of total factor productivity in Mexico. However, this study also points out the limitations of empirical exercises due to the changing composition of exports and shifting policy regimes, and emphasizes the importance of theoretical work
97. Coe, Helpman, and Hoffmaister (1997)
(1) Change of the share of machinery and equipment imports from industrial countries in GDP in each developing country (denoted by M); (2) M log of foreign R&D capital stock
Pooled data for 77 developing countries and 22 industrialized countries from 1971 to 1990
No identification strategy The results imply that a developing country’s total factor productivity is larger the larger is its foreign R&D capital stock, the more open it is to machinery and equipment imports from industrial countries and the more educated is its labor force
98. Gani (1997) Growth rate of the (real) share of exports in GDP
Time series, annual data for Papua New Guinea from 1970 to 1992
No identification strategy Exports and stable exchange rates have positively contributed to economic growth
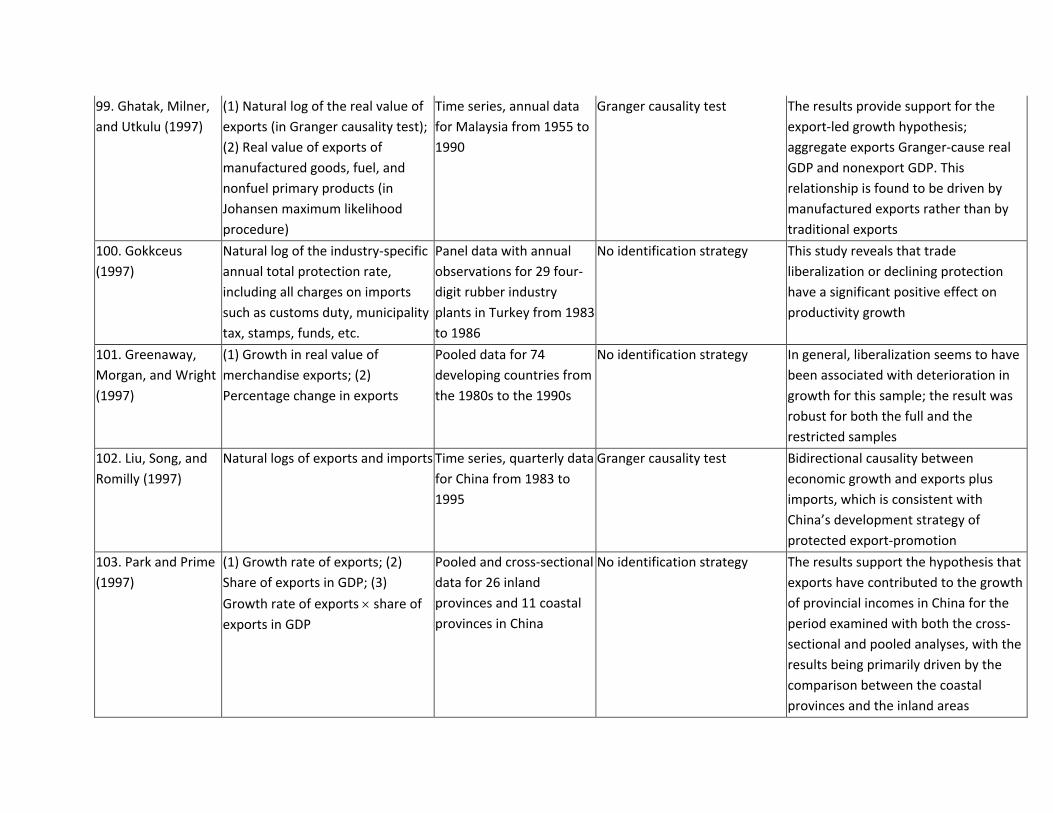
99. Ghatak, Milner, and Utkulu (1997)
(1) Natural log of the real value of exports (in Granger causality test); (2) Real value of exports of manufactured goods, fuel, and nonfuel primary products (in Johansen maximum likelihood procedure)
Time series, annual data for Malaysia from 1955 to 1990
Granger causality test The results provide support for the export‐led growth hypothesis; aggregate exports Granger‐cause real GDP and nonexport GDP. This relationship is found to be driven by manufactured exports rather than by traditional exports
100. Gokkceus (1997)
Natural log of the industry‐specific annual total protection rate, including all charges on imports such as customs duty, municipality tax, stamps, funds, etc.
Panel data with annual observations for 29 four‐digit rubber industry plants in Turkey from 1983to 1986
No identification strategy This study reveals that trade liberalization or declining protection have a significant positive effect on productivity growth
101. Greenaway, Morgan, and Wright (1997)
(1) Growth in real value of merchandise exports; (2) Percentage change in exports
Pooled data for 74 developing countries from the 1980s to the 1990s
No identification strategy In general, liberalization seems to have been associated with deterioration in growth for this sample; the result was robust for both the full and the restricted samples
102. Liu, Song, and Romilly (1997)
Natural logs of exports and imports Time series, quarterly data for China from 1983 to 1995
Granger causality test Bidirectional causality between economic growth and exports plus imports, which is consistent with China’s development strategy of protected export‐promotion
103. Park and Prime (1997)
(1) Growth rate of exports; (2) Share of exports in GDP; (3)
Growth rate of exports share of exports in GDP
Pooled and cross‐sectional data for 26 inland provinces and 11 coastal provinces in China
No identification strategy The results support the hypothesis that exports have contributed to the growth of provincial incomes in China for the period examined with both the cross‐sectional and pooled analyses, with the results being primarily driven by the comparison between the coastal provinces and the inland areas

104. Pineres and Ferrantino (1997)
(1) GEXP, the growth rate of the real value of exports; (2) RXR, the real exchange rate; (3) TRAD7 is the variance of the traditional index calculated across industries; (4) Specl, a static measure of specialization; (5) CSX, a measure of the change in export composition
Time series, annual data for Chile from 1962 to 1992
Granger causality test In general, growth periods in Chile have been associated with stability in the composition of exports and an acceleration of export diversification. There is a positive relationship between export diversification and economic growth
105. Begum and Shamsuddin (1998)
(1) Level of exports; (2) Share of exports in GDP; (3) Growth rate of exports; (4) Export growth rate weighted by the share of exports in GDP. Note: OLS results use the last measure as the exports variable
Time series, annual data for Bangladesh from 1961 to 1992
Instrumental variable technique; uses the annual growth rate of world income and the difference between foreign and domestic inflation rates to instrument for exports
Export growth has significantly increased economic growth through its positive impact on total factor productivity in the economy. The contribution of exports to economic growth was more pronounced during 1982‐1990, when the government pursued a policy of trade liberalization and structural reform and political turmoil was not persistent
106. Biswal and Dhawan (1998)
Natural log of total real value of exports and total real value of manufactured goods exports
Time series, annual data for Taiwan from 1960 to 1990
Granger causality test with error‐correction model
The study finds evidence of bidirectional causality between exports and growth

107. Clerides et al. (1998)
A dummy variable that equals 1 if the plant exports, 0 otherwise
Plant‐level, panel data for Columbia (1981‐1991), Morocco (1984‐1990), and Mexico (1984‐1990)
(1) FIML; simultaneously estimates export market participation patterns and marginal cost realizations; (2) GMM; used to test the robustness of the marginal cost estimate
The study addresses the question of whether the association between exporting and efficiency reflects causation flowing from exporting experience to improvements in performance. The actual data suggest an inconsistent causality pattern (no‐learning‐by‐exporting scenario). The FIML and GMM tests confirm that the association between exporting and efficiency is most plausibly explained as low‐cost producers choosing to become exporters
108. Doyle (1998) Natural log of the real value of exports
Time series, annual data for Ireland from 1953 to 1993
Granger causality test with error correction
Exports and GDP are cointegrated. Evidence of short‐run and long‐run causality runs from exports to growth
109. Iscan (1998) Share of exports in GDP Panel, sector‐level data for Mexico from 1970 to 1990
Granger causality test with VAR model
The study found no evidence that exports lead to capital accumulation or vice versa. However, there is evidence that common determinants, such as the real exchange rate, may be the driving force for the capital accumulation

110. Islam (1998) Value of exports Time‐series data for 15 Asian countries from 1967 to 1991
Multivariate error‐correction model to test the Granger causality between exports and growth
Causality test results indicate that export expansion causes growth in two third of these countries, corrected for simultaneity between the causal factors. A country with a large public sector, higher level of economic development, and lower vulnerability to external economic shocks, is more likely to reap the benefits of export‐promotion strategies
111. Keller (1998) A foreign knowledge stock variable which is a weighted sum of the cumulative R&D expenditures of a country’s trading partners (the weights are given by the bilateral import shares)
Panel data for 21 OECD countries from 1971 to 1990
Monte Carlo‐based robustness test; R&D spillovers among randomly matched trade partners investigated
Randomly matched trade patterns give rise to greater positive R&D spillovers than do true bilateral trade patterns, suggesting that the Coe and Helpman (1995) model of trade‐related international R&D spillovers is not robust
112. McNab and Moore (1998)
Dummy variables for inwardly oriented trade policy and outwardly oriented trade policy
Pooled data for 41 countries
Simultaneous estimations; openness measures are used as instruments
Outward trade policy increased annual GDP, and trade policy is a robust determinant of growth
113. Onafowora and Owoye (1998)
Real value of exports and trade policy dummies
Data from 12 sub‐Saharan African (SSA) countries from 1963 to 1993
Johansen’s cointegration tests and VECM
Changes in trade policies and exports have positive effects on growth for 10 out of 12 SSA countries
114. Shan and Sun (1998a)
Growth rate of real value of exports
Quarterly, seasonally adjusted data for Australia from 1978 to 1996
Granger causality test using Toda and Yamamoto method
Results indicate one‐way causality from industrial growth to export growth with a 1‐year lag
115. Shan and Sun (1998b)
Natural log of exports Monthly, seasonally adjusted data for China from 1978 to 1996
Granger causality test using Toda and Yamamoto method
Results indicate bidirectional causality between exports and real industrial output in China

116. Shan and Sun (1998c)
(1) Natural log of the growth rate of exports; (2) Natural log of the growth rate of imports
Quarterly, seasonally adjusted data for Hong Kong, South Korea, and Taiwan from 1978 to 1996
Granger causality test using Toda and Yamamoto method, followed by sensitivity analysis
Principal results from the paper cannot offer support for the export‐led growth hypothesis. Hong Kong and Korea show bidirectional Granger causality between exports and growth
117. Pineres and Ferrantino (1999)
(1) Natural log of real value of exports; (2) The mean of a cumulative export experience function for each commodity (traditionality scores); (3) A static measure of specialization which approaches 1 implying a high degree of specialization and nears 0 suggesting a degree of export diversification
Annual data for Columbia from 1962 to 1993
(1) Cointegration and error‐correction modeling used to test relationship between GDP and exports; (2) simultaneous equation system: using the price of coffee, oil, lagged log of real exports, world interest rates as instruments for openness measures
Traditional Granger causality tests reveal little evidence of export‐led growth. However, analysis of structural export change and export diversification sheds significant light on the trade‐growth linkages. Results reveal a positive interaction between structural changes in the export sector and Colombian GDP growth. Results indicate that increased export diversification leads to more rapid growth in real exports; and that more rapid structural change in exports is associated with accelerated growth in Colombian GDP
118. Clark, Sawyer, and Sprinkle (1999)
Trade policy orientation, measured using Dollar’s index of real exchange rate distortion
Pooled data for 94 developing countries
No identification strategy Outward‐oriented trade strategies are found to have an important effect on industrialization

119. Dhawan and Biswal (1999)
(1) Natural log of real value of exports; (2) Terms of trade
Annual data for India from 1961 to 1993
VAR model; Johansen test for cointegration; Engle and Granger’s error‐correction approach (to determine the direction of causal flow in the short run as well as in the long run)
The results suggest that there is one long‐run equilibrium relationship among real GDP, real exports and terms of trade, and the causal relationship flows from GDP growth and terms of trade to export growth. The causality from exports to GDP appears to be a short‐run phenomenon
120. Frankel and Romer (1999)
Trade is measured using instrumental variables that take account of countries’ geographic locations
Cross‐sectional data for 150 countries
OLS and instrumental variables techniques
Trade has a positive effect on income growth
121. Greenaway, Morgan, and Wright (1999)
(1) Real value of exports; (2) Decomposition of exports into different categories
Panel data for 69 countries from 1975 to 1993
No identification strategy Results report a strong positive relationship between real export growth and real output growth. The study also finds that export composition does matter
122. Moosa (1999) Sum of exports of goods and services
Annual data for Australia from 1900 to 1993
Cointegration and causality tests
Results fail to detect either a long‐run or short‐run relationship between exports and growth

123. Vamvakidis (1998)
(1) Share of exports plus imports in GDP; (2) Economy judged “open” if it meets five conditions from Sachs and Warner: (a) average tariff less than 40%; (b) average nontariff barriers less than 40%; (c) black‐market premium less than 20% of official exchange rate; (d) government is not communist; (f) no state monopoly on major exports
Data cover the period from 1950 to 1992. Data for real GDP per capita, investment share, and population growth are from the Penn World Table; trade shares come from the World Table (World Bank, 1994), and school enrollment ratio are from Barro and Lee (1994). The analysis focuses on 109 countries engaged in regional trade agreements (RTA) and 51 countries engaged in broad liberalization between 1958 and 1989
No identification strategy Economies grow faster after broad liberalization, in both the short run and the long run; however, they grow more slowly after an RTA
124. Weinhold and Rauch (1999)
Share of exports plus imports in GDP
Data from 39 countries 1960‐1990
No identification strategy Increased trade may lead to growth
125. Xu and Wang (1999)
Foreign R&D spillovers weighted by total imports, capital goods imports, and noncapital goods imports
Data from 21 OECD countries from 1983 to 1990
No identification strategy Trade in capital goods was found to be a significant channel of R&D spillovers
126. Anoruo and Ahmad (1999)
Growth rate of the share exports plus imports in GDP
Time series, annual data for Indonesia, Malaysia, the Philippines, and Thailand from 1960 to 1997
Granger causality test The results show bidirectional causality between economic growth and openness

127. Al‐Marhubi (2000)
(1) Average share of exports in GDP from 1961 to 1988; (2) Export structure, measured as the ratio of manufactured good exports to total exports from the World Development Indicators (WDI) 1997
Cross‐sectional data for 91 countries from 1961 to 1988
No identification strategy The results show that export diversification is associated with faster growth. This relationship is economically large and is robust to different model specifications and different measures of export diversification. Moreover, distortions to international trade and market‐oriented resource allocation that run counter to a country’s comparative advantage can have adverse effects on economic efficiency and growth performance
128. Anwer and Sampath (2000)
Natural logs of goods and nonfactor service exports
Time series, annual data for 97 countries from 1960to 1992
Granger causality test In 97 countries, GDP and exports are integrated of different orders for 36 countries. Among the other 61 countries, 17 countries exhibit no long‐run relationship between the two variables; 35 countries show causality in at least one direction (10 countries show unidirectional causality from GDP to exports, 5 show unidirectional causality from exports to GDP, and 20 show bidirectional causality), and 9 countries do not show any causality

129. Choudhri and Hakura (2000)
Sector openness index, which depends on how international trade affects the technology transfer process
Panel data for 44 countries (including 33 developing countries) from 1970 to 1993
No identification strategy The effect of increased openness on productivity growth differs across sectors. In traditional (low‐growth) manufacturing sectors, no effect or little effect exists; for medium‐growth sectors, import competition has a significant growth‐enhancing effect; and there is some evidence to show that export expansion in high‐growth sectors leads to an increase in productivity growth
130. Darrat, Hsu, and Zhong (2000)
Real value of exports Data for Taiwan from 1953to 1988
VECM model after Johansen cointegration tests, instead of simple Engel‐Granger procedure
The exports are both weakly and super‐exogenous to output
131. Erlat (2000) Export and import flows, divide into three categories: net exporting, import competing, noncompeting
Annual data for Turkey from 1963 to 1994, divided into four subperiods
No identification strategy First, trade plays a more significant role in employment changes during the post‐1980 periods; this is observed more in the net exporting and noncompeting categories rather than the import‐competing category. Second, the switch to export‐oriented growth in 1980 did not lead export‐based employment to be dominant in employment changes, but has acted as a buffer in the sense that employment may either have grown much less or declined more severely if the post‐1980 expansion of exports had not occurred

132. Jin (2000) Share of imports in GDP Annual data for Japan, South Korea, Japan, the Philippines, Thailand, Malaysia, and Singapore from 1955 to 1995
VAR model The results do not strongly support the idea that openness leads to growth
133. Kim (2000) Direct policy measures such as legal rates of tariff, quota ratios, and nominal rates of protection
Panel data for 36 Korean manufacturing industries over nine subperiods from 1966 to 1988
No identification strategy Total factor productivity estimates based on the standard assumption of perfect competition and constant returns are biased and show a spurious relationship with changes in trade regimes. When both imperfect competition and nonconstant returns are taken into account, the growth accounting approach yields estimates of total factor‐productivity growth that are quite low
134. Morley and Perdikis (2000)
Growth rate of exports Annual data for Egypt from 1955 to 1996
VECM and Granger causality tests
There appears no evidence of either direction of causality between exports and growth
135. Moreira and Najberg (2000)
Value of exports and imports National accounts series for Brazil from 1990 to 1997
No identification strategy Trade liberalization has a negative short‐run impact on employment, in long run, overweighed by a more labor‐intensive output mix
136. Pereira and Xu (2000)
Growth rate of exports Data for 39 countries from 1960 to 1992
Multivariate VAR approach test to Granger relations
Results strongly support the theory of export‐led growth

137. Francisco and Ramos (2001)
Real value of exports and imports Annual data for Portugal from 1865 to 1998
Granger causality in the ECM‐VAR
The empirical results reject unidirectional causality between exports, imports, and economic growth. However, there are feedback effects between exports, output growth and import growth
138. Ghirmay, Grabowski, and Sharma (2001)
Real value of exports Time‐series data for 19 least developed countries (each with at least 30 annual observations)
Granger causality tests based on error‐correction modeling
Export expansion leads to economic growth in 15 out of 19 countries by either increasing the volume of investment, improving efficiency, or both
139. Khalafalla and Webb (2001)
Real value of exports and imports (export data are broken down into two additional series: total value of primary commodity exports, and total value manufacturing exports)
Quarterly data for Malaysia from 1965 to 1996
VAR model, VECM, Granger causality test
Statistical tests confirm export‐led growth for the full period and for the period to 1980, but tests on the 1981‐ 1996 period show growth causing exports. Primary exports have a stronger direct impact on economic growth than manufactures
140. Madden, Savage, and Bloxham (2001)
Share of imports in GDP foreign R&D capital stock
Panel data for 15 OECD countries and six Asian countries from 1980 to 1995
No identification strategy Total factor productivity and domestic R&D are positively related. Domestic R&D has relatively large impact on total factor productivity
141. Abdulnasser (2002)
Value of exports Quarterly data for Japan from 1966 to 1999
Granger causality test in VAR model, LR test for causality and bootstrap simulation technique
There is bidirectional causality between export and output growth in Japan
142. Chuang (2002) A set of trade‐induced learning variables that take into account trade partners and learning characteristics
Cross‐country panel data for 78 countries from 1960to 1985
Panel regression. The general problem of causality is relatively minor in this study as only traded goods in a subset are taken
Holding other variables constant, trade‐induced learning has a positive and significant effect on growth

143. Greenaway, Morgan, and Wright (2002)
(1) A dummy variable, equal to 1 if it is activated at the time of a country’s first World Bank Structural Adjustment Loans (SALs) (2) a dummy variable based on tariffs, quotas, export impediments and promoters, and exchange rate misalignment; (3) a dummy variable for whether an economy is open or closed based on five criteria from Sachs and Warner: nontariff barrier coverage; average tariffs; the black‐market exchange rate premium; whether the economy is socialist or not; whether a state monopoly exists over major exports
Panel data for 73 countries from 1975 to 1993
No identification strategy Liberalization may favorably impact growth of real GDP per capita. However, the effect would appear to be lagged and relatively modest
144. Jin (2002) Real value of exports Monthly data for Korea’s four largest provinces (Seoul, Kyunggee, Kyungnam, and Pusan) from 1987 to 1996
Engle and Granger tests for cointegration, Granger causality tests, four‐variable VAR model, variance decompositions and impulse responses
Export growth has a significant impact on output growth for all provinces, although a feedback effect from output to export growth appears in Seoul and the Kyungnam province
145. Ahmed (2003) (1) Share of exports in GDP; (2) Average tariff collection rate
Times series data for Bangladesh from 1974 to 1996
VECM model after cointegration tests
Exports and average tariff collection rates are significant in explaining GDP growth

146. Connolly (2003) Sum of high technology imports and nonhigh technology imports, which are measured as total imports from the world, excluding high technology goods imported from developed countries
Annual panel data for 86 countries from 1965 to 1995 (data are not available for all countries in all years)
No identification strategy High technology imports positively affect domestic imitation and innovation. Moreover, their role is greater in developing nations. Finally, foreign technology embodied in imports plays a greater role in growth than domestic technology
147. Dar and Amirahalkhali (2003)
(1) Real value of exports; (2) Share of exports plus imports in GDP
Data for 19 countries from 1971 to 1999
No identification strategy Results generally indicate that trade openness is important for economic growth, but the magnitude of the relationship varies significantly across countries
148. Ferreira and Rossi (2003)
(1) Effective rate of protection; (2) Nominal tariff
Annual data for 16 industrial sectors in Brazil from 1985 to 1997
Panel regression includes IV (the measurement of effective rate of protection and mess nominal tariff), 2SLS FE, and FE, no causality tests used
There is significant evidence that reducing trade barriers improves total factor productivity and labor productivity
149. Singh (2003) Share of real exports in real GDP for each industry
Panel data for 10 manufacturing industries in India from 1973/1974 to 1993/1994
No identification strategy Exports do not induce convergence, but instead seem to accentuate the process of divergence among industries. The study provides some evidence for the significant effects of exports on the level of output per capita and total factor productivity in the manufacturing sector. The effects of exports on total factor productivity are significant in half of the sample industries, but are statistically insignificant in the remaining half

150. Yanikkaya (2003)
(1) Trade volumes (import penetration; export share in GDP; trade with OECD countries; trade with non‐OECD countries; US bilateral exports; US bilateral imports and population density), (2) Trade restrictions (import duties, export duties, taxes on international trade, bilateral payment arrangements, and other measures of trade barriers)
Panel data for over 100 developed and developing countries from 1970 to 1997
Cross‐country regression, including OLS, SUR, 3SLS; instrumental variables technique, using log of average GDP per capita for the previous 5 years, 5‐year lagged value of life expectancy, actual value of telephone mainlines, the access to international water, war deaths, tropical climate, and political regime as instruments for trade measures
The regression results for trade volumes provide substantial support for the hypothesis that trade promotes growth through a number of channels such as technology transfer, scale economies, and comparative advantage. Interestingly, all measures of trade barriers used in the study are significantly and positively correlated with growth except for restrictions on current account payments, which are negatively but insignificantly correlated with growth. Thus, the results provide considerable evidence for the hypothesis that restrictions on trade can promote growth, particularly for developing countries and under certain conditions
151. An and Iyigun (2004)
Skill‐intensive exports Panel data for 86 countries from 1970 to 1990
Panel regression, followed by robustness tests including dropping outliers, causality test for direction of relationship between rate of per capita GDP growth and subsequent skill content of exports
After controlling for GDP per capita, education, openness to foreign trade, and political and macroeconomic stability, a higher export content of skill‐intensive goods generates higher per capita GDP growth rates, but the reverse does not hold
152. Balaguer and Cantavella‐Jorda (2004)
(1) Real value of exports; (2) Export composition (in relative terms), calculated as share of consumption goods, semimanufactured and capital goods in total exports
Annual data for Spain from 1961 to 2000
Johansen’s cointegration test followed by Granger causality tests
Exports and growth are cointegrated, and there is bidirectional causality between exports and growth

153. Bugsten et al. (2004)
A dummy variable, equal to 1 if a firm exports more than a certain amount (depending on company size, labor productivity, capital productivity, etc.), 0 otherwise
Firm‐level, panel data for the manufacturing sectors of four African countries: Kenya (1992‐1994); Ghana (1991‐1993); Zimbabwe (1992‐1994); Cameroon (1992/1993‐1994/1995)
Simultaneous estimation of a dynamic production function and a dynamic discrete choice model for the decision to export
The study finds that exporting increases productivity
154. Chuang and Hsu (2004)
(1) Natural log of share of exports to OECD in total industry sales; (2) Natural log of share of imports in total industry sales
Firm‐level data for China from 1995
No identification strategy The presence of foreign ownership has a positive and significant effect on the productivity of domestic firms. Moreover, trading with more advanced countries helps China gain access to new technology and information, which improves China’s productivity and enables it to compete in international markets
155. Dawson and Hubbard (2004)
(1) Growth rate of exports; (2)
growth rate of exports the share of exports in GDP
Annual panel data for 14 Central and East European countries CEECs from 1994to 1999
First stage, aggregate production into export production and nonexport production; in the second stage, random effects and fixed effects model applied to test relationship between GDP growth and export production variants
Export growth is a significant determinant of GDP growth

156. Dritsakis (2004) (1) Investment, measured as gross fixed capital adjusted by the GDP deflator; (2) Real export revenue
Quarterly data for Bulgaria and Romania from 1991 to 2001
Johansen cointegration test and Granger causality test based on a vector error‐correction model
There is significant evidence to show cointegration between exports and growth, as well as investment and growth. Exports promote growth in both countries; growth also promotes exports in both countries. Investment leads to growth in both countries
157. Dutta and Ahmed (2004)
(1) Real value of exports; (2) Import tariff collection rate
Time‐series data for Pakistan from 1973 to 1995
VAR model to test long‐run effects, VECM model to test short‐run effects, both with human capital included in the model framework
There is a unique long‐run relationship between industrial growth and its major determinants including real exports. The short‐run relationship between industrial growth and real exports is also significant
158. Dodzin andVamvakidis (2004)
Share of exports plus imports in GDP
Panel data for 92 developing countries from 1960 to 2000
Granger causality test The impact of trade liberalization on different sectors of production in developing economies shows increases in the production share of the industrial sector, at the expense of agricultural production
159. Falvey, Foster, and Greenway (2004)
Trade‐mediated knowledge spillovers (export spillovers and import spillovers)
Data for 21 OECD countries from 1975 to 1990
Griliches’ (1979) perpetual inventory method, weighted by imports or exports
Results support the existence of spillovers through imports, but the evidence of spillovers through exports is less compelling
160. Lee, Ricci, and Rigobon (2004)
(1) The share of trade in GDP; (2) Tariff; (3) Import duties; and (4) Black‐market premium
A panel data of eight periods of 5 years each, is spanning from 1961 to 1965 and 1996 to 2000, including 100 countries
“Identification through Heteroskedasticity” (IH): exploit plausible differences in variances of structural innovations (error terms) across subsamples of the data
The results suggest that openness has a small positive effect on growth, which is not particularly robust

161. Thangavelu and Rajaguru (2004)
Value of exports and imports Time‐series data for Hong Kong, India, Indonesia, Japan, Malaysia, Philippines, Singapore, Taiwan, and Thailand from 1960 to 1996
VECM approach The long‐run result shows that there is no causal effect of exports on labor productivity growth for Hong Kong, Indonesia, Japan, Taiwan, and Thailand, thereby suggesting that there is no export‐led productivity growth in these countries. However, significant causal effects were found from imports to productivity growth, suggesting import‐led productivity growth in India, Indonesia, Malaysia, the Philippines, Singapore, and Taiwan. In addition, the results indicate that imports tend to have greater positive impacts on productivity growth in the long run
162. Awokuse (2005a)
Real value of exports Quarterly time‐series data from 1963 to 2001 for Korea
VECM approach and augmented levels VAR modeling with integrated and cointegrated processes (of arbitrary orders) used to test Granger causality
There is bidirectional causality between exports and GDP growth
163. Awokuse (2005b)
Real value of exports Quarterly time‐series data from 1960 to 1991 for Japan
Augmented VAR methodology used to test Granger causality; Direct acyclic graphs (DAG) used to further restrict VAR
The causal path between exports and GDP growth in Japan is bidirectional; other variables such as capital and foreign output are also significant determinants of productivity growth in Japan

164. Biesbroeck (2005)
Value of exports Panel survey data for approximately 200 manufacturing firms in each of nine African countries from 1992 to 1996
(1) GMM; uses lagged exports to test unidirectional causality from exports to productivity improvement; (2) Instrument variables technique; uses ethnicity of the owner and the state ownership
165. Fu (2005) Value of exports (1) Panel data of 26 manufacturing industries for the period 1990‐1997 for China; (2) Pooled data for 358 subindustries, including 179 state‐owned enterprises (SOEs) industries and 179 comparable township and village enterprises (TVE) industries from 1995
Uses a two stage process. First stage uses a nonparametric Malmquist TFP approach to decompose TFP growth into technical change and efficiency improvements. Second stage uses regressions to test the impact of exports on TFP growth
No significant evidence was found in favor of significant productivity gains caused by exports at the industry level
166. Dollar and Kraay (2004)
(1) Trade volumes; (2) Tariffs; (3) Membership in the World Bank; (4) Presence of capital controls
Cross‐sectional data for 92 countries and spanning the 1960s to the 1990s
No identification strategy The study tests whether openness has systematic effects on the share of income accruing to the poorest in society. It finds little evidence to support such systematic effects, even when allowing the effects of openness to depend on the level of development and differences in factor endowments

167. Dollar and Kraay (2004)
(1) Decade‐over‐decade changes in the volume of trade; (2) Reductions in average tariff rates; (3) Share of trade in GDP
Cross‐sectional data for 101 countries and covering periods from the 1970s to the 1990s
Instrumental variables technique; uses lagged trade volumes as instruments for current trade volumes
Changes in growth rates are highly correlated with changes in trade volumes, controlling for lagged growth and addressing a variety of econometric difficulties. However, there is no significant correlation between changes in inequality and changes in trade volumes, controlling for changes in average incomes
168. Wacziarg and Welch (2003)
Composite measure of openness including exchange rate reforms
Positive relationship between a composite measure of economic reforms and economic growth, but not significant for the 1990s
169. Alcalá and Ciccone (2004)
The natural log of the share of the sum of imports and exports in purchasing power parity GDP (real openness)
Cross‐sectional data from Penn World Tables for 1985
IV using a geography‐based instrument for trade (obtained from aggregating bilateral trade shares predicted by the gravity equation). This method was first used by Frankel and Romer (1999)
Trade is a significant and robust determinant of aggregate productivity when real openness is used
170. Rigobon and Rodrik (2004)
Log of the share of trade in GDP Cross‐sectional dataset from Penn World Tables and World Development Indicator, including 86 countries
“Identification through Heteroskedasticity” (IH): exploit plausible differences in variances of structural innovations (error terms) across subsamples of the data
The share of trade in GDP has a negative impact on income levels and democracy, but a positive impact on the rule of law

172. Chang et al. (2005)
Share of real exports plus real imports in real GDP
Pooled cross‐country and time‐series data for 82 countries from 1960 to 2000
Nonlinear growth regression specification that interacts a proxy of trade openness with proxies of educational investment, financial depth, inflation stabilization, public infrastructure, governance, labor‐market flexibility, ease of firm entry, and ease of firm exit
The growth effects of openness are positive and economically significant if certain complementary reforms are undertaken
173. Hausmann et al. (2005)
A measure of the income level of a country’s exports, which also captures the level of sophistication of those exports
There are two sources of data. (1) The first is the United Nations Commodity Trade Statistics Database (COMTRADE) covering over 5000 products at the Harmonized System 6‐digit level for the years 1992‐2003 (available for 124 countries over 1999‐2001); (2) the real per capita GDP data from the WDI, which is available for 113 countries
Instrumental variables technique; uses log population and log land area as instruments for the export sophistication measure
Export sophistication positively affects growth
174. Freund and Bolaky (2008)
The log of the share of the sum of imports and exports in GDP
Cross‐country data from 126 countries covering periods from 2000 to 2004
IV using a geography‐based instrument (followed by Frankel and Romer (1999)) and also using remoteness from other markets as an additional instrument for trade
Openness interacts with regulation and only positively affects growth in unregulated economies with minimal restrictions on entry

175. Romalis (2007) Share of trade (evaluated at either current or constant price) in GDP
Data for developing countries from 1961 to 2000
Instrumental variables technique; uses US MFN tariffs as instruments for developing country trade shares
Openness positively affects per capita GDP growth
176. Estevadeordal and Taylor (2008)
Tariffs on consumption, capital, and intermediate goods from primary sources
Data on growth rate come from the Penn World Table database (version 6.2); data on average tariff come from the Economic Freedom in the World 2005 database, which are available every 5 years from 1970 to 2000, plus annually for 2001, 2002, and 2003, and the sample size grows from 77 countries in 1970 to 122 in the year 2000
IV using two “GATT Potential” instruments (the interaction of an indicator of GATT membership in 1975 with the pre‐Uruguay Round tariff level and the interaction of Great Depression intensity with the initial period tariff level) to identify for trade liberalization (reflected by tariff policy)
The results show that liberalizing tariffs on imported capital and intermediate goods did lead to faster GDP growth, but the negative effects of tariff on growth is not as strong for consumption goods tariffs
177. Donaldson (2009)
Introduction of railroads within Indian states
Historical district by district (239 districts) data within India for 1861‐1930
Uses the introduction of railroads as an exogenous shifter of trade costs
178. Feyrer (2009) Trade shares Annual cross country data between 1960 and 1995
Uses geography as an instrument for trade shares in a first stage gravity equation. Differerences over time in the importance of air and sea distance lead to time variation.
Trade has a significant effect on income with an elasticity of roughly one half. Differences in predicted trade growth can explain roughly 17 percent of the variation in cross country income growth between 1960 and 1995.

Table 2 The evolution of country trade policies over the last 25 years Countries Tariff revenues Tariffs Changes 1985‐2004 1980 1985 1990 2000 2004 1980 1985 1990 2000 2004 Change
Rev Change tariff
Change STD
India 15.5 24.2 21.1 8.4 5.7 74.3 98.8 79.2 32.5 28.1 18.5 70.7 32.8 Bangladesh 13.4 17.9 12.1 7 8.2 99.9 86 102.2 21.6 16.4 9.7 69.6 36.8 Paraguay 6 2.2 3.3 3.4 2.2 71 71.7 16 10.9 8.5 0 63.2 6.5 Pakistan 15.3 14.7 15.2 5.6 3.9 77.6 78 58.8 46.6 16.1 10.8 61.9 14.8 Peru 10.6 8.3 3.9 4.5 3.4 57 64 36 13.4 9.6 4.9 54.4 22.1 Nicaragua 8.7 7.4 4.3 1.8 1.3 54 54 24.8 3.2 4.9 6.1 49.1 –
Costa Rica 5.3 6.9 7 1.1 1.1 55 53 16.4 5.4 5.7 5.8 47.3 5.4 Guatemala 4.8 7.5 3.6 2.5 2.7 50 50 23 7.2 5.1 4.8 44.9 19 Brazil 10 3.2 3.7 4.2 4.2 – 55.6 30 14.4 13.1 1.0 42.5 10.3 Madagascar 8.5 – 14 10.2 10.3 31.5 46 36 – 5.2 – 40.8 –
China 5.7 10 3.7 1.5 1.8 49.5 39.5 40.3 16.3 9.8 8.2 29.7 22.1 Ecuador 7.2 6.2 4 5.2 5.2 – 37.7 37.1 12.9 11.5 1 26.2 20.7 Senegal 11.4 8.3 11.8 8.3 9.3 – 39 35 12 13.4 1 25.6 –
Chile 2.8 5.7 3.7 2.3 0.7 10 30 15 9 4.9 5 25.1 0
Turkey 6.3 3 2.8 0.7 0.4 44 26.6 22.7 7.1 2.6 2.6 24 21 Egypt 13.1 12.1 5.9 7 6 47.4 42.8 33.5 20.5 18.9 6.1 23.9 386.3 Benin 10.6 – – – – – 37.4 – 12 14 – 23.4 –
Uganda 3.1 11.6 10.8 11.4 9.8 – 30 30.1 8.3 6.7 1.8 23.3 –
Philippines 6.8 6.2 6.6 2.7 2.5 38 27.6 24.3 7.6 4.4 3.7 23.2 1.9 Kenya 6.1 7.4 6.3 7.5 7.5 40.3 39.2 43.7 19.3 16.2 0.09 23 8 Colombia 7.8 7.5 6 2.5 2.3 33.5 33.6 30.4 11.7 11.3 5.2 22.3 2.1 Mali 3.8 5 4.6 – – 35 35 25 12 12.8 – 22.2 –
Zambia 2.4 6.4 4.8 7.3 7.3 – 34.8 25.6 14.7 13.2 0.9 21.6 –
Venezuela 3 9.1 2.2 3.1 1.8 – 32.9 30.6 13.5 12.2 7.3 20.7 18.5 Uruguay 8.9 5.8 5.6 2 1.9 – 31 30.5 11.1 10.8 3.9 20.2 2.1
Sri Lanka 11.7 10.6 8.8 2.1 2.5 41.3 29 26.9 9.9 9.8 8.1 19.2 16.2 Thailand 6.9 6.5 5.4 1.4 1.3 32.3 31.2 40.8 17 13.3 5.2 17.9 7.2 Burundi 18.1 17 22.9 13.3 13.3 – 37.9 37 – 20 3.7 17.9 –

Countries Tariff revenues Tariffs Changes 1985‐2004 1980 1985 1990 2000 2004 1980 1985 1990 2000 2004 Change
Rev Change tariff
Change STD
Tanzania 7.7 6.3 7.5 11.9 11.9 – 32 29.7 19.1 14.1 5.5 17.9 –
Ghana 17.3 21.7 11.6 4.6 4.6 – 30 17.5 15.2 13.1 17.1 16.9 –
Argentina 9.5 12.7 9.9 3.1 7.4 27.8 27 20.5 12.6 11.4 5.3 15.6 17.1 Mexico 17.6 2.6 2 1 1 30.9 30 11.1 16.2 14.6 1.6 15.4 2.3
South Korea 4.1 3.6 3.4 1.3 1.3 20.4 23 13.3 8.7 9.3 2.3 13.7 .7 Central African Rep.
10.6 – 11.5 8.6 8.6 – 32 32 18.6 18.9 – 13.1 –
Congo, Rep. 3.8 – 8.2 1.1 1.6 – 32 – 17.6 19.6 – 12.4 –
Syria 7.1 5.6 2.9 3.7 3.7 37.3 27 20.4 – 14.6 1.9 12.4 –
New Zealand 2.5 2 1.7 0.8 1.6 13 16 14.5 3.4 3.7 .4 12.3 11.3 Bolivia 7.8 7 2.3 2.4 2 – 19.8 16.7 9.5 7.5 5 12.3 –
Nigeria 8.5 5.1 4 – – 32.6 37 34.3 – 24.8 – 12.2 15.2 Indonesia 2.9 1.6 2.4 0.5 1 29 18.1 20.3 8.4 6.4 .6 11.7 5.9 Mauritius 9.6 9.6 7.6 4.6 3.6 34.9 34.9 27.6 31 23.5 6 11.4 63.7 Gabon 7.3 6.4 4.8 – – 43.3 29.6 – 20.4 18.6 – 11 –
Cote d’Ivoire 12.8 11.8 10.9 9.3 9.9 27.5 23.3 33 12 12.7 1.9 10.6 –
Congo, Dem. Rep.
10.3 8.4 9.1 6.4 5.5 23.6 22.4 20.7 – 13 2.9 9.4 –
Poland – 8.6 6 1.2 1 – 13.6 11.7 10 4.3 7.6 9.3 0.90
Australia 3.6 3.2 3.1 1.3 1.6 14.5 13.3 14.2 5.8 5.1 1.6 8.2 7.8 Austria 0.7 0.6 0.7 0.3 0.2 11.6 10 8.7 2.4 1.8 0.4 8.2 5.2 Nepal 8.6 7.7 8.8 5.1 6.9 22.1 22.6 22.6 14.7 14.8 0.79 7.8 –
Jamaica 0.9 1.7 – 2.2 3 16.5 17 17 10.6 9.4 1.3 7.6 –
Trinidad & Tobago
3.2 5.7 2.7 10.2 10.2 – 17 18.6 18.4 9.7 4.5 7.3 4.7
Canada 2.4 1.7 1.2 0.3 0.3 11.2 10.5 9.4 3.9 3.7 1.4 6.8 2.1 Malaysia 7.7 5.7 3.2 1.6 0.6 10.6 13.6 13 9.2 7.4 5.1 6.2 20.8
Italy 0.4 0.3 0.3 0.3 0.2 8.8 7.5 7.4 2.4 1.8 0.1 5.7 2.3 Denmark 0.5 0.4 0.3 0.3 0.2 8.8 7.5 7.4 2.4 1.8 0.2 5.7 2.3

Countries Tariff revenues Tariffs Changes 1985‐2004 1980 1985 1990 2000 2004 1980 1985 1990 2000 2004 Change
Rev Change tariff
Change STD
Belgium 0.3 0.3 0.4 0.3 0.2 8.8 7.5 7.4 2.4 1.8 0.1 5.7 2.3 Luxembourg 0.1 0.1 0.1 0.3 0.2 8.8 7.5 7.4 2.4 1.8 0.1 5.7 2.3 Netherlands 0.4 0.4 0.5 0.3 0.2 8.8 7.5 7.4 2.4 1.8 0.2 5.7 2.3 Germany 0.5 0.5 0.5 0.3 0.2 8.8 7.5 7.4 2.4 1.8 0.3 5.7 2.3 Ireland 3.5 3 3 0.3 0.2 8.8 7.5 7.4 2.4 1.8 2.8 5.7 2.3 Spain 2.7 3 1.5 0.3 0.2 8.8 7.5 7.4 2.4 1.8 2.8 5.7 2.3 France 0.5 0.4 0.4 0.3 0.2 8.8 7.5 7.4 2.4 1.8 0.2 5.7 2.3 Greece 3.2 0.7 0.6 0.3 0.2 8.8 7.5 7.4 2.4 1.8 0.5 5.7 2.3 United Kingdom
0.7 0.6 0.6 0.3 0.2 8.8 7.5 7.4 2.4 1.8 0.4 5.7 2.3
Finland 0.8 0.4 0.6 0.3 0.2 10.4 7 7.7 2.4 1.8 0.2 5.2 5.2 Norway 0.3 0.3 0.3 0.3 0.2 6.2 5.7 5.7 2.9 0.5 0.1 5.2 7.1
Guyana 1.8 3.9 – – – – 17 – 17 12 – 5 –
Belize 8.7 10.9 10.8 6.6 6.6 – 17 – – 12.9 4.3 4.1 –
Malawi 6.6 8.8 5.7 8.1 8.1 – 16.7 15.2 19.6 12.9 0.6 3.8 –
Japan 0.9 0.8 0.9 1.5 1.5 9.5 6.7 6.9 4.5 2.9 0.7 3.8 0.8 United States 1.1 1.7 1.5 0.8 0.9 7.3 6.6 6.2 4 3.2 0.8 3.4 3.4
Algeria – – – 5.5 7.6 11.7 21.7 24.6 24.6 18.4 – 3.3 –
Iran 17 14.2 5.4 3.1 4.9 20.7 20.7 20.7 4.9 17.5 9.2 3.2 –
Sweden 0.7 0.3 0.4 0.3 0.2 7.5 4.1 4.7 2.4 1.8 0.1 2.3 0.09
Haiti 9.9 8 6.7 – – 27.7 11.6 – 10 10 – 1.6 –
Iceland 6.5 4.6 4 0.5 0.4 9.6 6.7 3.8 1.9 5.1 4.2 1.6 0.6
Namibia – – 7.3 12.5 8.5 9.4 6 11 7.2 4.5 – 1.5 1.3 Cyprus 4 4.4 4.2 1.3 1.3 17.1 17.6 16.5 16.4 16.4 3.1 1.2 –
Switzerland 2.4 2 1.9 0.3 0.3 4.6 4.4 4.4 0 3.2 1.7 1.2 0
Botswana 12.8 7.1 6.6 6.1 6.1 9.4 6 11 7.2 5 1 1 1.3 Papua New Guinea
3.3 5.9 7.1 7.3 6.1 – 7 7 21.1 6.4 0.1 0.5 –
Kuwait – – 1.2 1.1 1.3 – 4 – – 3.5 – 0.5 –

Countries Tariff revenues Tariffs Changes 1985‐2004 1980 1985 1990 2000 2004 1980 1985 1990 2000 2004 Change
Rev Change tariff
Change STD
Singapore 0.4 0.3 0.1 0.1 0 0.3 0.3 0.4 0.4 0 0.3 0.3 1.8 Hong Kong 0.5 0.6 0.4 0.3 0 0 0 0 0 0 0.6 0 0
United Arab Emirates
0 0 0 0 0 – 4 – 4 4 0 0 –
Jordan 7.1 6.1 5 4.6 3.1 – 13.8 – 24 14.4 3 0.5 2.9 Tunisia 9 13.3 9.5 3.6 2.4 26.4 24 27.5 30.6 25.3 10.9 1.2 2.5
Barbados 3.7 3.4 3.6 – 3.1 – 17 – 19 19 0.3 2 –
South Africa 1.2 1.4 2.2 1.5 1.6 9.4 6 11 8.5 8.5 0.2 2.5 0.3 Bahamas 8.1 9.3 9.6 11 11 29.8 32.3 – 35 35 1.7 2.7 – Morocco 10.7 6.4 8.6 7.4 7.4 54 23.5 23.5 33.6 28.3 1 4.7 – Oman – 1.4 1 0.9 0.8 – 3 – 4.7 8 0.6 5 –
Zimbabwe 1.7 8 9.2 7.3 7.3 10 8.7 10.1 21.4 15.9 0.6 7.2 6.8
Romania – – 0.4 1.6 0.9 – – – 15.2 13.3 – – – Guinea‐Bissau – 7.7 – – – – – – 12 13.9 – – – Ukraine – – – 1 1.7 – – – 10.5 7.9 – – – Sierra Leone 13.3 11.9 4 10 10 25.8 25.8 – – – 1.9 – –
Myanmar 14.2 17.6 19.4 19.8 15.2 – – – – 4.4 2.4 – –
Rwanda 13.3 – 14.2 – 0. – – – – 8.3 – – – Russia – – – 4.6 9.8 – – – 12.6 10.3 – – – Czech Rep. – – – 0.5 0.1 – – – 6.5 5.1 – – – Niger 8.4 9.5 9.8 – 0. – – – 12 12.8 – – – Albania – – – 7.3 3.4 – – – 17 8.3 – – – Togo 12.4 8.6 9.2 – 0. – – – 12 14.4 – – – Fiji 5.8 7.9 6.4 4.5 4.5 – – – 12.4 12.4 3.4 – –
El Salvador 6.2 7.1 4.1 1.5 1.6 48 – 21.1 7.4 5.4 5.5 – –
Croatia – – – 2.6 0.7 – – – 6.7 4.1 – – – Portugal 2.1 1.2 1.3 0.3 0.2 – – 7.4 2.4 1.8 1 – 2.3 Vietnam – – – – 2.8 – – – – 13.6 – – – Honduras 6.7 – – 2.9 2.9 41 – 20 7.9 5.2 – – – Lithuania – – – 0.3 0.1 – – – 5.4 1.2 – – –

Countries Tariff revenues Tariffs Changes 1985‐2004 1980 1985 1990 2000 2004 1980 1985 1990 2000 2004 Change
Rev Change tariff
Change STD
Dominican Republic
9.8 6.5 6.3 7.2 6.5 – – 28 19.5 10.3 0 – –
Hungary 5 3.7 5.1 0.8 0.6 – – – 8.2 8.9 3.1 – 3.7
Bahrain 0.9 –7 1.1 1.3 0.9 – 6 – – – 0.2 – – Panama 3.1 4.1 1.8 4 1.6 – – 40 9.5 7.9 2.5 – –
Israel 5.1 2.9 –9 0.3 0.4 – – – 2 4.5 2.5 – –
Latvia – – – 0.3 0.2 – – – 5.6 3.2 – – – Taiwan 3.6 2.8 2.1 1.5 0.8 – – 9.7 8.8 6.9 2 – –
Slovenia – – – 0.8 0.3 – – – 11.8 3.9 – – – Slovak Rep. – – – 1 0.2 – – – 6 22.1 – – – Cameroon 11 6.1 5.4 9.2 9.2 – – – 18.4 18.1 3.1 – – Malta 4.9 4.5 4.9 0.6 0.7 – – – 8.8 8.8 3.8 – –
Bulgaria – 5.4 1.3 0.7 0.7 – – 11.4 13.7 10.2 4.7 – –

Table 3 All countries
Correlation between different openness measures
Exchange rate
Trade taxes/Trade volumes (PWT 6.1)
Tariffs Openness (X + M/GDP)
Real openness
DFI/GDP
Trade 0.0452 1.0000
Taxes/Trade 283 919
Tariffs 0.0314 0.6271* 1.0000
274 666 716
Openness 0.0172 ‐0.2459* 0.2470* 1.0000
291 561 464 607
Real open 0.0662 0.2200* 0.2970* 0.8921* 1.0000
293 579 461 566 630
DFI/GDP 0.0066 0.2501* 0.3016* 0.3708* 0.4129* 1.0000
281 559 445 567 576 607
Notes: Data from World Bank. Time period includes 1970‐2004. The asterisk indicates significant at the 5% level. A number of observations are underneath correlation coefficient.

Table 4 Developing countries only
Correlation between Different Openness Measures
Exchange rate
Trade taxes/Trade volumes (PWT 6.1)
Tariffs Openness (X + M/GDP)
Real openness
DFI/GDP
Trade 0.0194 1.0000
Taxes/Trade 188 435
Tariffs 0.1051 0.5863* 1.0000
180 301 323
Openness 0.0153 0.3594* 0.3556* 1.0000
(X + M)/GDP 196 392 313 432
Real openness
0.0625 0.2370* 0.3473* 0.8379* 1.0000
200 423 315 419 470
DFI/GDP 0.0377 0.2465* 0.3291* 0.4568* 0.3685* 1.0000
196 406 311 415 439 450
Notes: Data from World Bank. Time period includes 1970‐2004. The asterisk indicates significant at the 5% level. A number of observations are underneath correlation coefficient.

Table 5 Incomes, trade shares, and import tariffs in a panel of non‐OECD countries
Using trade shares as a measure of openness, 1960‐2000
Dependent variable: ln income per capita, in PPP $1993
(1) (2) (3) (4) (5) (6) (7) (8) OLS No controls
OLS No controls
OLS Includes controls
OLS Includes controls
IV No controls
IV No controls
IV Includes controls
IV Includes controls
3‐Year lag trade share 0.907 0.514 0.214 0.203 (0.036)**
* (0.037)***
(0.038)***
(0.035)***
Trade share 0.978 0.857 0.426 0.402 (0.037)**
* (0.057)***
(0.067)***
(0.064)***
Country fixed effects? NO YES YES YES NO YES YES YES Time fixed effects NO NO YES YES NO NO YES YES Observations 3294 3294 1996 2657 3288 3288 1996 2657 Using import tariffs as a measure of openness, 1970‐2000 3‐Year lag import tariff 3.586
(0.377)***
0.721 (0.142)***
0.298 (0.117)**
0.137 (0.119)
Average import tariff 4.830 (0.441)***
4.830 (0.441)***
0.635 (0.328)*
0.338 (0.379)
Country fixed effects? No Yes Yes Yes No Yes Yes Yes Time fixed effects No No Yes Yes No No Yes Yes Observations 1617 1617 1261 1485 1415 1415 1125 1306 Notes: Source is Aisbett, Harrison, and Zwane (2005), as reported in Harrison (2007). Huber robust standard errors in parenthesis. Data are annual data, with one observation for each country and year. The dependent variable is the log of income per capita, in PPP $1993. Trade share is the share of exports plus imports in GDP. Import tariffs are import revenues divided by the value of imports. Both are taken from the World Bank’s indicators. OLS indicates ordinary least squares and IV indicates instrumental variables. All regressions exclude OECD high‐income countries. Columns (3) and (7) include controls for inflation, government expenditure in GDP, currency crises, investment in GDP, and the fraction of the population that is literate. Columns (4) and (8) include controls for inflation, government expenditure, and currency crises. In instrumental variable regressions, trade share is instrumented using 3‐year lagged value, and import tariff is instrumented using 3‐year lagged value.

Table 6 The specific sectors targeted by 29 countries for the 1985‐2000 period (from Alfaro & Charlton, 2008)
Industries
Code Targeted by number of countries
Growth in value added
FDI/value added
Share of value added
Dep. external finance
White high skill
Blue and white high skill
Agriculture and fishing 1 4 2.617 0.001 0.055 0.297 0.040 0.707
Mining of metals 2 2 3.309 0.000 0.015 0.455 0.168 0.687 Extraction of petrochemicals 3 5 1.473 0.009 0.012 0.318 0.341 0.674 Food products 4 5 5.314 0.013 0.041 1.717 0.074 0.427
Textile and wood activities 5 5 3.362 0.015 0.026 0.946 0.145 0.594
Petroleum, chemical, rubber, plastic products 6 9 5.755 0.033 0.043 0.285 0.397 0.546 Metal and mechanical products 7 3 5.104 0.024 0.037 0.796 0.181 0.615
Machinery, computers, RTV, communication 8 10 5.821 0.013 0.051 0.692 0.352 0.619
Vehicles and other transport equipments 9 11 5.999 0.032 0.022 0.664 0.357 0.644
Electricity, gas and water 10 3 4.471 0.004 0.038 0.359 0.257 0.599
Construction 11 0 6.563 0.001 0.087 0.919 0.071 0.711
Trade and repairs 12 1 6.004 0.010 0.163 0.416 0.151 0.262
Hotels and restaurants 13 5 7.518 0.003 0.031 0.100 0.062 0.349
Land, sea, and air transport 14 1 5.733 0.002 0.071 0.150 0.055 0.140
Telecommunications 15 12 6.762 0.007 0.031 0.119 0.033 0.190
Monetary intermediation 16 1 5.071 0.030 0.053 2.445 0.820 0.827
Other financial intermediation 17 1 9.184 0.050 0.006 3.613 0.714 0.737
Insurance 18 1 5.974 0.050 0.013 3.586 0.761 0.773
Real estate and business activities 19 11 8.741 0.008 0.210 0.173 0.564 0.612 Notes: Number of industries corresponds to the 3‐digit ISIC Rev. 3. FDI corresponds to Foreign Direct Investment Flows from OECD International Direct Investment Database. Dependence on external finance is the difference between investment and cash generated from operations in the US following Rajan and Zingales (1998). Skill data are the ratio of high‐skilled workers to other workers in German Industries. Skilled workers include: White‐collar high‐skill (WCHS): Legislators, senior officials and managers (Group 1), Professionals (Group 2), Technicians and associate professionals (Group 3). White‐collar low‐skill (WCLS): Clerks, service workers (Group 4), shop and sales workers (Group 5). Blue‐collar high‐skill (BCHS): Skilled agricultural and fishery workers (Group 6), Craft and related trade workers (Group 7). Blue‐collar low‐skill (BCLS): Plant and machine operators and assemblers (Group 8), Elementary occupations (Group 9). See Appendix for detailed explanation of all variables and sources.

Table 7 Foreign investment and technology spillovers Countries Years Data Technology
spillovers? Details
1. Globerman and Steven (1979)
Canada 1972 Industry level Yes (positive horizontal spillovers)
Positive horizontal spillovers
2. Blomstrom and Persson (1983)
Mexico 1970 Industry level (the Mexican manufacturing industry 1970)
Yes (positive horizontal spillovers)
Positive horizontal spillovers (the existence of spillovers efficiency benefits from the foreign‐owned plants to the domestically owned ones)
3. Blomström(1986)
Mexico Mexican census of manufactures 1970 and 1975
Industry level Yes (positive horizontal spillovers)
Positive horizontal spillovers (a result of the fact that input market start to operate better because of foreign entry rather than technology transfer)
4.Haddad and Harrison (1993)
Morocco 1985‐1989 Firm level No No evidence of spillovers (The results reject the hypothesis that foreign presence accelerated productivity growth in domestic firms)
5. Blomstrom and Wolff (1994)
Mexico 1970/1975 Industry level Yes (positive horizontal spillovers)
Positive horizontal spillovers (suggested by the fact that productivity levels of locally owned firms in Mexico have converged on those of foreign‐owned firms)
6. Caves (1996) Australia and Canada
Canada (1965‐1967) and Australia (1963‐1963, 1966‐1967)
Industry level Yes (positive horizontal spillovers)
Positive horizontal spillovers for both Canada and Australia (foreign investment impels higher technical efficiency in competing domestic firms and speeds the transfer of new technology of them). However, this result is not that significant for Canada probably because of the existence of tariffs

7. Kokko (1994) Mexico 1970 Industry level (the Mexican manufacturing industry 1970)
Large technology and high foreign shares are harmful for spillovers.
The results suggest that advanced MNC technologies or large technology gaps alone do not constitute unsurmountable obstacles to spillovers, but that spillovers are less likely in industries when large technology gaps and high foreign shares coincide.
8. Kokko (1996) Mexico 1970 Industry level (the Mexican manufacturing industry 1970)
This chapter examines the signs of productivity spillovers
This chapter examines if there are signs of productivity spillovers from competition between local firms and foreign affiliates. The results indicate that spillovers from competition are not determined by foreign presence alone, but rather by the simultaneous interactions between foreign and local firms
9. Kokko, Tansini, and Zejan (1996)
Uruguay 1988‐1990 Firm level No No spillovers in a general sense. But there is a positive horizontal spillover in the subsample of plants with moderate technology gaps vis‐à‐vis foreign firms
10. Borensztein et al. (1998)
69 LDC 1970‐1989 Industry level (cross section)
Yes (positive horizontal spillovers)
Positive horizontal spillovers from FDI only when a sufficient absorptive capability of the advanced technologies is available in the host economy
11. Aitken and Harrison (1999)
Venezuela 1976‐1989 Firm level (panel) No No evidence supports the existence of technology “spillovers” from foreign firms to domestically owned firms

12. Blomstrom and Sjoholm (1999)
Indonesia 1991 Plant level (Indonesian Central Bureau of Statistics)
Yes (positive horizontal spillovers)
Positive horizontal spillovers (Labor productivity is higher in establishments with foreign equity than in purely domestically owned firms and the latter benefit from spillovers from FDI). But these spillovers were restricted to nonexporting local firms
13. Chuang and Lin (1999)
Taiwan 1991 Firm level (Taiwan’s manufacturing census data)
Yes (positive horizontal spillovers)
Positive horizontal spillovers effect on firm’s productivity
14. Sjoholm (1999)
Indonesia 1980 and 1991 Plant level Yes (positive horizontal spillovers)
Positive horizontal spillovers (suggested by the fact that high competition to increase the degree of spillovers from FDI) and high technology gaps give rise to large spillovers
15. Sjoholm (1999)
Indonesia 1980 and 1991 Plant level Yes (both positive horizontal and vertical)
Both interindustry and intraindustry spillovers are found, which indicates an evidence of positive horizontal as well as vertical spillovers
16. Djankov and Hoekman (2000)
Czech Republic
1992‐1996 Firm level Yes (positive horizontal spillovers)
Positive horizontal spillovers (foreign investment has the predicted positive impact on TFP growth of recipient firms. FDI appears to have a greater impact on TFP growth than do joint ventures, suggesting that parent firms are transferring more knowledge to affiliates than joint venture firms obtain from their partners)

17. Kathuria (2000)
India 1976‐1989 Firm level No (negative horizontal spillovers)
There is an efficiency gain for foreign‐owned in 13 out of 26 sectors. For these 13 sectors, there is a negative horizontal spillover from the presence of foreign firms in the sector, but foreign technical capital stock has a positive impact
18. Liu, Siler, Wang, and Wei (2000)
UK 1991‐1995 Industry level Yes (positive horizontal spillovers)
Positive horizontal spillovers. The study also shows that the extent to which local firms benefit from the introduction of advanced technology depends largely on their own technological capabilities
19. Bosco (2001) Hungary 1993‐1997 Firm level Insufficient evidence The evidence for technological spillovers is weak and does not allow clear‐cut conclusions. Foreign presence in high‐tech industries does seem to have a positive effect on both local and foreign firms
20. Damijan et al. (2001)
Bulgaria, Czech Republic, Estonia, Hungary, Poland, Romania, Slovakia Republic, and Slovenia
1994‐1998 Firm level No There are no significant positive horizontal spillovers for domestic firms from FDI. (Note: trade is an important alternative source of international R&D spillovers to firms without foreign participation in the Czech Republic, Poland, Romania, and Slovenia)
21. Driffield (2001)
UK 1989‐1992 Industry level (report on the census of production)
No No evidence of investment or output spillovers occurring as a result of inward investment. However, catching up does occur in foreign‐owned sector

22. Girma, Greeway, and Wakelin (2001)
UK 1991‐1996 Firm level No No aggregate evidence of horizontal (intraindustry) spillovers. Specifically, no wage and productivity spillovers to domestic firms as a result of foreign presence
23. Kinoshita (2001)
Czech Republic
1995‐1998 Firm level Yes (positive horizontal spillovers)
First, technology spillovers from FDI occur for firms that are more R&D intensive; second, spillovers from foreign joint ventures are insignificant for Czech manufacturing firms; lastly, the extent of technology spillovers is greater in oligopolistic sectors than in nonoligopolistic sectors
24. Kokko, Zejan, and Tansini (2001)
Uruguay 1988 Firm level Yes (positive horizontal spillovers)
Positive horizontal spillovers from FDI to a subsample of locally owned manufacturing plants with moderate technology gaps vis‐à‐vis foreign firms
25. Konings (2001)
Bulgaria, Romania, and Poland
1993‐1997 Firm level Yes (negative horizontal spillovers) for Gulgaria and Romaina, No for Poland
On average, there are negative horizontal spillovers to domestic firms in Bulgaria and Romania and there is no evidence of spillovers in Poland (a negative competition effect that dominates a positive technology effect)
26. Kugler (2001) Colombia 1974‐1998 Industry level Yes (positive vertical spillovers)
This study distinguishes intra‐ and interindustry spillovers. He finds widespread evidence for positive vertical (interindustry) spillovers, while horizontal spillovers appear only to be important in machinery equipment sector

27. Li, Liu, and Parker (2001)
China 1995 (1995 industrial census)
Industry level Yes (positive horizontal spillovers)
Positive horizontal spillovers for SOEs. Collective‐and‐private‐owned enterprises benefit from demonstration and contagion effects form foreign presence
28. Barrios and Strobl (2002)
Spain 1990‐1998 Firm level Yes (positive horizontal spillovers)
Positive horizontal spillovers only when domestic firms had the appropriate “absorptive capacity.”
29. Castellani and Zanfei (2002)
France, Italy, Spain
1992‐1997 Firm level Yes (positive horizontal spillovers)
Positive and significant horizontal productivity spillovers for Italian firms, negative spillovers on Spanish firms and nonsignificant effects on French firms
30. Carkovic and Levine (2002)
72 countries 1960‐1995 Industry level (cross section)
No No evidence of spillovers
31. Dimelis and Louri (2002)
Greece 1997 Firm level Yes (positive horizontal spillovers)
Positive horizontal spillovers. Moreover, the spillovers stemming form minority‐owned foreign establishments are larger than those from majority‐owned ones
32. Haskel, Pereira, and Slaughter (2002)
UK 1973‐1992 Plant level Yes (positive horizontal spillovers)
Positive horizontal spillovers from inward FDI to domestic plants
33. Girma (2002) UK 1989‐1999 Firm level No No evidence of productivity spillovers

34. Girma and Gorg (2002)
UK 1980‐1992 Firm level This chapter focuses on the role of absorptive capacity in benefiting from spillovers from FDI
This chapter focuses on the role of absorptive capacity in determining whether or not domestic firms benefit from productivity spillovers from FDI. The results show that there is an evidence for a u‐shaped relationship between productivity growth and FDI interacted with absorptive capacity, which suggests that improvements in absorptive capacity of firms may enhance their ability to benefit from spillovers from FDI
35. Girma and Wakelin (2002)
UK 1988‐1996 Firm level (OneSource Database)
Yes (positive horizontal spillovers)
Positive horizontal spillovers occur in the domestic firms (with the presence of multinational firms in the same sector and region)
36. Grog and Strobl (2002)
Ghana 1991‐1997 Firm level Yes (positive horizontal spillovers)
Positive horizontal spillovers from labor mobility
37. Gorg and Strobl (2002)
Ireland 1973‐1996 Plant level Yes (positive horizontal spillovers)
Positive horizontal spillovers for indigenous plants in high‐tech industries
38. Ruane and Ugur (2002)
Ireland 1991‐1998 Plant level No No evidence of productivity spillovers (when the measurement of foreign presence is the MNC employment as a percentage of total employment). However, a weak evidence of productivity spillovers is found when foreign presence measures as the level of employment in foreign companies in the relevant sector

39. Smarzynska (2002)
Lithuania 1996‐2000 Firm level Yes (positive vertical spillovers)
Positive vertical spillovers (the study shows that the existence of productivity spillovers from FDI taking place through contacts between foreign affiliates and their local suppliers in upstream sectors but there is no indication of spillovers occurring within the same industry)
40. Zukowska‐Gagelmann (2002)
Poland 1993‐1997 Firm level No (negative horizontal spillovers)
Negative horizontal spillovers for the most productive local firms in high competition industries and positive horizontal spillovers for the least productive local firms in low competition industries
41. Blalock and Gertler (2003)
Indonesia 1988‐1996 Firm level (panel) Yes (positive vertical spillovers)
Strongly positive vertical spillovers from FDI
42. Javorcik (2003)
Lithuania 1996‐2000 Firm level Yes (positive vertical spillovers)
Positive vertical productivity spillovers. Moreover, the results indicate that spillovers are associated with projects with shared domestic and foreign ownership but not with fully owned foreign investment
43. Keller and Yeaple (2003)
USA 1987‐1996 Firm level Yes (positive horizontal spillovers)
Positive horizontal spillovers form FDI (accounts for 14% of productivity growth of US firm, FDI leads to significant productivity gains for domestic firms), also a evidence of imports‐related spillovers
44. Liu (2008) China 1995‐1999 Firm level Yes (no horizontal but positive vertical spillovers)
No positive horizontal spillovers (negative short‐run effects) but strong positive backward linkages

45. Hu and Jefferson (2002)
China 1995‐1999 Firm level No (negative horizontal spillovers)
Sample restricted to China’s electronic and textile industries, drawn from the survey of large and medium enterprises conducted by the Chinese National Statistical Bureau. The authors find negative horizontal spillovers, although the impact is positive for firms receiving foreign investment
46. Liu et al. (2008)
China 1998‐2005 Firm level Yes (positive forward spillovers, net zero horizontal spillovers)
They find that Hong Kong, Macao, and Taiwan (HMT) invested firms generate negative horizontal spillovers, while Non‐HMT foreign firms tend to bring positive horizontal spillovers. These two opposing horizontal effects seem to cancel out at the aggregate level. They also find forward spillover effects from all types of FDI