Embed Size (px)
Citation preview

Performance of Transport Corridors in Central and South Asia Measurements 2008-2009 Transport Unit, Sustainable Development Department Europe and Central Asia Region DRAFT, May 2011
Document of the World Bank
Pub
lic D
iscl
osur
e A
utho
rized
Pub
lic D
iscl
osur
e A
utho
rized
Pub
lic D
iscl
osur
e A
utho
rized
Pub
lic D
iscl
osur
e A
utho
rized
Pub
lic D
iscl
osur
e A
utho
rized
Pub
lic D
iscl
osur
e A
utho
rized
Pub
lic D
iscl
osur
e A
utho
rized
Pub
lic D
iscl
osur
e A
utho
rized

Vice President, Europe and Central Asia: Phillipe H. Le Houerou Country Director, ECCU8: Motoo Konishi Sector Manager, Transport ECSSD: Henry Kerali Task Team, ECSSD: Cordula Rastogi
Nargis Ryskulova

ABBREVIATIONS AND ACRONYMS
ADB Asian Development Bank BCP Border Crossing Point BEEPS Business Environment and Enterprise Performance Survey BOMCA Border Management Programme in Central Asia CAREC Central Asia Region Economic Cooperation CIS Commonwealth of Independent States ECA Eastern Europe and Central Asia Region ETI Enabling Trade Index EU European Union GTZ Gesellschaft fuer Technische Zusammenarbeit IP Investment Projects ISAF International Security Assistance Force LPG Liquid Petroleum Gas LPI Logistics Performance Index MNA Middle East and Northern Africa Region MS Bar Molten Soft Bar NATO North Atlantic Treaty Organization NSW National Single Window OECD Organization for Economic Cooperation and Development ROW Rest of World RTC Road Transport Corridor TA Technical Assistance TIR Transports Internationaux Routiers TTFCA Trade and Transport Facilitation Central Asia UNCTAD United Nations Conference on Trade and Development USAID United States Agency for International Development WCO World Custom Organization WDR World Development Report WTI World Trade Indicators

CONTENTS
EXECUTIVE SUMMARY ............................................................................................................................................ I
Capturing Economic Benefits of Transport Facilitation ......................................................................................... i Key Findings ......................................................................................................................................................... ii General Conclusions ............................................................................................................................................ iii Key Recommendations ........................................................................................................................................ iv
I. TRADE AND TRANSIT CORRIDOR OVERVIEW ...................................................................................................... 1
Measuring the Transport Corridors Performance ................................................................................................ 3
II. KEY TRADE PATTERNS AND CHALLENGES ACROSS THE REGION ......................................................................... 4
Trade Patterns ...................................................................................................................................................... 4 Transport and Logistics Performance ................................................................................................................... 6 Logistics Performance Index ................................................................................................................................. 7 The Road Transport Sector ................................................................................................................................. 10 Trade Facilitation and Logistics .......................................................................................................................... 11
III. SURVEY METHODOLOGY ................................................................................................................................. 13
Selection of Road Transport Corridors and Border Crossing Points ................................................................... 13 Border Crossing Performance Measurements .................................................................................................... 14 Data Collection Challenges ................................................................................................................................. 14
IV. SUMMARY OF MAIN FINDINGS....................................................................................................................... 15
A. Border Crossing Performance ................................................................................................................... 15 Country Specific Findings .................................................................................................................................... 15
Kazakhstan ...................................................................................................................................................................... 16 Kyrgyz Republic ............................................................................................................................................................... 17 Tajikistan ......................................................................................................................................................................... 17 Afghanistan ..................................................................................................................................................................... 17 Pakistan ........................................................................................................................................................................... 17
B. Performance of Transport Corridors ......................................................................................................... 18
ANNEX A: SURVEY METHODOLOGY AND INSTRUMENTS ..................................................................................... 20
ANNEX B: PERFORMANCE INDICATORS ............................................................................................................... 24
Performance of BCPs in Kazakhstan ................................................................................................................... 24 Kordai BCP (Kazakhstan/Kyrgyzstan) .............................................................................................................................. 25 Syrym BCP (Kazakhstan/Russia) ...................................................................................................................................... 26 B. Konysbaev (Kazakhstan/Uzbekistan) .......................................................................................................................... 26 Korgas BCP (Kazakhstan/China) ...................................................................................................................................... 27
Performance of BCPs in Kyrgyzstan .................................................................................................................... 28 Ak-Jol (Kyrgyzstan/Kazakhstan) ...................................................................................................................................... 29 Dostuk BCP (Kyrgyzstan/ Uzbekistan) ............................................................................................................................. 29 Kyzyl-Bel BCP (Kyrgyzstan/ Tajikistan)............................................................................................................................. 30
Performance of BCPs in Tajikistan ...................................................................................................................... 30 Guliston BCP (Tajikistan/ Kyrgyz Republic) ...................................................................................................................... 31 Bratstvo BCP (Tajikistan/ Uzbekistan) ............................................................................................................................. 31 Fotehobod BCP (Tajikistan/ Uzbekistan) ......................................................................................................................... 32 Nijnii Pyandj BCP (Tajikistan/ Afghanistan) ..................................................................................................................... 32
Performance of BCPs in Afghanistan .................................................................................................................. 33 Sherkhan Bandar BCP (Afghanistan/ Tajikistan).............................................................................................................. 33 Hairatan BCP (Afghanistan/ Uzbekistan) ......................................................................................................................... 33

Performance of BCP in Pakistan ......................................................................................................................... 33 Torkham (Pakistan/Afghanistan) .................................................................................................................................... 34
ANNEX C: OBSERVATIONS OF ROAD TRANSPORT CORRIDORS ............................................................................. 35
Syrym –Kyzyl Orda – B. Konysbaev ..................................................................................................................... 35 Korgas - Kordai– B. Konysbaev ........................................................................................................................... 35 Kordai–Astana- Kairak ....................................................................................................................................... 36 Ak-Jol–Bishkek- Osh- Dostuk .............................................................................................................................. 36 Ak-Jol–Bishkek- Osh- Kyzylbel ............................................................................................................................ 37 Fotehobod – Proletarsk – Guliston ..................................................................................................................... 37 Bratstvo –Dushanbe – Nijnii Pyandj ................................................................................................................... 38 Torghundi –Herat ............................................................................................................................................... 38 Torkham – Islamabad - Karachi ......................................................................................................................... 38
ANNEX D: REFERENCES ........................................................................................................................................ 40
ANNEX E: MAPS ................................................................................................................................................... 42

FIGURES
Figure 1. Sea, Rail and Road Trade Routes for Freight to Europe .................................................................................................... 1Figure 2. Sample border crossing ..................................................................................................................................................... 4Figure 3. LPI 2009. Customs control procedures .............................................................................................................................. 8Figure 4. LPI 2009. Other control procedures .................................................................................................................................. 8Figure 5. LPI 2009. Logistics infrastructure ..................................................................................................................................... 8Figure 6. LPI 2009. Telecommunications/IT infrastructure (changes from 2007 to 2009) ............................................................... 8Figure 7. LPI 2009. Quality and availability of logistics services (changes from 2007 to 2009) ...................................................... 8Figure 8. LPI 2009. Logistics legislation .......................................................................................................................................... 8Figure 9. LPI 2009. Corruption in logistics ...................................................................................................................................... 9Figure 10. Sample border crossing ................................................................................................................................................. 14Figure 11. Average processing time at Kordai BCP for imports, total downtime and customs, 2007 – 2009, in hours .................. 25Figure 12. Average processing time at Kordai BCP for imports, 2008 and 20009, in hours .......................................................... 25Figure 13. Average processing time at Kordai BCP for exports, 2008 and 2009, in hours ............................................................. 25Figure 14. Average processing time at Kordai BCP for transit, 2008 and 2009, in hours ............................................................... 25Figure 15. Average processing time at Syrym BCP for imports, total downtime and customs, 2008 – 2009, in hours .................. 26Figure 16. Average processing time at Syrym BCP for imports, 2008 – 2009, in hours ................................................................. 26Figure 17. Average processing time at Syrym BCP for transit, 2008 – 2009, in hours ................................................................... 26Figure 18. Average processing time at B. Konysbaev BCP for imports, 2008 – 2009, in hours ..................................................... 27Figure 19. Average processing time at B. Konysbaev BCP for exports, 2008 – 2009, in hours ..................................................... 27Figure 20. Average processing time at B. Konysbaev BCP for transit, 2008 – 2009, in hours ....................................................... 27Figure 21. Average processing time at Korgas BCP for imports, total downtime and customs, 2006 – 2009, in hours ................. 28Figure 22. Average processing time at Korgas BCP for imports, 2008 – 2009, in hours ................................................................ 28Figure 23. Average processing time at Korgas BCP for exports, 2008 – 2009, in hours ................................................................ 28Figure 24. Average processing time at Korgas BCP for exports, 2008 – 2009, in hours ................................................................ 28Figure 25. Average processing time at Ak-Jol BCP for imports, total downtime and customs, 2007 – 2009, in hours .................. 29Figure 26. Average processing time at Ak-Jol BCP for imports and exports, 2009, in hours ......................................................... 29Figure 27. Average total downtime for imports at Kordai and Ak-Jol BCPs, 2007 – 2009, in hours ............................................. 29Figure 28. Average customs processing time for imports at Kordai and Ak-Jol BCPs, 2007 – 2009, in hours .............................. 29Figure 29. Average processing time at Dostuk BCP for imports and exports, 2009, in hours ........................................................ 30Figure 30. Average processing time at Kyzyl-Bel BCP for imports, exports, and transit, 2009, in hours ...................................... 30Figure 31. Average processing time at Guliston BCP for imports and exports, 2009, in hours ...................................................... 31Figure 32. Average total downtime for imports, exports and transit at Guliston and Kyzyl-Bel BCPs, 2009, in hours .................. 31Figure 33. Average customs processing time for imports, exports and transit at Guliston and Kyzyl-Bel BCPs, 2009, in hours ... 31Figure 34. Average processing time at Bratstvo BCP for imports and exports, 2009, in hours ...................................................... 32Figure 35. Average processing time at Fotehobod BCP for imports, exports, and transit, 2009, in hours ...................................... 32Figure 36. Average processing time at Nijnii Pyandj BCP for imports and exports, 2009, in hours .............................................. 32
TABLES
Table 1. Logistics Performance Index and Sub-Components, Scoring (2007, 2009) ........................................................................ 2Table 2. Spatial Transformations Accompanying the Development Process .................................................................................... 6Table 3. Enabling Trade Index 2009 ................................................................................................................................................. 9Table 4. Border Administration Sub-Index ..................................................................................................................................... 10Table 5. Transport and Communications Infrastructure Sub-index ................................................................................................ 10Table 6. Trading Across Borders: Central and South Asia (2010) .................................................................................................. 11Table 7. Logistics Performance Index and Sub-Components, Scoring (2007, 2009) ...................................................................... 12Table 8. Logistics Performance Index and Sub Components, Ranking (2007, 2009) ..................................................................... 12Table 9. Road transport corridors and border crossings selected for performance measurement .................................................... 13Table 10. Summary of Surveyed BCP by country (Processing Time in hours) .............................................................................. 16Table 11. Main Indicators of the Surveyed Corridors (Average) .................................................................................................... 19

ACKNOWLEDGEMENTS
The study was prepared by a World Bank team from the Sustainable Development Department comprising staff and consultants in the Transport Unit. The Project was led by Cordula Rastogi and Nargis Ryskulova. A preliminary draft report was prepared by Borislava Mircheva, Consultant. World Bank management oversight was provided by Motoo Konishi, Regional Director for Central Asia, and Henry Kerali, Transport Sector Manager. Bonita Brindley provided editorial advice and support. Comments are gratefully acknowledged from Michel Zarnowiecki, Tapio Naula, Oleg Samukhin, Philippe Cabanius, and government counterparts.
Measurements are based on first-hand knowledge from transporters involved in
international trade. Particular thanks go to our national partner participants, who carried out measurements with a team of trained observers, including: Forum of Entrepreneurs of Kazakhstan, Association of International Road Carriers of the Kyrgyz Republic (KyrgyzAsmap), Association of International Automobile Carriers of the Republic of Tajikistan (ABBAT), and the Turkmen Association of International Road Carriers (THADA).
This publication is made possible in part by support of the American people through the
United States Agency for International Development. The contents are the sole responsibility of the authors and do not necessarily reflect the views of USAID or the United States Government.
i
Performance of Transport Corridors in Central and South Asia
EXECUTIVE SUMMARY
This study is part of the ongoing dialogue on reforming trade logistics, and facilitating trade and transportation in Central and South Asian countries. It presents key findings from several rounds of first-hand observations and interviews conducted with multiple stakeholders to measure the performance of key road transport corridors across the region, including Kazakhstan, Kyrgyz Republic, Tajikistan, and to some extent, Pakistan and Afghanistan. The study identifies obstacles that hinder efficient movement of goods along transport corridors, and offers recommendations for short- and medium-term reforms for participating country governments with particular emphasis on the performance of border crossings.
Efficient transport corridors are an internationally shared characteristic of well functioning economies. Today, the Central and South Asia region has a total potential transit capacity of about 220 million tons, and this capacity is expected to increase to 400 million tons by 2020, according to a 2009 report from the Eurasian Development Bank. However, this potential, and the resulting economic benefits, can be realized only if the countries can work together to counteract the three major developmental challenges that were cited in the 2009 World Development Report: low density, long distances, and high divisions.
Central and South Asian countries face unique transport sector challenges such as far lower economic density than OECD member countries. Therefore, the overall objective of this study is to provide basic information on transport corridor performance so that national policy makers and private sectors have a basis to open discussions on how they might cooperate to facilitate international trade and transport by addressing infrastructure and operational bottlenecks in the region. This report is based on findings from surveys carried out in the region during 2008 and 2009; it compares the performance of transport corridors among countries and assesses the impact on movement of goods in Afghanistan, Kazakhstan, Kyrgyz Republic, Pakistan, Tajikistan, and Turkmenistan. Background and context for study results are provided in the Annexes, including existing trade patterns, the logistics environment of participating countries based on international rankings, and the survey instruments and detailed survey results.
Capturing Economic Benefits of Transport Facilitation
Efficient transport corridors not only facilitate transfer of freight and passengers, but also correlate strongly with transport cost savings, trade expansion, and economic growth. Improvements to transport corridor efficiency have been shown to enhance regional integration, improve international freight traffic management, encourage neighboring nations to implement uniform legislative frameworks, and harmonize their border procedures and documentation with international standards and practices. Cooperation on transport corridor development also helps each country clarify infrastructure priorities and invest in missing links; this in turn provides a spatial framework to enhance cooperation among countries and between public and private sector entities that provide trade and transport infrastructure and services.
Central and South Asian governments are increasingly aware that improving transport corridor performance is essential to accelerating trade flows and economic prospects. The

ii
Government of Kazakhstan has declared trade and transport facilitation a national priority. Policymakers in Tajikistan have stated that removing barriers along the transport network is a priority. As a result of government efforts and international support, some positive signs are beginning to emerge. In recent surveys, some 60 to 70 percent of respondents indicated improvements in logistics infrastructure and telecommunications and IT infrastructure.
The economic benefits of recent achievements are now compromised and threatened by infrastructure deterioration. Across the region, roads are the preferred option for short-haul transport, and frequently for longer hauls too but efficiency along land transport routes is increasingly undermined by road networks that are deteriorating due to difficult terrain, extreme temperatures, excessive loads, vast distances, and above all, lack of road maintenance budgets, in part due to the region’s low population density.
Recognizing the importance of efficient transport corridors to a well-functioning economy, the World Bank has supported performance measurement since 2005. The Bank has presented findings in national seminars with governments, private sector participants, and local and international stakeholders, and continues to seek opportunities to assist governments to improve their performance. The results of this work, which is undertaken with the private sector, provides the basis for World Bank engagement with policy makers in the region with a view to addressing physical and non-physical barriers, and increasing service standards along selected land transport corridors.
Key Findings
This study confirmed that Central and South Asian countries bear higher cost burdens for trade than many other countries due to low-quality operations and inadequate infrastructure capacity. As a result, most traders in Central and South Asia lack access to door-to-door logistics services common in industrialized countries and yet the economy of every country in the region depends on regional and international transport corridors to carry their goods to international markets. Most of the region’s road and rail corridors were built during the borderless Soviet era; today, traders must deal with a protracted and haphazard sequence of procedures, agencies, and services, all highly prone to rent-seeking and over-regulation.
Management of border crossing points differs by country. However, all border crossing points (BCPs) in this study are characterized by multiple checks, fragmented controls, low-quality services, obsolete equipment, inadequately trained personnel, and frequent requests for unofficial payments that cause unpredictably long waits and significantly increase transit times and overall transport costs. Despite several ongoing initiatives, transport costs depend on operations as much as the quality or capacity of related infrastructure, and transport corridor competitiveness is severely hampered by long-drawn-out border clearance procedures with multiple agencies. There are physical and non-physical barriers to competiveness. Physical barriers include missing transport links; poor quality road infrastructure conditions; poor inter-modal facilities; and lack of modern processing equipment at border crossing points.
Non-physical barriers include frequency and duration of stops and check points along transport corridors for customs, police, transport authorities, phyto-sanitary, and immigration, and frequent demands for unofficial payments from transporters that vary by country. For example, in Kazakhstan and Kyrgyz Republic, only loaded trucks are stopped for official checks and unofficial payments; trucks travelling under the convention of the Transports Internationaux Routiers (TIR) are not excluded from these stops. Other non-physical barriers include lack of

iii
harmonized legislation, standards and procedures to move freight and passengers across borders, including transit procedures, trade transactions, market regulations, inter-operability, and weight limits, among others.
Trade and transport facilitation is high on the agenda of the World Bank, other donors, and bilateral agencies. Corridor performance measurements conducted in 2008 and 2009, and the measurements carried out in previous years provided useful information about the extent of physical and non-physical barriers to trade in the region.
General Conclusions
Corridor performance measurements and data from previous years confirm trends across all countries, in particular that officials use a variety of opportunities along the corridors and at border crossing posts to request unofficial payments from drivers. Overall conclusions from this study are as follows.
• Continuous performance monitoring is essential. Regular performance measurements are important to monitor new developments and track implementation of previous policy recommendations. However, control agencies may speed up official processing and initiate fewer traffic stops along the corridors if they are aware of being monitored.
• Qualitative information provides a fuller picture. Driver interviews about obstacles faced along the corridors and the border crossing posts provide useful anecdotal information that could be supplemented by survey work with transport agencies and companies.
• Inadequate physical infrastructure at border crossing posts adds substantial delays. Lack of modern equipment, such as vehicle scanners and document processors, adds to delays
• Responsibilities among border agencies are unclear. Duplication, overlap, and confusion are common among border service and customs control officials. Guidelines and responsibilities need to be clarified. Some activities performed by agencies duplicate or overlap with other agencies, which wastes time and increases the number of obligations for unofficial payments
• Few control agencies function as safety mechanisms. At border crossing posts, many veterinary and phyto-sanitary agencies lack equipment to perform required tests and merely process documents. Where a one-stop-shop option exists, agencies still do not undertake specific checks or tests.
• TIR fails to deliver the same benefits as it does in Western Europe. Driver interviews indicated that TIR is not only too expensive but also is seen by many corridor and border officials as an opportunity to extract larger unofficial payments.
• Loaded trucks endure longer border processing times and frequent stops enroute. Whether cargo is being imported or exported is irrelevant to border processing times or frequency of stops along the corridors; empty trucks offer little opportunity to extract unofficial payments.

iv
Key Recommendations
Despite a good start in some areas, much remains to be done before Central and South Asia realizes its potential as a transit region between Europe and Asia. Based on the research and studies undertake to prepare this report, key recommendations are as follows.
• Move towards integrated border management while strengthening customs processing. To facilitate the movement of goods, all border crossing agencies need to cooperate to achieve a more effective level of border management. Customs administrations are often the agency of choice to lead the development of integrated processes and procedures at borders.
• Implement performance measurement systems to establish benchmarks and track progress. International experience in trade and transport facilitation programs recommends using performance measurement systems as a tool for dialogue among policy makers and the private sector so they can cooperate to reduce trade and transport bottlenecks. Measurements provide baseline indicators to: (i) compare regional transport corridor performance against international benchmarks; (ii) identify major trade impediments; and (iii) propose improvements.
• Plan improvements to trade and transport services along corridors in parallel with border crossing point development and road infrastructure investments. All three elements are necessary to achieve supply chain predictability. For example, several ongoing investment projects (some supported by international financial institutions) focus on rehabilitating specific sections of road corridors, which should reduce travel time and related costs. However these investments may yield fewer benefits for transit traffic where 24-hour border services are unavailable (e.g., at Dostuk BCP), or where BCP traffic management is sub-optimal (e.g., at Akjol and Kordai BCPs). In addition, significant delays result from a lack of modern equipment to perform vehicle scanning or transit document processing at most BCPs in Tajikistan and Afghanistan, where these processes must be done manually.
• Encourage Afghanistan and Pakistan to forge a new Trade and Transport Agreement. The requirement now is that goods must be unloaded from inbound trucks and reloaded to trucks on the other side of the border, a major impediment to efficient movement of goods.

______________________________________________________________________________ 1
I. TRADE AND TRANSIT CORRIDOR OVERVIEW
1. Landlocked countries in Central and South Asia1 have significant strategic potential for increasing freight transit.2 All countries need to improve procedures for trade facilitation and transport connectivity to reduce transit time and transport costs. The region’s total estimated transit capacity is about 220 million tons and this is projected to increase to 400 million tons by 2020.3
Figure 1 However, this potential is hampered by numerous physical and non-physical barriers
along the land transport corridors ( ).
Figure 1. Sea, Rail and Road Trade Routes for Freight to Europe
Source: Financial Times, December 10, 2007.
2. Across the region, improvements in quality and availability of logistics services and logistics legislation have been observed. Among all countries surveyed and across all Logistics Performance Index (LPI) sub-indicators, the biggest improvements occurred in Kazakhstan, followed by Tajikistan. During 2007-09, most Central Asian countries improved their Logistics Performance Index rankings and scores.4
1 Kazakhstan, Kyrgyz Republic, Tajikistan, Turkmenistan and Uzbekistan
Kazakhstan made the most overall logistical improvements to trade and transport corridors, especially for international shipments, demonstrating good connectivity to domestic and international markets. The Kyrgyz Republic
2 Afghanistan, Pakistan 3 European Development Bank, Eurasian Integration Yearbook, 2009, p.186 4 The Logistics Performance Index (LPI) is a World Bank benchmarking tool that measures performance along a national logistics supply chain. The LPI approach is broader and more comprehensive than the Doing Business indicators, which focus on bureaucratic obstacles to moving goods across borders and the ease of export and import for small and medium-sized enterprises. Specifically, the LPI helped identify challenges and opportunities along the supply chain of 150 countries in 2007 and 155 in 2009, based on a worldwide survey of global freight forwarders and express carriers. Using a 5-point scale, the LPI looks at seven areas of performance: (i) customs; (ii) infrastructure; (iii) international shipments; (iv) logistics competence; (v) tracking and tracing; (vi) domestic logistics costs; and (vii) timeliness. Large differences are observed among countries occur because overall country performance hinges on the weakest links in the supply chain.

______________________________________________________________________________ 2
also improved logistical performance, and achieved the biggest improvement in international shipments among countries in this study. Efficiency also suffers because trade imbalances between countries create substantial numbers of empty backhauls that drive up freight rates as trucks travel empty on the return journey. Nevertheless, most countries are improving their LPIs in several areas (Table 1). Table 1. Logistics Performance Index and Sub-Components, Scoring (2007, 2009)
Country LPI Customs Infrastructure International shipments
Logistics competence
Tracking & tracing
Timeliness
Pakistan (2007) 2.62 2.41 2.37 2.72 2.71 2.57 2.93
Pakistan (2009) 2.53 2.05 2.08 2.91 2.28 2.64 3.08 Kyrgyz Republic (2007) 2.35 2.20 2.06 2.35 2.35 2.38 2.76 Kyrgyz Republic (2009) 2.62 2.44 2.09 3.18 2.37 2.33 3.10
Kazakhstan (2007) 2.12 1.91 1.86 2.10 2.05 2.19 2.65 Kazakhstan (2009) 2.83 2.38 2.66 3.29 2.60 2.70 3.25
Tajikistan (2007) 1.93 1.91 2.00 2.00 1.90 1.67 2.11 Tajikistan (2009) 2.35 1.90 2.00 2.42 2.25 2.25 3.16 Afghanistan (2007) 1.21 1.30 1.10 1.22 1.25 1.00 1.38
Afghanistan (2009) 2.24 2.22 1.87 2.24 2.09 2.37 2.61 Source: World Bank, Connecting to Compete 2009: Trade Logistics in the Global Economy.
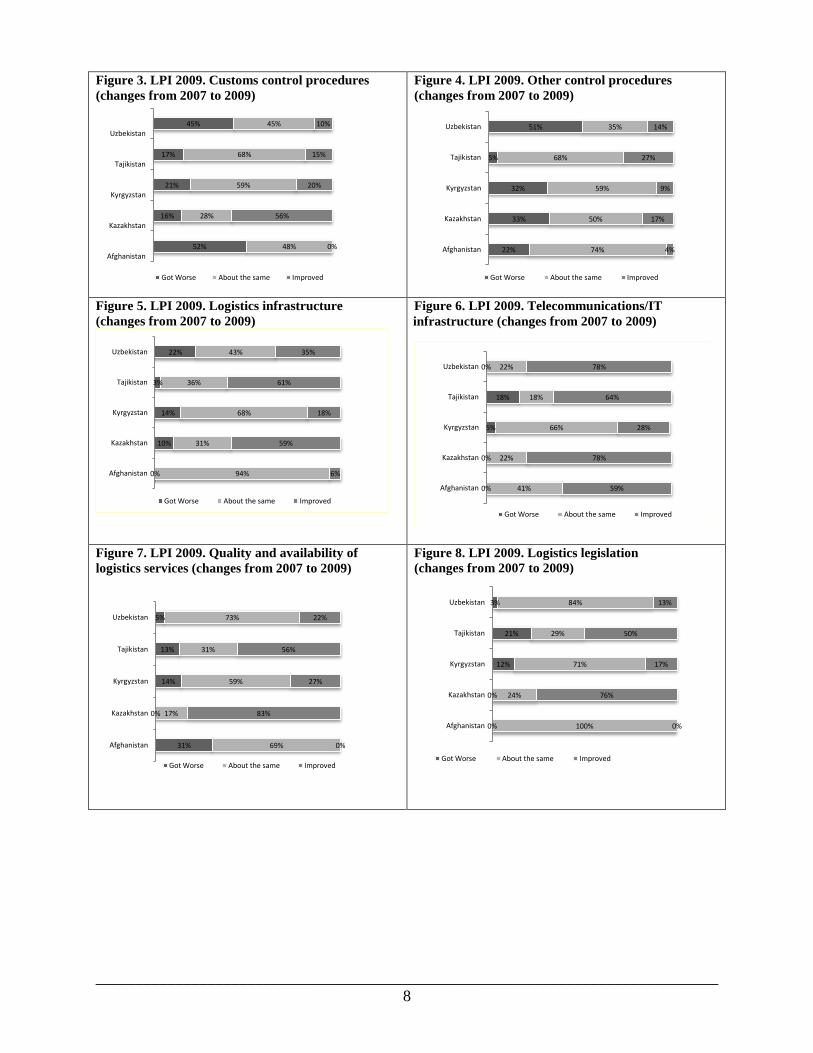
3. However, among LPI indicators, customs and control procedures have deteriorated notably, and corruption has increased in most monitored countries. During 2007-09, survey results indicate that customs procedures in Afghanistan deteriorated by 52 percent and in Uzbekistan by 45 percent. Almost half the surveys indicated that Uzbekistan’s control procedure performance worsened; Kazakhstan’s control procedure efficiency declined by 33 percent; Kyrgyz Republic by 32 percent; and Afghanistan, by 22 percent. During 2007-09, perceived corruption in logistics arrangements increased by 35 to 40 percent in study countries monitored.
4. On a positive note, several projects and programs are tackling barriers that impede efficiency along transport corridors. However, this study also concludes that much more can be done, particularly with regard to establishing conditions for integrated border management between countries. Investment projects and technical assistance continue to be implemented in the region to support Government programs aimed at improving corridor performance. For this study, road transport corridor selection was based on country requests and takes into account three major initiatives: (i) the Eurasian Economic Community (EurAsEC) led by Russia and Kazakhstan; (ii) the Central Asia Regional Cooperation (CAREC) Corridor development program; and (iii) the European Union through the Pan-European Axes and the program of Transport Corridor Europe-Caucasus-Asia (TRACECA).

______________________________________________________________________________ 3
Box 1. Selected Investment Projects and Technical Assistance under Implementation in the Region
In Central and South Asian countries, integrated border management has focused on border police through the implementation of the European Union’s Border Management Programme in Central Asia (BOMCA) together with initiatives to improve customs procedures supported through the Central Asia Regional Economic Cooperation (CAREC) Program by the Asian Development Bank (ADB), the German Technische Zusammenarbeit (GTZ), and the United States Agency for International Development (USAID). The BOMCA program pilot tested joint customs control between Kazakhstan and the Kyrgyz Republic and between Tajikistan and Afghanistan. In Kazakhstan, Government has undertaken a project on customs modernization (until 2013) to strengthen interaction and collaboration within customs, and between customs and other border control agencies in Kazakhstan and neighboring countries, supported by the World Bank. The project focuses on developing procedures to streamline and integrate border control activities into a ‘single window’ applying one-stop principles by establishing a unified information database that is shared with BCP regulating authorities. In Afghanistan, the World Bank is providing assistance to improve communications systems in customs, by introducing automated data systems (ASYCUDA) and management information systems. A list of ongoing and planned technical assistance and investment projects related to trade and transportation issues in Central and South Asia can be found at http://www.carecinstitute.org/index.php?page=projects.
Measuring the Transport Corridors Performance
5. Central and South Asia trade and transport corridor performance is being monitored by the World Bank and local counterparts.5
6. Since 2005, the World Bank has supported performance measurement of transport corridors. The Bank has presented these findings in national seminars with governments, private sector participants, and other local and international stakeholders. This study uses the principles of the methodology developed by United Nations Economic and Social Commission for Asia and the Pacific (UNESCAP)
International experience in trade and transport facilitation has proven that performance measurement systems are essential to achieving incremental improvements; they establish benchmarks against which progress can be monitored. Performance measurement results help policy makers achieve necessary reforms and help the private sector hold agencies responsible for reducing bottlenecks to improve international trade and transport. Performance measurements aid comparisons between regional transport corridor performance and international benchmarks, help to identify major trade impediments and potential remedies.
6
Annex A
combined with experience from Bank Trade and Transport Facilitation for South-East Europe program (TTFSE). This combined methodology presents a detailed breakdown of time spent with each agency associated with border crossings. Qualitative information from driver surveys supplements data collected through direct observation along corridors ( for instruments; Annex B for results).
7. This report examines the time and cost of moving freight by road through Central and South Asia, focusing on border and customs processing along specific transport corridors.7
5 Using a Bank-developed methodology, following a decision at a March 2005 conference in Bishkek.
Survey teams, deployed at pre-selected sites along the corridors, measured performance by observing traffic and monitoring paper trails. The methodology was tested, recalibrated, and validated with support from local public and private sector counterparts in
6 The UNESCAP graph method is now widely used in East and Central Asia to depict corridor performance. The graphs show a time-distance relationship for road and rail corridors; the vertical axis represents time or cost; the horizontal axis represents distance, with lines for the minimum, maximum, and average cost/time. 7 Other measurements include physical capacity of infrastructure, the corridor links and nodes and the utilization of these.

______________________________________________________________________________ 4
Central Asia.8 The methodology was improved by undertaking (i) survey measurements on-site at border crossings; (ii) transporter interviews; and (iii) trip diaries.9
Figure 2. Sample border crossing
Teams measured travel times along transport corridors and processing times at border crossings over five consecutive 24-hour weekday periods during 2008 and 2009. On-site observers recorded border processing times for vehicles transporting import/export shipments ( illustrates typical monitoring arrangements).
Figure 2. Sample border crossing
II. KEY TRADE PATTERNS AND CHALLENGES ACROSS THE REGION
Trade Patterns
8. During 1993-07, Central Asian country trade patterns changed very little. In 1993, 40 percent of Central Asian exports were destined for the ECA Region;10 38 percent, the EU-1511
8 Methodology for on-site physical measurements by independent surveyors, truck driver interviews, and trip diaries was developed and used under the trade and transport facilitation program in Southeastern Europe (TTFSE); it was adapted to Central Asian countries.
and 18 percent East Asia. These shares were similar in 2003 and 2007; ECA’s share increased to 43 percent then decreased to 39 percent, the EU-15 share decreased to 21 percent and then increased to 32 percent, and East Asia share decreased first to 13 percent and then to 16 percent. In 2003, Central Asian countries significantly diversified their trading partners and their rest of the world (RoW) share increased to 12 percent. However, in 2007, this RoW share dropped to 2.0 percent, which suggests that trade relations increased with their regional trading partners. For example, the Central Asia region contributed to 5.0 percent of Russian and other CIS countries’ imports in 1993, increasing this to 27 percent in 2003, and to 21 percent in 2007.
9 Trip diaries and interviews were a natural adaptation of the TTFSE methodology to Central Asian conditions—long transport route distances and multiple roadside checks to which truckers are subjected. 10 ECA Region Countries include Albania, Armenia, Azerbaijan, Belarus, Bosnia and Herzegovina, Bulgaria, Croatia, Czech Republic, Estonia, FYR Macedonia, Georgia, Hungary, Kazakhstan, Kosovo, Kyrgyz Republic, Latvia, Lithuania, Moldova, Montenegro, Poland, Romania, Russian Federation, Serbia, Slovak Republic, Slovenia, Tajikistan, Turkey, Turkmenistan, Ukraine, Uzbekistan 11 EU-15 comprises Austria, Belgium, Denmark, Finland, France, Germany, Greece, Ireland, Italy, Luxembourg, the Netherlands, Portugal, Spain, Sweden and the United Kingdom.
Country A Country B
Point of collection
Point of collection
Point of collection
Border agencies
Border agencies
Point of collection

______________________________________________________________________________ 5
Intra-Central Asian exports declined continuously from 15 percent in 1993 to 5.0 percent in 2003 and 4.0 percent in 2007.12
9. Trade structure in the region appears highly undiversified. In 2006, 59.2 percent of Central Asia’s exports were mineral fuels and oils, stimulated by the then-increasing price of crude oil. This benefited Central Asian countries producing mineral fuels and related materials but hampered trade diversification. By comparison, in 2006, the EU-8 and SE European regions’ top three export categories were machinery and transport equipment, manufactured goods, and textiles.
10. During 2007-08, Central Asia experienced economic growth but the global economic crisis has reversed this trend. Kazakhstan’s economy in particular, has declined with the sharp drop in oil and commodity prices. In Tajikistan, the value of 2009 exports is expected to contract by 7.0 percent,13
11. Kazakhstan and Turkmenistan are Central Asia’s biggest exporters. In 2007, 85 percent of the region’s exports came from Kazakhstan (69 percent) and Turkmenistan (15 percent). Kazakhstan’s top three importers were the EU-15, East Asia, and Russia. Turkmenistan exported primarily to the Commonwealth of Independent States (CIS), the Middle East and North Africa Region (MNA), and Turkey; the Kyrgyz Republic exported to Central Asia, Russia, and South Asia, Tajikistan to EU-15, RoW, and MNA. In 1993, Kazakhstan exports were valued at US$1.2 billion; Turkmenistan, US$0.6 billion; Kyrgyz Republic, US$243 million; and Tajikistan, US$186 million. In 2003 and 2007 Tajikistan and Turkmenistan performed better than the Kyrgyz Republic.
especially cotton and aluminum, due lower international prices; the Russian economic slowdown has shrunk Tajik migrant worker remittances by 22 percent, due to construction sector declines.
12. Russian economic slowdown contributes to trade deterioration in the region. Trade flows and financial ties strongly link the Kazakh and Russian economies, hence commodity price fluctuations affect both countries.14 Furthermore, Kazakh slowdown hurts the Kyrgyz Republic because 15 percent of Kyrgyz non-gold exports go to Kazakhstan.15 Projected annual export growth for 2009 is a negative 40 percent and for imports, negative 24.5 percent.16 Kyrgyz Republic exports were expected to decline from US$2,143 million in 2008 to US$1,841 million in 2009;17 imports were expected to decline from US$3,721 million in 2008 to US$3,211 million in 2009.18
13. Afghanistan and Pakistan share significant, if asymmetric, trade flows. During 2007-08, trade totaled over US$1.2 billion up from US$164 million during 2000-02. Significant formal exports flow from Pakistan to Afghanistan; significant informal exports flow from Afghanistan to Pakistan, primarily due to the low average weighted tariffs in Afghanistan of 3.0 to 4.0 percent, well below Pakistan’s tax, therefore trade is routed through Afghanistan. Informal trade comprises some 40 percent of economic activity in Pakistan’s Federally Administered Tribal Areas (FATA).
12 Trade statistics in this section are based on the concept note “Expanding Trade in Central Asia by Connecting with Markets”. 13 IMF Country Report No 09/174 14 According to the IMF Country Report No 09/300, data since 2000 suggests that 1.0 percent change in the growth of Russian GDP affects the change in growth of Kazakh GDP by 0.8 percent. 15 IMF Country Report No 09/300, the change of growth in Kazakhstan has almost one to one spillover effect in Kyrgyzstan 16 ibid. 17 IMF Country Report No 09/209 18 ibid.

______________________________________________________________________________ 6
14. South Asian intra-regional trade is of growing importance to Afghanistan and Pakistan. In 2005, intra-regional trade accounted for 5.7 percent in Pakistan and 35.1 percent in Afghanistan. In South Asia, intraregional trade is more diversified than it is in Central Asia. Textiles are the largest export, followed by semi-processed agricultural commodities, and petroleum.
15. Afghanistan and Pakistan face higher obstacles to trade during the global economic crisis. In 2008, Afghanistan faced higher commodity prices, drought, and wheat export restrictions from regional trading partners. However, overall trade volumes have increased from US$2.0 billion in 2003 to an estimated US$5.0 billion in 2009;19 bearing in mind that Afghanistan trade figures vary by source due to significant unofficial trade. Pakistan’s exports decreased by 7.4 percent, imports by 12.9 percent.20
Transport and Logistics Performance
16. Economic density is lower in Central and South Asia than it is in OECD countries.21 Higher densities, shorter distances, and smaller divisions are essential for economic success, according to the 2009 World Development Report (WDR) “Reshaping Economic Geography.” However, in Tajikistan and the Kyrgyz Republic, for example, less than 20 percent of people live in cities. Economic distance impedes trade and transport facilitation in the region; 22
Table 2. Spatial Transformations Accompanying the Development Process
the average index of shipping difficulty is about 174 (distance index) compared to about 25 for OECD countries. Borders and other non-tariff barriers increase the difficulty; the division index is more than 1, compared to about 14 for OECD countries. The 2009 WDR identifies such regions as “3D” neighborhoods, exhibiting three developmental challenges of low density, long distance, and high divisions. As a result, Central and South Asian countries can benefit from reshaping their economic geography because they now score low along these spatial dimensions (Table 2). Policymakers can use these three dimensions of economic geography to promote economic development and prosperity.
Region/Country Density Index
Distance Index
Division Index
OECD-countries 60 25 14 Europe and Central Asia 39 100 3 Afghanistan 25 174 n/a Kazakhstan 46 178 1 Kyrgyzstan 20 177 1 Pakistan 54 94 n/a Tajikistan 18 176 1
Average Central and South Asia 33 174 1 Source: WDR, 2009. Note: The Density Index is the Agglomeration Index developed in the WDR2009 and combining travel time to large urban centers and population
19 Emergency Project Paper on a Proposed Loan/Credit to the Islamic Republic of Afghanistan for a Customs Reform and a Trade Facilitation Project, estimated based on ASYCUDA and TRSU collected data 20 IMF Country Report No 09/265 21 Organization for Economic Co-operation and Development. 22 Economic distance is related to but not the same as physical distance. Economic density plus distance help characterize the spatial transformation that accompany development and may be necessary for rapid economic growth. http://siteresources.worldbank.org/INTWDR2009/Resources/4231006-1225840759068/PartOne_web_full.pdf
______________________________________________________________________________ 7
density and computed for 2000. The Distance Index is the 2008 index of shipping difficulty. The Division Index is the market potential index developed by Mayer (2008) for the WDR2009.
Logistics Performance Index
17. Effective and efficient movement across borders and along transport corridors is essential to advance the contribution of trade and transport to national economies. International benchmarking identifies areas in need of improvement and provides feedback on progress compared with other countries. Transport corridor performance measurements presented in this study provide indicators for specific corridors and border crossing points. Studying corridor efficiency and tracking it over time can pinpoint issues and help assess the effectiveness of policy measures. The study also highlights additional policy changes to improve the competitiveness of trade and transport corridors in Central Asia and South Asia.
18. Among 121 economies surveyed, Central and South Asian countries perform poorly, according to the Global Enabling Trade Report.23
19. International benchmarks and scoring presented reveal little variation in overall performance of the counties considered in this study. More variation occurs in specific sub-indicators. However, all countries lag in performance compared to the rest of the world, as illustrated by the overall trade and transport facilitation indicators. A major factor could be that these landlocked countries inevitably face more performance challenges along trade and transport corridors. Countries have managed to move forward in certain aspects and improve trade and transport facilitation. On the other, it is apparent that certain improvement is needed in terms of capacity and regulation.
Kazakhstan’s performance deteriorated in all indexes; the Kyrgyz Republic has improved, especially in market access. Sub-categories Border Administration and Transport and Communication infrastructure, which are most relevant for this study, are either stable or deteriorating. In 2009, Tajikistan’s overall ranking and ranking for many sub-categories has deteriorated over the previous year.
23 The Global Enabling Trade Report is developed by the World Economic Forum. The report measures and analyzes institutions, policies, and services enabling trade in national economies around the world, highlighting for policymakers a country’s strengths and the challenges to be addressed. The Report includes the most current data and recent analysis of the factors enabling trade in industrialized and emerging economies, and the latest thinking and research from trade experts and industry practitioners. The Report presents the rankings of the updated Enabling Trade Index (ETI), developed by the World Economic Forum in collaboration with international trade experts and leaders from the logistics and transport industry. It is a comprehensive index intended to capture the full range of issues that contribute to impeding trade, ranking nations according to factors that facilitate the free flow of goods across national borders and to destination.
______________________________________________________________________________ 8
Figure 3. LPI 2009. Customs control procedures (changes from 2007 to 2009)
Figure 4. LPI 2009. Other control procedures (changes from 2007 to 2009)
Figure 5. LPI 2009. Logistics infrastructure (changes from 2007 to 2009)
Figure 6. LPI 2009. Telecommunications/IT infrastructure (changes from 2007 to 2009)
Figure 7. LPI 2009. Quality and availability of logistics services (changes from 2007 to 2009)
Figure 8. LPI 2009. Logistics legislation (changes from 2007 to 2009)
52%
16%
21%
17%
45%
48%
28%
59%
68%
45%
0%
56%
20%
15%
10%
Afghanistan
Kazakhstan
Kyrgyzstan
Tajikistan
Uzbekistan
Got Worse About the same Improved
22%
33%
32%
5%
51%
74%
50%
59%
68%
35%
4%
17%
9%
27%
14%
Afghanistan
Kazakhstan
Kyrgyzstan
Tajikistan
Uzbekistan
Got Worse About the same Improved
0%
10%
14%
3%
22%
94%
31%
68%
36%
43%
6%
59%
18%
61%
35%
Afghanistan
Kazakhstan
Kyrgyzstan
Tajikistan
Uzbekistan
Got Worse About the same Improved
0%
0%
5%
18%
0%
41%
22%
66%
18%
22%
59%
78%
28%
64%
78%
Afghanistan
Kazakhstan
Kyrgyzstan
Tajikistan
Uzbekistan
Got Worse About the same Improved
31%
0%
14%
13%
5%
69%
17%
59%
31%
73%
0%
83%
27%
56%
22%
Afghanistan
Kazakhstan
Kyrgyzstan
Tajikistan
Uzbekistan
Got Worse About the same Improved
0%
0%
12%
21%
3%
100%
24%
71%
29%
84%
0%
76%
17%
50%
13%
Afghanistan
Kazakhstan
Kyrgyzstan
Tajikistan
Uzbekistan
Got Worse About the same Improved
______________________________________________________________________________ 9
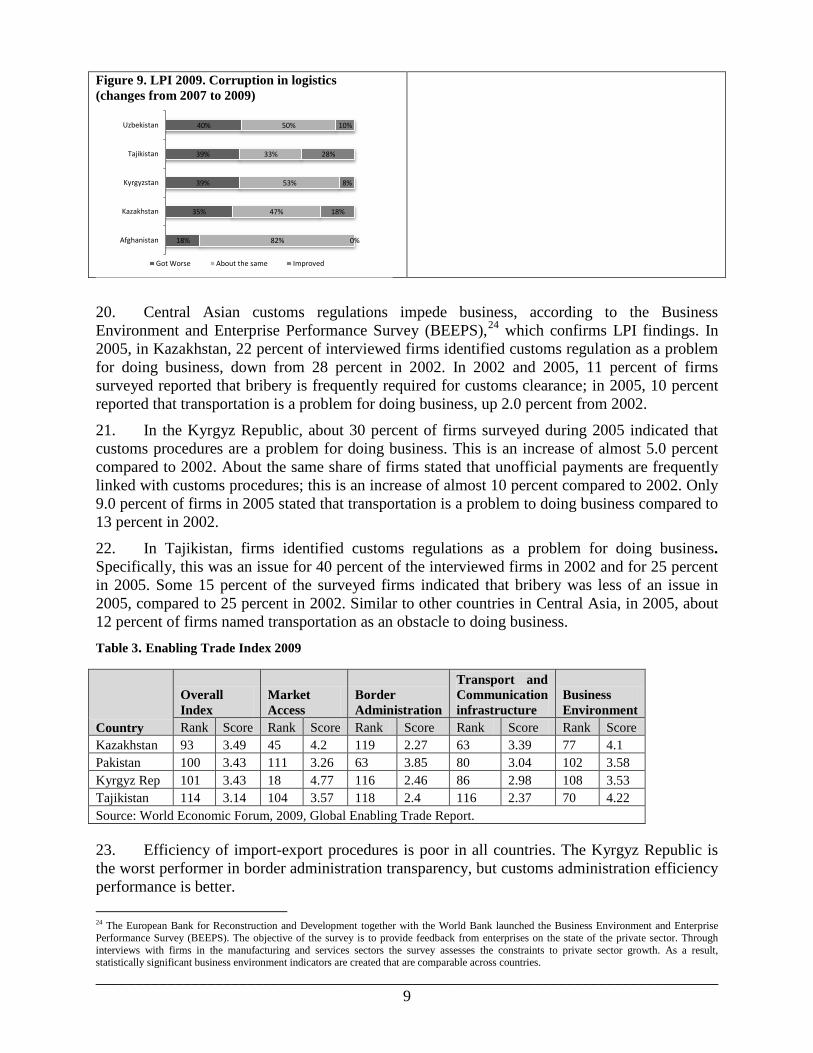
Figure 9. LPI 2009. Corruption in logistics (changes from 2007 to 2009)
20. Central Asian customs regulations impede business, according to the Business Environment and Enterprise Performance Survey (BEEPS),24
21. In the Kyrgyz Republic, about 30 percent of firms surveyed during 2005 indicated that customs procedures are a problem for doing business. This is an increase of almost 5.0 percent compared to 2002. About the same share of firms stated that unofficial payments are frequently linked with customs procedures; this is an increase of almost 10 percent compared to 2002. Only 9.0 percent of firms in 2005 stated that transportation is a problem to doing business compared to 13 percent in 2002.
which confirms LPI findings. In 2005, in Kazakhstan, 22 percent of interviewed firms identified customs regulation as a problem for doing business, down from 28 percent in 2002. In 2002 and 2005, 11 percent of firms surveyed reported that bribery is frequently required for customs clearance; in 2005, 10 percent reported that transportation is a problem for doing business, up 2.0 percent from 2002.
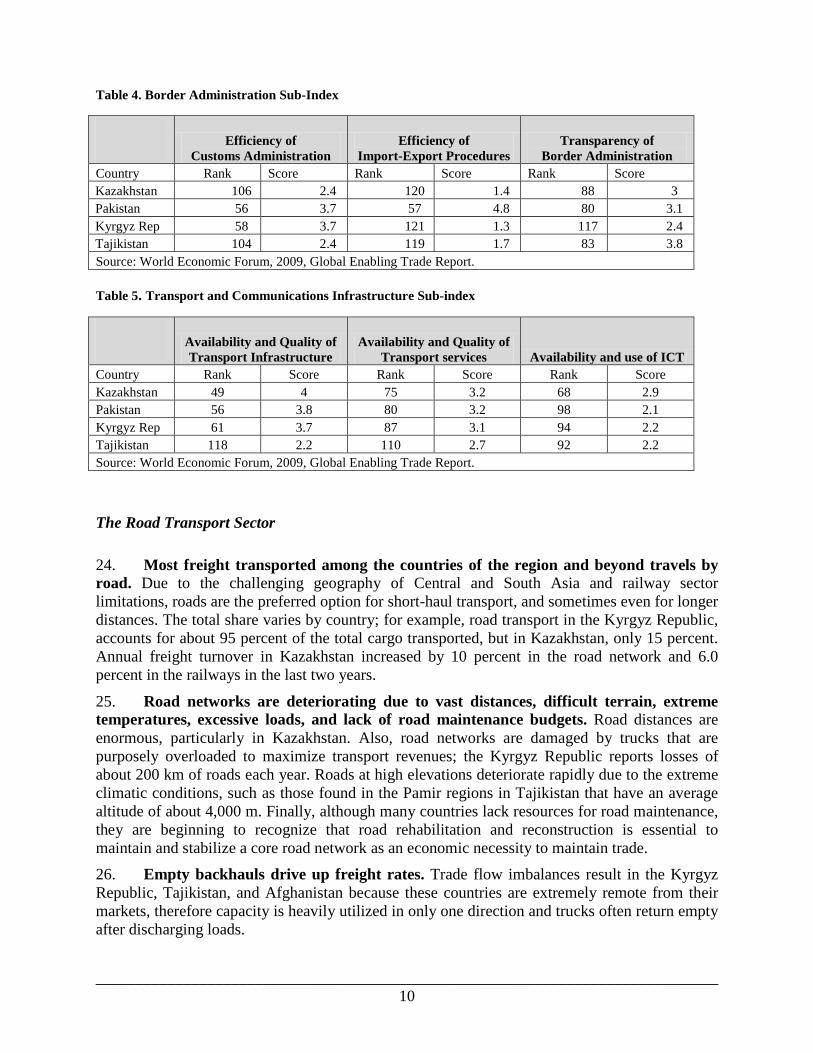
22. In Tajikistan, firms identified customs regulations as a problem for doing business. Specifically, this was an issue for 40 percent of the interviewed firms in 2002 and for 25 percent in 2005. Some 15 percent of the surveyed firms indicated that bribery was less of an issue in 2005, compared to 25 percent in 2002. Similar to other countries in Central Asia, in 2005, about 12 percent of firms named transportation as an obstacle to doing business. Table 3. Enabling Trade Index 2009
Country
Overall Index
Market Access
Border Administration
Transport and Communication infrastructure
Business Environment
Rank Score Rank Score Rank Score Rank Score Rank Score Kazakhstan 93 3.49 45 4.2 119 2.27 63 3.39 77 4.1 Pakistan 100 3.43 111 3.26 63 3.85 80 3.04 102 3.58 Kyrgyz Rep 101 3.43 18 4.77 116 2.46 86 2.98 108 3.53 Tajikistan 114 3.14 104 3.57 118 2.4 116 2.37 70 4.22 Source: World Economic Forum, 2009, Global Enabling Trade Report. 23. Efficiency of import-export procedures is poor in all countries. The Kyrgyz Republic is the worst performer in border administration transparency, but customs administration efficiency performance is better. 24 The European Bank for Reconstruction and Development together with the World Bank launched the Business Environment and Enterprise Performance Survey (BEEPS). The objective of the survey is to provide feedback from enterprises on the state of the private sector. Through interviews with firms in the manufacturing and services sectors the survey assesses the constraints to private sector growth. As a result, statistically significant business environment indicators are created that are comparable across countries.
18%
35%
39%
39%
40%
82%
47%
53%
33%
50%
0%
18%
8%
28%
10%
Afghanistan
Kazakhstan
Kyrgyzstan
Tajikistan
Uzbekistan
Got Worse About the same Improved
______________________________________________________________________________ 10
Table 4. Border Administration Sub-Index
Efficiency of
Customs Administration Efficiency of
Import-Export Procedures Transparency of
Border Administration Country Rank Score Rank Score Rank Score Kazakhstan 106 2.4 120 1.4 88 3 Pakistan 56 3.7 57 4.8 80 3.1 Kyrgyz Rep 58 3.7 121 1.3 117 2.4 Tajikistan 104 2.4 119 1.7 83 3.8 Source: World Economic Forum, 2009, Global Enabling Trade Report. Table 5. Transport and Communications Infrastructure Sub-index
Availability and Quality of Transport Infrastructure
Availability and Quality of Transport services Availability and use of ICT
Country Rank Score Rank Score Rank Score Kazakhstan 49 4 75 3.2 68 2.9 Pakistan 56 3.8 80 3.2 98 2.1 Kyrgyz Rep 61 3.7 87 3.1 94 2.2 Tajikistan 118 2.2 110 2.7 92 2.2 Source: World Economic Forum, 2009, Global Enabling Trade Report.
The Road Transport Sector
24. Most freight transported among the countries of the region and beyond travels by road. Due to the challenging geography of Central and South Asia and railway sector limitations, roads are the preferred option for short-haul transport, and sometimes even for longer distances. The total share varies by country; for example, road transport in the Kyrgyz Republic, accounts for about 95 percent of the total cargo transported, but in Kazakhstan, only 15 percent. Annual freight turnover in Kazakhstan increased by 10 percent in the road network and 6.0 percent in the railways in the last two years.
25. Road networks are deteriorating due to vast distances, difficult terrain, extreme temperatures, excessive loads, and lack of road maintenance budgets. Road distances are enormous, particularly in Kazakhstan. Also, road networks are damaged by trucks that are purposely overloaded to maximize transport revenues; the Kyrgyz Republic reports losses of about 200 km of roads each year. Roads at high elevations deteriorate rapidly due to the extreme climatic conditions, such as those found in the Pamir regions in Tajikistan that have an average altitude of about 4,000 m. Finally, although many countries lack resources for road maintenance, they are beginning to recognize that road rehabilitation and reconstruction is essential to maintain and stabilize a core road network as an economic necessity to maintain trade.
26. Empty backhauls drive up freight rates. Trade flow imbalances result in the Kyrgyz Republic, Tajikistan, and Afghanistan because these countries are extremely remote from their markets, therefore capacity is heavily utilized in only one direction and trucks often return empty after discharging loads.

______________________________________________________________________________ 11
Trade Facilitation and Logistics
27. Country rankings in trade logistics are broadly correlated with corridor performance. This study reviewed trade facilitation rankings in the following: (i) Doing Business database; (ii) Logistics Performance Index (LPI); (iii) World Trade Indicators Business; and (iv) the Business Environment and Enterprise Performance Surveys (BEEPS); and the World Economic Forum’s new Enabling Trade Index. International data collection and benchmarking in trade facilitation for Central and South Asian countries are presented below as broader context for the corridor measurements in this study.
28. Central and South Asian countries perform poorly in overall ‘ease-of-doing-business’ indicators, according to “Doing Business: Trading Across Borders.”25 During 2008-09, the ranking of every Central Asian economy has dropped, except for the Kyrgyz Republic. 26
Afghanistan is at the bottom of the list at 183; Pakistan was ranked 78 in 2009 (Table 6).
Table 6. Trading Across Borders: Central and South Asia (2010)
Country Documents (#) Time (days) Cost (US$ per container)
Exports Imports Exports Imports Exports Imports
Afghanistan 12 11 74 77 3,350 3,000
Pakistan 9 8 22 18 611 680
Tajikistan 10 10 82 83 3,150 4,550
Kyrgyzstan 7 7 63 72 3,000 3,250
Kazakhstan 11 13 89 76 3,005 3,055
Source: World Bank Doing Business Indicators.
29. During 2007-09, Central Asian countries improved their Logistics Performance Index rankings and scores.27
25 The World Bank developed the Doing Business database, which measures business regulations and their enforcement in 183 countries. Economies are ranked on their ease of doing business, from a high of 1 to a low of 183. A high ranking indicates a regulatory environment conducive to business. This index averages country percentile rankings in 10 areas, using a variety of indicators, equally weighted by area. “Trading Across Borders” is the most relevant to the current discussion on trade and transport facilitation, calculated as average rank across the six indicators: (i) number of documents (imports and exports); (ii) time (export and import); and cost (export and import).
Kazakhstan performed best and made the most improvements, rising to 62 from 133 due to overall logistics improvements, especially international shipments, demonstrating good connectivity to domestic and international markets. The Kyrgyz Republic also improved logistical performance, moving up from 103 to 91, and achieving the biggest
26 The Kyrgyz Republic rose to 154, from 181 because fewer documents are required for imports and exports. Other economies had no significant changes that would affect their ranking. 27 The Logistics Performance Index (LPI) is a World Bank benchmarking tool that measures performance along a national logistics supply chain. This index uses broader and more comprehensive approaches than the Doing Business indicators, which focus on bureaucratic obstacles to moving goods across borders and the ease of export and import for SMEs. Specifically, the LPI helped identify challenges and opportunities along the supply chain of 150 countries in 2007 and 155 in 2009, based on a worldwide survey of global freight forwarders and express carriers. Using a 5-point scale, the LPI looks at seven performance areas: (i) customs; (ii) infrastructure; (iii) international shipments; (iv) logistics competence; (v) tracking and tracing; (vi) domestic logistics costs; and (vii) timeliness. Large differences among countries can occur because overall country performance is reduced by even one or two weak links in the supply chain.

______________________________________________________________________________ 12
performance improvement in international shipments, but declining from 95 to 132 on the indicator for tracking and tracing.
30. Pakistan’s performance ranking dropped to 110 from an earlier 68. In 2009, Pakistan lagged in all sub-categories; the biggest drop was in customs performance, from 69 to 134. Rankings for international logistics for all other countries rose during 2007-09, improving competence in customs, international shipments, and logistics.
Table 7. Logistics Performance Index and Sub-Components, Scoring (2007, 2009)
Country LPI Customs Infrastructure International shipments
Logistics competence
Tracking& tracing
Timeliness
Pakistan (2007) 2.62 2.41 2.37 2.72 2.71 2.57 2.93 Pakistan (2009) 2.53 2.05 2.08 2.91 2.28 2.64 3.08 Kyrgyz Republic (2007) 2.35 2.20 2.06 2.35 2.35 2.38 2.76 Kyrgyz Republic (2009) 2.62 2.44 2.09 3.18 2.37 2.33 3.10 Kazakhstan (2007) 2.12 1.91 1.86 2.10 2.05 2.19 2.65 Kazakhstan (2009) 2.83 2.38 2.66 3.29 2.60 2.70 3.25 Tajikistan (2007) 1.93 1.91 2.00 2.00 1.90 1.67 2.11 Tajikistan (2009) 2.35 1.90 2.00 2.42 2.25 2.25 3.16 Afghanistan (2007) 1.21 1.30 1.10 1.22 1.25 1.00 1.38 Afghanistan (2009) 2.24 2.22 1.87 2.24 2.09 2.37 2.61 Source: World Bank, Connecting to Compete 2009: Trade Logistics in the Global Economy.
Table 8. Logistics Performance Index and Sub Components, Ranking (2007, 2009)
Country LPI Customs Infrastructure International shipments
Logistics competence
Tracking & tracing
Timeliness
Pakistan (2007) 68 69 71 65 63 76 88 Pakistan (2009) 110 134 120 66 120 93 110 Kyrgyz Republic (2007) 103 102 112 106 100 95 109 Kyrgyz Republic (2009) 91 71 118 39 107 132 106 Kazakhstan (2007) 133 139 137 129 126 116 120 Kazakhstan (2009) 62 79 57 29 73 85 86 Tajikistan (2007) 146 140 125 136 141 146 146 Tajikistan (2009) 131 147 128 127 125 141 98 Afghanistan (2007) 150 150 150 150 150 150 150 Afghanistan (2009) 143 104 139 141 141 128 146 Source: World Bank, Connecting to Compete 2009: Trade Logistics in the Global Economy.
31. During 2007-09, LPI indicators deteriorated in the performance of customs and control procedures; corruption increased in most monitored countries. During 2007-09, survey results indicate that custom control procedures in Afghanistan deteriorated by 52 percent and in Uzbekistan by 45 percent; in Kazakhstan they improved by 56 percent (Table 7. Logistics Performance Index and Sub-Components, Scoring (2007, 2009)). For other control procedures, half of the surveys indicated that Uzbekistan’s performance worsened. The efficiency of control procedures declined in Kazakhstan by 33 percent; the Kyrgyz Republic by 32 percent, and

______________________________________________________________________________ 13
Afghanistan by 22 percent, according to survey results. During 2007-09, perceived corruption in logistics increased by 35 to 40 percent in the monitored countries.
32. Some 60 to 70 percent of surveys indicated improvements in logistics infrastructure and telecommunications/IT infrastructure. Similar improvements are observed in quality and availability of logistics services and logistics legislation. Of all countries and across all LPI sub-indicators, the biggest improvements occurred in Kazakhstan, followed by Tajikistan. This follows the Kazakh government declaration that trade and transport facilitation was a priority, and similarly in Tajikistan, policymakers declared that removing barriers along the trade and transport network was a priority.
33. While this survey primarily examines non-physical barriers to transport of goods along the road corridors in Central and South Asia, in cases where poorly developed infrastructure contributed to delays, some observations in relation to physical condition of infrastructure are also present. The next sections present the methodology and findings of the survey.
III. SURVEY METHODOLOGY
34. This report examines time and costs (where applicable) of moving freight by road through Central and South Asia, focusing on border processing along specific transport corridors.28 The methodology employs the following instruments: (i) border crossing performance measurements; (ii) transporter interviews; and (iii) trip diaries. The methodology was tested, recalibrated, and validated with support from local public and private sector counterparts in Central Asia.29
Selection of Road Transport Corridors and Border Crossing Points
. Survey teams measured travel times along transport corridors and processing times at border crossings over five consecutive 24-hour weekday periods during 2008 and 2009.
35. Most of the region’s road and rail corridors used for trade and transport were built during the borderless Soviet-era. Road transport corridors were selected for this study based on country requests and taking into account previous years’ performance measurement results (Table 9) and three major initiatives in the region for developing trade and transport corridors supported by the Eurasian Economic Community (EurAsEC) led by Russia and Kazakhstan, the Central Asia Regional Cooperation (CAREC) Corridor development program, and the EU through the Pan-European Axes and the TRACECA program.
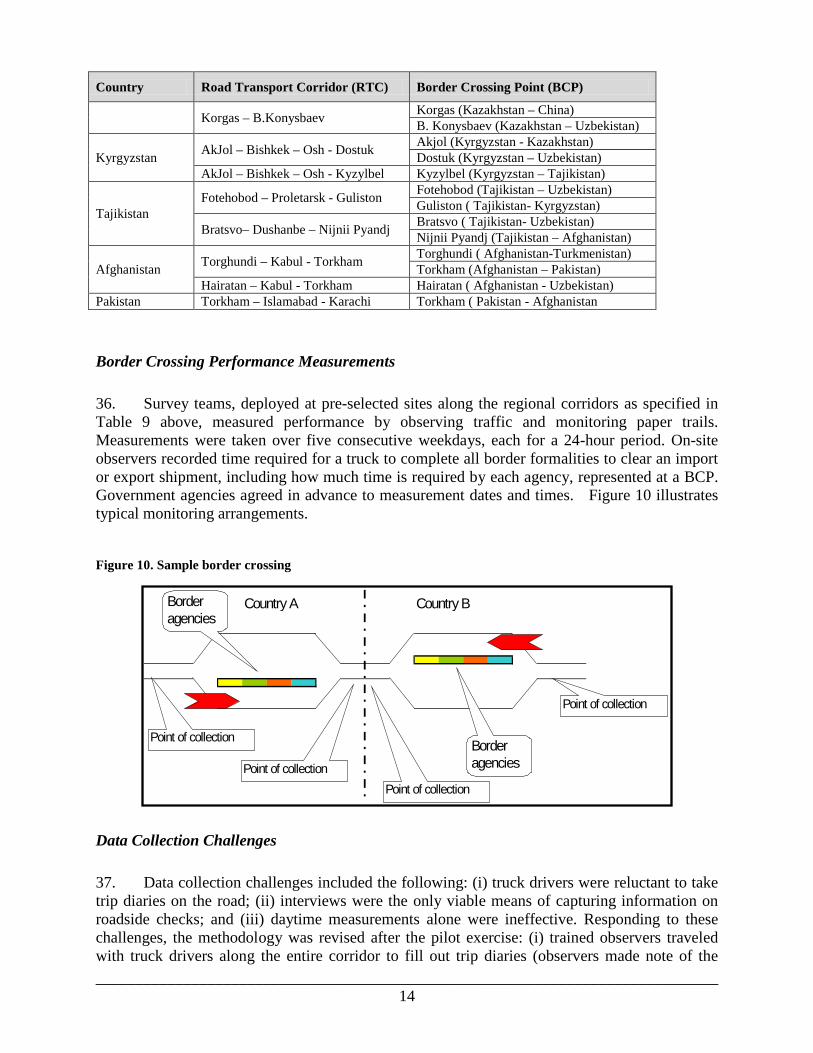
Table 9. Road transport corridors and border crossings selected for performance measurement
Country Road Transport Corridor (RTC) Border Crossing Point (BCP)
Kazakhstan
Korgas – Almaty - Kordai Korgas (Kazakhstan – China) Kordai (Kazakhstan – Kyrgyz Republic)
Syrym–Kyzyl Orda –B. Konysbaev Syrym (Kazakhstan – Russia) B. Konysbaev (Kazakhstan – Uzbekistan)
Kordai - Kairak Kordai (Kazakhstan – Kyrgyz Republic) Kairak (Kazakhstan – Russia)
28 Other measurements include physical capacity of infrastructure, the corridor links and nodes in and the utilization of these. 29 Methodology for on-site physical measurements by independent surveyors, truck driver interviews, and trip diaries was developed and used under the trade and transport facilitation program in Southeastern Europe (TTFSE); it was adapted to Central Asian countries.
______________________________________________________________________________ 14
Country Road Transport Corridor (RTC) Border Crossing Point (BCP)
Korgas – B.Konysbaev Korgas (Kazakhstan – China) B. Konysbaev (Kazakhstan – Uzbekistan)
Kyrgyzstan AkJol – Bishkek – Osh - Dostuk Akjol (Kyrgyzstan - Kazakhstan) Dostuk (Kyrgyzstan – Uzbekistan)
AkJol – Bishkek – Osh - Kyzylbel Kyzylbel (Kyrgyzstan – Tajikistan)
Tajikistan Fotehobod – Proletarsk - Guliston Fotehobod (Tajikistan – Uzbekistan)
Guliston ( Tajikistan- Kyrgyzstan)
Bratsvo– Dushanbe – Nijnii Pyandj Bratsvo ( Tajikistan- Uzbekistan) Nijnii Pyandj (Tajikistan – Afghanistan)
Afghanistan Torghundi – Kabul - Torkham Torghundi ( Afghanistan-Turkmenistan) Torkham (Afghanistan – Pakistan)
Hairatan – Kabul - Torkham Hairatan ( Afghanistan - Uzbekistan) Pakistan Torkham – Islamabad - Karachi Torkham ( Pakistan - Afghanistan
Border Crossing Performance Measurements
36. Survey teams, deployed at pre-selected sites along the regional corridors as specified in Table 9 above, measured performance by observing traffic and monitoring paper trails. Measurements were taken over five consecutive weekdays, each for a 24-hour period. On-site observers recorded time required for a truck to complete all border formalities to clear an import or export shipment, including how much time is required by each agency, represented at a BCP. Government agencies agreed in advance to measurement dates and times. Figure 10 illustrates typical monitoring arrangements.
Figure 10. Sample border crossing
Data Collection Challenges
37. Data collection challenges included the following: (i) truck drivers were reluctant to take trip diaries on the road; (ii) interviews were the only viable means of capturing information on roadside checks; and (iii) daytime measurements alone were ineffective. Responding to these challenges, the methodology was revised after the pilot exercise: (i) trained observers traveled with truck drivers along the entire corridor to fill out trip diaries (observers made note of the
Country A Country B
Point of collection
Point of collection
Point of collection
Border agencies
Border agencies
Point of collection

______________________________________________________________________________ 15
number, duration, and quality of enroute checks and stops); and (ii) measurements were conducted 24 hours per day. Interviews and trip diaries complement data collected through direct observation to identify patterns and remedial measures. Interviews with truck drivers, customs brokers, and traders supplied details on circumstances of delays, including bureaucratic abuses. Detailed trip diary forms are presented in Annex A.
IV. SUMMARY OF MAIN FINDINGS
A. Border Crossing Performance
38. Border crossing point performance is calculated using average times for overall processing of documents. During August 2008 and July 2009, teams of surveyors carried out measurements at pre-selected border crossing points along regional corridors as specified in Table 9 above.. Measurements were taken over five consecutive weekdays, each for a 24-hour period. On-site observers recorded time required for a truck to complete all border formalities to clear an import or export shipment. Government agencies agreed in advance to measurement dates and times.
39. The following key trends were noted along selected corridors and BCPs:
• Empty backhaul imbalance. Most trucks leaving Central Asia are empty when they cross the border. Outgoing trucks leave their country of origin to bring back a load of imports; incoming trucks discharge their loads and leave empty.
• Import/export imbalance. Incoming trucks experience longer delays along the corridors and at borders because they carry cargo; outgoing trucks are typically empty.
• Transit trucks. Few trucks crossing South and Central Asia carry transit cargo. • TIR carnet use is not widespread in South and Central Asia; they are viewed as
expensive, unnecessary, and ineffective to prevent delays along the corridors. • Samohods are specific to Kazakhstan due to the high volume of motorized machinery
trade with China. However, since the global economic slowdown, Samohod imports have declined and thus alleviated traffic at the Kazakh/ Chinese border.
Country Specific Findings
40. The detailed account on each of the surveyed BCP by country is presented in Annex B. This section presents main findings; some of which are exclusive to a particular country, while many others are quite common across the region. A summary of the data is presented in Table 10.

______________________________________________________________________________ 16
Table 10. Summary of Surveyed BCP by country (Processing Time in hours)
Border Service
Customs Authority
Transport Authority
Veterinary Control
Other Time
Total Time (Control
Formalities) Total
Downtime
Kordai BCP Import 0.28 0.95 0.07 0.02 0.18 1.50 3.60
Kordai BCP Export 0.28 0.80 0.07 0.02 0.22 1.38 2.85
Syrym BCP Import 0.03 2.32 0.08 0.02 0.08 2.53 5.10
B. Konysbaev BCP Import 0.03 2.20 0.07 0.03 0.25 2.58 7.87
B. Konysbaev BCP Export 0.03 3.28 0.07 0.03 0.22 3.63 8.57
B. Konysbaev BCP Transit 0.03 1.90 0.05 0.05 0.23 2.27 9.03
Korgas BCP Import 0.13 5.23 0.10 0.02 0.08 5.57 13.43
Korgas BCP Export 0.18 3.68 0.07 0.03 0.10 4.07 4.83
Ak-Jol BCP Imports\Export 0.03 0.17 0.03 0.05 0.05 0.33 2.07
Dostuk BCP Import 0.13 1.72 0.07 0.33 0.03 2.28 3.82
Dostuk BCP Export 0.03 0.15 0.02 0.02 0.00 0.22 0.28
Kyzl-Bel Import\Import 0.02 0.02 0.00 0.02 0.02 0.07 0.08
Kyzl-Bel Import\Export 0.03 0.02 0.00 0.02 0.00 0.07 0.10
Guliston BCP Import 0.25 0.33 0.25 0.13 0.08 1.05 0.01
Guliston BCP Export 0.08 0.08 0.08 0.08 0.00 0.33 0.42
Bratstvo BCP Import 0.13 0.27 0.13 0.08 0.10 0.72 2.90
Bratstvo BCP Export 0.13 0.27 0.13 0.08 0.10 0.72 1.25
Fotehobod BCP Imports 0.12 0.18 0.12 0.10 0.20 0.72 1.22
Fotehobod BCP Exports 0.12 0.18 0.12 0.10 0.05 0.57 0.95
Nijnii Pyandj Imports 0.08 0.08 0.10 0.12 0.40 0.78 2.85
Nijnii Pyandj Exports 0.08 0.08 0.10 0.12 0.12 0.50 0.68
Average 0.11 1.14 0.08 0.07 0.12 1.52 3.42
Kazakhstan
41. The following four border crossing points were measured in Kazakhstan: Kordai (Kazakhstan/Kyrgyzstan), Syrym (Kazakhstan/Russia), B. Konysbaev (Kazakhstan/Uzbekistan), and Korgas (Kazakhstan/China). Overall, border crossing points shared with Russia and the Kyrgyz Republic (Syrym; Kordai) perform better than BCPs with China and Uzbekistan (Korgas; B. Konysbaev).
42. The key causes of delays in Kazakstan were as follows: a) complex customs processes; b) duplication of responsibilities between border agencies; c) although the safe packaging system brings substantial time savings along the corridor, they cause some time delays at BCPs because of sealing and unsealing (for drivers however, the time savings along the corridors outweigh the delays at BCPs); d) different processing capacities of releasing and receiving BCPs due to inadequate infrastructure (e.g. Konysbaev, Syrym).
43. On a positive side, the following improvements were noted: a) custom operations became more efficient at all BCPs - although the procedures still take long time, there is no waiting time; b) customs processing was reduced by half in Korgas due to the introduction of a new electronic entry/exit control systems for transit and outbound trucks.

______________________________________________________________________________ 17
Kyrgyz Republic
44. The following three border crossing points were surveyed in the Kyrgyz Republic: Ak-Jol (Kyrgyzstan/Kazakhstan), Dostuk (Kyrgyzstan/Uzbekistan), and Kyzyl-Bel (Kyrgyzstan/Tajikistan). Overall, performance of these BCPs varies significantly, with Ak-Jol being the busiest BCP and having the longest delays.
45. The key causes of delays in the Kyrgyz Republic were as follows: a) the pilot introduction of the one-stop approach at Ak-Jol did not necessarily reduce delays; b) the necessity to clear customs at a separate facility in a nearby city; c) truck drivers wait for cargo owners before going to procedures, which increases the downtime; d) inadequate infrastructure - in Akjol, the largest BCP, there are only two lanes in each direction; e) duplication of functions of different agencies. The Government is however open to criticism and continues on the reform path by implementing the one-stop approach and stimulate the use of TIR system.
Tajikistan
46. The following four border crossing points were measured in Tajikistan: Guliston (Tajikistan/ Kyrgyzstan), Bratstvo (Tajikistan/ Uzbekistan), Fotehobod (Tajikistan/ Uzbekistan) and Nijnii Pyandj (Tajikistan/ Afghanistan).
47. The key causes of delays in Tajikistan were as follows: a) TIR system is not appealing to truck drivers, because currently TIR associated costs outweigh the benefits, e.g. seals get broken at the Tajik / Uzbek border, and time required for processing at BCPs is the same for all vehicles regardless of the availability of TIR carnets; b) the necessity to wait for traffic police to escort the trucks to Dushanbe to clear customs; c) facilities in Nijnii Pyandj are not adequate to deal with the traffic volumes;
48. On a positive side, the bridge built in Nijnii Pyandj in 2007 to replace the ferry service had improved the border crossing. The internal seals for inbound trucks guarantee that they will not be stopped by the Transport Police and Transport Inspection while travelling along corridors.
Afghanistan
49. Due to high risk security situation during the survey, only two border crossing points were measured in Afghanistan: Sherkhan Bandar (Afghanistan/Tajikistan) and Hairatan (Afghanistan/Uzbekistan).
50. The key causes of delays in Afghanistan were as follows: a) the need to offload and warehouse freight for inspection before reloading; b) reloading between trains, boats, and trucks c) transshipping from Tajik trucks to Afghani or Pakistani trucks; d) frequent requests for unofficial payments.
51. On a positive note, the EU funded Inland Clearance Depot, which opened in 2009 just two kilometers beyond the border, is expected to decrease overall downtime and ease the border crossing.
Pakistan
52. Due to unstable security situation during the survey, only one Pakistan border crossing point, Torkham (Pakistan/Afghanistan) was measured.
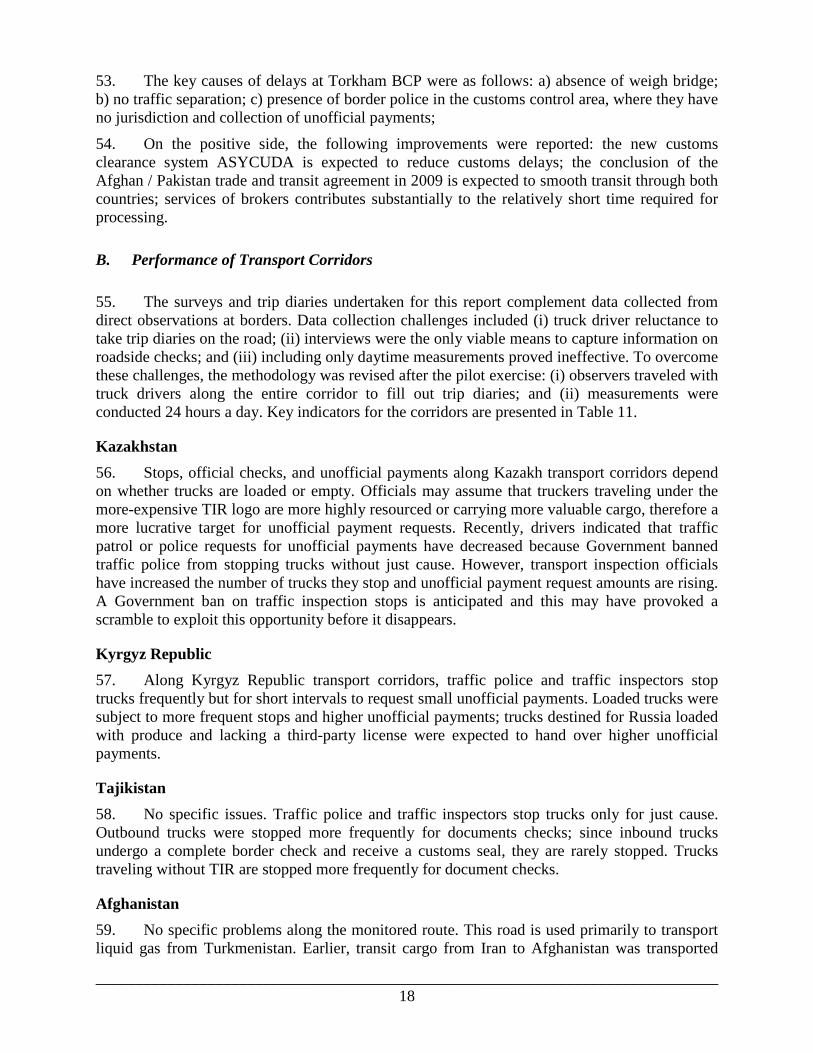
______________________________________________________________________________ 18
53. The key causes of delays at Torkham BCP were as follows: a) absence of weigh bridge; b) no traffic separation; c) presence of border police in the customs control area, where they have no jurisdiction and collection of unofficial payments;
54. On the positive side, the following improvements were reported: the new customs clearance system ASYCUDA is expected to reduce customs delays; the conclusion of the Afghan / Pakistan trade and transit agreement in 2009 is expected to smooth transit through both countries; services of brokers contributes substantially to the relatively short time required for processing.
B. Performance of Transport Corridors
55. The surveys and trip diaries undertaken for this report complement data collected from direct observations at borders. Data collection challenges included (i) truck driver reluctance to take trip diaries on the road; (ii) interviews were the only viable means to capture information on roadside checks; and (iii) including only daytime measurements proved ineffective. To overcome these challenges, the methodology was revised after the pilot exercise: (i) observers traveled with truck drivers along the entire corridor to fill out trip diaries; and (ii) measurements were conducted 24 hours a day. Key indicators for the corridors are presented in Table 11.
Kazakhstan 56. Stops, official checks, and unofficial payments along Kazakh transport corridors depend on whether trucks are loaded or empty. Officials may assume that truckers traveling under the more-expensive TIR logo are more highly resourced or carrying more valuable cargo, therefore a more lucrative target for unofficial payment requests. Recently, drivers indicated that traffic patrol or police requests for unofficial payments have decreased because Government banned traffic police from stopping trucks without just cause. However, transport inspection officials have increased the number of trucks they stop and unofficial payment request amounts are rising. A Government ban on traffic inspection stops is anticipated and this may have provoked a scramble to exploit this opportunity before it disappears.
Kyrgyz Republic 57. Along Kyrgyz Republic transport corridors, traffic police and traffic inspectors stop trucks frequently but for short intervals to request small unofficial payments. Loaded trucks were subject to more frequent stops and higher unofficial payments; trucks destined for Russia loaded with produce and lacking a third-party license were expected to hand over higher unofficial payments.
Tajikistan 58. No specific issues. Traffic police and traffic inspectors stop trucks only for just cause. Outbound trucks were stopped more frequently for documents checks; since inbound trucks undergo a complete border check and receive a customs seal, they are rarely stopped. Trucks traveling without TIR are stopped more frequently for document checks.
Afghanistan 59. No specific problems along the monitored route. This road is used primarily to transport liquid gas from Turkmenistan. Earlier, transit cargo from Iran to Afghanistan was transported
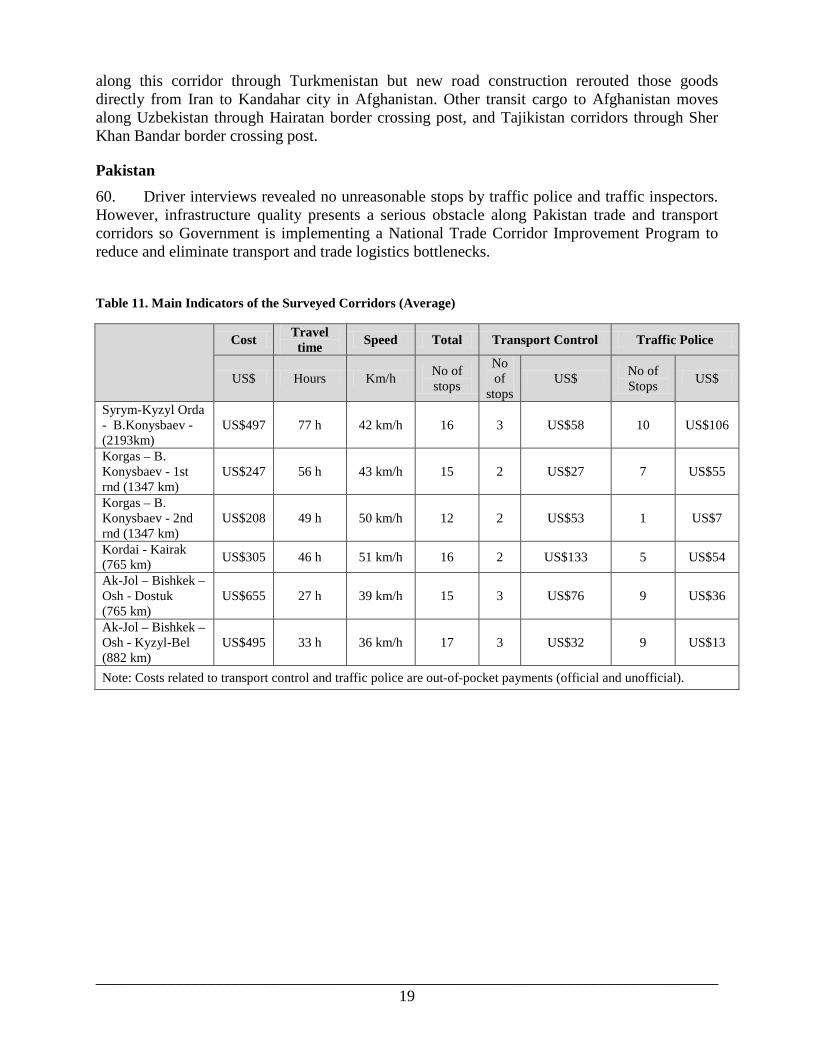
______________________________________________________________________________ 19
along this corridor through Turkmenistan but new road construction rerouted those goods directly from Iran to Kandahar city in Afghanistan. Other transit cargo to Afghanistan moves along Uzbekistan through Hairatan border crossing post, and Tajikistan corridors through Sher Khan Bandar border crossing post.
Pakistan 60. Driver interviews revealed no unreasonable stops by traffic police and traffic inspectors. However, infrastructure quality presents a serious obstacle along Pakistan trade and transport corridors so Government is implementing a National Trade Corridor Improvement Program to reduce and eliminate transport and trade logistics bottlenecks.
Table 11. Main Indicators of the Surveyed Corridors (Average)
Cost Travel time Speed Total Transport Control Traffic Police
US$ Hours Km/h No of stops
No of
stops US$ No of
Stops US$
Syrym-Kyzyl Orda - B.Konysbaev -(2193km)
US$497 77 h 42 km/h 16 3 US$58 10 US$106
Korgas – B. Konysbaev - 1st rnd (1347 km)
US$247 56 h 43 km/h 15 2 US$27 7 US$55
Korgas – B. Konysbaev - 2nd rnd (1347 km)
US$208 49 h 50 km/h 12 2 US$53 1 US$7
Kordai - Kairak (765 km) US$305 46 h 51 km/h 16 2 US$133 5 US$54
Ak-Jol – Bishkek – Osh - Dostuk (765 km)
US$655 27 h 39 km/h 15 3 US$76 9 US$36
Ak-Jol – Bishkek – Osh - Kyzyl-Bel (882 km)
US$495 33 h 36 km/h 17 3 US$32 9 US$13
Note: Costs related to transport control and traffic police are out-of-pocket payments (official and unofficial).

______________________________________________________________________________ 20
ANNEX A: SURVEY METHODOLOGY AND INSTRUMENTS
1. Trip Diary The purpose of this survey is to measure the efficiency of road transport in Central Asia. The survey is conducted by the Forum of Business Associations in Central Asia, and it is commissioned by the World Bank. It is planned that the aggregate findings of the survey will be used by Governments and multilateral agencies to implement programs and projects aimed at making transport systems and border crossing in the region more efficient. You were selected randomly for this survey. Your cooperation is voluntary, and no negative consequences will result should you decide not to participate. Also, you can skip any questions you do not wish to answer. However, the success of this survey is in the interest of all stakeholders in the transport sector in the region. A high participation and response rate would make the final aggregate results more statistically significant. The survey is anonymous and the identity of respondents is kept strictly confidential, and the forms cannot be traced back to respondents. Information gathered from this form will be accessed by the Project team only. Please return this completed form at the survey box located at: [address]
INSTRUCTIONS FOR COMPLETION OF TRIP DIARY This form should accompany the vehicle throughout the journey from the time of receipt to the point of survey
drop off. Complete the Vehicle Information page (section I) immediately one time for the vehicle for each journey. Record the details after each control/check stop made by the vehicle during the journey during the survey week
in the Journey Information page (section II). Please attach as many Journey Information sheets as you need. See sample below for illustration of information recording in the Journey Information form.
S A M P L E
--------------------------------------------------------------------------------------------------------------------- 2. JOURNEY INFORMATION
Start time: _13_:_30_ Day: _23____ Month: __November_ Year: _2005Start odometer reading (km): __
___ 189,500
_____
Stop Date (day
/month)
Arrival Time
(24:00 format)
Departure Time
(24:00 format)
Odometer reading (in km)
Stop Type (choose from list below)
Amount of legal official
payments made (with
currency)
Amount of illegal
payments made (with currency)
Road description
Road condition
Weather condition
1 23/11 17:20 17:40 190,000 7 400 Tenge 500 Tenge Almaty-Astana
Poor Rain
2
3
STOP TYPES (Choose number for each stop by the type):
1 Pick up – Load 7 Police checkpoint 2 Drop off – Unload 8 Other government checkpoint 3 Service vehicle 9 Wait to form convoy/Escort 4 Meal/Other personal 10 Road construction works 5 Customs border crossing 11 Road closure because of weather 6 Customs inland terminal

______________________________________________________________________________ 21
TRIP DIARY
FOR CARGO TRANSPORTED BY TRUCKS
I. VEHICLE INFORMATION Vehicle Type: Tractor-Trailer___ Tanker___ Other:____________________ Net weight (tons): ____________________ Number of axles: _________________ Country of vehicle registration: ________________ Cargo:
Bulk___ 20ft Container___ 40ft Container___ Tanker___ Other: __________________
Value of cargo: __________________ Gross Tonnage: __________________ Is cargo sealed: Yes___ No___ Is cargo transported under TIR: Yes___ No___ Your place of business: City: _________________ Country: _______________ Origin (where cargo is loaded): _____________________________ Final destination of cargo: _________________________________ Location where truck is unloaded and freed: ___________________ Is cargo going to be trans-shipped onto another truck: Yes___ No___ Estimated length of trip (km): ______________________________ Estimated length of trip (hours): _____________________________

______________________________________________________________________________ 22
2. Journey Information Start time: ____:____ Day: ________ Month: ________ Year: ________ Start odometer reading (km): _____________
Stop Date
Arrival Time
(24:00 format)
Departure Time (24:00
format)
Odometer reading (in
km)
Stop Type (choose from list below)
Amount of legal
official payments
made (with currency)
Amount of illegal payments
made (with
currency)
Road descriptio
n Road condition Weather
condition
1
2
3
4
5
6
7
8
9
10
11
12
13
14
15
16
17
STOP TYPES (Choose number for each stop by the type):
1 Pick up – Load 7 Police checkpoint 2 Drop off – Unload 8 Other government checkpoint 3 Service vehicle 9 Wait to form convoy/Escort 4 Meal/Other personal 10 Road construction works 5 Customs border crossing 11 Road closure because of weather 6 Customs inland terminal

______________________________________________________________________________ 23
3. Driver Survey Form Date of completion of the survey form: Date: ______________ Time: ___________________ Pilot Site where the survey form is completed: ________________________________________ Point of Departure: ____________________ Date and time of departure: ______________ Point of Destination: ____________ Actual/Estimated date and time of arrival: ___________ Vehicle Type: Tractor-Trailer___ Tanker___ Other:____________________ Net weight (tons): ____________________ Number of axles: _________________ Country of vehicle registration: ________________ Cargo:
Bulk___ 20ft Container___ 40ft Container___ Tanker___ Other: ________
Value: __________________ Gross Tonnage: __________________ Is cargo sealed: Yes___ No___ Is cargo transported under TIR: Yes___ No___ Your place of business: City: _________________ Country: _______________ 1. How many times was your vehicle stopped for inspection since your point of departure until now? _____________________________________________________________________________ 2. How many times was your vehicle stopped for inspection since you crossed the border to enter this country? _____________________________________________________________________________ 3. Please identify the public administrations that have stopped you to inspect your vehicle or cargo (tick the most suitable answer):
How many times
Average time at every stop
Average official payments
Average unofficial payments
Road administration Ecological authorities Traffic Police (GAI) Financial Police Customs Army Other (please specify) 4. How long did these inspections go on (please tick the most suitable answer):
Up to 15 min □ Between 15 and 30 min □ Between 30 min and 1 hour □ Between 1 hour and 2 hours □ More than 2 hours (please specify) □
5. Did the inspecting officials introduce themselves properly when they stopped you (please circle the appropriate answer): Yes No 6. In your opinion, were these inspections repetitive and duplicating procedures already performed at the point of departure (please circle the appropriate answer): Yes No 7. In your opinion, do these inspections consume a lot of your traveling time (please circle the appropriate answer): Yes No
______________________________________________________________________________ 24
ANNEX B: PERFORMANCE INDICATORS
Performance of BCPs in Kazakhstan
1. Four border crossing points were measured in Kazakhstan, including Kordai (Kazakhstan/Kyrgyzstan), Syrym (Kazakhstan/Russia), B. Konysbaev (Kazakhstan/Uzbekistan), and Korgas (Kazakhstan/China). During the rounds of measurements, 1,320 trucks in 2008 and 1,093 trucks in 2009 crossed the three border points. Fewer samohod crossings were observed in 2009 (231) than 2008 (37) mainly due to a slowdown of machinery equipment imports from China. In 2008, most outbound trucks from Kazakhstan were empty; in 2008, empty backhaul trucks leaving Kazakhstan increased, in particular at Konysbaev B. and Korgas, carrying consumer goods from China. Similarly, in 2009, transit traffic at Konysbaev border point increased by 1.9 times, and Syrym by 2.6 times compared to 2008.
2. In 2008, 562 vehicles entered Kazakhstan (37 percent), 317 transited (20 percent), and 441 left (28 percent). Only 10 of the outbound trucks that crossed the Korgas BCP were loaded (cattle hides); and 17 that crossed the Konysbaev B. BCP (copper, aluminum, and cathodes). Only 205 of all vehicles crossing the four border points were traveling under TIR (13 percent). Truck-scanning equipment is available only at Korgas, where 441 trucks were scanned (61 percent); and B. Konysbaev where 343 trucks were scanned (48 percent); 2008 measurements revealed slight decreases in traffic.
3. Customs processing time remains a significant portion of overall processing time. However, customs performance has improved at all monitored BCPs after new technologies were introduced.30
4. Processing by border agencies exhibits inefficiencies and duplications. Border services such as controls for transport, veterinary, sanitary control, and plant quarantine lack laboratory and essential equipment to perform testing; instead, agency representatives provide a stamp-for–fee service for documents. In January 2010, improvements are expected when transport control duties are transferred to the customs agency in Kazakhstan, but inefficiencies remain. According to reports, customs and border agencies duplicate each others’ tasks at BCPs, especially truck inspection.
Procedures are complex and include scanning, customs clearance, physical inspection, safe-packages processing, truck sealing, and scanned document transfers to the Customs Committee. Border service requires the second longest processing time, averaging 7-11 minutes; transport inspectorate averages 4-5 minutes; and veterinary control, 1-2 minutes.
5. The ‘safe-package system’ for Kazakhstan transit traffic increases delays at BCPs. Under this system, all trucks entering Kazakhstan receive a special seal containing cargo information that can be monitored via satellite; documents are also sealed and transport police along the corridor are forbidden to to open the truck or documents without just cause. As the truck exits Kazakhstan, the seal is opened and the truck and documents are inspected. Sealing and unsealing increases border processing time.
6. Significant efficiency differences exist among BCPs in Kazakhstan. Border crossing points shared with Russia and the Kyrgyz Republic (Syrym; Kordai) perform better than BCPs with China and Uzbekistan (Korgas; B. Konysbaev). Performance includes times
30 Improved customs performance is defined as less time for overall customs processing.

______________________________________________________________________________ 25
for processing by customs authorities, border services, veterinary control, transport inspectorate, sanitary control, and plant quarantine.
Kordai BCP (Kazakhstan/Kyrgyzstan)
7. Kordai traffic with Kazakhstan has declined, especially trucks entering and transiting Kyrgyzstan. According to reports, truckers now reroute to Karasu, a BCP 15 km from Kordai. Therefore traffic along the Almaty to Bishkek corridor has not declined, but the share of incoming and outgoing cargo traffic through Kordai declined during 2008-09 (353 trucks down to 238 trucks).31
8. While traffic decreased in Kordai, total downtime increased during 2008-09. In 2009, control formalities took less time than in 2008, but total downtime increased. Over half the time is for control formalities, in particular for customs, which may be due in part to the “safe-package” system.
Figure 11. Average processing time at Kordai BCP for imports, total downtime and customs, 2007 – 2009, in hours
Figure 12. Average processing time at Kordai BCP for imports, 2008 and 20009, in hours
Figure 13. Average processing time at Kordai BCP for exports, 2008 and 2009, in hours
Figure 14. Average processing time at Kordai BCP for transit, 2008 and 2009, in hours
31 During 2008, 353 trucks crossed the border at Kordai, 53 carried import cargo, 106 export cargo, and 185 were in transit; most export trucks leave empty. During 2009, 238 trucks passed through Kordai, far fewer than the previous year; 34 entered Kyrgyzstan, 89 exited, and 115 transited. In 2008, only 53 trucks passed through, down from 179 in 2007.
2:56 2:29
3:36
0:05
1:30 0:57
2007 2008 2009
Total Downtime Customs Formalities
2:29
3:36
1:29 1:30
0:18 0:17
1:01 0:57
0:06 0:04 0:01 0:01
Import'08 Import'09
Total Downtime Total Time (Control Formalities) Border Service Customs Authority Transport Authority Veterinary Control
2:27
3:19
1:37 0:56
0:16 0:16 1:01
0:33 0:06 0:04 0:11 0:01
Export'08 Export'09
Total Downtime Total Time (Control Formalities) Border Service Customs Authority Transport Authority Veterinary Control
2:31 2:51
1:30 1:23
0:12 0:17
1:07 0:48
0:06 0:04 0:01 0:01
Transit'08 Transit'09
Total Downtime Total time (Constrol Formalities) Border Service Customs Authority Transport Authority Veterinary Control

______________________________________________________________________________ 26
Syrym BCP (Kazakhstan/Russia)
9. During 2008-09, total down time and customs processing time increased at Syrym, in northeast Kazakhstan bordering Russia. Traffic levels are small, averaging 50 trucks per day, but Syrym is comparably less efficient, some say due to poor infrastructure. In addition, most outbound trucks are empty while most inbound trucks carry construction materials and consumer goods. Delays occur at the Syrym waiting area; only one terminal is used for all vehicle types—trucks, cars, and passenger coaches, whereas the Russian side has six streams to process trucks. However, Syrym’s advantage is that every truck receives all control agencies’ stamps when they exit the terminal. Processing time at Syrym is expected to decrease when the Customs Union between Russia, Belarus, and Kazakhstan becomes effective in 2010.
Figure 15. Average processing time at Syrym BCP for imports, total downtime and customs, 2008 – 2009, in hours
Figure 16. Average processing time at Syrym BCP for imports, 2008 – 2009, in hours
Figure 17. Average processing time at Syrym BCP for transit, 2008 – 2009, in hours
B. Konysbaev (Kazakhstan/Uzbekistan)
10. During 2008-09, at B. Konysbaev, overall downtime tripled despite small traffic volumes. (Average: 50 trucks) According to reports, downtime increases are due primarily to delays on the Uzbekistan side since no-man’s land between country checkpoints was reduced to one meter on the Uzbek side. Now only five trucks at a time can wait there before crossing into Uzbekistan. In 2008, the neutral waiting section was 100 meters long. B. Konysbaev faces other serious infrastructure constraints. Because the
4:38
3:26 4:06
0:34
2:27 2:25
2008 Jan 2008 Aug 2009
Total Downtime Customs Formalities
6:45
5:06
1:38 2:32
0:48 0:02
4:24
2:19
0:05 0:05 0:03 0:01
Import'08 Import'09
Total Downtime Total Time (Control Formalities) Border Service Customs Authority Transport Authority Veterinary Control
2:08
4:52
0:51
2:46
0:13 0:01 1:28
2:32
0:06 0:06 0:03 0:01
Transit'08 Transit'09 Total Downtime Total Time (Control Formalities) Border Service

______________________________________________________________________________ 27
very narrow road leading to B. Konysbaev is surrounded by a residential area, some trucks cannot make the tight turn required to enter the border post, delaying traffic for hours.
Figure 18. Average processing time at B. Konysbaev
BCP for imports, 2008 – 2009, in hours
Figure 19. Average processing time at B. Konysbaev BCP for exports, 2008 – 2009, in hours
Figure 20. Average processing time at B. Konysbaev
BCP for transit, 2008 – 2009, in hours
Korgas BCP (Kazakhstan/China)
11. During 2006-09, Korgas overall processing time decreased significantly for trucks entering Kazakhstan from China. In 2006, trucks entering Kazakhstan took 21 hours and 36 minutes to clear at the border; in 2009, it took 18 hours and 40 minutes, which is still too long, because Korgas appears to have the highest traffic volume in Kazakhstan. Improvements are underway but crossing time at Korgas compares unfavorably with other Kazakh BCPs.32
In 2009, total processing time was reduced by half when Korgas installed a new electronic exit/entry control system for transit and outbound trucks. However, total processing time is still high for trucks entering Kazakhstan.
32 During the first round of measurements, 474 trucks crossed the Korgas border point, much fewer than usual because the surveyed period coincided with the opening of the Olympic Games in Beijing so the Chinese side of the border crossing was closed. Of the 474 trucks, 254 entered Kazakhstan, 172 left Kazakhstan, and 48 trucks transited. During the second round of monitoring, 395 trucks crossed the border, which is fewer than usual due to a national holiday when the border post was closed. Political unrest in two nearby towns discouraged truck drivers from passing through the region. During June 2009, 189 trucks entered Kazakhstan, 187 left, and 19 transited.
3:05
7:52
1:46 2:35
0:11 0:02 1:13
2:12
0:07 0:04 0:02 0:02
Import'08 Import'09
Total Downtime Total Time (Control Formalities)
Border Service Customs Authority
Transport Authority Veterinary Control
2:57
8:34
0:38
3:38
0:01 0:02 0:32
3:17
0:03 0:04 0:02 0:02
Export'08 Export'09
Total Downtime Total Time (Control Formalities) Border Service Customs Authority Transport Authority Veterinary Control
2:55
9:02
1:18 2:16
0:02 0:02 0:57
1:54 0:06 0:03 0:03 0:03
Transit'08 Transit'09
Total Downtime Total Time (Control Formalities)
Border Service Customs Authority
Transport Authority Veterinary Control

______________________________________________________________________________ 28
Figure 21. Average processing time at Korgas BCP for imports, total downtime and customs, 2006 – 2009, in hours
Figure 22. Average processing time at Korgas BCP for imports, 2008 – 2009, in hours
Figure 23. Average processing time at Korgas BCP for exports, 2008 – 2009, in hours
Figure 24. Average processing time at Korgas BCP for exports, 2008 – 2009, in hours
Performance of BCPs in Kyrgyzstan
12. During 2008-09, 308 trucks crossed these three BCPs; 77 percent carried import cargo (236 trucks); 1.0 percent transit cargo (three trucks); and 22 percent export cargo (69 trucks). Most trucks passing through Kyzyl-Bel were empty; only 13 carried cargo. Few trucks transit these remote locations; only 34 percent of all trucks crossing Ak-Jol (Kyrgyzstan/Kazakhstan), Dostuk (Kyrgyzstan/Uzbekistan), and Kyzyl-Bel (Kyrgyzstan/Tajikistan) travelled under TIR (106 trucks).
13. Performance among BCPs differed significantly; Ak-Jol had the longest delays. In 2009, Ak-Jol introduced a one-stop approach that combined processing by four agencies (veterinary control, sanitary control, border services, and transport inspection) but this has not reduced delays. Also, Government is working to reduce barriers and stimulate the use of TIR; the private sector is investing in newer more efficient trucks to facilitate trade—primarily agricultural products destined for Russia.
14. Agency processing, primarily customs, requires much of total downtime; trucks must clear customs at a separate facility in the nearby city. At the BCPs, trucks are registered only by customs. A major reason for border delays is that truck drivers wait for cargo owners to arrive before going through border procedures, which increases total downtime.
19:34 19:42 16:33
13:26
0:47
7:17 11:00
5:14
2006 2007 2008 2009
Total Downtime Customs Formalities
16:33 13:26 12:47
5:34
0:33 0:08
11:00
5:14 2:48
0:05 0:05 0:01
Import'08 Import'09
Total Downtime Total Time (Control Formalities) Border Service Customs Authority Transport Authority Veterinary Control
14:38
3:00 3:54 0:21 1:49 0:14 0:20 0:01 0:38 0:03 0:09 0:01
Export'08 Export'09
Total Downtime Totoal Time (Control Formalities) Border Service Customs Authority Transport Authority Veterinary Control
9:48
4:50
9:15
4:04
0:14 0:11
10:05
3:41 1:46
0:04 0:16 0:02
Transit'08 Transit'09
Total Downtime Total time (Control Formalities) Border Service Customs Authority Transport Authority Veterinary Control
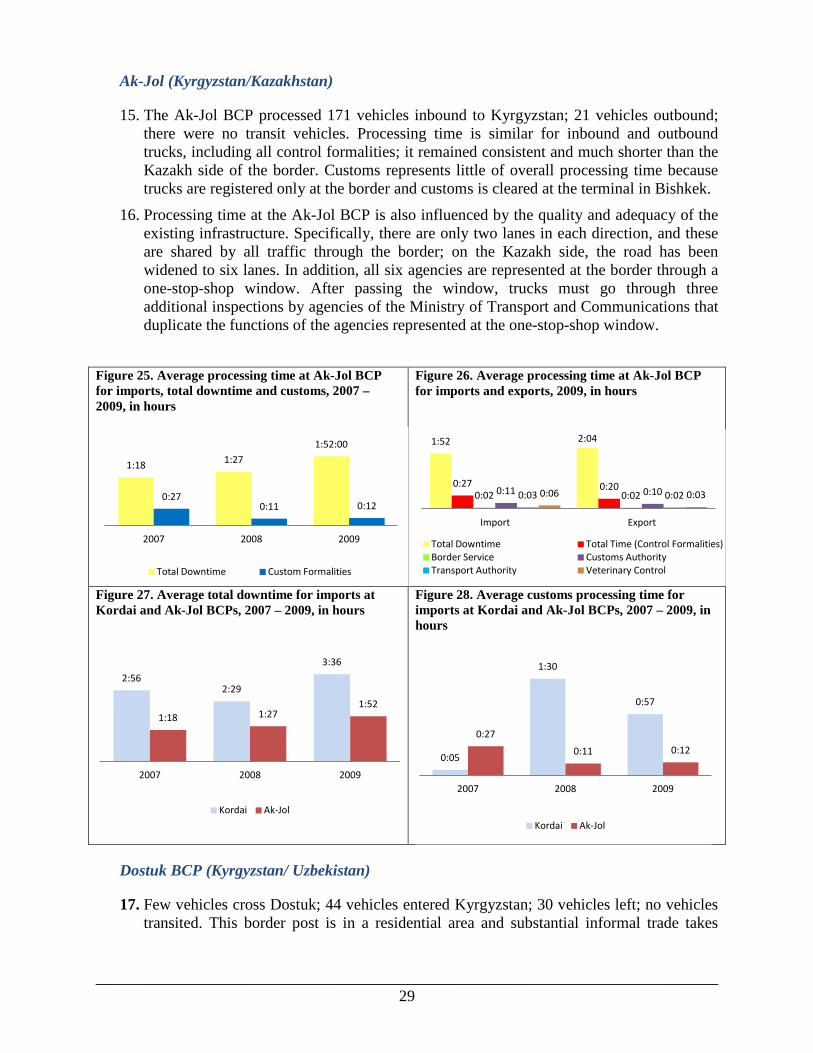
______________________________________________________________________________ 29
Ak-Jol (Kyrgyzstan/Kazakhstan)
15. The Ak-Jol BCP processed 171 vehicles inbound to Kyrgyzstan; 21 vehicles outbound; there were no transit vehicles. Processing time is similar for inbound and outbound trucks, including all control formalities; it remained consistent and much shorter than the Kazakh side of the border. Customs represents little of overall processing time because trucks are registered only at the border and customs is cleared at the terminal in Bishkek.
16. Processing time at the Ak-Jol BCP is also influenced by the quality and adequacy of the existing infrastructure. Specifically, there are only two lanes in each direction, and these are shared by all traffic through the border; on the Kazakh side, the road has been widened to six lanes. In addition, all six agencies are represented at the border through a one-stop-shop window. After passing the window, trucks must go through three additional inspections by agencies of the Ministry of Transport and Communications that duplicate the functions of the agencies represented at the one-stop-shop window.
Figure 25. Average processing time at Ak-Jol BCP for imports, total downtime and customs, 2007 – 2009, in hours
Figure 26. Average processing time at Ak-Jol BCP for imports and exports, 2009, in hours
Figure 27. Average total downtime for imports at Kordai and Ak-Jol BCPs, 2007 – 2009, in hours
Figure 28. Average customs processing time for imports at Kordai and Ak-Jol BCPs, 2007 – 2009, in hours
Dostuk BCP (Kyrgyzstan/ Uzbekistan)
17. Few vehicles cross Dostuk; 44 vehicles entered Kyrgyzstan; 30 vehicles left; no vehicles transited. This border post is in a residential area and substantial informal trade takes
1:18 1:27
1:52:00
0:27 0:11 0:12
2007 2008 2009
Total Downtime Custom Formalities
1:52 2:04
0:27 0:20 0:02 0:02 0:11 0:10 0:03 0:02 0:06 0:03
Import Export
Total Downtime Total Time (Control Formalities) Border Service Customs Authority Transport Authority Veterinary Control
2:56 2:29
3:36
1:18 1:27 1:52
2007 2008 2009
Kordai Ak-Jol
0:05
1:30
0:57
0:27
0:11 0:12
2007 2008 2009
Kordai Ak-Jol
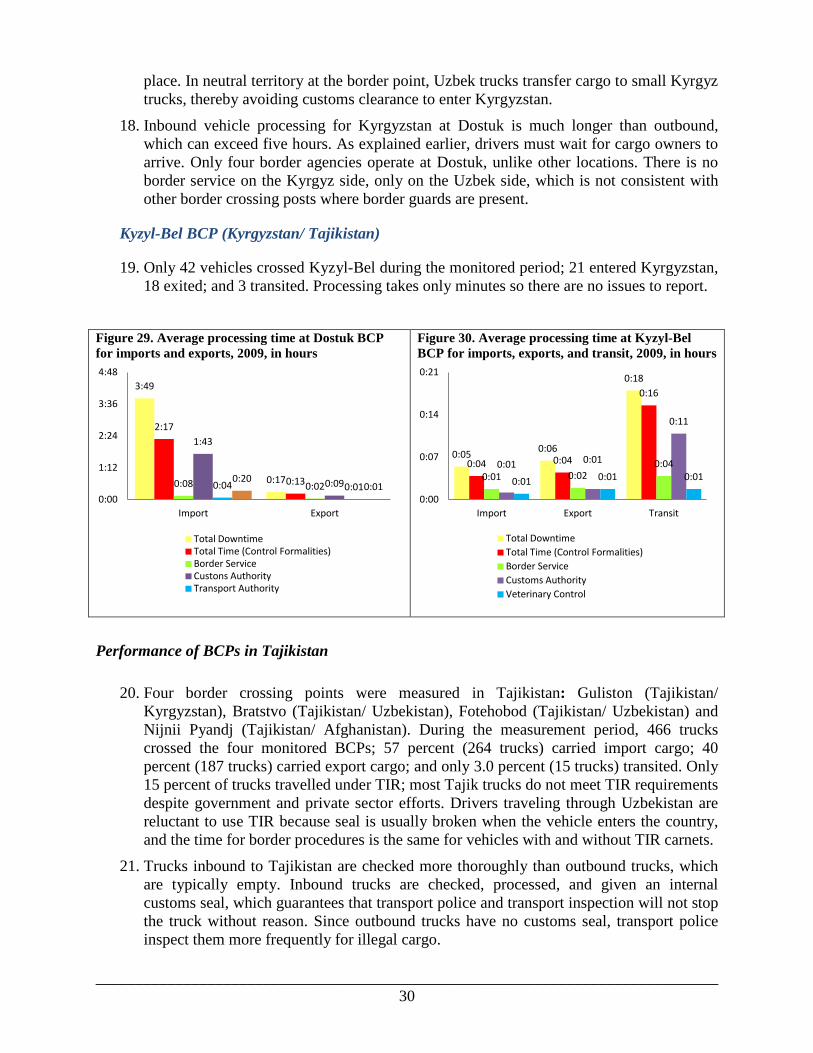
______________________________________________________________________________ 30
place. In neutral territory at the border point, Uzbek trucks transfer cargo to small Kyrgyz trucks, thereby avoiding customs clearance to enter Kyrgyzstan.
18. Inbound vehicle processing for Kyrgyzstan at Dostuk is much longer than outbound, which can exceed five hours. As explained earlier, drivers must wait for cargo owners to arrive. Only four border agencies operate at Dostuk, unlike other locations. There is no border service on the Kyrgyz side, only on the Uzbek side, which is not consistent with other border crossing posts where border guards are present.
Kyzyl-Bel BCP (Kyrgyzstan/ Tajikistan)
19. Only 42 vehicles crossed Kyzyl-Bel during the monitored period; 21 entered Kyrgyzstan, 18 exited; and 3 transited. Processing takes only minutes so there are no issues to report.
Figure 29. Average processing time at Dostuk BCP for imports and exports, 2009, in hours
Figure 30. Average processing time at Kyzyl-Bel BCP for imports, exports, and transit, 2009, in hours
Performance of BCPs in Tajikistan
20. Four border crossing points were measured in Tajikistan: Guliston (Tajikistan/ Kyrgyzstan), Bratstvo (Tajikistan/ Uzbekistan), Fotehobod (Tajikistan/ Uzbekistan) and Nijnii Pyandj (Tajikistan/ Afghanistan). During the measurement period, 466 trucks crossed the four monitored BCPs; 57 percent (264 trucks) carried import cargo; 40 percent (187 trucks) carried export cargo; and only 3.0 percent (15 trucks) transited. Only 15 percent of trucks travelled under TIR; most Tajik trucks do not meet TIR requirements despite government and private sector efforts. Drivers traveling through Uzbekistan are reluctant to use TIR because seal is usually broken when the vehicle enters the country, and the time for border procedures is the same for vehicles with and without TIR carnets.
21. Trucks inbound to Tajikistan are checked more thoroughly than outbound trucks, which are typically empty. Inbound trucks are checked, processed, and given an internal customs seal, which guarantees that transport police and transport inspection will not stop the truck without reason. Since outbound trucks have no customs seal, transport police inspect them more frequently for illegal cargo.
3:49
0:17
2:17
0:13 0:08 0:02
1:43
0:09 0:04 0:01 0:20
0:01 0:00
1:12
2:24
3:36
4:48
Import Export
Total Downtime Total Time (Control Formalities) Border Service Custons Authority Transport Authority
0:05 0:06
0:18
0:04 0:04
0:16
0:01 0:02 0:04 0:01 0:01
0:11
0:01 0:01 0:01
0:00
0:07
0:14
0:21
Import Export Transit
Total Downtime Total Time (Control Formalities) Border Service Customs Authority Veterinary Control

______________________________________________________________________________ 31
Guliston BCP (Tajikistan/ Kyrgyz Republic)
22. Traffic at Guliston is limited; no delays are reported for overall processing time. During the monitored period, only 10 trucks crossed the BCP; three entered Tajikistan and seven left. Overall processing time is shorter than that of other Tajikistan BCPs because trucks register only at customs and clear customs at the terminal in a nearby town; therefore, they need no customs escorts, which eliminates additional border delays. Processing time for control formalities at this BCP is similar to those in other locations in Tajikistan. Total processing time and the customs processing time is longer at the Tajikistan side than the Kyrgyz side.
Figure 31. Average processing time at Guliston BCP for imports and exports, 2009, in hours
Figure 32. Average total downtime for imports, exports and transit at Guliston and Kyzyl-Bel BCPs, 2009, in hours
Figure 33. Average customs processing time for imports, exports and transit at Guliston and Kyzyl-Bel BCPs, 2009, in hours
Bratstvo BCP (Tajikistan/ Uzbekistan)
23. Inbound traffic to Tajikistan is double that of outbound, and border processing time is also double. Some 29 vehicles carried exports; 42 carried imports. Inbound trucks experience significant delays waiting for traffic police to escort them to the terminal in Dushanbe to clear customs; only two cars are available to escort.
1:03
0:25
1:03
0:20 0:15
0:05
0:20
0:05 0:15
0:05 0:08 0:05
Import Export
Total Downtime Total Time (Control Formalities)
Border Service Customs Authority
Transport Authority Veterinary Control
0:05 0:06
0:18
1:03
0:25
Import Export Transit
Kuzyl-Bel Guliston
0:01 0:01
0:11
0:20
0:05
Import Export Transit
Kuzyl-Bel Guliston

______________________________________________________________________________ 32
Fotehobod BCP (Tajikistan/ Uzbekistan)
24. This is the only BCP in Tajikistan used by transit trucks: 15 vehicles. Another 26 trucks were inbound; 33 outbound trucks had no cargo. No specific delays were reported; control facilities processing takes little time and trucks need no customs escort. Drivers register at the border and are processed at a nearby terminal.
Figure 34. Average processing time at Bratstvo BCP for imports and exports, 2009, in hours
Figure 35. Average processing time at Fotehobod BCP for imports, exports, and transit, 2009, in hours
Nijnii Pyandj BCP (Tajikistan/ Afghanistan)
25. Nijnii Pyandj has higher traffic volumes than any other Tajik locations. Some 311 trucks crossed; 120 outbound and 191 inbound from Afghanistan; no transit vehicles were recorded. Truck volumes are increasing with Tajikistan’s growing demand for cement. Inbound truck processing time is much longer but delays are due to traffic volume, not waits for customs escorts, because trucks clear customs at the BCP. The bridge built in 2007 to replace ferry service has improved border crossing.
Figure 36. Average processing time at Nijnii Pyandj BCP for imports and exports, 2009, in hours
2:54
1:15 0:43 0:43
0:08 0:08
0:16 0:16 0:08 0:08 0:05 0:05
0:00
2:24
4:48
Import Export
Total Downtime Total Time (Control Formalities) Border Service Customs Authority
1:13 0:57
1:22
0:43 0:34
0:43
0:07 0:07
0:07
0:11
0:11
0:11
0:07 0:07 0:07
0:06 0:06 0:06
0:00
1:12
2:24
Import Export Transit
Total Downtime Total time (Control Formalities) Border Service Customs Authorities Transport Authorities
2:51
0:41 0:47 0:30
0:05 0:05 0:05 0:05
0:06 0:06 0:07 0:07
0:00
1:12
2:24
3:36
Import Export Total Downtime
Total Time (Control Formalities)
Border Service
Customs Authority
Transport Authority
Veterinary Control

______________________________________________________________________________ 33
Performance of BCPs in Afghanistan
26. Significant delays were observed at both border crossing points measured in Afghanistan: Sherkhan Bandar (Afghanistan/Tajikistan) and Hairatan (Afghanistan/Uzbekistan). Sherkhan Bandar averaged 55 trucks per day passed during the monitored period; most Hairatan goods arrive by boat or train and are offloaded to trucks. Truckers report border delays of up to 55 hours, primarily because goods must be off-loaded and warehoused for inspection before being loaded on the trucks again. However, Inland Clearance Depots being developed at both borders are anticipated to reduce the delays. Frequent demands for unofficial payments also impede smooth border crossings.
Sherkhan Bandar BCP (Afghanistan/ Tajikistan)
27. Trucks can be delayed for up to 57 hours; average time to clear customs is 2.5 hours. Most delays occur because cargo is transshipped between Tajik trucks to Afghan or Pakistani trucks. In July 2009, an EU-funded Inland Clearance depot (ICD) opened two kilometers beyond the post frontier, which should decrease overall downtime because trucks average 10 minutes for border crossings and must present a road pass and vehicle registration.
28. Demands for official payments are common at this BCP. Payments per truck are US$250 for cement, US$110 for timber, US$90 for LPG and US$100 for potatoes; trucks carrying up to 15 tons are required to pay US$100 and for loads more than 15 tons, US$200. This BCP averages 55 trucks per day.
Hairatan BCP (Afghanistan/ Uzbekistan)
29. Considerable delays and an average waiting time of up to 56 hours are common. Much time is spent off-loading goods from trains and boats, customs processing and on-loading to delivery trucks. All goods transported by rail and water must first be off-loaded and warehoused for inspection, a process that can be delayed by power outages that disable the cranes. Customs officials sometimes deem it necessary to off-load the truck cargo for inspection, which is time-intensive. An EU-funded Inland Clearance depot two km after the border is anticipated to ease border crossing, and an ADB-funded railway line extension to Mazaar Sharif is also planned.
30. This border crossing point averaged 10 trucks/day, primarily inbound to Kazakhstan with Chinese goods. Most Hairatan traffic arrives by train (fuel, construction materials, imported grains). Daily traffic averages 20 wagons with general cargo and 20 with petroleum products that are loaded on Afghan trucks. Unofficial payments are frequently requested; US$100 for MS bars, US$90 for fuel, US$50 for glass, and US$20 for pulses.
Performance of BCP in Pakistan
31. One Pakistan border crossing was monitored: Torkham (Pakistan/Afghanistan). During the first round of measurements, 2,455 trucks entered Afghanistan; 3,506 during the second round. In Pakistan, between three and five hours were needed to complete border formalities. In Afghanistan, this process was shorter, averaging less than one hour. The big difference is that brokers collect the documents and process the Afghan Goods

______________________________________________________________________________ 34
Declaration (the T1) while trucks are waiting on the Pakistan side for customs clearance at Jalalabad or Kabul. Further improvements are expected when the new customs clearance system, ASYCUDA, is fully implemented after its 2008 pilot.
Torkham (Pakistan/Afghanistan)
32. Torkham is a busy BCP with a total of 2,455 truck crossing over a period of six days in February 2007. The average processing time on the Afghanistan side was 54 minutes in February and 42 minutes in October 2007. On the Pakistan side, it was reported that it takes between three and five hours to complete border formalities. The relatively short time required for processing on the Afghan side is due to brokers who collect the documents and process the Afghan Goods Declaration (the T1) while the trucks are still waiting at the Pakistan side of the border for customs clearance at Jalalabad or Kabul.
33. In December 2009, Afghanistan and Pakistan concluded the fifth round of talks on the Afghanistan Pakistan Trade and Transit Agreement (APTTA), which is expected to smooth trade and transit through both countries and strengthen regional integration.
34. Torkham has no weigh bridge at the Customs Control Zone entry, fast and slow traffic are not separated, the parking area is neither secured nor fenced and lacks access gates. Border Police Officers were observed at the Customs Control area, which should be under the sole jurisdiction of customs; and although they lack jurisdiction to check vehicles, Border Police were present at each stop collecting unofficial payments.

______________________________________________________________________________ 35
ANNEX C: OBSERVATIONS OF ROAD TRANSPORT CORRIDORS
Syrym –Kyzyl Orda – B. Konysbaev
1. This road transport corridor is the shortest route through Kazakhstan from Asia (south) to Europe (west). This corridor is classified as a republican road however there is no actual road along some of the segments; therefore performance monitoring took place only during the first round of measurements due to difficult travel. Three travel times reported for this route were 74, 63, and 95 hours. Trucks were stopped an average of 16 times along the corridor and the trip cost US$497, including fuel and repairs. Transport control stopped trucks on average three to four times and requested payments of about US$58; traffic police stopped trucks an average of 10 times and requested payments of US$106 (see Table 11). Outbound trucks were stopped most frequently by transport inspectors, traffic police, and customs inspectors, according to drivers interviewed in 2008 at B. Konysbaev BCP. Each inbound truck was stopped an average of eight times, each time for 30 minutes per stop, and made unofficial payments of US$15-20 per stop. Outbound trucks spent an average of ten hours at the BCP, but inbound or transiting trucks completed the process in one or two hours. In 2009, drivers indicated a decline in the number of stops, duration of stops, and size of unofficial payments (Table 11).
2. In 2008, drivers reported that at Syrym BCP, outbound and inbound trucks without the TIR logo were stopped an average of about eight times for about 30 minutes and for unofficial payment of about US$15 to 20. Trucks travelling with the TIR logo were stopped less frequently but unofficial payments of US$15-20 were requested. Traffic police stopped all types of truck an average of three to five times for about 10 to 15 minutes and an unofficial payment as low as US$4 and as high as US$40. All trucks passed customs relatively quickly, about 10 minutes, except for trucks loaded with imports without TIR, for which the wait could be up to one hour. Only one of the interviewed drivers reported having to make an unofficial payment, which was US$250 (Table 11).
Korgas - Kordai– B. Konysbaev
3. This corridor, which crosses Kazakhstan from east to west, is important for transit goods between China and the rest of Asia. Three observers accompanied drivers along this corridor during the first round of measurements. Only two of the observed trucks traveled under TIR and the three observers reported travel times along the corridor of 59, 56, 53 hours. The trucks were stopped an average of 15 times and the total average cost of the trip was US$247, including fuel and repairs. On average the trucks were stopped by transport control twice and made unofficial payments averaging around US$27. Traffic police stopped the trucks an average of seven times and requested unofficial payments averaging US$55. During the second round of measurements the corridor was 30 km shorter due to completion of repairs of the Ili river bridge. Subsequently, the travel time was decreased to 39, 49 and 60 hours and the cost to US$208 (see Table 11).
4. Drivers interviewed at Korgas BCP in 2008, were outbound to China or inbound to Kazakhstan; all outbound trucks were empty, except one. Trucks leaving and entering the country were stopped an average of four to five times by traffic inspectors and traffic

______________________________________________________________________________ 36
police for 10 to 15 minutes; drivers made unofficial payments of US$10-15. At customs, outbound trucks spent about 10 minutes; inbound trucks carrying consumer goods, spent 20 hours; drivers made unofficial payments of US$250 each. In 2009, driver interviews at Korgas indicated that stops by traffic inspectors and traffic police and unofficial payments were about the same as in 2008. However, transit trucks spent between one and four hours at customs and made unofficial payments between US$100 and 500. Inbound trucks spent between 3.5 and 10 hours at customs and made unofficial payments of up to US$500 (see Table 11).
Kordai–Astana- Kairak
5. This transport corridor crosses Kazakhstan from south to north and is a major route from Asia to Europe. Three observers traveled this corridor during the second round of measurements reported travel times were 40, 46 and 52 hours for the 765 km. Average travel cost was US$306 and the three trucks were stopped an average of 16 times enroute. Transport control authorities stopped the trucks two or three times; one driver made an unofficial payment of US$133. Traffic police stopped the trucks about five times; two drivers made unofficial payments (see Table 11).
6. In 2009, drivers at Kairak BCP reported transport inspectors and traffic police stopped all trucks an average of five times for about 15 minutes; drivers made unofficial payments of US$20. Customs processing varied and no pattern relating to cargo or destination was detected; at customs, drivers made unofficial payments of about US$33 (5,000 Tenge bill), which is said to be standard here (see Table 11).
7. In 2008, drivers at Kordai BCP reported that trucks were stopped an average of five to seven times for transport inspection for about 15 to 20 minutes and made unofficial payments of about US$10. Traffic police stopped each truck about three to four times for about 10 minutes during which drivers made unofficial payments of about US$15. Although drivers did not mention average customs processing time, a driver of an inbound truck reported 20 hours at customs and an unofficial payment of US$250. During 2009, stops by transport inspectors and traffic police remained at the same level but unofficial payments had risen to US$20-30. Unofficial payments ranged from US$20 to US$500; higher payments were demanded of outbound truck drivers (see Table 11).
Ak-Jol–Bishkek- Osh- Dostuk
8. Three observers accompanied truck drivers along this 765 km-corridor; Bishkek Osh is in very good condition. The corridor has two steep passes (Too-Ashuu, Ala-Bel) and one pass (Toktogul to Kara-Kul), which are challenging and slow the journey. Total travel time reported was 34, 24 and 23 hours during which drivers were stopped 15 times; the average travel cost was US$655, including fuel and repairs. Transport control authorities stopped drivers about 15 times; drivers made unofficial payments of about US$76. Traffic police stopped trucks an average of nine times; drivers made payments of about US$36. During 2007, the number and duration of stops were similar; but unofficial payment amounts were less (see Table 11).
9. In 2009, drivers at Ak-Jol BCP reported that transport inspectors stopped outbound trucks once or twice for about 20 minutes and unofficial payments of about US$10. Inbound and

______________________________________________________________________________ 37
transiting trucks experienced more frequent but shorter stops and higher unofficial payments. All trucks experienced six or seven traffic police stops averaging 5-10 minutes; a few drivers made unofficial payments that averaged about US$10. Customs processing averaged two to four hours, but up to 20 hours was reported for inbound trucks. Outbound and transit trucks passed through customs relatively quickly. A few drivers reported unofficial payments at customs of US$33-66 (see Table 11).
10. In 2009, drivers at Dostuk BCP reported that traffic police stopped outbound trucks about 20 times for 30 minutes each time. Along the route, there was an average of nine stops of about one hour each, with no requests for unofficial payments. Customs processing time was longest for inbound trucks with the TIR logo, whose drivers reported unofficial payments of about US$200 (see Table 11).
Ak-Jol–Bishkek- Osh- Kyzylbel
11. Drivers along this 882 km corridor were stopped an average of 17 times; total travels costs were US$495, including fuel and truck repairs. Three observers accompanied truck drivers and reported travel times of 46, 28, 24 hours. Transport control authorities stopped drivers about three times; drivers made unofficial payments of about US$32. Traffic police stopped the trucks an average of nine times; drivers made unofficial payments of about US$13 (see Table 11).
12. Only four drivers were interviewed at Kyzyl-Bel BCP, all export trucks traveling under TIR and indicating considerable delays and request for unofficial payments along the route. Three trucks carrying agricultural products, including cherries, were stopped four times for transport inspection—about three hours each time; drivers made unofficial payment of about US$200. Traffic inspectors stopped the truck transporting cherries only three times—about 10 minutes per time; the driver made unofficial payment of US$1. Traffic police stopped trucks transporting agricultural products an average of seven times—about three hours per time; drivers made unofficial payments of about US$17. Customs clearance times for trucks transporting agricultural products was about 24 hours; for cherries, 20 minutes; drivers made official payments of US$184 and unofficial payments of US$1,000 (see Table 11).
Fotehobod – Proletarsk – Guliston
13. Travel time for the 70 km Fotehobod-Guliston corridor was 1.5 hours; no stops were made. In the opposite direction, transport police stopped drivers twice for document checks; no unofficial payments were made.
14. In 2009, most trucks at Fotehobod BCP were transiting under the TIR logo. Drivers reported transport inspection stops for about 10 minutes and unofficial payments of US$2; drivers reported no traffic police stops. Customs clearance took 20 minutes; unofficial payments were US$15-25.
15. In 2009, drivers at Guliston BCP reported infrequent stops enroute. Drivers reported one stop for transport inspection, one or two traffic police stops, and informal payments of US$4-5. Customs clearance times were 10-20 minutes; two drivers reported unofficial payments of US$17-20.

______________________________________________________________________________ 38
Bratstvo –Dushanbe – Nijnii Pyandj
16. The first 72-km section, Bratstvo to terminal Dushanbe, had total travel time of two hours. Transport inspectors stopped one driver one time; transport police stopped all trucks two or three times; drivers made unofficial payments of US$3-4. Only one observer travelled the second 184-km section, Nijnii Pyandj to terminal Dushanbe; travel time was 8.5 hours. Transport inspectors stopped the truck one time; the driver made an unofficial payment of US$3. Transport police stopped the truck six times; the driver made unofficial payments of US$29.
17. Drivers at Bratstvo reported that outbound trucks are stopped more frequently than inbound. All inbound trucks were stopped one time by transport inspectorate and one time by transport police for about 10 minutes each time; drivers made unofficial payments of US$3-10. Outbound truck drivers indicated no stops by transport inspectors; traffic police stopped them two or three times for 10 15 minutes each; drivers made unofficial payments of US$5-10. Customs clearance processing times were about 15 to 30 minutes for all trucks; drivers made unofficial payments of US$20-25. Drivers interviews at Nijnii Pyandji BCP revealed similar results.
Torghundi –Herat
18. Travel costs along this 125 km corridor average US$250-270. Traffic police stopped trucks three times for 10 to 15 minutes each time; drivers made unofficial payments of US$10-15. Most trucks along this route transport liquid gas from Turkmenistan to Afghanistan. Drivers at Torghundi BCP reported border clearance took 5-10 minutes, transport control took 10-30 minutes; drivers made official payments of US$100-150 (based on tonnage); some drivers made unofficial payments of US$10. Trucks passed through sanitary/epidemiology service in 10-30 minutes (based on cargo size). At customs, transport company representatives handled all documentation and payments due to the nature of the cargo (liquid gas). Official payments averaged US$100; customs clearance took five or six hours for both monitoring periods. After delivering the liquid gas to Afghanistan, trucks return to Turkmenistan empty; no obstacles are reported on the return journey.
Torkham – Islamabad - Karachi
19. Half of the highways are in poor condition (47.7 percent); half of trucks are overloaded (47.4 percent). Some 272,408 trucks are available for haulage along this 3,729 km corridor; average annual truck productivity is 1,075,350 ton-km; total road freight throughput is 7,248 ton per km.
20. In 2007, drivers reported an average of five hours to drive from Peshawar to the border and 86 hours to drive from Karachi to the border. Pakistan border crossing times were 33-37 hours. Some 90 percent of drivers had their commercial documents processed by Afghan brokers before arrival on the Pakistan side. Drivers encountered more problems transiting Afghanistan than Pakistan. Specifically, 77 percent of the drivers cited some problems while driving through Pakistan and only six percent cited many problems. In comparison, 31 percent of the drivers cited some problems and 66 cited many problems
______________________________________________________________________________ 39
while driving through Afghanistan. At border control, 71 percent of drivers reported encountering some problems on the Pakistan side and 64 percent on the Afghanistan side.
21. Drivers in Afghanistan reported that border police were a larger problem than traffic police. Six percent of drivers reported having “many problems” within Pakistan and 13 percent cited problems at Pakistan border. Of these drivers, 35 percent indicated many problems at the Afghan border and 66 percent within Afghanistan. Drivers said that border police and traffic police were more problematic than customs officials.

______________________________________________________________________________ 40
ANNEX D: REFERENCES
1. CAREC. 2008. Seventh Ministerial Conference on Central Asia Regional Economic Cooperation. 19-21 November 2008. Baku, Azerbaijan.
2. Emerson, Michael; Vinokurov, Evgeny. 2009. Optimisation of Central Asian and Eurasian Trans-Continental Land Transport Corridors. EU-Central Asia Monitoring. Working Paper 07. December 2009.
3. Eurasian Development Bank. 2009. The EurAsEC Transport Corridors. Sector Report. March 2009.
4. European Union TRACECA Programme for “Partner Country”. 2009. International Logistics Centers/Nodes Network in Central Asia at the Republic of Kazakhstan, Kyrgyz Republic, Republic of Tajikistan, Republic of Uzbekistan and the Republic of Turkmenistan. EuropeAid/125727/C/SER/Multi. Inception Report.
5. Infra-D Consulting. 2008. Survey Report on Cross-Border Trade Between Afghanistan and it Northern Neighbors: Uzbekistan and Tajikistan and the Border Crossing Points of: Hairatan and Sher Khan Bandar. Islamabad.
6. International Monetary Fund. 2009. Kyrgyz Republic: 2009 Article IV Consultation and First Review Under the 18-Month Arrangement Under the Exogenous Shocks Facility – Staff Report; Staff Supplement; Public Information Notice and Press Release on the Executive Board Discussion; and Statement by the Executive Director for the Kyrgyz Republic. IMF Country Report No 09/209. Washington, DC.
7. International Monetary Fund. 2009. Pakistan: Second Review and Request for the Augmentation of Access Under the Stand-By Arrangement; Staff Report; Staff Supplement; Staff Statement; Press Release on the Executive Board Discussion; and Statement by the Executive Director for Pakistan. IMF Country Report No 09/265. Washington, DC.
8. International Monetary Fund. 2009. Republic of Kazakhstan: 2009Article IV Consultation – Staff Report; Supplement; and Public Information Notice on the Executive Board Discussion. IMF Country Report No 09/300. Washington, DC.
9. International Monetary Fund. 2009. Republic of Tajikistan: 2009Article IV Consultation, Final Review Under the Staff-Monitored Program, and Request for a Three-Year Arrangement Under the Poverty Reduction and Growth Facility – Staff Report; Staff Supplement; Staff Statement; Public Information Notice and Press Release on the Executive Board Discussion; and Statement by the Executive Director for the Republic of Tajikistan. IMF Country Report No 09/174. Washington, DC.
10. Islamic Republic of Afghanistan. Ministry of Commerce and Industries. 2007.Cross Border Movements of Commercial Vehicles. Survey Conducted in Thorkham Border Post. February 2007, Kabul.
11. Mihailova, Lyubka. 2005. Performance Indicators Performance Measurement Study Afghanistan. PIPS Consultant. London.
12. NEA. 2008. Analysis of Monitoring Data Collected on NELTI Project Routes in 2007 – 2008. Final Report.
13. World Bank. 2005. Business Environment and Enterprise Performance Survey. World Bank. Washington, DC.
14. World Bank. 2007. Connecting to Compete: Trade and Logistics in the Global Economy - The Logistics Performance Index and Its Indicators. World Bank. Washington, DC.
15. World Bank. 2007. Cross-Border Trade Within the Central Asia Regional Economic Cooperation. World Bank. Washington, DC.
16. World Bank. 2008. Lessons of Corridor Performance Measurement. Sub-Saharan Africa Transport Policy Program. Discussion Paper No.7. Regional Integration and Transport Series. World Bank. Washington, DC.
17. World Bank. 2009. Bazaars and Trade Integration in CAREC Countries. World Bank. Washington, DC.
18. World Bank. 2009. Connecting to Compete: Trade and Logistics in the Global Economy - The Logistics Performance Index and Its Indicators. World Bank. Washington, DC.
19. World Bank. 2009. Doing Business 2009. World Bank. Washington, DC.
20. World Bank. 2009. Emergency Project Paper on a Proposed Loan/Credit to the Islamic Republic of Afghanistan for a Customs Reform and a Trade Facilitation Project. World Bank. Washington DC.

______________________________________________________________________________ 41
21. World Bank. 2009. Expanding Trade in Central Asia by Connecting with Markets. Draft paper. World Bank. Washington, DC.
22. World Bank. 2009. Fostering Cross-Border Cooperation in Trade and Development Among the CAREC Countries. A synthesis note. World Bank. Washington, DC.
23. World Bank. 2009. Islamic Republic of Pakistan National Trade Corridor Improvement Program Performance Monitoring, Evaluation and Decision Support System. World Bank. Washington, DC.
24. World Bank. 2009. World Development Report 2009: Reshaping Economic Geography World Bank. Washington, DC.
25. World Economic Forum. 2009. The Global Enabling Trade Report 2009. Geneva.
______________________________________________________________________________ 42
ANNEX E: MAPS

______________________________________________________________________________ 43

______________________________________________________________________________ 44