Embed Size (px)
Citation preview
Trade and Investment Core Statistics BookLatest statistics on trade, investment and the economy Last updated: 18 November 2021
Next major update: 20 December 2021
Contact: [email protected]

2
50T62T62TCONTENTS
Things you need to know about this publication ............................................... 3
Statistics summary sheet ................................................................................. 6
Top and emerging partner countries, 2020 ................................................... 10
Top and fastest-growing goods and services, 2020 ....................................... 14
Trade statistics ............................................................................................... 17
Exports ................................................................................................................ 17
Total (goods and services) exports .................................................................. 17
Goods exports ................................................................................................. 27
Services exports .............................................................................................. 32
Imports ................................................................................................................ 39
Total (goods and services) imports .................................................................. 39
Goods imports ................................................................................................. 46
Services imports .............................................................................................. 51
Trade balance ..................................................................................................... 57
Total trade ........................................................................................................... 60
World trade forecasts .......................................................................................... 62
Current account balance ..................................................................................... 64
Trade in value added ........................................................................................... 66
FDI (Foreign Direct Investment) statistics ............................................................ 72
Inward FDI ....................................................................................................... 72
Outward FDI .................................................................................................... 74
Inward investment projects statistics ................................................................... 76
DIT statistics .................................................................................................... 76
Statistics summary sheet – Table of sources ................................................. 78
Update schedule ............................................................................................ 80
Glossary ........................................................................................................ 83

3
Things you need to know about this publication
1. The latest ONS release UK Trade: September 2021 covering UK trade data up to September 2021 includes trade after the EU exit transition period ended on 31 December 2020. Evidence suggests some trade in goods could have been affected by disruption caused by the end of the transition period. The last few months of 2020 saw increasing imports and exports of goods consistent with stockpiling in preparation for the end of the EU exit transition period, which was followed by likely unwinding of stocks in January and February 2021.
2. The World Bank ease of doing business statistics are no longer presented in the statistics summary sheet. This follows the announcement from the World Bank on 16 September 2021 that the ‘Doing Business’ reports will be discontinued after a series of reviews and audits which raised concerns about data quality.
3. From January 2021 there has been a change in the data collection methods for GB goods exports to the EU. Data are now captured by customs declarations (consistent with data collection for UK goods trade with the Non-EU). There have been no changes to data collection methods for goods imports.
4. HMRC discovered errors in their Overseas Trade in Goods Statistics (OTS) that are used to compile the ONS UK Trade statistics. This mainly affected data back to January 2019 and mainly impacted data for goods exports to Non-EU countries. HMRC have corrected these errors in the September 2021 OTS and corrections will be made to the HMRC Regional Trade Statistics (RTS) in the next release (due in January 2022). The ONS have carried out corrections back to January 2020 and will carry out the rest of the corrections next year to align with their National Accounts revision schedule. The ONS have published an article to explain the impact of the corrections.
5. In addition to the changes facing the UK after the EU transition period ended, the UK and many of its trading partners continue to be impacted by the Coronavirus (COVID-19) pandemic. Some of the figures within this publication suggest evidence of COVID-19-related impacts on UK trade. However, the full effects cannot be quantified as impacts are generally embedded in source data and cannot be separately identified.
6. For the latest statistics on trade and investment between the UK and all individual trading and investment partners please see the trade and investment factsheets.
7. These statistics are designated as Official Statistics under the Statistics and Registration Service Act 2007. From August 2018 these statistics have been produced to fully comply with the Code of Practice for Official Statistics. The United Kingdom Statistics Authority has

4
not assessed these statistics for compliance against the code and as such these statistics are not National Statistics.
8. This publication covers and summarises the wide range of statistics produced by the Office for National Statistics (ONS), HM Revenue and Customs (HMRC), Department for International Trade (DIT), the Organisation for Economic Co-operation and Development (OECD) and others into a single product.
9. The compendium brings together these statistics in a user-friendly publication with the aim of helping users to quickly find the most relevant and up to date trade and investment statistics. It provides the latest available statistics from a number of UK and international sources on a consistent basis and where inconsistencies exist explains the differences between the sources. The publication of the Trade and Investment Core Statistics Book will help to improve the accessibility of trade and investment statistics by helping both the professional and newcomers to trade and investment statistics navigate the various sources to identify the most relevant statistics and to present them in a consistent manner.
10. Due to the large number of data sources available it can be difficult to determine which is the best source of information for a particular statistic. Therefore DIT have produced this Technical Annex to provide more information about the different sources, including some information on the strengths and weaknesses of the statistics.
11. Additionally more information is available from the relevant data supplier which can be found by following the source link below the statistic of interest.
12. All figures are correct as of the date of release (on front page of this publication), and as reported by their data producer. The publication will be updated in line with the update schedule.
13. New or revised figures since the last publication will be highlighted in the statistics summary sheet in dark blue and with a red star () in the main text.
14. In some instances figures in the main commentary may differ to those in the Trade and investment statistics summary sheet. This is because more up-to-date figures on goods and services by partner country, consistent with the aggregate figures in the statistics summary sheet, are not available. This means that some tables and charts within the commentary, such as country ranking tables, use older data to provide these breakdowns.
15. For terms and definitions please see the glossary at the end of the publication.
16. Unless otherwise stated, all data are nominal (current prices), not adjusted for inflation. Real estimates (constant prices) take account of inflation.
17. Totals may not exactly match the sum of their parts due to rounding.

5
18. All data are seasonally adjusted unless otherwise specified. The exception to this is data sources that only provide annual data, such as the ONS Non-financial business economy, exporters and importers in Great Britain (Annual Business Survey): 2019 or Department for International Trade inward investment results 2020 to 2021, where seasonal adjustment is not needed. Seasonally adjusted data available on a more frequent basis (e.g., quarterly) is often constrained so that when it is summed to get data for a calendar year it will match non-seasonally adjusted data for the same calendar year.

Trade and Investment Statistics Summary Sheet
All statistics presented are based on published figures and the sources can be found on page 78 and 79.
Rows where estimates changed since last iteration of the Statistics Summary Sheet are in dark blueLatest statistics Calendar year statistics Update schedule†
# StatisticYear ending: Measure
Change on previous 12 months Year Measure
Change on previous year
Latest release
Next release
Gross Domestic Product (GDP)1 Annual real GDP growth Q3 2021 3.2% Up 10.9 ppts 2020 -9.7% Down 11.4 ppts 11-Nov-21 22-Dec-21
Trade in goods and services
2 Exports[% of total trade] Sep-21 £602.5bn
[49.1%]Down 4.8%[Down 2.1 ppts] 2020 £601.0bn
[50.2%]Down 14.1%[Up 0.9 ppts] 11-Nov-21 10-Dec-21
3 Imports[% of total trade] Sep-21 £625.4bn
[50.9%]Up 3.6%[Up 2.1 ppts] 2020 £596.7bn
[49.8%]Down 17.1%[Down 0.9 ppts] 11-Nov-21 10-Dec-21
4 Total trade Sep-21 £1,228.0bn Down 0.7% 2020 £1,197.7bn Down 15.6% 11-Nov-21 10-Dec-215 Trade balance Sep-21 -£22.9bn Down £52.4bn 2020 £4.3bn Up £25.0bn 11-Nov-21 10-Dec-216 Exports as % of GDP Q3 2021 26.4% Down 2.8 ppts 2020 27.9% Down 3.1 ppts 11-Nov-21 10-Dec-217 Imports as % of GDP Q3 2021 27.4% Down 0.4 ppts 2020 27.7% Down 4.2 ppts 11-Nov-21 10-Dec-218 Total trade as % of GDP Q3 2021 53.9% Down 3.2 ppts 2020 55.5% Down 7.4 ppts 11-Nov-21 10-Dec-219 Trade balance as % of GDP Q3 2021 -1.0% Down 2.4 ppts 2020 0.2% Up 1.1 ppts 11-Nov-21 10-Dec-21
10Exports to the EU[% of all exports]‡
Q2 2021 £251.9bn[42.4%]
Down 6.9%[Up 1.9 ppts] 2020 £251.3bn
[41.8%]Down 14.3% [Down 0.1 ppts] 30-Sep-21 22-Dec-21
11Exports to the Non-EU[% of all exports]‡
Q2 2021 £342.1bn[57.6%]
Down 13.8%[Down 1.9 ppts] 2020 £349.7bn
[58.2%]Down 13.9%[Up 0.1 ppts] 30-Sep-21 22-Dec-21
12Imports from the EU[% of all imports]‡
Q2 2021 £291.9bn[47.7%]
Down 10.9%[Down 3.6 ppts] 2020 £300.7bn
[50.4%]Down 18.8%[Down 1.0 ppts] 30-Sep-21 22-Dec-21
13Imports from the Non-EU[% of all imports]‡
Q2 2021 £319.8bn[52.3%]
Up 3.0%[Up 3.6 ppts] 2020 £296.0bn
[49.6%]Down 15.3%[Up 1.0 ppts] 30-Sep-21 22-Dec-21
Some of the statistics in these tables include data from January 2021; the first data to include trade after the EU transition period. Data from January 2021 has seen changes to data collectionmethods for exports of goods from GB to the EU, therefore caution is advised when interpreting the data.† The update schedule indicates when data is due for publication which could result in data in the row being updated or revised, not necessarily when data for the next calendar year will become available. The first release of 2020 (calendar year) data for rows #1-9, 20-31, 33-36, became available on 12 February 2021 and rows #10-17, 37-44, 46-47 became available on 31 March 2021.‡ To calculate % of all exports/imports/total trade, the figure from the same source as the numerator is used. 6

# StatisticYear ending: Measure
Change on previous 12 months Year Measure
Change on previous year
Latest release
Next release
14Total trade with the EU[% of total trade]‡
Q2 2021 £543.8bn [45.1%]
Down 9.1%[Down 0.7 ppts] 2020 £552.0bn
[46.1%]Down 16.8%[Down 0.7 ppts] 30-Sep-21 22-Dec-21
15Total trade with the Non-EU[% of total trade]‡
Q2 2021 £661.9bn [54.9%]
Down 6.4%[Up 0.7 ppts] 2020 £645.6bn
[53.9%]Down 14.6%[Up 0.7 ppts] 30-Sep-21 22-Dec-21
16 Trade deficit with the EU Q2 2021 £40.0bn Down £17.1bn 2020 £49.4bn Down £27.8bn 30-Sep-21 22-Dec-2117 Trade surplus with Non-EU Q2 2021 £22.3bn Down £64.2bn 2020 £53.7bn Down £2.8bn 30-Sep-21 22-Dec-2118 Global Ranking: Total exports N/A N/A N/A 2020 6th No change 08-Sep-21 TBC19 European Ranking: Total exports N/A N/A N/A 2020 3rd No change 08-Sep-21 TBC
Trade in goods
20 Goods Exports[% of all exports] Sep-21 £317.0bn
[52.6%]Down 3.7%[Up 0.6 ppts] 2020 £308.7bn
[51.4%]Down 17.0%[Down 1.8 ppts] 11-Nov-21 10-Dec-21
21 Goods Imports[% of all imports] Sep-21 £479.1bn
[76.6%]Up 12.0%[Up 5.8 ppts] 2020 £437.4bn
[73.3%]Down 14.3%[Up 2.4 ppts] 11-Nov-21 10-Dec-21
22 Goods Total trade[% of total trade] Sep-21 £796.0bn
[64.8%]Up 5.2%[Up 3.6 ppts] 2020 £746.1bn
[62.3%]Down 15.4%[Up 0.1 ppts] 11-Nov-21 10-Dec-21
23 Trade in goods deficit Sep-21 £162.1bn Up £63.8bn 2020 £128.7bn Down £9.5bn 11-Nov-21 10-Dec-21
24 Goods Exports to EU[% of all goods exports] Sep-21 £154.3bn
[48.7%]Up 4.7%[Up 3.9 ppts] 2020 £146.6bn
[47.5%]Down 14.1%[Up 1.6 ppts] 11-Nov-21 10-Dec-21
25 Goods Exports to Non-EU[% of all goods exports] Sep-21 £162.7bn
[51.3%]Down 10.6%[Down 3.9 ppts] 2020 £162.1bn
[52.5%]Down 19.5%[Down 1.6 ppts] 11-Nov-21 10-Dec-21
26 Goods Imports from EU[% of all goods imports] Sep-21 £233.3bn
[48.7%]Up 1.8%[Down 4.9 ppts] 2020 £232.6bn
[53.2%]Down 13.8%[Up 0.3 ppts] 11-Nov-21 10-Dec-21
27 Goods Imports from Non-EU[% of all goods imports] Sep-21 £245.8bn
[51.3%]Up 23.9%[Up 4.9 ppts] 2020 £204.8bn
[46.8%]Down 14.8%[Down 0.3 ppts] 11-Nov-21 10-Dec-21
28 Goods Total trade with EU[% of goods total trade] Sep-21 £387.5bn
[48.7%]Up 2.9%[Down 1.1 ppts] 2020 £379.2bn
[50.8%]Down 13.9%[Up 0.9 ppts] 11-Nov-21 10-Dec-21
29 Goods Total trade with Non-EU[% of goods total trade] Sep-21 £408.5bn
[51.3%]Up 7.4%[Up 1.1 ppts] 2020 £366.9bn
[49.2%]Down 16.9%[Down 0.9 ppts] 11-Nov-21 10-Dec-21
30 Goods trade deficit with the EU Sep-21 £79.0bn Down £2.8bn 2020 £86.0bn Down £13.0bn 11-Nov-21 10-Dec-2131 Goods trade deficit with Non-EU Sep-21 £83.1bn Up £66.6bn 2020 £42.7bn Up £3.5bn 11-Nov-21 10-Dec-2132 Global Ranking: Goods exports N/A N/A N/A 2020 11th Down from 10th 08-Sep-21 TBC
Some of the statistics in these tables include data from January 2021; the first data to include trade after the EU transition period. Data from January 2021 has seen changes to data collectionmethods for exports of goods from GB to the EU, therefore caution is advised when interpreting the data. 7

# StatisticYear ending: Measure
Change on previous 12 months Year Measure
Change on previous year
Latest release
Next release
Trade in services
33 Services Exports[% of all exports] Sep-21 £285.6bn
[47.4%]Down 6.1%[Down 0.6 ppts] 2020 £292.3bn
[48.6%]Down 10.7%[Up 1.8 ppts] 11-Nov-21 10-Dec-21
34 Services Imports[% of all imports] Sep-21 £146.3bn
[23.4%]Down 16.9%[Down 5.8 ppts] 2020 £159.3bn
[26.7%]Down 24.1%[Down 2.4 ppts] 11-Nov-21 10-Dec-21
35 Services Total trade[% of total trade] Sep-21 £431.9bn
[35.2%]Down 10.0%[Down 3.6 ppts] 2020 £451.6bn
[37.7%]Down 15.9%[Down 0.1 ppts] 11-Nov-21 10-Dec-21
36 Trade in services surplus Sep-21 £139.3bn Up £11.4bn 2020 £133.0bn Up £15.5bn 11-Nov-21 10-Dec-21
37Services Exports to EU[% of all services exports]§ Q2 2021 £101.7bn
[35.9%]Down 12.8%[Down 0.8 ppts] 2020 £104.7bn
[35.8%]Down 14.4%[Down 1.6 ppts] 30-Sep-21 22-Dec-21
38Services Exports to Non-EU[% of all services exports]§
Q2 2021 £181.6bn [64.1%]
Down 9.9%[Up 0.8 ppts] 2020 £187.6bn
[64.2%]Down 8.5%[Up 1.6 ppts] 30-Sep-21 22-Dec-21
39Services Imports from EU[% of all services imports]§
Q2 2021 £58.4bn [39.7%]
Down 34.8%[Down 6.8 ppts] 2020 £68.1bn
[42.7%]Down 32.3%[Down 5.2 ppts] 30-Sep-21 22-Dec-21
40Services Imports from Non-EU[% of all services imports]§
Q2 2021 £88.7bn [60.3%]
Down 13.9%[Up 6.8 ppts] 2020 £91.2bn
[57.3%]Down 16.5%[Up 5.2 ppts] 30-Sep-21 22-Dec-21
41Services Total trade with EU[% of services total trade]§
Q2 2021 £160.2bn [37.2%]
Down 22.3%[Down 3.2 ppts] 2020 £172.8bn
[38.3%]Down 22.5%[Down 3.2 ppts] 30-Sep-21 22-Dec-21
42Services Total trade with Non-EU[% of services total trade]§
Q2 2021 £270.3bn [62.8%]
Down 11.2%[Up 3.2 ppts] 2020 £278.8bn
[61.7%]Down 11.3%[Up 3.2 ppts] 30-Sep-21 22-Dec-21
43 Services trade surplus with the EU Q2 2021 £43.3bn Up £16.3bn 2020 £36.6bn Up £14.8bn 30-Sep-21 22-Dec-2144 Services trade surplus with Non-EU Q2 2021 £92.8bn Down £5.6bn 2020 £96.4bn Up £0.7bn 30-Sep-21 22-Dec-2145 Global Ranking: Services Exports N/A N/A N/A 2020 2nd No change 08-Sep-21 TBC
Current Account46 Current Account deficit Q2 2021 £52.2bn Up £19.6bn 2020 £55.9bn Down £4.3bn 30-Sep-21 22-Dec-2147 Current Account deficit as % of GDP Q2 2021 2.3% Up 0.8 ppts 2020 2.6% Down 0.1 ppts 30-Sep-21 22-Dec-21
Some of the statistics in these tables include data from January 2021; the first data to include trade after the EU transition period. Data from January 2021 has seen changes to data collectionmethods for exports of goods from GB to the EU, therefore caution is advised when interpreting the data.§ To calculate % of services exports/imports/total trade, the figure from the same source as the numerator is used.
8

# StatisticYear ending: Measure
Change on previous 12 months Year Measure
Change on previous year
Latest release
Next release
Foreign Direct Investment48 Outward FDI stock** N/A N/A N/A 2019 £1,498.2bn Up 3.1% 21-Dec-20 Dec-2149 Inward FDI stock** N/A N/A N/A 2019 £1,558.6bn Down 0.9% 21-Dec-20 Dec-2150 Global Ranking: Outward FDI stock N/A N/A N/A 2020 4th No change 21-Jun-21 TBC51 Global Ranking: Inward FDI stock N/A N/A N/A 2020 3rd Down from 2nd 21-Jun-21 TBC52 European Ranking: Outward FDI stock N/A N/A N/A 2020 2nd No change 21-Jun-21 TBC53 European Ranking: Inward FDI stock N/A N/A N/A 2020 2nd Down from 1st 21-Jun-21 TBC
Number and proportion of UK businesses exporting
54Proportion of VAT-registered Businesses in the GB Non-Financial Economy exporting goods and/or servicesꝽ
N/A N/A N/A 2019 10.2% N/A 09-Aug-21 TBC
55Number of VAT-registered Businesses in the GB Non-Financial Economy exporting goods and/or servicesꝽ
N/A N/A N/A 2019 245,200 N/A 09-Aug-21 TBC
Ᵹ The 2019 survey experienced lower response rates (due to coronavirus) and therefore figures for 2019 should not be compared to previous years.
Responsible StatisticianFor further information or help with using these statistics please contact:James Liley (020 7215 6221)[email protected]
** Data on a 'directional' basis
9

10
Top and emerging partner countries, 2020 Top 10 UK export and import markets for goods and services1 in 2020, not
seasonally adjusted
Rank Export market £ billion % of total Rank Import market £ billion % of total
1 United States2 126.0 21.0% 1 United States2 74.8 12.5% 2 Germany 49.0 8.2% 2 Germany 66.1 11.1% 3 Ireland 39.0 6.5% 3 China 56.9 9.5% 4 Netherlands 35.2 5.8% 4 Netherlands 42.1 7.1% 5 France 31.1 5.2% 5 France 35.2 5.9% 6 China 25.9 4.3% 6 Belgium 25.3 4.2% 7 Switzerland 23.9 4.0% 7 Spain 22.1 3.7% 8 Belgium 15.1 2.5% 8 Italy 21.1 3.5% 9 Italy 14.3 2.4% 9 Ireland 21.0 3.5%
10 Spain 14.2 2.4% 10 Poland 13.4 2.3%
EU1 251.3 41.8% EU1 300.7 50.4% Non-EU1 349.7 58.2% Non-EU1 296.0 49.6% World1 601.0 100.0% World1 596.7 100.0%
Source: ONS UK trade, experimental quarterly trade in goods and services tables: April to June 2021, next release: ONS UK trade, experimental quarterly trade in goods and services tables: July to September 2021.
Top 10 UK export and import markets for goods only in 2020, seasonally
adjusted3,4
Rank Export market £ billion % of total Rank Import market £ billion % of total
1 United States2 46.0 14.9% 1 Germany 57.0 13.0% 2 Germany 32.5 10.5% 2 China 54.6 12.5% 3 Ireland 21.9 7.1% 3 United States2 37.3 8.5% 4 Netherlands 20.2 6.5% 4 Netherlands 36.4 8.3% 5 France 18.8 6.1% 5 France 24.4 5.6% 6 China 18.0 5.8% 6 Belgium 23.2 5.3% 7 Switzerland 12.1 3.9% 7 Italy 17.5 4.0% 8 Belgium 10.7 3.5% 8 Spain 15.0 3.4% 9 Italy 8.7 2.8% 9 Ireland 13.4 3.1%
10 Spain 8.1 2.6% 10 Norway 11.2 2.6%
EU 146.6 47.5% EU 232.6 53.2% Non-EU 162.1 52.5% Non-EU 204.8 46.8% World 308.7 100.0% World 437.4 100.0%
Source: ONS UK Trade: September 2021, next release: ONS UK Trade: October 2021.

11
Top 10 UK export and import markets for services only in 20201, not seasonally adjusted Rank Export market £ billion % of total Rank Import market £ billion % of total
1 United States2 80.1 27.4% 1 United States2 37.5 23.6% 2 Ireland 17.1 5.8% 2 France 10.8 6.8% 3 Germany 16.5 5.7% 3 Germany 9.1 5.7% 4 Netherlands 15.0 5.1% 4 Ireland 7.5 4.7% 5 France 12.3 4.2% 5 Spain 7.1 4.5% 6 Switzerland 11.8 4.0% 6 Netherlands 5.7 3.6% 7 China 8.0 2.7% 7 India 5.3 3.3% 8 Spain 6.1 2.1% 8 Japan 5.1 3.2% 9 Japan 6.0 2.0% 9 Switzerland 4.7 3.0%
10 Luxembourg 5.9 2.0% 10 Luxembourg 4.2 2.7%
EU1 104.7 35.8% EU1 68.1 42.7% Non-EU1 187.6 64.2% Non-EU1 91.2 57.3% World1 292.3 100.0% World1 159.3 100.0%
Source: ONS UK trade, experimental quarterly trade in goods and services tables: April to June 2021, next release: ONS UK trade, experimental quarterly trade in goods and services tables: July to September 2021.
Top 10 UK surpluses and deficits in goods and services1 in 2020, not
seasonally adjusted
Rank
Partner countries with largest surpluses
£ billion
Rank
Partner countries with largest deficits £ billion
1 United States2 51.3 1 China -30.9 2 Ireland 18.1 2 Germany -17.0 3 Switzerland 13.9 3 Belgium -10.2 4 Saudi Arabia 6.1 4 Spain -7.8 5 Australia 4.6 5 Netherlands -7.0 6 Canada 4.5 6 Italy -6.8 7 United Arab Emirates 4.3 7 Poland -6.6 8 Singapore 3.9 8 Norway -5.0 9 Cayman Islands 2.9 9 Russia -4.8
10 Gibraltar 2.3 10 India -4.3
Non-EU1 53.7 EU1 -49.4
Source: ONS UK trade, experimental quarterly trade in goods and services tables: April to June 2021, next release: ONS UK trade, experimental quarterly trade in goods and services tables: July to September 2021.
12
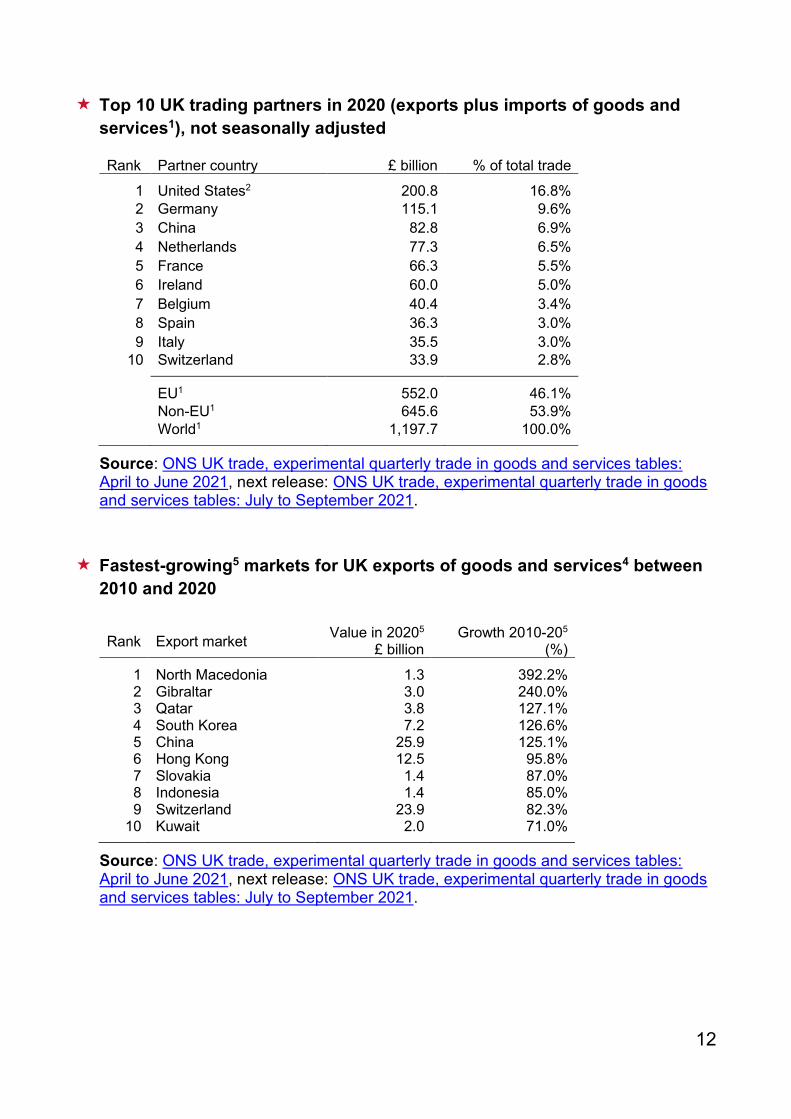
Top 10 UK trading partners in 2020 (exports plus imports of goods and services1), not seasonally adjusted
Rank Partner country £ billion % of total trade
1 United States2 200.8 16.8% 2 Germany 115.1 9.6% 3 China 82.8 6.9% 4 Netherlands 77.3 6.5% 5 France 66.3 5.5% 6 Ireland 60.0 5.0% 7 Belgium 40.4 3.4% 8 Spain 36.3 3.0% 9 Italy 35.5 3.0%
10 Switzerland 33.9 2.8%
EU1 552.0 46.1% Non-EU1 645.6 53.9% World1 1,197.7 100.0%
Source: ONS UK trade, experimental quarterly trade in goods and services tables: April to June 2021, next release: ONS UK trade, experimental quarterly trade in goods and services tables: July to September 2021.
Fastest-growing5 markets for UK exports of goods and services4 between
2010 and 2020 Rank Export market Value in 20205
£ billion Growth 2010-205
(%)
1 North Macedonia 1.3 392.2% 2 Gibraltar 3.0 240.0% 3 Qatar 3.8 127.1% 4 South Korea 7.2 126.6% 5 China 25.9 125.1% 6 Hong Kong 12.5 95.8% 7 Slovakia 1.4 87.0% 8 Indonesia 1.4 85.0% 9 Switzerland 23.9 82.3%
10 Kuwait 2.0 71.0%
Source: ONS UK trade, experimental quarterly trade in goods and services tables: April to June 2021, next release: ONS UK trade, experimental quarterly trade in goods and services tables: July to September 2021.

13
Table notes: 1. Totals in the tables above may not match the figures in the ‘Statistical summary sheet’ as
they may be based on non-seasonally adjusted data. Seasonally adjusted figures by partner country, consistent with the aggregate figures in the ‘Statistical summary sheet’, are not available.
2. United States includes Puerto Rico. 3. Trade in goods rankings are not comparable with trade in services (and goods) rankings.
For trade in goods data comparable with trade in services data see the ‘ONS UK trade, experimental quarterly trade in goods and services tables’ statistics release.
4. Data on trade in goods with Crown Dependencies (Jersey, Guernsey, Isle of Man) are not available. Trade in goods and services figures represent trade in services only except for fastest-growing markets data where these are excluded as their growth rates are not comparable with other markets.
5. Only including those with more than £1 billion in value in the latest calendar year for which data is available.

14
Top and fastest-growing goods and services, 2020 The table reporting the top five fastest growing UK exports of services from 2019 to 2020, with more than £5 billion in value in 2020, has been removed from this section, as only three service types have grown over this time period; telecommunication, computer and information services up 7.6% to £26.8 billion, insurance and pension services up 7.5% to £20.7 billion and other business services up 2.0% to £116.5 billion. This table will be reinstated once there is a top five to report. Top 10 UK goods exports in 2020, seasonally adjusted
Rank Commodity (SITC division) Division1 £ billion
% of total goods
exports
1 Cars 78M 21.5 7.0% 2 Medicinal and pharmaceutical products 54 21.0 6.9% 3 Mechanical power generators (intermediate) 71MI 20.3 6.6% 4 Crude oil 33O 17.0 5.5% 5 Non-ferrous metals 68 14.8 4.8% 6 Precious metals4 97 11.0 3.6% 7 Aircraft 792 10.2 3.3% 8 Organic chemicals 51 9.7 3.2% 9 Scientific instruments (capital) 87K 8.7 2.9%
10 Miscellaneous electrical goods (intermediate) 77I 8.1 2.6%
Total goods exports 308.7 100.0%
Source: ONS UK Trade: September 2021, next release: ONS UK Trade: October 2021.
Top 10 UK goods imports in 2020, seasonally adjusted
Rank Commodity (SITC division) Division1
£ billion
% of total goods
imports
1 Cars 78M 26.6 6.2% 2 Medicinal and pharmaceutical products 54 22.3 5.1% 3 Clothing 84 20.8 4.8% 4 Telecoms and sound equipment (capital) 76K 18.6 4.3% 5 Office machinery (capital) 75K 14.3 3.3% 6 Mechanical power generators (intermediate) 71MI 14.0 3.2% 7 Non-ferrous metals 68 13.8 3.2% 8 Miscellaneous electrical goods (intermediate) 77I 13.4 3.1% 9 Other manufactures (consumer) 89OC 13.1 3.0%
10 Crude oil 33O 12.3 2.8%
Total goods imports 437.4 100.0%
Source: ONS UK Trade: September 2021, next release: ONS UK Trade: October 2021.
15
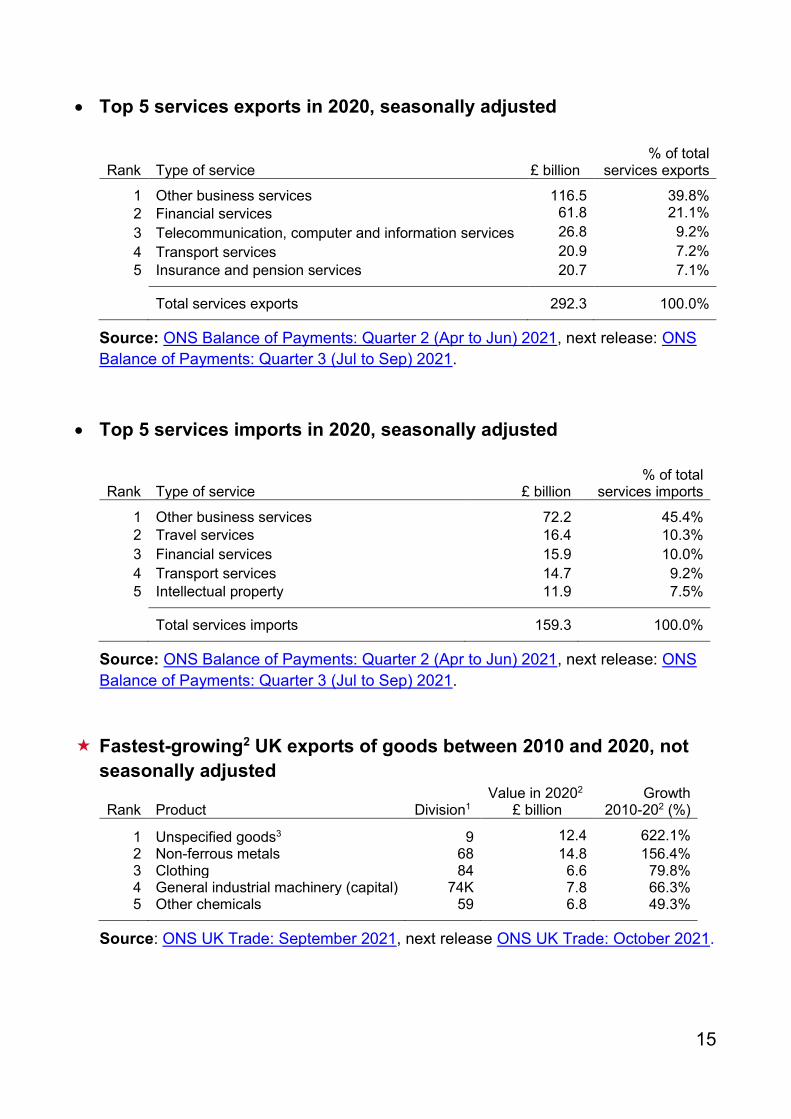
• Top 5 services exports in 2020, seasonally adjusted
Rank
Type of service
£ billion
% of total services exports
1 Other business services 116.5 39.8% 2 Financial services 61.8 21.1% 3 Telecommunication, computer and information services 26.8 9.2% 4 Transport services 20.9 7.2% 5 Insurance and pension services 20.7 7.1%
Total services exports 292.3 100.0%
Source: ONS Balance of Payments: Quarter 2 (Apr to Jun) 2021, next release: ONS Balance of Payments: Quarter 3 (Jul to Sep) 2021.
• Top 5 services imports in 2020, seasonally adjusted
Rank Type of service £ billion % of total
services imports
1 Other business services 72.2 45.4% 2 Travel services 16.4 10.3% 3 Financial services 15.9 10.0% 4 Transport services 14.7 9.2% 5 Intellectual property 11.9 7.5%
Total services imports 159.3 100.0%
Source: ONS Balance of Payments: Quarter 2 (Apr to Jun) 2021, next release: ONS Balance of Payments: Quarter 3 (Jul to Sep) 2021.
Fastest-growing2 UK exports of goods between 2010 and 2020, not
seasonally adjusted
Rank Product
Division1 Value in 20202
£ billion Growth
2010-202 (%)
1 Unspecified goods3 9 12.4 622.1% 2 Non-ferrous metals 68 14.8 156.4% 3 Clothing 84 6.6 79.8% 4 General industrial machinery (capital) 74K 7.8 66.3% 5 Other chemicals 59 6.8 49.3%
Source: ONS UK Trade: September 2021, next release ONS UK Trade: October 2021.

16
Table notes:
1. Divisions as reported by ONS, derived from Standard International Trade Classifications (SITC).
2. Only including those with more than £5 billion in value in the latest calendar year for which data is available.
3. Unspecified goods include precious metals, parcel post, low value trade, coins, and defence equipment.
4. Precious metals includes non-monetary gold, silver, platinum and palladium, and it forms part of the commodity group “unspecified goods”. Non-monetary gold comprises the majority of this group.

17
Trade statistics Exports
Total (goods and services) exports
The value of UK exports was £601.0 billion in 2020, down 14.1% on 2019. This reflects decreases in goods and services exports of 17.0% and 10.7%, respectively. More timely data shows the value of UK exports was £602.5 billion in the 12 months ending September 2021, down 4.8% on the previous 12 months. (Source: ONS UK Trade: September 2021, next release: ONS UK Trade: October 2021).
The 14.1% decrease in exports in 2020 followed a 5.4% increase in
2019 and a 5.3% increase in 2018. The decrease of 4.8% in exports in the 12 months ending September 2021 followed a decrease of 7.3% in the 12 months ending September 2020 and a 4.8% increase in the 12 months ending September 2019 (Source: ONS UK Trade: September 2021, next release: ONS UK Trade: October 2021).
Between 2010 and 2020, exports have increased by 32.2% (around 3.1% per year on average) driven by an increase in services exports of 54.8%. Over the same period, goods exports have increased by 16.2%

18
(Source: ONS UK Trade: September 2021, next release: ONS UK Trade: October 2021).
• The relative importance of the EU as an export market has declined over the last decade. In 2020, the share of UK exports going to the EU was 41.8% compared to 47.3% in 2010 (Source: ONS Balance of Payments: Quarter 2 (Apr to Jun) 2021, next release: ONS Balance of Payments: Quarter 3 (Jul to Sep) 2021).
• Between 2019 and 2020, exports to the Non-EU decreased by 13.9% to £349.7 billion, while exports to the EU decreased by 14.3% to £251.3 billion. More timely data shows the value of exports to the Non-EU was £342.1 billion in the 12 months ending June 2021, down 13.8% on the previous 12 months while exports to the EU decreased by 6.9% to £251.9 billion. (Source: ONS Balance of Payments: Quarter 2 (Apr to Jun) 2021, next release: ONS Balance of Payments: Quarter 3 (Jul to Sep) 2021).
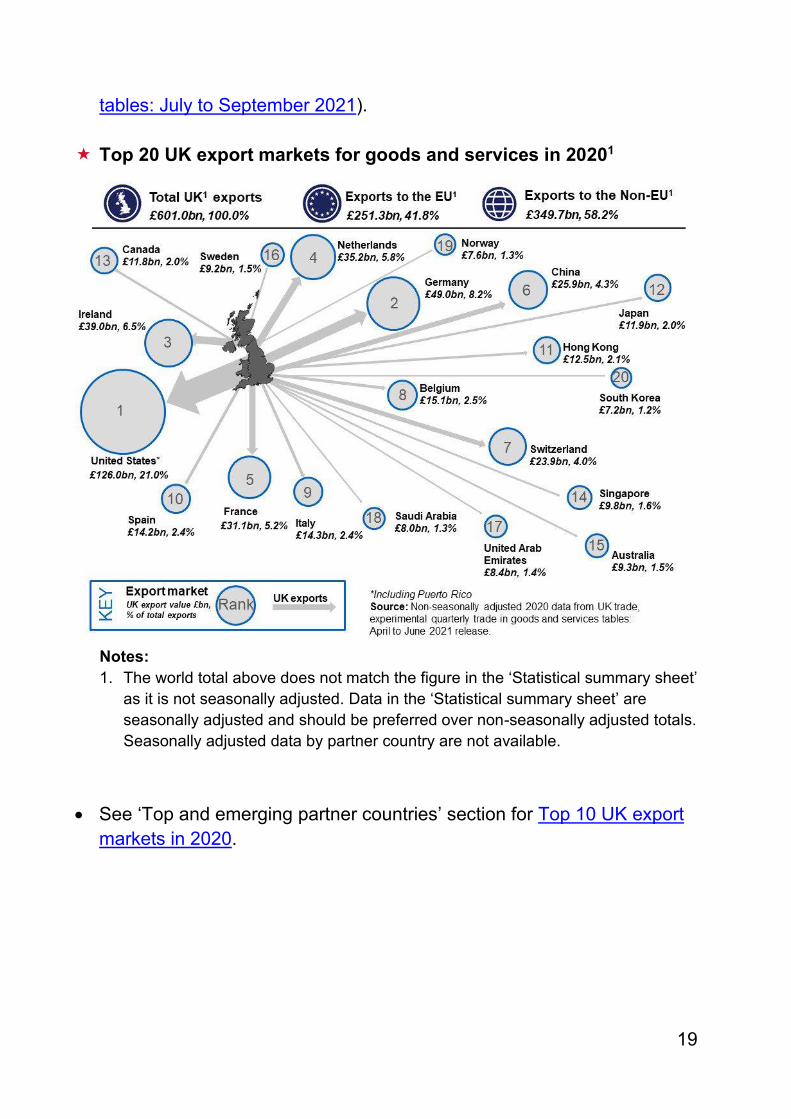
The UK’s largest export market in 2020 was the United States
(including Puerto Rico), accounting for around a fifth, 21.0%, of total UK exports, followed by Germany (8.2%), Ireland (6.5%), and the Netherlands (5.8%). (Source: ONS UK trade, experimental quarterly trade in goods and services tables: April to June 2021, next release: ONS UK trade, experimental quarterly trade in goods and services
19
tables: July to September 2021).
Top 20 UK export markets for goods and services in 20201
Notes: 1. The world total above does not match the figure in the ‘Statistical summary sheet’
as it is not seasonally adjusted. Data in the ‘Statistical summary sheet’ are seasonally adjusted and should be preferred over non-seasonally adjusted totals. Seasonally adjusted data by partner country are not available.
• See ‘Top and emerging partner countries’ section for Top 10 UK export markets in 2020.

20
Top 10 UK export markets (for goods and services) in year ending June 2021, not seasonally adjusted1
Rank Export market £ billion % of total exports
1 United States2 126.2 21.2% 2 Germany 47.2 7.9% 3 Ireland 39.7 6.7% 4 Netherlands 36.5 6.1% 5 France 30.5 5.1% 6 China 25.7 4.3% 7 Belgium 18.5 3.1% 8 Switzerland 18.2 3.1% 9 Italy 14.4 2.4%
10 Spain 13.2 2.2%
EU1 251.8 42.4% Non-EU1 342.2 57.6% World1 594.0 100.0%
Source: ONS UK trade, experimental quarterly trade in goods and services tables: April to June 2021, next release: ONS UK trade, experimental quarterly trade in goods and services tables: July to September 2021.
Notes:
1. Totals in the tables above do not match the figures in the ‘Statistical summary sheet’ as they are not seasonally adjusted. Data in the ‘Statistical summary sheet’ are seasonally adjusted and should be preferred over non-seasonally adjusted totals. Seasonally adjusted data by partner country are not available.
2. United States includes Puerto Rico. Exports were equivalent to 27.9% of UK GDP in 2020, down from
31.0% in 2019. In the 12 months ending September 2021 exports were equivalent to 26.4% of UK GDP, down from 29.2% in the 12 months ending September 2020. (Sources: ONS UK Trade: September 2021 and GDP first quarterly estimate, UK: July to September 2021, next releases: ONS UK Trade: October 2021 and GDP quarterly national accounts, UK: July to September 2021).
• Global export rankings - In 2020* the UK ranked:
o 6th in the world for exports of goods and services (no change from 2019).
o 3rd in Europe for exports of goods and services, behind Germany and France (no change from 2019).
o 11th in the world for goods exports (down from 10th place in 2019).

21
o 2nd in the world for services exports (no change from 2019).
Source: UNCTADT, next release: UNCTAD.
* Much of the 2020 data on which these rankings are based are modelled/estimated. • Current estimates and forecasts of real export growth: In real terms, UK exports decreased by 14.7% in 2020, following
growth of 3.4% in 2019. The decreases in 2020 consisted of a decrease in services exports (down 15.2%) and in goods exports (down 14.3%). Comparing the 12 months ending September 2021 with the previous 12 months, UK exports decreased by 7.6%, following a decrease of 7.6% on the same basis in the 12 months ending September 2020. (Source: ONS UK Trade: September 2021, next release: ONS UK Trade: October 2021).
• The IMF forecasts the volume of UK exports of goods and services to
grow at 0.4% in 2021, and then grow at 8.7% in 2022. (Source: IMF World Economic Outlook - October 2021).
• The OECD predicts that the volume of UK exports of goods and
services are expected to grow by 1.2% in 2021, and by 4.7% in 2022. This is an increase from the forecast in December 2020 release, where the volume of UK exports was forecast to fall by -1.1% in 2021 and grow by 0.1% in 2022. (Source: OECD Economic Outlook - May

22
2021).
• UK export volume growth forecasts (%) 2021 2022 International Monetary Fund (goods and services) 0.4 8.7 OECD1 (goods and services) 1.2 4.7 Source: IMF World Economic Outlook - October 2021 and OECD Economic Outlook - May 2021
1. OECD forecast uses 2018 prices.
• For further forecasts on global trade, see the World trade forecast section.

23
• Number and % of registered GB businesses exporting
(Source: ONS Non-financial business economy, exporters and importers in Great Britain (Annual Business Survey): 2019, next release: ONS Non-financial business economy, exporters and importers in Great Britain (Annual Business Survey): 2020):
o In 2019, 245,200 registered Great Britain businesses (10.2%) exported either goods or services or both.
o 99% of GB exporting businesses were SMEs.
o 119,600 registered GB businesses (5.0%) are estimated to have exported goods.
o 156,200 registered GB businesses (6.5%) are estimated to have exported services.
o Responses for 2019 Annual Business Survey (ABS) were collected during 2020 at the height of the Coronavirus pandemic in the UK. This impacted the number of responses received - a response rate of approximately 53% of businesses in the sample, compared to 78% in the previous year. This lower response rate increases the level of uncertainty around these estimates, and it is therefore strongly recommended that figures for 2019 should not be compared to figures from previous years and should instead be treated as a point in time survey.
o These estimates do not cover all businesses. They only cover registered businesses (for Value Added Tax (VAT) and/or PAYE) in the GB non-financial business economy which accounts for around two-thirds of the economy in terms of gross value added.
o HMRC publish the UK trade in goods by business characteristics which provides numbers of UK businesses exporting and importing goods. The HMRC data is not comparable to the ABS data due to differences in coverage and methodology.
o Other sources also estimate the number or proportion of businesses which export (e.g. HMRC Regional Trade Statistics) but they differ in their methodology and coverage and are not directly comparable with the ABS.

24
• Summary of Annual Business Survey (ABS) 2019 results Number and proportion of registered GB businesses
Exporting % Importing %
Exporting and/or
importing % Goods and/or Services 245,200 10.2% 238,600 10.0% 341,900 14.3% Goods 119,600 5.0% 165,900 6.9% 202,500 8.5% Services 156,200 6.5% 108,600 4.5% 195,500 8.2%
Source: ONS Non-financial business economy, exporters and importers in Great Britain (Annual Business Survey): 2019, next release: ONS Non-financial business economy, exporters and importers in Great Britain (Annual Business Survey): 2020.
Notes: 1. The data for 2019 are based on a response rate of 53% of businesses in the
sample, compared to 78% for 2018. This increases the level of uncertainty around the estimates, as certain groups in the sample do not have the degree of representation required. It is strongly recommended that users consult the standard errors and confidence intervals available in the ONS dataset. These are provided to illustrate the level of uncertainty within the estimates.
2. Data are for VAT/PAYE registered enterprises in Great Britain only (excludes Northern Ireland). The data exclude much of finance, agriculture and government.
3. Goods and services do not add up to the total for goods and services combined. This is because some businesses will trade in both goods and services. In the same way the number of exporters and importers may not add up to the total number involved in international trade because some businesses will both export and import.
4. These estimates cover the Great Britain business economy, excluding Insurance and Reinsurance industries, which accounts for just under two thirds of the economy in terms of Gross Value Added. The industries covered are:
o Agriculture (support activities SIC 01.6 and hunting and trapping SIC 01.7 only), forestry and fishing (Section A)
o Production industries (Sections B-E) o Construction industries (Section F) o Distribution industries (Section G) o Non-Financial Service industries (Sections H-J, L-N, P (private provision
only), Q (private provision only in SIC 86.1 and 86.9), R and S.

25
• Attitudes of UK businesses to exporting in 2020 (Source: National Survey of Registered Businesses’ Exporting Behaviours, Attitudes and Needs 2020, next release: National Survey of Registered Businesses’ Exporting Behaviours, Attitudes and Needs 2021):
o The primary focus of the NSRB is on businesses with an annual turnover of £500,000 or more on the premise that they can potentially generate high value exports. In 2020, a total of 3,000 responses were collected from businesses across three points in the year.
o The NSRB results vary from those in ONS surveys such as the Annual Business Survey and the fortnightly Business insights and impact on the UK economy (BICS) due to a differing methodological approach and survey objectives. All differences are explained in the NSRB report.
o The NSRB allocates businesses into four segments that reflect their exporting behaviour. In 2020, the proportions of businesses falling into each segment were similar to previous waves. In 2020: o a third of businesses (34%) had exported either goods or services in
the past 12 months, o 6% were either lapsed or intermittent exporters, who had not exported in
the past 12 months but had done previously, o 15% were in the Promote segment. They had never exported but had
goods or services either suitable for export or could be developed for export,
o 44% were in the Challenge segment. They had never exported and do not see their goods or services as suitable for export.
o Respondents were asked about the impact of the coronavirus pandemic on business. Two thirds reported a negative impact and around half expected an impact lasting at least 6 months. 4 in 10 exporters experienced supply chain issues in the wake of the pandemic, where small businesses with up to 19 employees were more likely to report problems.
o Despite the coronavirus pandemic and uncertainty around EU exit, almost half of businesses reported their exports had remained the same over the last year (47% goods, 48% services). In total, 27% of businesses who had exported in the last 12 months reported a

26
reduction in exports. The main reason given for this was reduced demand (42%) with 1 in 10 mentioning the EU Exit.
o In 2020, 17% of businesses had exported only goods in the last 12 months, 10% had exported only services and 7% had exported both goods and services.
o Businesses in Northern Ireland (51%) and London (45%) were most likely to be current exporters. Those in Scotland (23%) were more likely than average to fall into the promote segment, while those in Wales were more likely to be in the challenge segment (54%).
o The proportion of businesses planning to grow their business has fallen from three quarters to two thirds since 2018. Additionally, there has been a decline in business innovation since 2018, with 46% introducing new or improved products in 2020 compared with 53% in 2018.
o Among exporters and potential exporters, around a third cited cost and access to contacts, customers and networks as strong barriers to exporting (33% and 31% respectively).
o Three quarters of businesses reported a high or moderate level of knowledge about how to export. This is consistent with 2018, although since 2015 the proportion rating their knowledge as high has decreased.
o Agreement that there is a lot of demand for British products or services around the world declined in 2020, with almost 2 in 3 (63%) in agreement, down from 2018 (71%).

27
Goods exports
Exports of goods were £308.7 billion in 2020, representing 51.4% of total UK exports. More timely data shows the value of UK goods exports was £317.0 billion in the 12 months ending September 2021, representing 52.6% of total UK exports (Source: ONS UK Trade: September 2021, next release: ONS UK Trade: October 2021).
Goods exports decreased by 17.0% in 2020, compared to 2019.
Since 2010, goods exports have increased by 16.2%. More recent data shows that goods exports decreased by 3.7% in the 12 months ending September 2021, following a decrease of 8.3% in the 12 months ending September 2020 and a 3.0% increase in the 12 months ending September 2019. (Source: ONS UK Trade: September 2021, next release: ONS UK Trade: October 2021).
Exports of goods to the EU decreased by 14.1% in 2020, and exports
of goods to the Non-EU decreased by 19.5%. This follows a decrease in 2019 of 1.1% to the EU and a decrease of 12.9% to the Non-EU. More timely data shows that goods exports to the EU increased by 4.7% in the 12 months ending September 2021, and to the Non-EU decreased by 10.6%. (Source: ONS UK Trade: September 2021, next release:

28
ONS UK Trade: October 2021).
In 2020 the UK’s largest export market for goods was the United States (including Puerto Rico), accounting for 14.9% of total UK goods exports, followed by Germany (10.5%) and Ireland (7.1%). (Seasonally adjusted, Source: ONS UK Trade: September 2021, next release: ONS UK Trade: October 2021).
• See ‘Top and emerging partner countries’ section for Top 10 UK export markets for goods in 2020.
Top 10 export markets1 for goods in the year ending September 20213, seasonally adjusted
Rank Export market £ billion % of total exports
1 United States2 47.3 14.9% 2 Germany 30.7 9.7% 3 Netherlands 25.4 8.0% 4 Ireland 22.7 7.2% 5 France 19.0 6.0% 6 China 18.1 5.7% 7 Belgium 14.8 4.7% 8 Italy 9.3 2.9% 9 Spain 7.8 2.5%
10 Hong Kong 7.6 2.4%
EU 154.3 48.7% Non-EU 162.7 51.3% World 317.0 100.0%
Source: ONS UK Trade: September 2021, next release: ONS UK Trade: October 2021. Notes: 1. Data on trade in goods with Crown Dependencies (Jersey, Guernsey, Isle of
Man) are not available. 2. United States includes Puerto Rico. 3. This table includes data from January 2021; the first data to include trade in
goods after the EU transition period ended on 31 December 2020. Data may have been affected by disruption caused by the end of the transition period and has seen changes to data collection methods for exports of goods from GB to the EU. There have been no changes to data collection methods for goods imports.
29
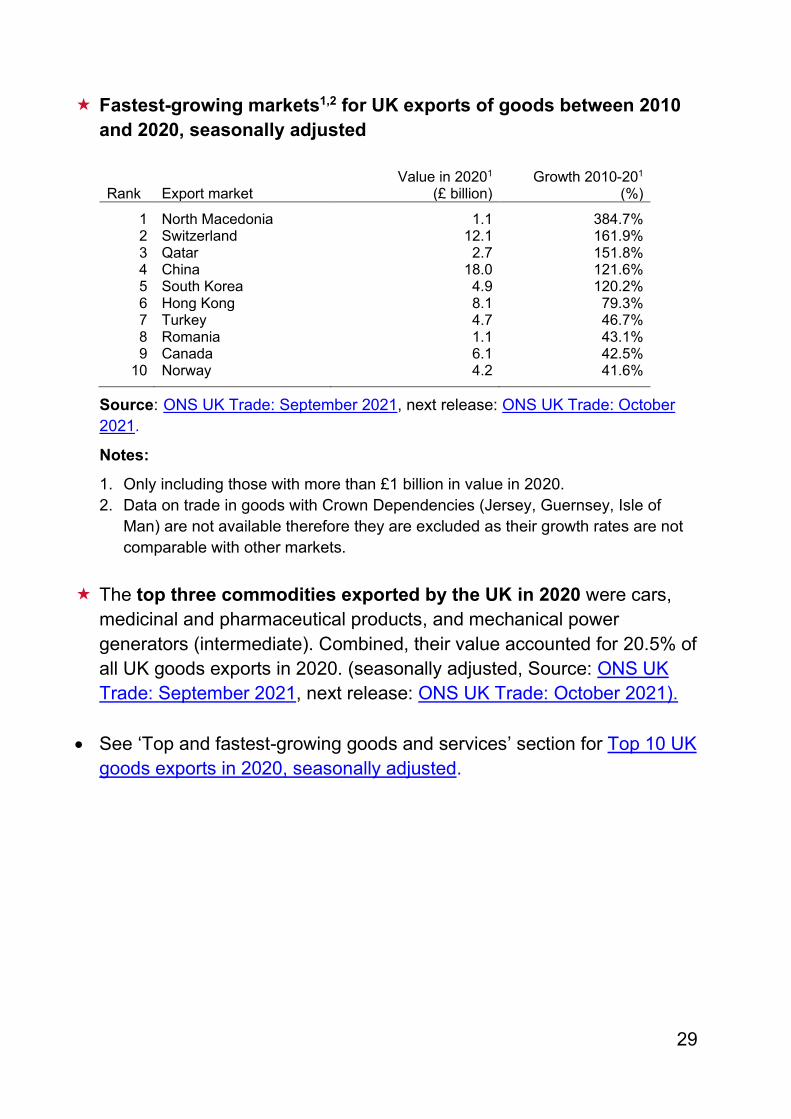
Fastest-growing markets1,2 for UK exports of goods between 2010 and 2020, seasonally adjusted
Rank Export market Value in 20201
(£ billion) Growth 2010-201
(%)
1 North Macedonia 1.1 384.7% 2 Switzerland 12.1 161.9% 3 Qatar 2.7 151.8% 4 China 18.0 121.6% 5 South Korea 4.9 120.2% 6 Hong Kong 8.1 79.3% 7 Turkey 4.7 46.7% 8 Romania 1.1 43.1% 9 Canada 6.1 42.5%
10 Norway 4.2 41.6%
Source: ONS UK Trade: September 2021, next release: ONS UK Trade: October 2021.
Notes:
1. Only including those with more than £1 billion in value in 2020. 2. Data on trade in goods with Crown Dependencies (Jersey, Guernsey, Isle of
Man) are not available therefore they are excluded as their growth rates are not comparable with other markets.
The top three commodities exported by the UK in 2020 were cars, medicinal and pharmaceutical products, and mechanical power generators (intermediate). Combined, their value accounted for 20.5% of all UK goods exports in 2020. (seasonally adjusted, Source: ONS UK Trade: September 2021, next release: ONS UK Trade: October 2021).
• See ‘Top and fastest-growing goods and services’ section for Top 10 UK goods exports in 2020, seasonally adjusted.

30
Top 10 UK goods exports in the year ending September 20214, not seasonally adjusted1
Rank Commodity (SITC division) Division2 Value
(£ billion) % of total
goods exports 1 Cars 78M 25.2 8.0% 2 Medicinal and pharmaceutical products 54 22.1 7.0% 3 Mechanical power generators (intermediate) 71MI 19.7 6.3% 4 Non-ferrous metals 68 16.9 5.4% 5 Crude oil 33O 15.4 4.9% 6 Scientific instruments (capital) 87K 10.0 3.2% 7 Aircraft 792 10.0 3.2% 8 Refined oil 33R 8.8 2.8% 9 Miscellaneous electrical goods (intermediate) 77I 8.6 2.7%
10 General industrial machinery (capital) 74K 8.4 2.7%
Total goods exports1 315.4 100.0%
Source: ONS UK Trade: September 2021, next release: ONS UK Trade: October 2021.
Notes:
1. Totals in the table above do not match the figures in the ‘Statistical summary sheet’ as they are not seasonally adjusted. Data in the ‘Statistical summary sheet’ are seasonally adjusted and should be preferred over non-seasonally adjusted totals. Seasonally adjusted goods exports data by commodity are not available.
2. Divisions as reported by ONS, derived from Standard International Trade Classifications (SITC).
3. Unspecified goods include precious metals, parcel post, low value trade, coins, and defence equipment.
4. This table includes data from January 2021; the first data to include trade in goods after the EU transition period ended on 31 December 2020. Data may have been affected by disruption caused by the end of the transition period and has seen changes to data collection methods for exports of goods from GB to the EU. There have been no changes to data collection methods for goods imports.
• Of all the English regions, London and the South East had the highest number of goods exporters and exported the highest values of goods in 2020. The North East was the English region with the lowest number of goods exporters and exported the lowest value of goods, however the average value of exports per exporter was higher than in any other region (Source: HMRC Regional Trade Statistics: Q2 (Apr - Jun) 2021, next release: HMRC Regional Trade Statistics: Q3 (Jul - Sep) 2021).

31
• Number of goods exporters and export value by region in 2020, not
seasonally adjusted1
Country/region4 Goods exports
(£ billion)
Number of goods
exporters3 United Kingdom1 290.6 149,443 North East 11.6 2,662 North West 24.3 13,639 Yorkshire and The Humber 14.6 9,247 East Midlands 20.7 9,951 West Midlands 24.6 11,729 East of England 26.7 13,777 London 35.0 26,191 South East 37.0 25,454 South West 17.9 10,658
England 212.4 123,307 Wales 13.5 3,615 Scotland 26.6 6,498 Northern Ireland 7.9 7,540 Unallocated2 30.2 8,483
Source: HMRC Regional Trade Statistics: Q2 (Apr - Jun) 2021, next release: HMRC Regional Trade Statistics: Q3 (Jul - Sep) 2021).
Notes:
1. Values differ from those reported by the ONS due to differences in methodology. The totals reported for the United Kingdom in ONS releases are compiled on a change of economic ownership basis and should be preferred over the United Kingdom total above from HMRC, which is compiled on a physical movement basis.
2. 'Unallocated’ refers to trade that cannot be allocated to UK regions. 3. Data on number of exporters are compiled on a 'proportion' basis; i.e. the
business' trade is allocated to a region based on the proportion of its employees in that region rather than where the Head Office of the business is located.
4. Export values for each region may not sum to country totals due to rounding.
32
Services exports
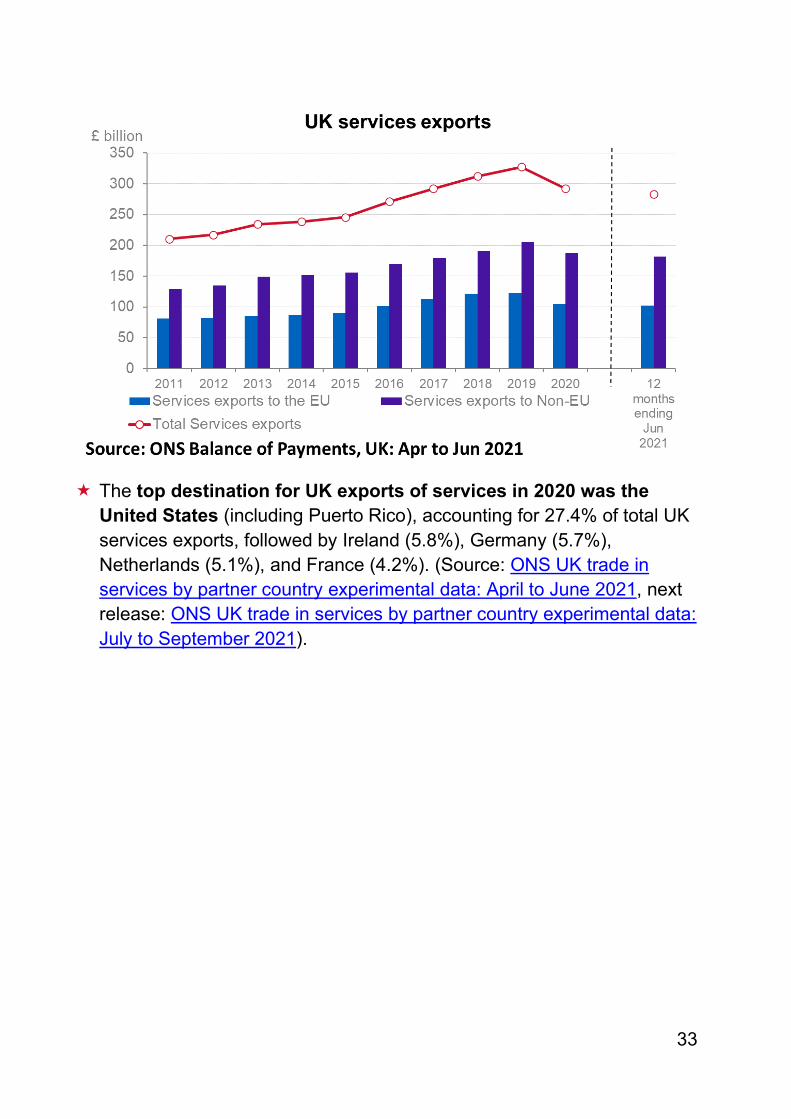
In 2020, UK exports of services were £292.3 billion, representing 48.6% of total UK exports. More timely data shows the value of UK services exports was £285.6 billion in the 12 months ending September 2021, representing 47.4% of total UK exports. (Source: ONS UK Trade: September 2021, next release: ONS UK Trade: October 2021).
Services exports in 2020 have increased by 54.8% since 2010 and
decreased by 10.7% since 2019. In the 12 months ending September 2021 services exports have decreased by 6.1%, following a decrease of 6.2% in the year to end September 2020 and a 6.9% increase in the 12 months ending September 2019. (Source: ONS UK Trade: September 2021, next release: ONS UK Trade: October 2021).
• Exports of services to the Non-EU decreased by 8.5% to £187.6
billion between 2019 and 2020, while exports of services to the EU decreased by 14.4% to £104.7 billion. This follows an increase in 2019 of 7.3% and an increase of 0.8% respectively. Between the 12 months ending June 2021 and the same period 12 months prior, services exports to the Non-EU decreased by 9.9% to £181.6 billion, while services exports to the EU decreased by 12.8% to £101.7 billion. (Source: ONS Balance of Payments: Quarter 2 (Apr to Jun) 2021, next release: ONS Balance of Payments: Quarter 3 (Jul to Sep) 2021).
33
The top destination for UK exports of services in 2020 was the United States (including Puerto Rico), accounting for 27.4% of total UK services exports, followed by Ireland (5.8%), Germany (5.7%), Netherlands (5.1%), and France (4.2%). (Source: ONS UK trade in services by partner country experimental data: April to June 2021, next release: ONS UK trade in services by partner country experimental data: July to September 2021).

34
• See ‘Top and emerging partner countries’ section for Top 10 UK export markets for services in 2020.
Top 10 export markets for services in year ending June 2021, not seasonally adjusted1
Rank Export market £ billion % of total exports
1 United States2 79.8 28.0% 2 Ireland 17.4 6.1% 3 Germany 16.0 5.6% 4 Netherlands 14.4 5.0% 5 France 11.6 4.1% 6 Switzerland 11.4 4.0% 7 China 7.4 2.6% 8 Luxembourg 6.3 2.2% 9 Japan 5.7 2.0%
10 Spain 5.6 2.0%
EU1 101.9 35.8% Non-EU1 183.0 64.2% World1 284.9 100.0%
Source: UK trade in services by partner country experimental data: April to June 2021 next release: UK trade in services by partner country experimental data: July to September 2021.
Notes: 1. Totals in the tables above may not match the figures in the ‘Statistical summary
sheet’ as they may be based on older data. More up-to-date figures by partner country, consistent with the aggregate figures in the ‘Statistical summary sheet’, are not available.
2. United States includes Puerto Rico.
35
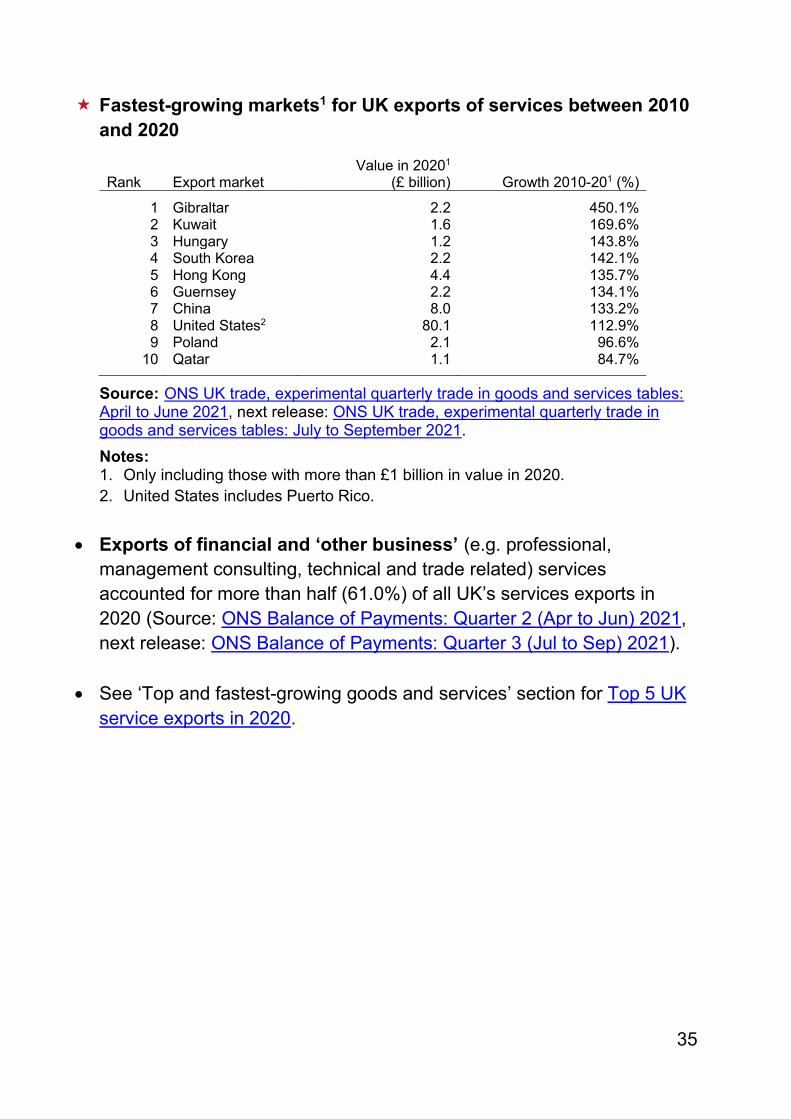
Fastest-growing markets1 for UK exports of services between 2010 and 2020
Rank Export market Value in 20201
(£ billion) Growth 2010-201 (%)
1 Gibraltar 2.2 450.1% 2 Kuwait 1.6 169.6% 3 Hungary 1.2 143.8% 4 South Korea 2.2 142.1% 5 Hong Kong 4.4 135.7% 6 Guernsey 2.2 134.1% 7 China 8.0 133.2% 8 United States2 80.1 112.9% 9 Poland 2.1 96.6%
10 Qatar 1.1 84.7%
Source: ONS UK trade, experimental quarterly trade in goods and services tables: April to June 2021, next release: ONS UK trade, experimental quarterly trade in goods and services tables: July to September 2021. Notes: 1. Only including those with more than £1 billion in value in 2020. 2. United States includes Puerto Rico.
• Exports of financial and ‘other business’ (e.g. professional,
management consulting, technical and trade related) services accounted for more than half (61.0%) of all UK’s services exports in 2020 (Source: ONS Balance of Payments: Quarter 2 (Apr to Jun) 2021, next release: ONS Balance of Payments: Quarter 3 (Jul to Sep) 2021).
• See ‘Top and fastest-growing goods and services’ section for Top 5 UK
service exports in 2020.

36
• Top 5 services exports in the year to June 2021, seasonally adjusted Rank
Type of service
£ billion
% of total services exports
1 Other business services 117.3 41.4% 2 Financial services 57.7 20.4% 3 Telecommunication, computer and information 26.2 9.3% 4 Insurance and pension services 21.5 7.6% 5 Transport services 19.4 6.9%
Total services exports 283.3 100.0%
Source: ONS Balance of Payments: Quarter 2 (Apr to Jun) 2021, next release: ONS Balance of Payments: Quarter 3 (Jul to Sep) 2021.
In 2019, London and the South East were responsible for around
58.9% of total UK services exports (Source: ONS International trade in UK nations, regions and cities: 2019, next release: ONS International trade in UK nations, regions and cities: 2020.

37
Value of services exports from the UK by country/region, 20191,2
Country/region4 Services exports
(£ billion) Share (%) United Kingdom 316.3 100.0% North East 6.2 2.0% North West 21.6 6.8% Yorkshire and The Humber 12.1 3.8% East Midlands 8.2 2.6% West Midlands 15.2 4.8% East of England 18.9 6.0% London 137.5 43.5% South East 48.7 15.4% South West 14.1 4.5%
England3 282.5 89.3% Wales 6.7 2.1% Scotland 24.1 7.6% Northern Ireland 3.1 1.0%
Source: ONS International trade in UK nations, regions and cities: 2019, next release: ONS International trade in UK nations, regions and cities: 2020. Notes: 1. These are experimental statistics. 2. Export figures for the United Kingdom may differ from other published figures due
to revisions. 3. England is the sum of all English regions as calculated by DIT. 4. Export values for each region may not sum to country totals due to rounding.
• In 2019, London and the South East had the highest number of services
exporters, nearly half of the total for Great Britain (48.6%). The North East and Wales had the fewest services exporters of all English regions and GB nations. (Source: ONS Non-financial business economy, exporters and importers in Great Britain (Annual Business Survey): 2019, next release: ONS Non-financial business economy, exporters and importers in Great Britain (Annual Business Survey): 2020):

38
• Number of services exporters1 in Great Britain 20193
Country/region2 Number of services
exporters Share (%) Great Britain 156,200 100.0%
North East 2,300 1.5% North West 17,000 10.9% Yorkshire and The Humber 3,500 2.2% East Midlands 6,800 4.3% West Midlands 6,900 4.4% East of England 19,900 12.7% London 43,200 27.6% South East 32,700 21.0% South West 13,800 8.9%
England 146,200 93.5% Wales 2,400 1.5% Scotland 7,700 4.9%
Source: ONS Non-financial business economy, exporters and importers in Great Britain (Annual Business Survey): 2019, next release: ONS Non-financial business economy, exporters and importers in Great Britain (Annual Business Survey): 2020). Notes: 1. These are experimental statistics. Estimates do not cover all businesses. They
only cover registered businesses (for VAT/PAYE) in Great Britain non-financial economy (i.e. largely exclude financial, agriculture and government activities).
2. The number of services exporters may not sum to country totals due to rounding. 3. Data for 2019 are based on a response rate of 53% of businesses in the sample,
compared to 78% for 2018. This increases the level of uncertainty around the estimates, as certain groups in the sample do not have the degree of representation required. It is strongly recommended that figures for 2019 are not compared to figures from previous years.

39
Imports
Total (goods and services) imports
The value of total UK imports was £596.7 billion in 2020, up 23.1% on 2010 and down 17.1% on 2019. More timely data shows the value of UK imports was £625.4 billion in the 12 months ending September 2021, up 3.6% on the previous 12 months. (Source: ONS UK Trade: September 2021, next release: ONS UK Trade: October 2021).
• Import growth between 2010-2020 has been driven by a 24.5%
increase in imports from the Non-EU. Over the same period, imports from the EU increased by 21.8%. (Source: ONS Balance of Payments: Quarter 2 (Apr to Jun) 2021, next release: ONS Balance of Payments: Quarter 3 (Jul to Sep) 2021).
• Between 2019 and 2020, imports from the Non-EU decreased by 15.3% to £296.0 billion while imports from the EU decreased by 18.8% to £300.7 billion. (Source: ONS Balance of Payments: Quarter 2 (Apr to Jun) 2021, next release: ONS Balance of Payments: Quarter 3 (Jul to Sep) 2021).

40
UK imports were equivalent to 27.7% of GDP in 2020, down from 31.9% in 2019. In the 12 months ending September 2021 imports were equivalent to 27.4% of UK GDP, down from 27.8% on the same period 12 months prior. (Sources: ONS UK Trade: September 2021, and GDP first quarterly estimate, UK: July to September 2021, next release: ONS UK Trade: October 2021 and GDP quarterly national accounts, UK: July to September 2021).
• In 2020, the share of UK imports coming from the EU was 50.4%, down from 58.1% peak in 2002. In the 12 months ending June 2021, the share of UK imports coming from the EU was 47.7%. (Source: ONS Balance of Payments: Quarter 2 (Apr to Jun) 2021, next release: ONS Balance of Payments: Quarter 3 (Jul to Sep) 2021).
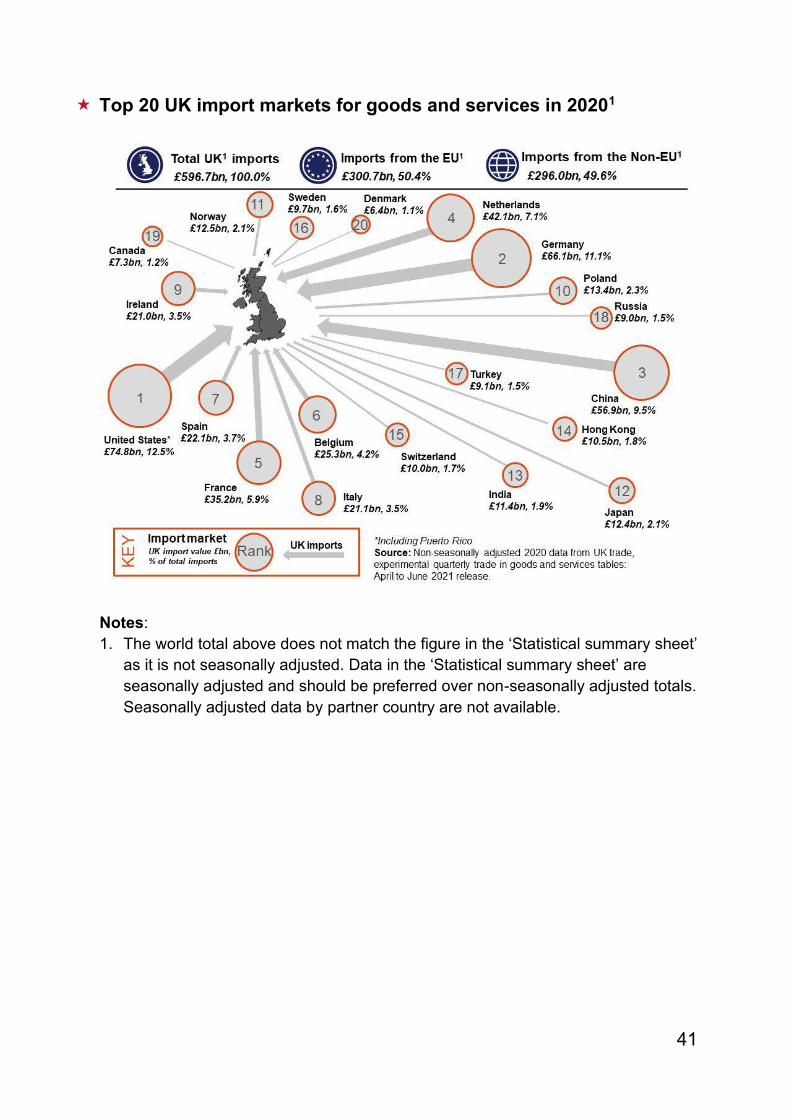
The UK’s largest import market in 2020 was the United States, accounting for 12.5% of total UK imports, followed by Germany (11.1%), China (9.5%) and Netherlands (7.1%). (Source: ONS UK trade, experimental quarterly trade in goods and services tables: April to June 2021, next release: ONS UK trade, experimental quarterly trade in goods and services tables: July to September 2021).
41
Top 20 UK import markets for goods and services in 20201
Notes: 1. The world total above does not match the figure in the ‘Statistical summary sheet’
as it is not seasonally adjusted. Data in the ‘Statistical summary sheet’ are seasonally adjusted and should be preferred over non-seasonally adjusted totals. Seasonally adjusted data by partner country are not available.

42
• See ‘Top and emerging partner countries’ section for Top 10 UK import markets in 2020.
Top 10 UK import markets in year ending June 2021, not seasonally adjusted1
Rank Import market £ billion % of total imports 1 United States2 74.9 12.2% 2 Germany 67.1 11.0% 3 China 66.2 10.8% 4 Netherlands 38.6 6.3% 5 France 33.5 5.5% 6 Belgium 25.4 4.1% 7 Italy 21.2 3.5% 8 Spain 19.9 3.3% 9 Ireland 19.7 3.2%
10 Norway 15.8 2.6% EU1 292.4 47.8% Non-EU1 319.6 52.2%
World1 612.0 100.0%
Source: ONS UK trade, experimental quarterly trade in goods and services tables: April to June 2021, next release: ONS UK trade, experimental quarterly trade in goods and services tables: July to September 2021.
Notes:
1. Totals in the tables above do not match the figures in the ‘Statistical summary sheet’ as they are not seasonally adjusted. Data in the ‘Statistical summary sheet’ are seasonally adjusted and should be preferred over non-seasonally adjusted totals. Seasonally adjusted data by partner country are not available.
2. United States includes Puerto Rico.

43
Fastest-growing markets1 for UK imports of goods and services2 between 2010 and 2020
Rank Import market Value in 2020
(£ billion) Growth 2010-20 (%) 1 Vietnam 4.0 200.6% 2 Bulgaria 1.1 113.2% 3 Luxembourg 4.6 87.4% 4 Bangladesh 2.5 86.9% 5 China 56.9 78.4% 6 Slovakia 3.1 77.5% 7 Poland 13.4 76.6% 8 Romania 2.7 72.1% 9 Saudi Arabia 2.0 69.9%
10 Lithuania 1.3 69.1%
Source: ONS UK trade, experimental quarterly trade in goods and services tables: April and June 2021, next releases: ONS UK trade, experimental quarterly trade in goods and services tables: July to September 2021.
Notes: 1. Only including those with more than £1 billion in value in 2020. 2. Data on trade in goods with Crown Dependencies (Jersey, Guernsey, Isle of Man)
are not available therefore these markets are excluded as their growth rates are not comparable with other markets.

44
• Global import rankings - In 2020* the UK ranked: o 6th in the world for imports of goods and services (2 places down from
2019). o 7th in the world for goods imports (1 down from 2019). o 6th in the world for services imports (1 down from 2019).
Source: UNCTADT, next release: UNCTAD.
* Much of the 2020 data on which these rankings are based are modelled/estimated. • Current estimates and forecasts of real import growth: In real terms, UK imports decreased by 16.8% in 2020, following
growth of 2.9% in 2019. Comparing the 12 months ending September 2021 with the previous 12 months, UK imports increased by 1.2%. This followed a 16.1% decrease in UK imports in the 12 months ending September 2020. (Source: ONS UK Trade: September 2021, next release: ONS UK Trade: October 2021).
• The IMF forecasts the volume of UK imports of goods and services is expected to grow by 1.6% in 2021, and then grow at 9.8% in 2022. (Source: IMF World Economic Outlook - October 2021).
• The OECD predicts that the volume of UK imports of goods and services is estimated to grow by 2.0% in 2021, and by 5.0% in 2022. This is an increase from the forecast in December 2020 release,

45
where the volume of UK imports was forecast to fall by -0.2% in 2021 and grow by 0.2% in 2022. (Source: OECD Economic Outlook - May 2021).
• UK import volume growth forecasts (%) 2021 2022 International Monetary Fund (goods and services) 1.6 9.8 OECD1 (goods and services) 2.0 5.0
Source: IMF World Economic Outlook - October 2021 and OECD Economic Outlook - May 2021
1. OECD forecast uses 2018 prices.
• For further forecasts on global trade, see the World trade forecast
section.

46
Goods imports
In 2020, UK imports of goods were £437.4 billion (accounting for 73.3% of total UK imports), up 20.2% on 2010 and down 14.3% on 2019. More timely data shows the value of UK goods imports was £479.1 billion in the 12 months ending September 2021, up 12.0% on the previous 12 months. (Source: ONS UK Trade: September 2021, next release: ONS UK Trade: October 2021).
In 2020, Germany and China were the UK’s largest import markets
for goods, accounting for 13.0% and 12.5% of total UK goods imports respectively. (seasonally adjusted, Source: ONS UK Trade: September 2021, next release: ONS UK Trade: October 2021).

47
• See ‘Top and emerging partner countries’ section for Top 10 UK import markets for goods in 2020.
Top 10 import markets1 for goods in the year ending September 20213, seasonally adjusted
Source: ONS UK Trade: September 2021, next release: ONS UK Trade: October 2021.
Notes:
1. Data on trade in goods with Crown Dependencies (Jersey, Guernsey, Isle of Man) are not available.
2. United States includes Puerto Rico. 3. This table includes data from January 2021; the first data to include trade in goods
after the EU transition period ended on 31 December 2020. Data may have been affected by disruption caused by the end of the transition period and has seen changes to data collection methods for exports of goods from GB to the EU. There have been no changes to data collection methods for goods imports.
Rank
Import market
£ billion
% of total goods imports
1 China 66.1 13.8% 2 Germany 58.2 12.2% 3 United States2 39.2 8.2% 4 Netherlands 32.9 6.9% 5 France 24.4 5.1% 6 Belgium 24.1 5.0% 7 Norway 18.8 3.9% 8 Italy 18.2 3.8% 9 Spain 15.1 3.2%
10 Ireland 14.0 2.9%
EU 233.3 48.7% Non-EU 245.8 51.3% World 479.1 100.0%

48
Fastest-growing markets1 for UK imports of goods2 between 2010
and 2020, seasonally adjusted
Rank Import market
Value in 2020 (£ billion)
Growth 2010-20 (%)
1 Vietnam 3.9 214.6% 2 Bangladesh 2.4 98.5% 3 Poland 10.8 83.4% 4 China 54.6 78.4% 5 Saudi Arabia 1.5 72.7% 6 South Korea 4.3 57.9% 7 Pakistan 1.3 55.1% 8 Turkey 8.2 52.4% 9 Slovakia 2.4 48.6%
10 Portugal 2.5 44.4%
Source: ONS UK Trade: September 2021, next release: ONS UK Trade: October 2021.
Notes:
1. Only including those with more than £1 billion in value in 2020. 2. Data on trade in goods with Crown Dependencies (Jersey, Guernsey, Isle of
Man) are not available.
In 2020, the top three commodities imported by the UK were cars, medicinal and pharmaceutical products, and clothing. Combined, their values accounted for 16.1% of all UK goods imports in 2020 (seasonally adjusted, Source: ONS UK Trade: September 2021, next release: ONS UK Trade: October 2021).
• See ‘Top and fastest-growing goods and services’ section for Top 10 UK
goods imports in 2020, seasonally adjusted.

49
Top 10 UK goods imports in the year to September 20213, not
seasonally adjusted1
Rank Commodity Division2 £ billion
% of total goods
imports
1 Cars 78M 26.5 5.6% 2 Medicinal and pharmaceutical products 54 21.5 4.5% 3 Clothing 84 18.9 4.0% 4 Unspecified goods 9 18.6 3.9% 5 Non-ferrous metals 68 18.2 3.8% 6 Telecoms and sound equipment (capital) 76K 17.6 3.7% 7 Miscellaneous electrical goods (intermediate) 771 15.5 3.3% 8 Crude oil 33O 14.6 3.1% 9 Office machinery (capital) 75K 14.1 3.0%
10 Other manufacturers (consumer) 89OC 14.0 2.9%
Total goods imports1 476.1 100.0%
Source: ONS UK Trade: September 2021, next release: ONS UK Trade: October 2021. Notes: 1. Totals in the tables above do not match the figures in the ‘Statistical summary
sheet’ as they are not seasonally adjusted. Data in the ‘Statistical summary sheet’ are seasonally adjusted and should be preferred over non-seasonally adjusted totals. Seasonally adjusted data by commodity are not available.
2. Divisions as reported by ONS, derived from Standard International Trade Classifications (SITC).
3. This table includes data from January 2021; the first data to include trade in goods after the EU transition period ended on 31 December 2020. Data may have been affected by disruption caused by the end of the transition period and has seen changes to data collection methods for exports of goods from GB to the EU. There have been no changes to data collection methods for goods imports.
• Of all the English regions, London and the South East were the two regions with the highest number of goods importers and imported the highest value of goods in 2020. The North East was the English region with the lowest number of goods importers and imported the lowest value of goods, however the average value of imports per importer was higher than in any other region. (Source: HMRC Regional Trade Statistics: Q2 (Apr - Jun) 2021, next release: HMRC Regional Trade Statistics: Q3 (Jul - Sep) 2021).

50
• Number of goods importers and import value by region in 2020, not
seasonally adjusted1
Country/region4 Goods imports
(£ billion) Number of goods
importers3
United Kingdom1 423.1 253,840 North East 12.5 4,379 North West 33.8 24,283 Yorkshire and The Humber 27.5 14,931 East Midlands 25.4 15,534 West Midlands 30.0 18,663 East of England 40.4 22,249 London 57.2 51,081 South East 82.0 39,363 South West 20.9 18,392
England 329.6 208,875 Wales 14.3 7,535 Scotland 20.0 11,934 Northern Ireland 6.9 13,975 Unallocated2 52.3 11,521
Source: HMRC Regional Trade Statistics: Q2 (Apr - Jun) 2021, next release: HMRC Regional Trade Statistics: Q3 (Jul - Sep) 2021.
Notes:
1. Values differ from those reported by the ONS due to differences in methodology. The totals reported for the United Kingdom in ONS releases are compiled on a change of economic ownership basis and should be preferred over the United Kingdom total above from HMRC, which is compiled on a physical movement basis.
2. 'Unallocated’ refers to trade that cannot be allocated to UK regions. 3. Data on number of importers are compiled on a 'proportion' basis; i.e. the
business' trade is allocated to a region based on the proportion of its employees in that region rather than where the Head Office of the business is located.
4. Values of imports for each region may not sum to country totals due to rounding.

51
Services imports
UK imports of services were £159.3 billion in 2020 (accounting for 26.7% of total UK imports), up 31.8% on 2010 and down 24.1% on 2019. More timely data shows the value of UK services imports was £146.3 billion in the 12 months ending September 2021, down 16.9% on the previous 12 months. (Source: ONS UK Trade: September 2021, next release: ONS UK Trade: October 2021).

52
• See ‘Top and emerging partner countries’ section for Top 10 UK import markets for services in 2020.
Top 10 UK import markets for services in year ending June 2021, not seasonally adjusted1
Rank Partner country £ billion % of total services imports 1 United States2 37.6 25.2% 2 France 9.5 6.4% 3 Germany 8.4 5.6% 4 Ireland 5.9 4.0% 5 India 5.4 3.6% 6 Netherlands 5.2 3.5% 7 Switzerland 5.0 3.4% 8 Spain 5.0 3.4% 9 Japan 4.9 3.3%
10 Luxembourg 4.1 2.8% EU1 59.4 40.9% Non-EU1 89.7 59.1%
World1 149.1 100.0%
Source: UK trade in services by partner country experimental data: April to June 2021, next releases: UK trade in services by partner country experimental data: July to September 2021.
Note:
1. Totals in the tables above do not match the figures in the ‘Statistical summary sheet’ as they are not seasonally adjusted. Data in the ‘Statistical summary sheet’ are seasonally adjusted and should be preferred over non-seasonally adjusted totals. Seasonally adjusted data by partner country are not available.
2. United States includes Puerto Rico.

53
Fastest-growing markets1 for UK imports of services between 2010 and 2020
Rank Import market Value in 2020 Growth 2010-20 (%) 1 Romania 1.2 265.6% 2 Luxembourg 4.2 175.0% 3 South Korea 1.0 136.9% 4 Sweden 4.1 131.0% 5 Hong Kong 3.0 118.3% 6 Singapore 3.6 96.6% 7 Jersey 3.3 92.9% 8 Japan 5.1 82.2% 9 United States2 37.5 79.9%
10 India 5.3 78.7%
Source: ONS UK trade, experimental quarterly trade in goods and services tables: April to June 2021, next release: ONS UK trade, experimental quarterly trade in goods and services tables: July to September 2021.
Notes:
1. Only including those with more than £1 billion in value in 2020. 2. United States includes Puerto Rico.
• Imports of travel and ‘other business’ (professional, management
consulting, technical and trade-related) services accounted for more than half (55.6%) of all UK’s services imports in 2020. (Source: ONS Balance of Payments: Quarter 2 (Apr to Jun) 2021, next release: ONS Balance of Payments: Quarter 3 (Jul to Sep) 2021).

54
• See ‘Top and fastest-growing goods and services’ section for Top 5 UK service imports in 2020.
• Top 5 services imports in the year ending June 2021, seasonally adjusted
Rank Type of service £ billion % of total
services imports 1 Other business services 70.1 47.6% 2 Financial services 15.7 10.6% 3 Intellectual property 12.8 8.7% 4 Transport services 11.8 8.0% 5 Telecommunication, computer and information 10.3 7.0%
Total services imports 147.2 100.0%
Source: ONS Balance of Payments: Quarter 2 (Apr to Jun) 2021, next release: ONS Balance of Payments: Quarter 3 (Jul to Sep) 2021.
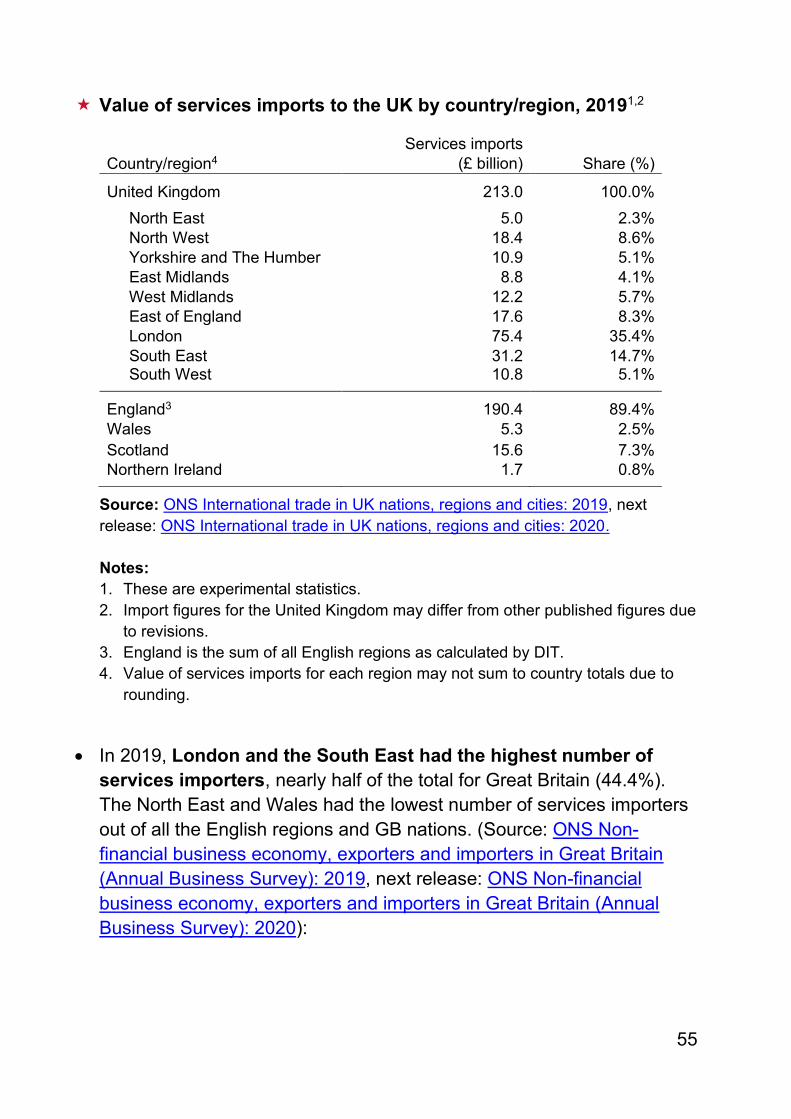
In 2019, London and the South East were responsible for around
50.1% of total UK services imports (Source: ONS International trade in UK nations, regions and cities: 2019, next release: ONS International trade in UK nations, regions and cities: 2020):
55
Value of services imports to the UK by country/region, 20191,2
Country/region4 Services imports
(£ billion) Share (%) United Kingdom 213.0 100.0% North East 5.0 2.3% North West 18.4 8.6% Yorkshire and The Humber 10.9 5.1% East Midlands 8.8 4.1% West Midlands 12.2 5.7% East of England 17.6 8.3% London 75.4 35.4% South East 31.2 14.7% South West 10.8 5.1%
England3 190.4 89.4% Wales 5.3 2.5% Scotland 15.6 7.3% Northern Ireland 1.7 0.8%
Source: ONS International trade in UK nations, regions and cities: 2019, next release: ONS International trade in UK nations, regions and cities: 2020. Notes: 1. These are experimental statistics. 2. Import figures for the United Kingdom may differ from other published figures due
to revisions. 3. England is the sum of all English regions as calculated by DIT. 4. Value of services imports for each region may not sum to country totals due to
rounding.
• In 2019, London and the South East had the highest number of services importers, nearly half of the total for Great Britain (44.4%). The North East and Wales had the lowest number of services importers out of all the English regions and GB nations. (Source: ONS Non-financial business economy, exporters and importers in Great Britain (Annual Business Survey): 2019, next release: ONS Non-financial business economy, exporters and importers in Great Britain (Annual Business Survey): 2020):

56
• Number of services importers1 in Great Britain 20192
Country/region Number of services importers
(to nearest hundred) Share
(%) Great Britain 108,600 100.0% North East 1,300 1.2% North West 11,400 10.5% Yorkshire and The Humber 4,400 4.1% East Midlands 3,300 3.0% West Midlands 7,600 7.0% East of England 11,600 10.7% London 29,400 27.1% South East 18,800 17.3% South West 11,400 10.5%
England 99,300 91.5% Wales 1,900 1.8% Scotland 7,300 6.7%
Source: ONS Non-financial business economy, exporters and importers in Great Britain (Annual Business Survey): 2019, next release: ONS Non-financial business economy, exporters and importers in Great Britain (Annual Business Survey): 2020).
Notes:
1. These are experimental statistics. Estimates do not cover all businesses. They only cover registered businesses (for VAT/PAYE) in Great Britain non-financial economy (i.e. largely excludes financial, agriculture and government activities).
2. The data for 2019 are based on a response rate of 53% of businesses in the sample, compared to 78% for 2018. This increases the level of uncertainty around the estimates, as certain groups in the sample do not have the degree of representation required. It is strongly recommended that figures for 2019 are not compared to figures from previous years.

57
Trade balance
In 2020 the UK trade surplus was £4.3 billion, which is a change from the deficit of £20.7 billion in 2019. The UK trade deficit steadily widened between 2011 and 2016 from £16.8 billion to £33.0 billion, but narrowed in 2017 to £26.5 billion before widening again in 2018 to £28.3 billion. More timely data shows that the balance has switched from a surplus of £29.6 billion in the 12 months to end of September 2020 to a deficit of £22.9 billion in the 12 months to end of September 2021. (Source: ONS UK Trade: September 2021, next release: ONS UK Trade: October 2021). Prior to the trade surplus in 2020, the UK ran a trade deficit in each year since 1998 (Source: GDP first quarterly estimate, UK: July to September 2021, next release: GDP quarterly national accounts, UK: July to September 2021).
The UK has run a trade in goods deficit each year since 1983 and a trade in services surplus since 1966 (Source: GDP first quarterly estimate, UK: July to September 2021, next release: GDP quarterly national accounts, UK: July to September 2021).
In 2020, the UK had a trade in goods deficit of £128.7 billion (down from £138.2 billion in 2019) and a trade in services surplus of £133.0 billion (up from £117.5 billion in 2019). In the 12 months ending September 2021, the UK had a trade in goods deficit of £162.1 billion (up from £98.3 billion in the previous 12 months) and a trade in services surplus of £139.3 billion (up from £127.9 billion in the previous 12 months). (Source: ONS UK Trade: September 2021, next release: ONS UK Trade: October 2021).
• In 2020, the UK had a trade deficit with the EU of £49.4 billion (a
narrowing from £77.2 billion in 2019) and a trade surplus of £53.7 billion with the Non-EU (a narrowing from £56.5 billion in 2019). In the 12 months ending June 2021, the UK had a trade deficit with the EU of £40.0 billion (down from £57.1 billion in the previous 12 months) and a trade surplus of £22.3 billion with the Non-EU (down from £86.5 billion in the previous 12 months). (Source: ONS Balance of Payments: Quarter 2

58
(Apr to Jun) 2021, next release: ONS Balance of Payments: Quarter 3 (Jul to Sep) 2021).
The UK’s largest trade surplus in 2020 was with the United States
(including Puerto Rico), where we exported £51.3 billion more than we imported in goods and services. The UK’s largest trade deficit was with China, followed by Germany, with deficits of £30.9 billion and £17.0 billion respectively (Source: ONS UK trade, experimental quarterly trade in goods and services tables: April to June 2021, next release: ONS UK trade, experimental quarterly trade in goods and services tables: July to September 2021).
• See ‘Top and emerging partner countries’ section for Top 10 UK surpluses and deficits in goods and services in 2020, not seasonally adjusted.
More timely data show that the UK’s largest trade surplus in the year
ending June 2021 was with the United States (including Puerto Rico), where we exported £51.3 billion more than we imported in goods and services. The UK’s largest trade deficit was with China, followed by Germany, with deficits of £40.5 billion and £19.9 billion respectively (Source: ONS UK trade, experimental quarterly trade in goods and services tables: April to June 2021, next release: ONS UK trade, experimental quarterly trade in goods and services tables: July to September 2021):
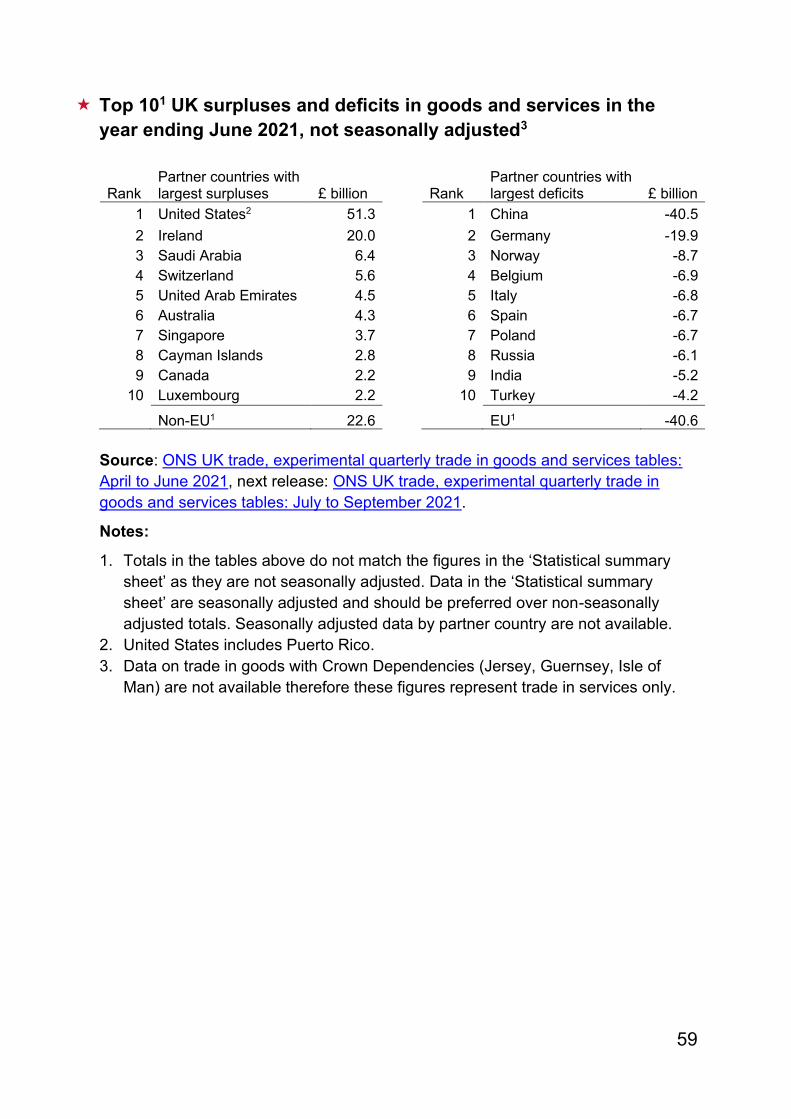
59
Top 101 UK surpluses and deficits in goods and services in the year ending June 2021, not seasonally adjusted3
Rank Partner countries with largest surpluses £ billion Rank
Partner countries with largest deficits £ billion
1 United States2 51.3 1 China -40.5 2 Ireland 20.0 2 Germany -19.9 3 Saudi Arabia 6.4 3 Norway -8.7 4 Switzerland 5.6 4 Belgium -6.9 5 United Arab Emirates 4.5 5 Italy -6.8 6 Australia 4.3 6 Spain -6.7 7 Singapore 3.7 7 Poland -6.7 8 Cayman Islands 2.8 8 Russia -6.1 9 Canada 2.2 9 India -5.2
10 Luxembourg 2.2 10 Turkey -4.2
Non-EU1 22.6 EU1 -40.6
Source: ONS UK trade, experimental quarterly trade in goods and services tables: April to June 2021, next release: ONS UK trade, experimental quarterly trade in goods and services tables: July to September 2021.
Notes:
1. Totals in the tables above do not match the figures in the ‘Statistical summary sheet’ as they are not seasonally adjusted. Data in the ‘Statistical summary sheet’ are seasonally adjusted and should be preferred over non-seasonally adjusted totals. Seasonally adjusted data by partner country are not available.
2. United States includes Puerto Rico. 3. Data on trade in goods with Crown Dependencies (Jersey, Guernsey, Isle of
Man) are not available therefore these figures represent trade in services only.

60
Total trade
• Total trade is the sum of exports and imports of goods and services. UK total trade in 2020 amounted to £1.20 trillion, a 15.6% decrease from
2019. In the 12 months ending September 2021, UK total trade amounted to £1.23 trillion, a 0.7% decrease on the previous 12 months. (Source: ONS UK Trade: September 2021, next release: ONS UK Trade: October 2021).
In 2020 the United States (including Puerto Rico) was the UK’s largest trading partner, accounting for 16.8% (or £200.8 billion) of total UK trade (not seasonally adjusted). (Source: ONS UK trade, experimental quarterly trade in goods and services tables: April to June 2021, next release: ONS UK trade, experimental quarterly trade in goods and services tables: July to September 2021).
Taken as a whole, the EU accounted for 46.1% of total UK trade in 2020
(seasonally adjusted), with the largest trading partners being Germany (9.6%), the Netherlands (6.5%) and France (5.5%) (not seasonally adjusted) (Sources: ONS Balance of Payments: Quarter 2 (Apr to Jun) 2021, ONS UK trade, experimental quarterly trade in goods and services tables: April to June 2021, next releases: ONS Balance of Payments: Quarter 3 (Jul to Sep) 2021, ONS UK trade, experimental quarterly trade in goods and services tables: July to September 2021).
• See ‘Top and emerging partner countries’ section for Top 10 trading partners in 2020.
More timely data show that the UK’s largest trading partner in the year ending June 2021 was the United States (including Puerto Rico), accounting for 16.7% of total UK trade (not seasonally adjusted). Sources: ONS UK trade, experimental quarterly trade in goods and services tables: April to June 2021, next release: ONS UK trade, experimental quarterly trade in goods and services tables: July to September 2021.

61
Top 101 UK trading partners in year ending June 2021 (exports plus imports of goods and services), not seasonally adjusted
Rank Partner country £ billion % of total trade
1 United States2 201.1 16.7% 2 Germany 114.2 9.5% 3 China 91.9 7.6% 4 Netherlands 75.1 6.2% 5 France 64.1 5.3% 6 Ireland 59.4 4.9% 7 Belgium 43.9 3.6% 8 Italy 35.6 3.0% 9 Spain 33.1 2.7%
10 Switzerland 30.7 2.5% EU1 544.2 45.1% Non-EU1 661.9 54.9%
World1 1,206.0 100.00%
Source: ONS UK trade, experimental quarterly trade in goods and services tables: April to June 2021, next release: ONS UK trade, experimental quarterly trade in goods and services tables: July to September 2021.
Notes:
1. Totals in the tables above do not match the figures in the ‘Statistical summary sheet’ as they are not seasonally adjusted. Data in the ‘Statistical summary sheet’ are seasonally adjusted and should be preferred over non-seasonally adjusted totals. Seasonally adjusted data by partner country are not available.
2. United States includes Puerto Rico.

62
World trade forecasts
World trade: • The IMF forecasts the volume of world trade in goods and services to
grow by 9.7% in 2021, and grow further by 6.7% in 2022. (Source: IMF World Economic Outlook, October 2021)
• The WTO has predicted that the volume of world merchandise trade is expected to grow by 10.8% in 2021 and by 4.7% in 2022. These are upward revisions from the previous WTO forecast. (Source: WTO Trade Statistics and Outlook, October 2021).
• The OECD forecasts that world real trade will increase by 8.2% in 2021, and by 5.8% in 2022. This is an increase from the forecast in December 2020 release, where world real trade was forecast to grow by 3.9% in 2021 and grow by 4.4% in 2022. (Source: OECD Economic Outlook - May 2021) OECD Assumptions: In advanced economies, the roll-out of an effective vaccine is assumed to be completed by Autumn 2021, and earlier in some countries. New fiscal measures will support demand in the near term. Improvement in confidence and labour market conditions and the decline in household savings rate will help maintain spending growth in 2022, offsetting the reduction in fiscal support. In emerging market economies, prospects of early completion of vaccine programmes are limited (except for Chile) with current virus outbreaks assumed to lead to tighter public health measures in the near term. Commodity exporters should benefit from higher prices and the rebound of world trade, but tourism-dependent economies face a slower recovery which will affect real incomes.
• World trade volume growth forecasts (%) 2021 2022 International Monetary Fund (goods and services) 9.7 6.7 World Trade Organisation (goods only) 10.8 4.7 OECD (goods and services) 8.2 5.8
Sources: IMF World Economic Outlook, October 2021, WTO Trade Statistics and Outlook, October 2021, and OECD Economic Outlook - May 2021.

63
• For UK trade forecasts, see the UK export growth and UK import growth sections.

64
Current account balance
• The UK has run a current account deficit in every year since 1984 (Source: ONS Balance of Payments: Quarter 2 (Apr to Jun) 2021, next release: ONS Balance of Payments: Quarter 3 (Jul to Sep) 2021).
• The current account deficit narrowed by £4.3 billion between 2019 and 2020, from £60.2 billion (equivalent to 2.7% of GDP) to £55.9 billion (equivalent to 2.6% of GDP). This followed a narrowing of £24.1 billion between 2018 and 2019. (Source: ONS Balance of Payments: Quarter 2 (Apr to Jun) 2021, next release: ONS Balance of Payments: Quarter 3 (Jul to Sep) 2021).
• More timely data shows the current account deficit was £52.2 billion in the 12 months ending June 2021 (equivalent to 2.3% of GDP), from £32.7 billion (equivalent to 1.5% of GDP) in the previous 12 months. (Source: ONS Balance of Payments: Quarter 2 (Apr to Jun) 2021, next release: ONS Balance of Payments: Quarter 3 (Jul to Sep) 2021).

65
• In 2020, the UK had a current account deficit with the EU of £74.9 billion (a narrowing from £109.7 billion in 2019) and a current account surplus of £19.0 billion with the Non-EU (a narrowing from £49.5 billion in 2019). More timely data shows the UK had a current account deficit with the EU of £65.9 billion in the year to June 2021 (a narrowing of £21.7 billion from the 12 months ending June 2020) and a current account surplus of £13.7 billion with the Non-EU (a decrease of £41.2 billion from the 12 months ending June 2020) (Source: ONS Balance of Payments: Quarter 2 (Apr to Jun) 2021, next release: ONS Balance of Payments: Quarter 3 (Jul to Sep) 2021).

66
Trade in value added
(Source: OECD Trade in Value Added: 2005-2015, experimental statistics, next release: OECD Trade in Value Added: 1995-2018, experimental statistics).
• Trade in Value Added (TiVA) is an experimental dataset, published by the OECD, that makes it possible to examine aspects of value chain trade that are not possible to examine with traditional measures of trade. The novelty of this dataset is that it regards international trade not as gross flows of final goods and services but as flows of value added and identifies in which countries and industries value is added along the value chain. In this way, it provides a more accurate picture of international trade relationships and countries' participation in Global Value Chains (GVCs).
• TiVA can inform trade policy in a number of areas: o By highlighting the importance of intermediate imports for export
competitiveness, TiVA highlights the self-defeating nature of protectionism and reinforces the case for open markets.
o TiVA helps us understand how well integrated our industries are in GVCs.
o It provides a more accurate picture of a country’s bilateral trade balances and comparative advantage sectors.
o TiVA also reveals that services are integral to the success of manufacturing exports and far more important to trade than they appear in traditional trade statistics.
• Revised TiVA data were published by the OECD in December 2018. These data cover the years 2005-2015 (with preliminary estimates for 2016 for some indicators), 64 countries and 36 industries.
• These latest statistics incorporate important methodological improvements since the last publication in 2016 resulting in large downward revisions for some indicators. For example, there are large downward revisions to headline measures, such as the ‘foreign value added content of exports’ (‘backward linkages’) and the ‘domestic value added content of partner’s exports’ (‘forward linkages’), implying a lower

67
degree of integration of the UK in GVCs. It should be noted that these downward revisions apply to most countries in the dataset, not just the UK, and do not change the general trend over time.
• It is also important to note that, while TiVA offers many advantages over traditional ways of measuring trade, it has significant limitations in its current form. The statistics are based on a number of strong assumptions, imputations and modelling, and are classed as ‘experimental’. Data limitations mean that TiVA should be considered as complementary to analysing trade patterns rather than a replacement of traditional trade statistics.
Key findings: Backward (or ‘upstream’) participation in GVCs
• Backward linkages measure the extent to which exporters in one country depend on foreign inputs (imports) for the production of their exports.
• At the global level, the TiVA data reveal a general gradual decline in GVC integration in recent years. The import content of exports has fallen in many developed economies, with the decline being most pronounced in China, and to a lesser extent the USA. This trend may reflect an increased tendency for countries to source intermediate inputs from the domestic market rather than from abroad. Fluctuations in commodity prices (e.g. crude oil) may have also played a role in these trends.
• The import content of UK exports was 15.4% in 2016, significantly below the OECD average of around 26%, but up 1.1 percentage points from 2005 – evidence that the UK has become slightly more integrated in GVCs over the last decade. That said, the import content of UK exports has declined by 3.4 percentage points between 2011 and 2016, in line with the global downward trend.

68
Source: OECD Trade in Value Added: 2005-2015, experimental statistics
• The UK is less well integrated into upstream supply chains than France
(21.5% import content) and Germany (20.2%) but more integrated than the USA (9.1%). The UK’s relatively low import content partly reflects its specialisation in services exports which tend to have low import content.
• The UK industries that are most reliant on foreign inputs (imports) for their exports are: Basic Metals (38.9% import content in 2016), Other Transport Equipment (38.0%) and Coke and Refined Petroleum (37.5%).
• The UK is slightly more reliant on the Non-EU than the EU as a source of inputs for its exports. Dependence on Non-EU suppliers for the production of UK exports has increased over time. The share of value added in UK gross exports coming from the Non-EU has increased from 7.6% in 2005 to 8.5% in 2015. Over the same period, the share of value added coming from the EU has decreased marginally, from 6.7% in 2005 to 6.6% in 2015. Looking at individual countries, the largest suppliers of inputs for UK exporters are the USA (accounting for
0
5
10
15
20
25
30
2005 2006 2007 2008 2009 2010 2011 2012 2013 2014 2015 2016
Per c
ent
Foreign value added (import) content of gross exports, %, 2005-16
OECD average UK

69
2.1% of the value added in UK exports), Germany (1.8%), China (1.2%) and France (1.1%).
Key findings: Forward (or ‘downstream’) participation in GVCs
• Forward linkages measure the contribution that a country makes as a supplier of inputs to other countries’ exports.
• UK’s participation in GVCs as a supplier of inputs has increased over the last decade. In 2015, the UK value added embedded in world exports was 23.7% of total UK exports, up from 22.0% in 2005.
• The UK has stronger forward linkages with EU countries, especially Ireland, Luxembourg and Germany. In 2015, the UK value added embedded in EU exports (as a % of UK exports) was 15.3%, compared to a share of 8.4% for the Non-EU.
• The UK (source) industries with the strongest forward linkages in 2015 were ‘Financial and insurance services’, ‘Chemicals and pharmaceuticals’, ‘Motor vehicles’, ‘Transportation and storage services’ and “Computer, electronic and Optical equipment’.
Key findings: Importance of services
• Unlike traditional trade statistics, TiVA allows us to estimate the contribution made by the services sector in producing goods for export. Accounting for the value added of services in the production of goods, the TiVA data show that services are more important to UK exports than they appear in traditional trade statistics. According to ONS Pink Book 2018 data, services represented around 46% of UK exports in 2016. But, according to TiVA, the share is significantly higher (around 71%). This is one of the highest among the countries in the OECD dataset, with significant services content embedded in manufacturing exports (32% in 2016).

70
Key findings: Employment sustained by foreign final demand
• Integration in GVCs has implications for domestic employment.
• The TiVA data suggest that around a fifth of total UK employment in 2015 was supported by foreign final demand (i.e. was dependent on overseas markets).
Key findings: Exports, imports and bilateral trade balances
• The USA is the UK’s top export market in both gross and value added terms. In gross terms, the USA accounted for 15.7% of UK exports in 2015, followed by Germany (8.1%) and France (6.6%). In value added terms, the importance of the USA as an export market is amplified, with a share of 17.9%, while the EU27 becomes a less important export market (with a share of 37.0%, compared to 43.5% in gross terms).
• In gross terms, the UK’s top import markets in 2016 were Germany (11.9%), USA (11.8%) and China (9.0%). In value added terms, the top import markets remain the same, but USA becomes the largest import source (13.4%), ahead of Germany (11.4%) and China (9.5%). The EU becomes a less important import market in value added terms (accounting for 45.5% of total UK imports) compared to 51.0% in gross terms.
• Measuring trade in value added terms does not affect the overall trade balance of a country. However, bilateral trade balances with individual trade partners can look different when measured on a value added basis. For example, the TiVA data show that:
o The UK’s trade surplus with the USA and the Non-EU is smaller in value added terms than in gross terms.
o The UK’s trade deficit with China, Germany, France, Italy, Spain and the whole of the EU is smaller in value added terms.
o The UK’s trade surplus with Ireland and Luxembourg turns into a deficit in value added terms.

71
Source: OECD Trade in Value Added database, experimental statistics
-100
-80
-60
-40
-20
0
20
40
EU
27
CH
N: C
hina
DEU
: Ger
man
y
NO
R: N
orw
ay
ESP
: Spa
in
ITA
: Ita
ly
FRA
: Fra
nce
NLD
: Net
herla
nds
JPN
: Jap
an
BR
A: B
razi
l
SG
P: S
inga
pore
AU
S: A
ustra
lia
LUX
: Lux
embo
urg
SAU
: Sau
di A
rabi
a
USA
: Uni
ted
Sta
tes
Non
-EU
$bn
UK trade balance in gross and value added terms, 2015
Gross (BALGR) Value Added (BALVAFD)

72
FDI (Foreign Direct Investment) statistics
Inward FDI
• The UK’s inward FDI stock was £1.6 trillion at the end of 2019, down 0.9% on 2018 and up 128.4% on 2010 (Source: Foreign Direct Investment (FDI) totals for inwards and outwards flows, positions and earnings, 2018 to 2019, directional method, next release: Foreign direct investment involving UK companies: 2020).
• UK Inward FDI Stock, Flows and Earnings
Source: Foreign direct investment involving UK companies: 2019, directional method, next release: Foreign direct investment involving UK companies: 2020.
Notes:
1. Data compiled according to directional method. 2. A negative sign before values indicates a net disinvestment.
• The United States was the largest investor in the UK with an inward FDI
stock of £381.6 billion at the end of 2019. (Source: Foreign Direct Investment (FDI) totals for inwards and outwards flows, positions and earnings, 2018 to 2019, directional method, next release: Foreign direct investment involving UK companies: 2020).
£
billion 2010 2011 2012 2013 2014 2015 2016 2017 2018 2019 FDI stock in the UK (inward) 682 749 913 918 1,013 1,033 1,187 1,392 1,573 1,559
EU 347 366 452 462 490 441 552 591 617 681 Non-EU 335 382 461 456 523 592 636 801 956 878
FDI flows into the UK (inward) 38 26 35 33 15 25 192 75 66 36
EU -1 -24 15 0 3 -14 130 21 -13 28 Non-EU 39 50 20 34 12 39 62 54 78 7
Foreign earnings from FDI in the UK (inward) 40 45 46 51 48 48 50 58 75 44
EU 18 17 21 25 24 18 16 17 29 15 Non-EU 22 29 25 26 24 30 35 40 46 28
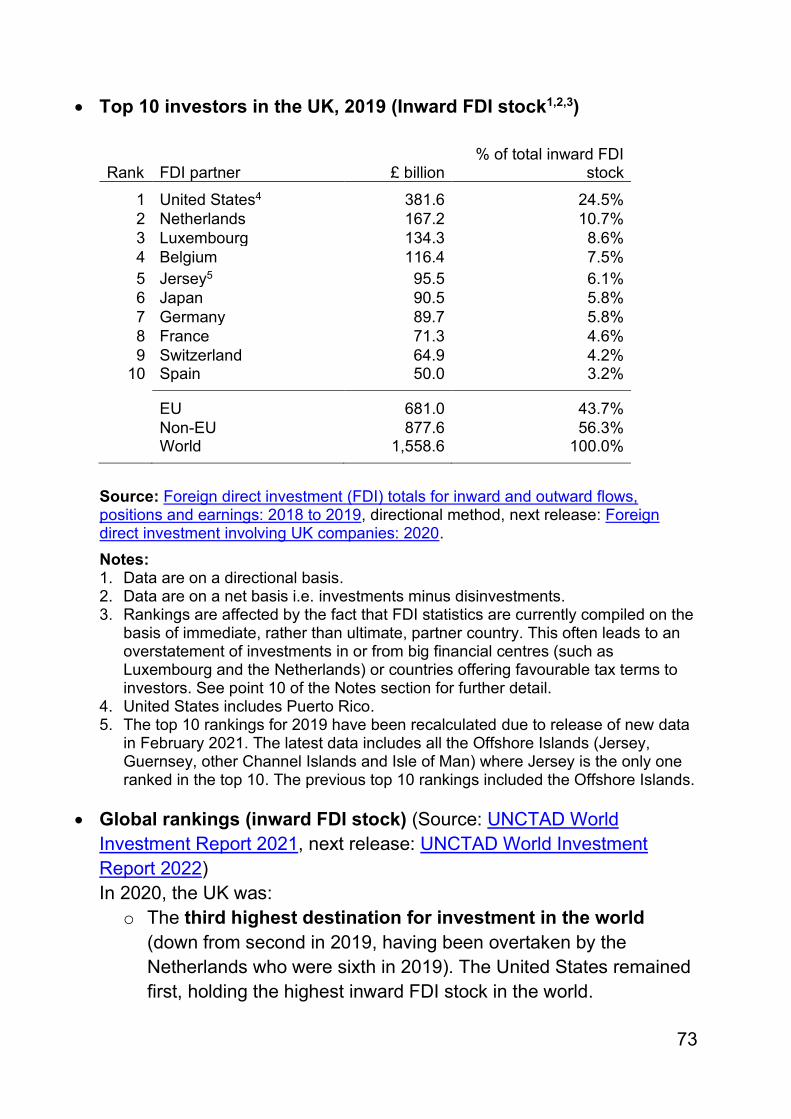
73
• Top 10 investors in the UK, 2019 (Inward FDI stock1,2,3)
Rank FDI partner £ billion % of total inward FDI
stock 1 United States4 381.6 24.5% 2 Netherlands 167.2 10.7% 3 Luxembourg 134.3 8.6% 4 Belgium 116.4 7.5% 5 Jersey5 95.5 6.1% 6 Japan 90.5 5.8% 7 Germany 89.7 5.8% 8 France 71.3 4.6% 9 Switzerland 64.9 4.2%
10 Spain 50.0 3.2%
EU 681.0 43.7% Non-EU 877.6 56.3% World 1,558.6 100.0%
Source: Foreign direct investment (FDI) totals for inward and outward flows, positions and earnings: 2018 to 2019, directional method, next release: Foreign direct investment involving UK companies: 2020. Notes: 1. Data are on a directional basis. 2. Data are on a net basis i.e. investments minus disinvestments. 3. Rankings are affected by the fact that FDI statistics are currently compiled on the
basis of immediate, rather than ultimate, partner country. This often leads to an overstatement of investments in or from big financial centres (such as Luxembourg and the Netherlands) or countries offering favourable tax terms to investors. See point 10 of the Notes section for further detail.
4. United States includes Puerto Rico. 5. The top 10 rankings for 2019 have been recalculated due to release of new data
in February 2021. The latest data includes all the Offshore Islands (Jersey, Guernsey, other Channel Islands and Isle of Man) where Jersey is the only one ranked in the top 10. The previous top 10 rankings included the Offshore Islands.
• Global rankings (inward FDI stock) (Source: UNCTAD World
Investment Report 2021, next release: UNCTAD World Investment Report 2022) In 2020, the UK was:
o The third highest destination for investment in the world (down from second in 2019, having been overtaken by the Netherlands who were sixth in 2019). The United States remained first, holding the highest inward FDI stock in the world.

74
o The second highest destination for investment in Europe behind the Netherlands.
Outward FDI
• The UK’s outward FDI stock was £1.5 trillion at the end of 2019, up 3.1% on 2018 and up 39.1% on 2010 (Source: Foreign Direct Investment (FDI) totals for inwards and outwards flows, positions and earnings, 2018 to 2019, directional method, next release: Foreign direct investment involving UK companies: 2020).
• UK Outward FDI Stock, Flows and Earnings
£ billion 2010 2011 2012 2013 2014 2015 2016 2017 2018 2019
UK FDI stock abroad (outward) 1,077 1,118 1,073 1,091 1,079 1,084 1,275 1,369 1,453 1,498
EU 565 557 505 455 445 456 578 597 607 602 Non-EU 513 561 569 636 634 628 696 773 846 896
UK FDI flows abroad (outward) 31 60 13 26 -91 -43 -28 111 62 -5
EU 20 25 -5 -12 -83 -13 -26 18 6 -18 Non-EU 11 34 19 38 -8 -30 -2 93 57 13
UK earnings from FDI abroad (outward) 88 99 81 79 68 57 51 88 94 92
EU 31 37 23 24 17 17 20 30 29 29 Non-EU 57 62 58 55 51 41 31 59 65 63
Source: Foreign direct investment involving UK companies: 2019, directional method, next release: Foreign direct investment involving UK companies: 2020.
Notes:
1. Data compiled according to directional method. 2. A negative sign before values indicates a net disinvestment.
• The United States was the top destination for UK FDI at the end of
2019, with FDI investment stock at 379.7bn. (Source: Foreign Direct Investment (FDI) totals for inwards and outwards flows, positions and earnings, 2018 to 2019, directional method, next release: Foreign direct investment involving UK companies: 2020).

75
• Top 10 destinations for UK FDI, 2019 (Outward FDI stock1,2,3)
Rank FDI partner £ billion % of total outward
FDI stock 1 United States4 379.7 25.3% 2 Netherlands 155.7 10.4% 3 Luxembourg 95.9 6.4% 4 Spain 75.2 5.0% 5 France 75.2 5.0% 6 Hong Kong 70.5 4.7% 7 Ireland 55.0 3.7% 8 Jersey5 43.8 2.9% 9 Switzerland 38.4 2.6%
10 Australia 37.3 2.5%
EU 602.4 40.2% Non-EU 895.8 59.8% World 1,498.2 100.0%
Source: Foreign Direct Investment (FDI) totals for inwards and outwards flows, positions and earnings, 2018 to 2019 directional method, next release: Foreign direct investment involving UK companies: 2020. Notes: 1. Data are on a directional basis. 2. Data are on a net basis i.e. investments minus disinvestments. 3. Rankings are affected by the fact that FDI statistics are currently compiled on the
basis of immediate, rather than ultimate, partner country. This often leads to an overstatement of investments in or from big financial centres (such as Luxembourg and the Netherlands) or countries offering favourable tax terms to investors. See point 10 of the Notes section for further detail.
4. United States includes Puerto Rico. 5. The top 10 rankings for 2019 have been recalculated due to release of new data
in February 2021. The latest data includes all the Offshore Islands (Jersey, Guernsey, other Channel Islands and Isle of Man) where Jersey is the only one ranked in the top 10. The previous top 10 rankings included the Offshore Islands.
• Global rankings (outward FDI stock) (Source: UNCTAD World
Investment Report 2021, next release: UNCTAD World Investment Report 2022) In 2020, the UK was:
o The fourth largest global investor (unchanged from 2019), behind the United States, Netherlands, and China.
o The second largest European investor, behind the Netherlands (unchanged from 2019).
76
Inward investment projects statistics
DIT statistics
(Source: DIT Inward investment results 2020/21, next release: DIT Inward investment results 2021/22).
• DIT recorded 1,538 investment projects coming into the UK in 2020/21, down 17.0% from 1,852 in 2019/20.
• Out of 1,538 investment projects coming into UK in 2020/21, 1,131 were supported by DIT, a decrease of 21.9% from 1,449 in 2019/20.
• Out of all investment projects in 2020/21, 596 (38.8%) were made by new investors to the UK, and 942 (61.2%) by existing investors in the UK.
• Inward investments projects coming into the UK are estimated to have created 55,319 new jobs and safeguarded 18,187 jobs, a decrease of 1.4% and an increase of 101.6% in 2020/21 respectively.
• Total estimated jobs created/safeguarded by inward investment projects was 73,506 in 2020/21, an increase of 12.8% from 65,138 in 2019/20.
• London was the UK region with the highest number of new jobs created by inward investment, an increase of 6.5% (13,832) in 2020/21. The highest growth of new created jobs was in the South West, an increase of 52.3% in 2020/21.
• The estimated economic impact of foreign direct investment projects involving DIT rose 25% in the year 2020/21 to £3.9bn.
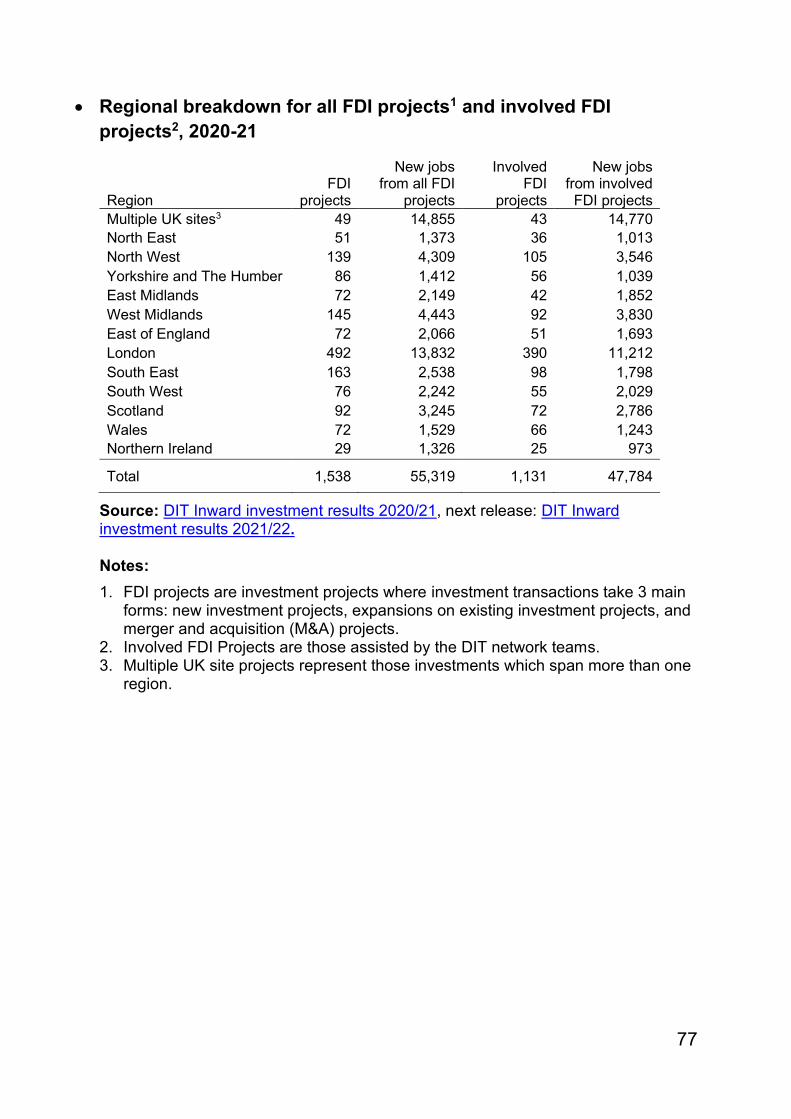
77
• Regional breakdown for all FDI projects1 and involved FDI projects2, 2020-21
Region FDI
projects
New jobs from all FDI
projects
Involved FDI
projects
New jobs from involved
FDI projects Multiple UK sites3 49 14,855 43 14,770 North East 51 1,373 36 1,013 North West 139 4,309 105 3,546 Yorkshire and The Humber 86 1,412 56 1,039 East Midlands 72 2,149 42 1,852 West Midlands 145 4,443 92 3,830 East of England 72 2,066 51 1,693 London 492 13,832 390 11,212 South East 163 2,538 98 1,798 South West 76 2,242 55 2,029 Scotland 92 3,245 72 2,786 Wales 72 1,529 66 1,243 Northern Ireland 29 1,326 25 973
Total 1,538 55,319 1,131 47,784
Source: DIT Inward investment results 2020/21, next release: DIT Inward investment results 2021/22. Notes: 1. FDI projects are investment projects where investment transactions take 3 main
forms: new investment projects, expansions on existing investment projects, and merger and acquisition (M&A) projects.
2. Involved FDI Projects are those assisted by the DIT network teams. 3. Multiple UK site projects represent those investments which span more than one
region.

78
Statistics summary sheet – Table of sources
#
Statistic
Source
Update Frequency
Comments
Gross Domestic Product (GDP) 1 Annual real GDP growth ONS quarterly
GDP releases Monthly This is the headline (real) GDP
growth rate. All other data below are in nominal terms (current prices)
Trade in Goods and Services 2 3 4 5 6 7 8 9 10 11 12 13 14 15 16 17
Exports Imports Total trade Trade deficit Exports as % of GDP Imports as % of GDP Total trade as % of GDP Trade deficit as % of GDP Exports to the EU Exports to the Non-EU Imports from the EU Imports from the Non-EU Total trade with the EU Total trade with the Non-EU Trade deficit with the EU Trade surplus with Non-EU
ONS UK Trade, Balance of Payments and quarterly GDP releases (where GDP is the denominator)
Monthly Covers both goods and services – Trade and GDP in current prices
18 19
Global Ranking: Total exports European Ranking: Total exports
UNCTAD When data available from National Statistical Offices
2020 data have been used but data for many countries are estimated/modelled Current prices
Trade in Goods 20 21 22 23 24 25 26 27 28 29 30 31
Goods exports Goods imports Goods total trade Trade in goods deficit Goods exports to EU Goods exports to Non-EU Goods imports from EU Goods imports from Non-EU Goods total trade with EU Goods total trade with Non-EU Goods trade deficit with EU Good trade deficit with Non-EU
ONS UK Trade and Balance of Payments
Monthly Covers both goods and Services – Current prices
32 Global Ranking: Goods Exports UNCTAD When data available from National Statistical Offices
2020 data have been used but data for many countries are estimated/modelled Current prices
Trade in Services 33 34 35 36 37
Services exports Services imports Services total trade Trade in services surplus Services exports to EU
ONS UK Trade and Balance of Payments
Monthly Covers both goods and Services – Current prices

79
#
Statistic
Source
Update Frequency
Comments
38 39 40 41 42 43 44
Services exports to Non-EU Services imports from EU Services imports from Non-EU Services total trade with EU Services total trade with Non-EU Services trade surplus with EU Service trade surplus with Non-EU
45 Global Ranking: Services Exports UNCTAD When data available from National Statistical Offices
2020 data have been used but data for many countries are estimated/modelled Current prices
Current Account 46 47
Current Account deficit Current Account deficit as % of GDP
ONS Balance of Payments release
Quarterly Current Account data on an asset/liability basis – Current Account and GDP in current prices
Foreign Direct Investment 48 49
Outward FDI stock Inward FDI Stock
ONS FDI Involving UK Companies 2019
Annually FDI data on a ‘directional’ basis ( ≠ asset/liability basis) Current prices
50 51 52 53
Global Ranking: Outward FDI stock Global Ranking: Inward FDI stock European Ranking: Outward FDI stock European Ranking: Inward FDI stock
UNCTAD World Investment Report
When data available from National Statistical Offices
FDI data on a directional basis – Current prices
Number and proportion of UK businesses exporting 54 55
Proportion of VAT-registered Businesses in the GB Non-Financial Economy exporting goods and/or services Number of VAT-registered Businesses in the GB Non-Financial Economy exporting goods and/or services
ONS Non-financial business economy, exporters and importers in Great Britain (Annual Business Survey)
Annually Experimental statistics. Only covers registered businesses (for VAT and/or PAYE) in the Great Britain non-financial Business Economy (two thirds of the economy). Largely excludes financial, agricultural and government activities. Low response rates to 2019 survey increased the level of uncertainty around the estimates; it is recommended that figures for 2019 are not compared to figures from previous years.

80
Update schedule The Core Stats Book will be updated shortly after the publication of the following regular releases:
Direct link to latest version Next planned publication Source Date Status UK Trade: September 2021 UK Trade: October 2021 Office for National
Statistics 10 December 2021
Confirmed
Foreign direct investment involving UK companies: 2019
Foreign direct investment involving UK companies: 2020
Office for National Statistics
20 December 2021
Confirmed
Balance of Payments: Quarter 2 (Apr to Jun) 2021
Balance of Payments: Quarter 3 (Jul to Sep) 2021
Office for National Statistics
22 December 2021
Confirmed
GDP Quarterly National Accounts: April to June 2021
GDP Quarterly National Accounts: July to September 2021
Office for National Statistics
22 December 2021
Confirmed
UK Regional Trade in Goods Statistics: Quarter 2 (Apr - Jun) 2021
UK Regional Trade in Goods Statistics: Quarter 3 (Jul to Sep ) 2021
HM Revenue and Customs
13 January 2021 Confirmed
GDP first quarterly estimate, UK: July to September 2021
GDP first quarterly estimate, UK: October to December 2021
Office for National Statistics
11 February 2022 Confirmed
OECD Economic Outlook – May 2021
OECD Economic Outlook Organisation for Economic Co-operation and Development
TBC 2021 Unknown
World Economic Outlook Update, July 2021
World Economic Outlook Update
International Monetary Fund
TBC 2022 Unknown
World Economic Outlook, October 2021
World Economic Outlook International Monetary Fund
TBC 2022 Unknown

81
Direct link to latest version Next planned publication Source Date Status ONS Non-financial business economy, exporters and importers in Great Britain (Annual Business Survey): 2019
ONS Non-financial business economy, exporters and importers in Great Britain (Annual Business Survey): 2020
Office for National Statistics
TBC 2022 Unknown
Foreign Direct Investment (FDI) totals for inwards and outwards flows, positions and earnings, 2018 to 2019
Foreign Direct Investment (FDI) totals for inwards and outwards flows, positions and earnings, 2019 to 2020
Office for National Statistics
TBC 2022 Unknown
UK trade, experimental quarterly trade in goods and services tables: April to June 2021
UK trade, experimental quarterly trade in goods and services tables, July to September 2021
Office for National Statistics
TBC 2022 Unknown
UK trade in services by partner country experimental data: April to June 2021
UK trade in services by partner country, experimental data: July to September 2021
Office for National Statistics
TBC 2022 Unknown
ONS International trade in UK nations, regions and cities: 2019
ONS International trade in UK nations, regions and cities: 2020
Office for National Statistics
TBC 2022 Unknown
National Survey of Registered Businesses’ Exporting Behaviours, Attitudes and Needs 2020
National Survey of Registered Businesses’ Exporting Behaviours, Attitudes and Needs 2022
Department for International Trade
TBC 2022 Unknown
DIT Inward investment results 2020/21
DIT Inward investment results 2021/22
Department for International Trade
TBC 2022 Unknown
OECD Economic Survey of the United Kingdom - October 2020
OECD Economic Survey of the United Kingdom
Organisation for Economic Co-operation and Development
TBC Unknown

82
Direct link to latest version Next planned publication Source Date Status WTO Trade Statistics and Outlook, October 2021
WTO Trade Statistics and Outlook
World Trade Organisation TBC Unknown
The Core Statistics Book will also be updated shortly after the publication of ad-hoc releases:
Direct link to latest version Next planned publication Source Date Status Trade in Value Added: 2005-2015, experimental statistics
Trade in Value Added: 1995-2018, experimental statistics
Organisation for Economic Co-operation and Development
17 November 2021 Unknown
Goods and Services (BPM6): Exports and imports of goods and services, annual, 2005-2020
Goods and Services (BPM6): Exports and imports of goods and services, annual, 2005-2021
United Nations Conference on Trade and Development
TBC 2022 Unknown
World Investment Report 2021 World Investment Report 2022 United Nations Conference on Trade and Development
TBC 2022 Unknown

83
Glossary Exports – sales of goods and services by residents of the reporting country to non-residents. See also ‘Physical movement (or customs) basis and ‘Change of ownership (or Balance of Payments) basis’ below.
Imports – purchases of goods and services by residents of the reporting country from non-residents. See also ‘Physical movement (or customs) basis and ‘Change of ownership (or Balance of Payments) basis’ below.
Trade balance – the difference between exports and imports.
Trade surplus – occurs when the value of a country’s exports exceeds that of its imports.
Trade deficit – occurs when the value of a country’s imports exceeds that of its exports.
Bilateral or ‘total’ trade – the value of total trade between two countries (i.e. exports plus imports combined).
Physical movement (or customs) basis – a good is recorded as an export (import) if it physically leaves (enters) the economic territory of a country. The HMRC trade in goods data in this document are reported on this basis.
Change of ownership (or Balance of Payments) basis – a good leaving (entering) the economic territory of a country is recorded as an export (import) only if it has changed ownership between the resident of the reporting country and non-residents. The ONS goods data in this document are reported on this basis – hence they are not directly comparable with the HMRC data which are based on the ‘physical movement’ principle. Trade in services involves no physical movement (services are intangible) so services data are always reported on a ‘change of ownership’ (Balance of Payments) basis
Current prices – prices at which goods and services are currently being sold in the market i.e. as they were at the time of measurement and not adjusted for inflation
Constant prices – adjusted prices so that changes over time exclude the effect of price inflation.
Inflation – the rate at which prices for goods and services increase or decrease over a period of time.
Gross Domestic Product (GDP) – 41T51T51Tthe total value of all goods and services produced within a country.
Balance of Payments (BoP) – a set of accounts summarising all the transactions of an economy with the rest of the world.
Current account – part of the BoP. It measures the difference between what a country earns and spends with the rest of the world. It comprises: a) the trade account (e.g. UK

84
exports and imports of goods and services), b) the primary income account (e.g. income earned by UK residents as a result of their investment abroad net of income earned by foreign residents from their investments in the UK), and c) secondary income (e.g. net transfers of money between the UK and other countries (for example, foreign aid and official payments to and receipts from EU institutions and other international bodies).
Foreign Direct Investment (FDI) – investment made by an entity resident in one economy (‘direct investor’) to acquire a ‘lasting interest’ in an enterprise operating in another economy. The ‘lasting interest’ is deemed to exist if the direct investor acquires at least 10% of equity, or equivalently 10% of the voting rights, of the company.
FDI stock – the accumulated value of all previous investments at the end of a reference period. For example, UK outward FDI stock refers to the total value of UK residents’ FDI abroad and UK inward FDI stock refers to the total value of FDI by non-UK resident investors in the UK.
Special Purpose Entities – refers to entities such as financing subsidiaries, shell companies and conduits, which typically do not conduct any notable operations in the country in which they are resident other than to pass through investments from their parent company to an affiliate in another country.
Greenfield capital investment – the creation of a firm from scratch by one or more non-resident investors; an expansion of the capital stock, directly generating new economic activity and jobs.
Trade in Value Added (TiVA) – A new statistical approach for measuring trade. Unlike traditional (‘gross’) trade statistics, TiVA decomposes gross exports into domestic and foreign value added. Taking the UK as an example, the domestic value added in gross exports measures the value added that is generated domestically (i.e. in the UK) by the UK exporting industry, UK upstream suppliers and re-imports. The foreign value added measures the contribution that foreign suppliers make to the total value of UK exports. A high share of foreign (imported) value added suggests that a country is highly integrated into global supply chains i.e. it relies on imported inputs for the production of its exports.
Backward linkages in exports – measure how dependent domestic exporters are on foreign inputs (raw materials, machinery etc.) for the production of their exports.
Trade asymmetries – Discrepancies in bilateral trade statistics reported by countries. For example, the value of UK exports to the United States (reported by the UK) does not match the value of US imports from the UK (reported by the United States).
FDI asymmetries – Discrepancies in bilateral FDI statistics reported by countries. For example, the value of UK outward FDI stock in the United States (reported by the UK) does not match the value of inward FDI stock from the UK (reported by the United States).
85
Sampling error – sampling allows estimation for the whole population without having to survey the whole population. A sampling error is the difference between the sampled and whole population.
Non-sampling error – a catch-all term for the deviations from the true value that are not a function of the sample chosen, including coverage errors (error in accurately representing the whole population from the sample), response errors (inaccurate answers from respondents), recording errors (where data are coded incorrectly during collection).
CIF (Cost, Insurance and Freight) – Imports are typically valued by customs authorities on a CIF basis (i.e. include freight and insurance costs of transporting the goods to a country) while exports are valued on a FOB basis (exclude freight and insurance costs). This can cause an asymmetry in bilateral trade in goods statistics as the value of imports is higher than the value of mirror exports. The value required for Balance of Payments purposes is the value of goods at the point of export (that is, the customs border of the exporting country) rather than the value of goods as they arrive in the country. Therefore, the ONS makes adjustments (deducts freight and insurance costs from the values recorded by HMRC) to convert trade in goods statistics to the basis required for Balance of Payments.
FOB (Free On Board) – see CIF above.
EBOPS (Extended Balance of Payments Services classification) – the classification system for trade in services used in Balance of Payments statistics.
Seasonal adjustment The purpose of seasonal adjustment is to remove systematic calendar-related variation associated with the time of the year, that is, seasonal effects. This facilitates comparisons between consecutive time periods. Further detail can be found on the ONS website.

86
gov.uk/dit
DIT The UK’s Department for International Trade (DIT) has overall responsibility for promoting UK trade across the world and attracting foreign investment to our economy. We are a specialised government body with responsibility for negotiating international trade policy, supporting business, as well as delivering an outward-looking trade diplomacy strategy.
Disclaimer Whereas every effort has been made to ensure that the information in this document is accurate the Department for International Trade does not accept liability for any errors, omissions or misleading statements, and no warranty is given or responsibility accepted as to the standing of any individual, firm, company or other organisation mentioned.
Copyright © Crown Copyright 2020 This publication is licensed under the terms of Open Government. Licence v3.0 except where otherwise stated. To view this licence visit: nationalarchives.gov.uk/doc/open-government-licence/version/3 Where we have identified any third party copyright information you will need to obtain permission from the copyright holder(s) concerned. Any enquiries regarding this publication should be sent to us at [email protected]
Published November 2021 By Department for International Trade