Embed Size (px)
Citation preview

Tracking Water Use to Cut CostsBusiness Resource Efficiency Guide
Home 1 Why is saving water important?
2 A six-step procedure
3 Dealing with more complex sites
4 Action plan 5 Further information
Appendices

Tracking Water Use to Cut CostsWRAP II
Our vision is a world without waste, where resources are used sustainably.
We work with businesses and individuals to help them reap the benefits of reducing waste, develop sustainable products and use resources in an efficient way.
Find out more from the WRAP Resource Efficiency Helpline on 0808 100 2040 or at www.wrap.org.uk
1 Why is saving water important? 2 1.1 The true cost of water 2 1.2 Understanding where costs arise 2 1.3 What is a water balance? 4 1.4 Why produce a water balance? 6 1.5 How to use this guide 6
2 A six-step procedure for constructing/using 8 a water balance 2.1 Step 1 – Obtaining top-level commitment 8 and assessing the resources required 2.2 Step 2 – A preliminary review 8 2.3 Step 3 – Drawing up a water balance 15 2.4 Step 4 – Adding detail to the water balance 17 2.5 Step 5 – Using the water balance to save 30 money 2.6 Step 6 – Continuous improvement 33
3 Dealing with more complex sites 34 3.1 Gathering more data 34 3.2 Finding out more about effluent flows 34 3.3 Using the water balance to save money 40
4 Action plan 43
5 Further information 44
Appendix A: UK charging schemes 46
Appendix B: Where do businesses use water? 58
Appendix C: Unit operations for a boiler and 64 cooling tower
Appendix D: Example water balances 65
Appendix E: Producing and using site 70 drainage plans
Appendix F: Calculating water flows for cooling 71 towers and steam relief valves
Appendix G: Determining pollutant loads 73
Contents
Home 1 Why is saving water important?
2 A six-step procedure
3 Dealing with more complex sites
4 Action plan 5 Further information
Appendices

Tracking Water Use to Cut CostsWRAP 1
1 Why is saving water important?
2 A six-step procedure
3 Dealing with more complex sites
4 Action plan 5 Further information
AppendicesHome
Summary
Adopting a systematic approach to water reduction can typically result in around 30% water savings if no measures have previously been implemented. A water balance is a management tool that provides managers with an overview of the major uses of water on their company’s site, irrespective of the company’s activity. When used to control water use and effluent generation, a water balance can help companies and organisations of all sizes and types to reduce water use, cut costs and increase profits.
This guide describes a six-step procedure for constructing a water balance and explains how this can help you to identify water and cost saving opportunities.
The step-by-step approach to reducing water use described in this guide involves:
1. Obtaining commitment and resources.
2. A preliminary review.
3. Drawing up a water balance.
4. Adding detail to the water balance.
5. Using the water balance to save money.
6. Continuous improvement.
Checklists and worksheets are provided to help you investigate your water use and effluent sources. Examples of cost savings already achieved by companies are given throughout the guide.

Tracking Water Use to Cut CostsWRAP 2
Home 2 A six-step procedure
3 Dealing with more complex sites
4 Action plan 5 Further information
Appendices1 Why is saving water important?
1 Why is saving water important?
Water is becoming an increasingly expensive resource with mains, sewerage and trade effluent charges rising. However, introducing water efficiency measures is one of the easiest and most inexpensive ways to achieve cost savings.
Most companies and organisations know how much water they use, but may not always use this knowledge to help them reduce the amount of water consumed. Companies that adopt a systematic approach to water reduction typically achieve a 30% decrease in the amount of water they use. By using less water, companies save money on both water supply and wastewater disposal. Taking action to save water may also allow companies to recover raw materials or product previously lost in effluent streams.
This guide applies to both industrial and commercial sites and will help you work out where water is being used and where less water could be used. Savings can be made by companies of any size or type – including companies that use comparatively little water per site or per person.
Some sites have a finite water supply (e.g. from the mains water distribution system or groundwater and surface water sources), making it difficult to increase supply to meet any rise in demand. Increased availability may also be expensive. Managing water more efficiently can prevent any potential site expansion being limited by the availability of water or the need for an increased water supply.
1.1 The true cost of waterThe type of water used on site and the type of wastewater generated by site operations/activities will determine how much your company pays for water supply and wastewater disposal. Table 1 lists the different types of water and wastewater.
Table 1: Types of water and wastewater in the UK
There are a number of charging schemes for water and wastewater (sewerage and trade effluent charges) in the UK. The amount paid depends on:
¡ the service provider;¡ the size of the meter;¡ the tariff structure agreed with your service
provider; andthe year – unit costs are reviewed on an ¡annual basis.
Appendix A gives details of individual charging schemes and how to understand your bills.
1.2 Understanding where costs ariseAs well as easily identified costs such as charges for water use, sewerage, surface water and trade effluent, there are many hidden costs associated with water use and the disposal of wastewater. The true cost of water may be more than three times the total amount charged for supply and disposal. Figure 1 shows the elements making up the true cost of water.
Companies that adopt a systematic approach to water reduction typically achieve a 30% decrease in the amount of water they use.
Water sources Wastewater types
Mains water ¡(wholesome* and unwholesome)
Water abstracted ¡from groundwater (borehole) and surface water
Domestic ¡wastewater (sewage)
Trade effluent ¡
Surface drainage ¡(roof and site run-off)
Discharge to ¡surface water and groundwater
* Drinkable.

Tracking Water Use to Cut CostsWRAP 3
Home 2 A six-step procedure
3 Dealing with more complex sites
4 Action plan 5 Further information
Appendices1 Why is saving water important?
Hidden costs can include:
¡ the energy costs associated with heating/cooling water prior to use;
¡ lost product or raw materials in effluent, resulting in sale losses and increased effluent strength leading to higher trade effluent charges;
¡ water treatment prior to use (e.g. ion exchange or membrane technologies such as reverse osmosis), including the cost of chemicals for regeneration and replacement columns/packing materials, and the labour costs incurred in running and maintaining these systems;
¡ pumping costs including energy, labour and maintenance costs; and
¡ wastewater treatment prior to re-use or discharge, including the cost of acid/alkali for pH adjustment, flocculants, coagulants, pumping costs, labour and maintenance.
Environmental review identifies true effluent costs
An environmental review at a chemicals company revealed that total effluent costs were £23,000/year and not £4,000/year as previously thought. The review also showed that, as well as paying extra effluent charges, the company was losing saleable product in the effluent. Following improvements and procedural changes, the company reduced its effluent charges by £3,000/year and saved £8,500/year through product recovery from the effluent.
¡ Water charges¡ Sewerage charges¡ Effluent charges
¡ Cost of energy to heat water
¡ Cost of chemicals for water treatment
¡ Cost of wasted energy (e.g. pumping)
¡ Cost of chemicals for effluent treatment
¡ Cost of raw materials/product in effluent
¡ Cost of labour
Hidden costs
Easily identified costs
Figure 1: The true cost of water

Tracking Water Use to Cut CostsWRAP 4
Home 2 A six-step procedure
3 Dealing with more complex sites
4 Action plan 5 Further information
Appendices1 Why is saving water important?
1.2.1 Added value waterWater treated before use has an added value because time and money have already been spent on it before it is used for its main purpose. Table 2 summarises typical costs of water.
Table 2: Comparable costs of different water types
1.3 What is a water balance?A water balance is a numerical account used to show where water enters and leaves your business, and where it is used within the business. It typically contains information about the amount of water used by each main process and, for some processes, can be very detailed. Presenting the water balance as a diagram makes it easy to understand and use as a management tool.
A water balance is based on the simple concept: what goes in must come out... somewhere (see Figure 2).
It is best to start by looking at your company as a whole and then adding details as you go along. It is also helpful to think of your site or company as a series of blocks, with each block representing an activity or location with water inputs and outputs. Figure 3 shows water inputs and outputs for a fairly simple site; Figure 4 is a block representation of this site.
Appendix B gives examples of water use in a number of industrial and commercial sectors.
Water type Typical cost
UK mains supply £0.60 – £1.83/m3*
Chlorinated water £0.85 – £2.20/m3
Softened water £1 – £2.16/m3
Demineralised/deionised water
£2 – £3.70/m3
Condensate – gas heated **
£3.70 – £4.86/m3
Steam – gas heated ** £29.71 – £30.87/tonne
* UK mains supply based on standard 2011/12 tariffs. ** Energy costs at 3.6p/kWh for gas and boiler efficiency
of 90%.
1 6 4 0 2
1 6 4 0 2
Water in the product
Evaporationand steam
Evaporationand steam
Liquidraw materials
Meter
Domestic wastewater/trade effluent
Con
den
sate
reco
very
Leaks Boiler blowdown/condensate
Laundry andwashrooms
Toilets, handbasins and showers
Washing machinesTumble dryers
FactoryEquipment washingWater added to
productBoiler
Steam generationCondensate recoveryWater softening
Shop and canteenToilets and sinksDishwasherFood preparation
Mains water
No
No
No
No
1. Can you eliminate water use at source?
2. Can you reduce the amount of water used?
3. Can you re-use water/wastewater?
4. Can you recycle/recover water/wastewater?
Calculate the cost of disposal
Yes
Implement water reduction
Evaporation
Water in Product
Leaks to ground Effluent
Domestic wastewater/trade effluent
Factorylaundry and washrooms Factory
Factory shop and canteen
Water in the product
Liquidraw materials
Evaporationand steam
Watersupply
Meter
Figure 2: Water mass balance

Tracking Water Use to Cut CostsWRAP 5
Home 2 A six-step procedure
3 Dealing with more complex sites
4 Action plan 5 Further information
Appendices1 Why is saving water important?
1 6 4 0 2
1 6 4 0 2
Water in the product
Evaporationand steam
Evaporationand steam
Liquidraw materials
Meter
Domestic wastewater/trade effluent
Con
den
sate
reco
very
Leaks Boiler blowdown/condensate
Laundry andwashrooms
Toilets, handbasins and showers
Washing machinesTumble dryers
FactoryEquipment washingWater added to
productBoiler
Steam generationCondensate recoveryWater softening
Shop and canteenToilets and sinksDishwasherFood preparation
Mains water
No
No
No
No
1. Can you eliminate water use at source?
2. Can you reduce the amount of water used?
3. Can you re-use water/wastewater?
4. Can you recycle/recover water/wastewater?
Calculate the cost of disposal
Yes
Implement water reduction
Evaporation
Water in Product
Leaks to ground Effluent
Domestic wastewater/trade effluent
Factorylaundry and washrooms Factory
Factory shop and canteen
Water in the product
Liquidraw materials
Evaporationand steam
Watersupply
Meter
Figure 3: Water inputs and outputs for an example site
1 6 4 0 2
1 6 4 0 2
Water in the product
Evaporationand steam
Evaporationand steam
Liquidraw materials
Meter
Domestic wastewater/trade effluent
Con
den
sate
reco
very
Leaks Boiler blowdown/condensate
Laundry andwashrooms
Toilets, handbasins and showers
Washing machinesTumble dryers
FactoryEquipment washingWater added to
productBoiler
Steam generationCondensate recoveryWater softening
Shop and canteenToilets and sinksDishwasherFood preparation
Mains water
No
No
No
No
1. Can you eliminate water use at source?
2. Can you reduce the amount of water used?
3. Can you re-use water/wastewater?
4. Can you recycle/recover water/wastewater?
Calculate the cost of disposal
Yes
Implement water reduction
Evaporation
Water in Product
Leaks to ground Effluent
Domestic wastewater/trade effluent
Factorylaundry and washrooms Factory
Factory shop and canteen
Water in the product
Liquidraw materials
Evaporationand steam
Watersupply
Meter
Figure 4: Block representation of water inputs and outputs for an example site

Tracking Water Use to Cut CostsWRAP 6
Home 2 A six-step procedure
3 Dealing with more complex sites
4 Action plan 5 Further information
Appendices1 Why is saving water important?
1.4 Why produce a water balance?A water balance helps you to:
¡ understand and manage water and effluent efficiently;
¡ identify the areas with the greatest opportunities for cost savings; anddetect leaks. ¡
Small brewery saves money by stopping leaksMonitoring water use allowed a brewer to discover a significant water leak, which was due to three faulty control valves. The valves were replaced at a total cost of £400, leading to reduced water use of 10,800m3/year. This represented a saving of £13,000/year in water and trade effluent charges.
The main benefits of using a water balance to identify and implement opportunities to reduce water use are:
¡ reductions in:water supply costs; -on-site water treatment costs; -on-site effluent treatment costs, -including chemicals and capital depreciation;effluent and sewage disposal costs; -wasted raw materials or products; and -management and handling costs (e.g. -pumping, maintenance and heating);
¡ improved compliance with current and future environmental regulations;
¡ better relationships with regulators, employees, the general public and the local community;
¡ improved environmental management; andgreater employee awareness of ¡environmental issues and the importance of waste minimisation to the company.
RememberYou can’t manage what you don’t measure.
The waste hierarchy is a framework prioritising the most environmentally desirable options for waste. The principles of the waste hierarchy when applied to water (see Figure 5) consist of four levels of waste management. Apply this hierarchy to each process/area that uses water or generates wastewater at your site.
1.5 How to use this guideThis guide explains how to draw up a water balance for your site and then use it to save money by reducing water use.
For small to medium-sized sites, this involves following the simple step-by-step procedure described in Section 2. This procedure is extended in Section 3 to cater for larger, more complex sites. Section 4 presents an action plan applicable to all sites.
1 6 4 0 2
1 6 4 0 2
Water in the product
Evaporationand steam
Evaporationand steam
Liquidraw materials
Meter
Domestic wastewater/trade effluent
Con
den
sate
reco
very
Leaks Boiler blowdown/condensate
Laundry andwashrooms
Toilets, handbasins and showers
Washing machinesTumble dryers
FactoryEquipment washingWater added to
productBoiler
Steam generationCondensate recoveryWater softening
Shop and canteenToilets and sinksDishwasherFood preparation
Mains water
No
No
No
No
1. Can you eliminate water use at source?
2. Can you reduce the amount of water used?
3. Can you re-use water/wastewater?
4. Can you recycle/recover water/wastewater?
Calculate the cost of disposal
Yes
Implement water reduction
Evaporation
Water in Product
Leaks to ground Effluent
Domestic wastewater/trade effluent
Factorylaundry and washrooms Factory
Factory shop and canteen
Water in the product
Liquidraw materials
Evaporationand steam
Watersupply
Meter
Figure 5: Waste hierarchy applied to water

Tracking Water Use to Cut CostsWRAP 7
Home 2 A six-step procedure
3 Dealing with more complex sites
4 Action plan 5 Further information
Appendices1 Why is saving water important?
In this guide, the term domestic wastewater is used for domestic water and sewage discharged at the domestic sewerage rate. Trade effluent refers to effluents from industrial processes on which trade effluent charges are levied, based on the strength as well as the volume of effluent.
The step-by-step approach to reducing water use described in this guide involves:
1. Obtaining commitment and resources.
2. A preliminary review.
3. Drawing up a water balance.
4. Adding detail to the water balance.
5. Using the water balance to save money.
6. Continuous improvement.
You may want to use this guide to help drive forward a water saving campaign. Drawing up a water balance for your site forms part of the detail of a typical water saving campaign (see Figure 6). This process is broadly similar for industrial and commercial sites and usually entails four phases.
Wholesale food distributor saves money at over 100 sitesA wholesale food distributor fitted simple water saving devices at 109 of its UK outlets. For an average cost of around £675/site, water use and wastewater production were reduced by 65% overall. Each site saved on average around £980/year, giving a total reduction of £106,700/year.
Nearly 1% of turnover saved by recycling process effluent
A Humberside company, employing 180 people, investigated cost-saving opportunities while seeking improvements in environmental performance. Investment of £20,000 in new pipework and tanks allowed a liquid waste stream to be recycled. This has enabled the company to save £20,000/year in effluent charges and £200,000/year in increased yield and reduced disposal costs.
Figure 6: The four phases of a typical water saving campaign
PHASE 1 – Initiation
Obtain commitment from senior ¡management.
Involve staff and appoint the leader ¡(‘champion’) of the water saving team.
Find out about water saving devices and ¡their application.
Talk to other interested people in your ¡company.
Develop a simple programme. ¡
Allocate sufficient resources. ¡
PHASE 2 – Water use survey and development of a water balance
Identify where, how and why water is used. ¡
Identify the water quality requirement at ¡each point of use.
Determine the water quality and ¡availability at each point of discharge.
PHASE 3 – Evaluation of water saving options
Evaluate current and future water costs ¡by area or item of equipment.
Identify and evaluate cost-effective water ¡saving devices and practices.
Carry out trials of likely options. ¡
PHASE 4 – Implementation
Train staff (if necessary). ¡
Implement cost-effective water saving ¡devices and practices.
Monitor the implemented devices and ¡practices.
Communicate successes and savings to ¡employees.
Obtain feedback from staff. ¡

Tracking Water Use to Cut CostsWRAP 8
Home 1 Why is saving water important?
3 Dealing with more complex sites
4 Action plan 5 Further information
Appendices2 A six-step procedure
2 A six-step procedure for constructing/using a water balance
Use the simple six-step procedure described below to construct a water balance for your site. Then use your water balance to identify opportunities to make significant cost savings by reducing water use and wastewater/effluent generation.
2.1 Step 1 – Obtaining top-level commitment and assessing the resources required
2.1.1 Obtaining top-level commitmentFor your water efficiency programme to be a success, you will need commitment from senior management. This should be obtained at an early stage – particularly if you do not have the necessary authority to commit resources to produce a detailed water balance or to investigate and implement water saving opportunities.
It may be easier to obtain top-level commitment once you have started to develop your water balance and are in a position to:¡ highlight current costs;¡ identify the need for more information;¡ suggest the scope for potential savings;
andhighlight some ‘quick win’ opportunities. ¡
Your chances of success will be significantly improved if you can also suggest some no-cost and low-cost water saving measures, together with the anticipated costs and savings.
Examples from other companies may be appropriate, but specific potential projects for your site will carry more weight. Examples might include fitting passive infrared (PIR) controls in the men’s toilets or fitting water saving taps.
2.1.2 Assessing the staff and resources required
The time and effort needed to produce a water balance depends on your site. On a simple site, it could take only a few hours. On a more complicated site, it could take significantly longer.
Allocation of resources depends on the scale of the process or the area to be investigated (e.g. one person working part-time or a mixed team of engineering, production and environmental staff). Some companies have successfully employed students on work placements to gather data.
Work experience student helps brewery save moneyA brewer employed a graduate trainee to map the water system, supervise the installation of new water meters for each main production/office area, and monitor subsequent consumption. The waste reduction initiative led to water saving measures and cost savings of nearly £100,000/year.
2.2 Step 2 – A preliminary reviewYour preliminary review should consist of:
¡ gathering existing data (e.g. annual water use and costs);
¡ a brief assessment of the major gaps in your information; and
¡ deciding how detailed a water balance is appropriate for your company. This will involve:
estimating potential cost savings from -water saving measures; anddeciding your budget for obtaining -missing information and/or constructing a water balance.
For each process or area, use the checklist given in Figure 7 to review water use and wastewater generation.
For your water efficiency programme to be a success, you will need commitment from senior management.

Tracking Water Use to Cut CostsWRAP 9
Home 1 Why is saving water important?
3 Dealing with more complex sites
4 Action plan 5 Further information
Appendices2 A six-step procedure
Walk around your site or building. Use a note-pad to make sketches and notes on activities and operations that use water. Tell other people what you are doing and ask them for their views on water use and current practices. Your tour of the site and the information you obtain may highlight some ‘fast start’ projects that will help you to secure top-level commitment.
Figure 7: Example water review checklist
Checklist Comment
Process/areaIs the process/activity really necessary? ¡
Water useIs it necessary to use water for the process/ ¡activity or is there a cost-effective alternative?
How can I reduce water use? ¡
Could I use lower quality water? ¡
Can I recover and re-use water anywhere? ¡
Is the use authorised and legal? ¡
WastewaterIs it necessary to produce this wastewater/ ¡effluent?
Is clean water going down the drain and, ¡if so, why?
Is the discharge authorised and legal? ¡
Can the wastewater/effluent be re-used ¡in a process or used for lower grade duties (e.g. cleaning)?
Would it be cost-effective to treat the ¡wastewater/effluent on site for re-use?

Tracking Water Use to Cut CostsWRAP 10
Home 1 Why is saving water important?
3 Dealing with more complex sites
4 Action plan 5 Further information
Appendices2 A six-step procedure
2.2.1 Gather existing dataTable 3 provides a checklist of the type of information you will need to produce a water balance.
Start by collecting information that already exists within the company. Check whether the information appears accurate and consistent. For example, check the meter readings on your latest water bill and find out when your water meter(s) was last calibrated.
To reduce the risk of errors in your calculations, use the same units for water use (e.g. litres or m3) depending on the size of your flows.Water volume conversion
1m3 = 1,000 litres = 220 gallons
1 gallon = 0.0045m3 or 4.5 litres
Table 3: Useful existing data
Type of data Description
Water supply and treatment costs Water supply bills ¡
Abstraction licence fee ¡
Pumping, chemicals, operating, maintenance and ¡labour costs
Water treatment System type and capacity ¡
Water and effluent quantities Meter readings in and out of site, on individual ¡machines/process areas
Data on rainfall or groundwater inputs ¡
Water and effluent quality Analysis of on-site water treatment and effluent ¡samples (either in-house, by external laboratories or by water company)
Equipment specifications from suppliers ¡
Effluent treatment costs Pumping, chemicals, operating, maintenance and ¡labour costs
Effluent discharge costs Trade effluent and sewerage bills ¡
Charges for discharge to controlled waters ¡
Effluent removed off site in tankers Waste disposal contractor’s bills for tanker ¡transport, treatment and disposal
Quantities and quality of tankered liquids ¡
Site plans Water distribution and drainage plans, including ¡water sources and location of meters
Details of process or unit operation Process flow and pipe/process technical drawings, ¡including manufacturers’ specifications

Tracking Water Use to Cut CostsWRAP 11
Home 1 Why is saving water important?
3 Dealing with more complex sites
4 Action plan 5 Further information
Appendices2 A six-step procedure
Locate your water meterMost commercial and industrial properties have a metered water supply. The water meter is usually located by the boundary of the property, often near a road. If the site has more than one incoming water mains, each supply should be fitted with a meter.
As a minimum, your mains supply meter(s) will allow you to monitor water consumption of the site on a routine basis (daily, weekly or monthly).
How to read your water meterMetered companies are responsible for the water use recorded on their meter – including wastage and leaks.
Figure 8 shows a typical water meter. The white digits in the ‘blue box’ display cubic metres (m3) and those digits shown in red display 1/10th (100 litres) and 1/100th (10 litres) of a cubic metre. Thus, the reading on the example meter shown in Figure 8 is 2004.87m3. The figures shown in the dials provide a more detailed reading than 1/100th of a cubic metre.
Other ways of measuring flow are described in Section 2.4.5. Section 3.2.2 contains information about flow meters.
Correct meter size results in cost savingsCorrecting the size of its water meter for current operations meant that a carpet manufacturer reduced its annual water supply costs by 89% (£10,530).
What to do with your meter dataRecording meter readings on a regular basis (daily, weekly or monthly) will allow you to identify trends in water consumption.
Recording water consumption in a graphic format makes it much easier to analyse your pattern of water usage.
To ensure you compare like with like, it is a good idea to normalise your data. For example, express water use in terms of production (m3 water per tonne of product) or workforce (m3 water per employee). This benchmark can be used to identify excess use or to demonstrate genuine reductions in water use.
Figure 9 and Figure 10 present water consumption data for an example site. Although the data are recorded clearly in a suitable format in the table (Figure 9), the graph presented in Figure 10 shows the water consumption trends more clearly. The increase in water use from March to August becomes very apparent.
SERIAL NUMBER
m3
CLASS:Qn m 3/hPn bar
Cert N o.
0.0001
0.001
12
3456
7
89 0
123
456789 0
Figure 8: Typical water meter

Tracking Water Use to Cut CostsWRAP 12
Home 1 Why is saving water important?
3 Dealing with more complex sites
4 Action plan 5 Further information
Appendices2 A six-step procedure
1 6 4 0 2
Water in the product
Total
84 m3/day
79 m3/day
Evaporationand steam
Evaporationand steam Liquid raw materials
Meter
Domestic wastewater/trade effluent
Con
den
sate
reco
very
Leaks Boiler blowdown/condensate
Laundry andwashrooms
Toilets, handbasins and showers
Washing machinesTumble dryers
FactoryEquipment washingWater added to
productBoiler
Steam generationCondensate recoveryWater softening
Shop and canteenToilets and sinksDishwasherFood preparation
85 m3/day
5 m3/day
65 m3/day
75 m3/day
1 m3/day
? ?
?
?
?
?
Key ? To be assessed
Sub-meterInputsOutputsRecirculation
Mains water
(a)
(b)
1 6 4 0 2
Water in the product
Total
84 m3/day
79 m3/day
Evaporationand steam
Evaporationand steam
Liquidraw materials
Meter
Domestic wastewater/trade effluent
Con
den
sate
reco
very
Leaks Boiler blowdown/condensate
Laundry andwashrooms
Toilets, handbasins and showers
Washing machinesTumble dryers
FactoryEquipment washingWater added to
productBoiler
Steam generationCondensate recoveryWater softening
Shop and canteenToilets and sinksDishwasherFood preparation
70 m3/day
85 m3/day
5 m3/day≈ 5 m3/day ≈ 4 m3/day
5 m3/day 4 m3/day
1 m3/day
65 m3/day
5 m3/day
75 m3/day
1 m3/day
Key
Sub-meterInputsOutputsRecirculation
0.05 m 3/day
Mains water
Values from earlier assessmentshown in Fig 12Newly assessed values
700
600
500
400
300
200
100
0
Wat
erus
e(m
3 )
2008 2009 2010 2011
Sep Oct Nov Dec AugJulJunMayAprMarFebJan
Figure 10: Graph showing trends in water use at the example site
Figure 9: Example of metered water consumption at an example site
Month Water use (m3)
2008 2009 2010 2011
January 170 140 213
February 153 127 220
March 170 150 317
April 160 147 307
May 170 150 377
June 103 120 560
July 93 120 573
August 103 120 573
September 177 193 187
October 180 200 197
November 177 193 187
December 173 147 213

Tracking Water Use to Cut CostsWRAP 13
Home 1 Why is saving water important?
3 Dealing with more complex sites
4 Action plan 5 Further information
Appendices2 A six-step procedure
WRAP’s monitoring tool is available at www.wrap.org.uk and can help you to easily record and track where water is being used in your company and analyse your findings. There are monitoring spreadsheets for recording water consumption data once a week, five days a week and seven days a week.
2.2.2 Are there major gaps in your knowledge?
In your preliminary review, aim to account for at least 80% of the water you pay for – including any major leaks. Examine your data and decide whether your overview of water use and costs is adequate or whether there are major gaps.
If more information is needed, it is likely to be in specific areas. Investigating your main uses of water (or higher value water – see Section 1.2.1) is likely to provide most of your cost saving opportunities.
Begin to develop a picture of your business – along the lines of Figure 3 (see Section 1) – as soon as possible. This will help you to identify gaps in available information and to focus your efforts. You will develop the picture and add detail during Steps 3 and 4 (see Sections 2.3 and 2.4 respectively).
You may prefer to leave the decision on what extra information and measurements you need until you have produced your first water balance diagram (i.e. the equivalent of Figure 4 complete with numerical data). You will achieve this in Steps 3 and 4.
2.2.3 How detailed a water balance should you produce?
A simple water balance covering the few largest water-using activities may be sufficient to control and reduce major uses of water and related resources. You need to decide how detailed a water balance is likely to be cost-effective for your company. How far to go is a matter of judgement, about which general advice is given below. You may
also wish, at this stage, to define the scope of future work (e.g. whether to analyse the whole site or to consider one area in more detail).
To decide how detailed your water balance should be, consider the potential benefits versus the cost.
¡ What is the likelihood of identifying cost-effective opportunities to save water?
¡ How much money could you save?How much will it cost to investigate water ¡use in more detail?
For sites with significant water consumption, the potential savings will be more than sufficient to justify drawing up a detailed water balance.
Water balance leads to halving of mains water consumptionA soap manufacturer used a systematic approach to identify and quantify water use, and then implemented measures to reduce mains water consumption. A detailed water survey revealed how and where water was being used. A water balance was then prepared using data obtained from existing invoices and meters. A 50% reduction in mains water use and associated cost savings were achieved over a period of four years through a combination of good housekeeping measures and plant modifications.
For sites that have relatively low water use, an alternative criterion for deciding whether to produce a detailed water balance is the size of annual water and effluent bills. For example, a multi-site organisation decided not to investigate water saving opportunities at sites where water and effluent bills were less than £300/year. However, the installation of simple, water saving devices, such as percussion (push) taps, toilet cistern volume adjusters and flushing controls, at over two-thirds of its sites produced significant overall cost savings.

Tracking Water Use to Cut CostsWRAP 14
Home 1 Why is saving water important?
3 Dealing with more complex sites
4 Action plan 5 Further information
Appendices2 A six-step procedure
2.2.4 Estimating potential savingsCost savings can arise from reductions in:
¡ water use (e.g. in domestic or process use);¡ on-site water pumping and associated
maintenance;¡ water treatment (e.g. lower chemical costs
and filter backwash);¡ water heating or cooling requirements;¡ effluent pumping;¡ effluent treatment; and
effluent discharge. ¡
As a general rule of thumb:
¡ if no water saving measures have so far been implemented, savings could be 30% or more of your water-related costs;
¡ if you have implemented some water saving projects but not applied a systematic approach, you may still make some significant savings, especially where higher value water consumption is reduced; anddo not forget the possibility of reducing the ¡amount of raw materials and product lost in effluent. This can be significant.
Many people use at least twice as much water as is needed to perform a given task (e.g. washing down a piece of equipment with a continuously running hose). Typical reductions in water use for various projects are shown in Table 4.
2.2.5 Deciding your budgetOnce you have estimated the potential savings, use your company’s method for new project appraisal to determine how much money might be available to obtain missing information and/or construct a water balance.
Identify the maximum project budgetIdentification of the maximum project budget can help to determine the areas on which to concentrate. This helps to assess and eliminate projects that are unlikely to be cost-effective.
Maximum project budget (£) = Calculated saving (£/year) × Required payback period (years)
Table 4: Typical achievable reductions in water use
Water saving initiative Typical reduction*
Per project Per site
Commercial applicationsToilets, men’s toilets, showers and taps 40% (combined)
Industrial applications
Closed loop recycle
Closed loop recycle with treatment
Automatic shut-off
Countercurrent rinsing
Spray/jet upgrades
Re-use of wash water
Scrapers
Cleaning-in-place (CIP)
Pressure reduction
Cooling tower heat load reduction
90%
60%
15%
40%
20%
50%
30%
40%
Variable
Variable
* Assuming no water measures have previously been put in place.

Tracking Water Use to Cut CostsWRAP 15
Home 1 Why is saving water important?
3 Dealing with more complex sites
4 Action plan 5 Further information
Appendices2 A six-step procedure
2.3 Step 3 – Drawing up a water balanceThis step involves:
¡ producing a simple pictorial representation of the site;
¡ translating this picture into a block diagram; andadding volumes of major water and ¡wastewater flows to your block diagram to produce an initial water balance.
2.3.1 Produce a pictorial representation of your site
For any water balance, the first step is to produce a pictorial representation of your site. All premises – whether a complex site or a single building – can be described by a series of activities or operations. Figure 3 in Section 1 shows a typical example.
Identify and mark on your picture:
¡ major uses of water;¡ the location of on-site water meters (there
is usually one on the mains supply entering a site); andthe points at which domestic wastewater ¡and/or trade effluent enter the site drainage system.
For more complex sites, use a site plan and process flow diagrams to help you produce a pictorial representation of the site.
When drawing your picture, remember that:
¡ you are looking for major water-using activities as part of an operation, process or a piece of equipment where:
water enters; -a function occurs; and -water or effluent leaves; and -
inputs and outputs may be in a different ¡form (e.g. liquid raw materials, steam and product). To help you, examples of water-using activities in a hotel and on an industrial site are shown in Appendix C.
Define major water-using operations by the type of activity carried out, such as cooking or drying (i.e. removing water from product). Alternatively, designate activity areas according to boundaries where flows can be measured easily. If a water-using operation becomes unmanageable, try splitting it into smaller units.

Tracking Water Use to Cut CostsWRAP 16
Home 1 Why is saving water important?
3 Dealing with more complex sites
4 Action plan 5 Further information
Appendices2 A six-step procedure
2.3.2 Draw a block diagramNow translate your picture into a more manageable form by drawing a block diagram that indicates the relationships between operations. Figure 11 shows the block representation of Figure 3. The major water-using activities at this site are the laundry/washrooms, the factory and the shop/canteen. Each major activity on the site is represented by a box, which lists the significant water uses. Water feeding to the different activities is represented on the diagram by arrows connecting the relevant boxes. Standard practice is to show water inputs at the top and water outputs at the bottom of the diagram. All water, including the mains water supply, should also be shown.
2.3.3 Add data to the diagram to produce an initial water balance
To produce the water balance, add the volumes of all major water and effluent flows to the block diagram. The units used should be consistent and are typically m3/day. Obtain numerical values for water/effluent flows from investigations and measurements (see
Section 2.4). Aim to produce as complete an account as possible of where the water is going on the site.
Use the information gathered in your preliminary review to begin to construct a water balance for your site. If necessary, use a site plan and process flow diagrams to help you. Add the information you can but, at this stage, you may not be able to account for a significant proportion of your water use. In Step 4, you will add detail to your water balance by carrying out more investigations and measuring flows.
Figure 12 shows an initial water balance for the example company depicted in Figure 11. At this stage, only certain flows have been quantified (mains water input to the site, water input to the factory, liquid raw material input to the factory, water in the product, wastewater output from the factory and sewage/trade effluent leaving the site). The completed water balance for this site is shown in Figure 20 (see Section 2.4.7).
1 6 4 0 2
1 6 4 0 2
Water in the product
Evaporationand steam
Evaporationand steam
Liquidraw materials
Meter
Domestic wastewater/trade effluent
Con
den
sate
reco
very
Leaks Boiler blowdown/condensate
Laundry andwashrooms
Toilets, handbasins and showers
Washing machinesTumble dryers
FactoryEquipment washingWater added to
productBoiler
Steam generationCondensate recoveryWater softening
Shop and canteenToilets and sinksDishwasherFood preparation
Mains water
No
No
No
No
1. Can you eliminate water use at source?
2. Can you reduce the amount of water used?
3. Can you re-use water/wastewater?
4. Can you recycle/recover water/wastewater?
Calculate the cost of disposal
Yes
Implement water reduction
Evaporation
Water in Product
Leaks to ground Effluent
Domestic wastewater/trade effluent
Factorylaundry and washrooms Factory
Factory shop and canteen
Water in the product
Liquidraw materials
Evaporationand steam
Watersupply
Meter
Figure 11: Block representation of a simple example site

Tracking Water Use to Cut CostsWRAP 17
Home 1 Why is saving water important?
3 Dealing with more complex sites
4 Action plan 5 Further information
Appendices2 A six-step procedure
For an example of a non-industrial site, see the detailed water balance exercise for a medium-sized hotel in Appendix D.
2.4 Step 4 – Adding detail to the water balance
Now add detail to your initial water balance by:
¡ working out which activities/processes are likely to use the most water under both normal and abnormal operating conditions;
¡ measuring flows to add information to your water balance; andcontinuing to account for more and more of ¡your total water input until you decide that it is no longer cost-effective to make new measurements.
Your preliminary review (see Section 2.2) may have enabled you to account for 80% or less of the site’s water use when you drew up your initial water balance. Depending on the amount of water you use, it may be
cost-effective to make measurements to identify 95% or more of your water use. This issue should have already been considered as part of your preliminary review.
This step has various stages and involves:
¡ identifying water supplies;¡ investigating water use;¡ identifying sources of effluent;¡ considering other water losses;¡ quantifying water use and effluent flows
through direct measurement, monitoring and, where necessary, estimating non-process uses;
¡ recording your information as a water use chart and on a spreadsheet;
¡ adding the data obtained to your block diagram to complete your water balance; and
¡ accounting for any discrepancies.
700
600
500
400
300
200
100
0
Wat
erus
e(m
3 )
Jan Feb Mar Apr May Jun Jul Aug Sep Oct Nov Dec
2001 2002 2003 2004
1 6 4 0 2
Water in the product
Total
84m3/day
79m3/day
Evaporationand steam
Evaporationand steam Liquid raw materials
Meter
Domestic wastewater/trade effluent
Con
den
sate
reco
very
Leaks Boiler blowdown/condensate
Laundry andwashrooms
Toilets, handbasins and showers
Washing machinesTumble dryers
FactoryEquipment washingWater added to
productBoiler
Steam generationCondensate recoveryWater softening
Shop and canteenToilets and sinksDishwasherFood preparation
85m3/day
5m3/day
65m3/day
75m3/day
1m3/day
? ?
?
?
?
?
?
Key ? To be assessed
Sub-meterInputsOutputsRecirculation
Mains water
(a)
(b)
1 6 4 0 2
Water in the product
Total
84m3/day
79 m3/day
Evaporationand steam
Evaporationand steam
Liquidraw materials
Meter
Domestic wastewater/trade effluent
Con
den
sate
reco
very
Leaks Boiler blowdown/condensate
Laundry andwashrooms
Toilets, handbasins and showers
Washing machinesTumble dryers
FactoryEquipment washingWater added to
productBoiler
Steam generationCondensate recoveryWater softening
Shop and canteenToilets and sinksDishwasherFood preparation
70 m3/day
85m3/day
5m3/day≈ 5m3/day ≈ 4m3/day
5m3/day 4m3/day
1m3/day
65m3/day
5m3/day
75m3/day
1m3/day
Key
Sub-meterInputsOutputsRecirculation
0.05m3/day
Mains water
Values from earlier assessmentshown in Figure 12Newly assessed values
Figure 12: Initial water balance for a simple example site

Tracking Water Use to Cut CostsWRAP 18
Home 1 Why is saving water important?
3 Dealing with more complex sites
4 Action plan 5 Further information
Appendices2 A six-step procedure
2.4.1 Identify water suppliesThe main water sources from which organisations can obtain their water are shown in Table 5. In most modern buildings, water from the mains and any abstracted water are kept separate from rainwater. When looking at water sources, make sure there is no crossover between these water systems. Some companies collect and treat rainwater for use within their processes.
Table 5: Main sources of water
To help identify where water is used and which activities/processes use the most water, start by finding out about where your water comes from and how it is treated and distributed on site.
¡ How is water supplied to the site (e.g. mains, river, reservoir and/or borehole)?
¡ Is water stored on site (e.g. in tanks or lagoons)? What is the storage capacity?
¡ Is water treated on site? If so, how?How is water transferred (e.g. by pump, ¡gravity or manually)?
Figure 13 shows an example assessment of site water sources. The next stage is to measure flows (see Section 2.4.5).
Look at your water and effluent bills to get an idea of the quantities of water used and the amount of effluent discharged from the site/area. Focus on the larger flows first.
2.4.2 Investigate water useDepending how complex your site is, use one or more of the following approaches to identify and investigate major uses of water.
¡ Walk around the site/process looking at everything to find water-using points and equipment.
¡ Identify the location of water meters and discuss with staff where water is used in their area.
¡ Where visible, trace water supply pipes from sources to water use points.Obtain drawings of the water supply ¡system, where necessary.
At the same time, make a note of effluent sources and trace pipework back to water supplies. This will save you time and effort later. The identification of effluent sources is described in more detail in Section 2.4.3.
Type Supply route
Mains Metered flow via a water company supply pipe
Surface water abstraction
Extracted from a river, stream, lake, reservoir or canal
Groundwater abstraction
Pumped from borehole(s)
Rainwater collection From a storage tank
Figure 13: Example water sources assessment
Source Processes/ areas served
Treatment Storage (type and capacity)
Transfer method
Use and frequency
Quantity (m3/day)
Mains Product None None Pumped Production hours
To be investigated
Borehole Product Softening Tank (5m3)
Pumped Downtime of mains pumps (5 days/year)
To be investigated
River Gardens None None Pumped and gravity
Summer To be investigated

Tracking Water Use to Cut CostsWRAP 19
Home 1 Why is saving water important?
3 Dealing with more complex sites
4 Action plan 5 Further information
Appendices2 A six-step procedure
When collecting data, also gather supporting information such as:
¡ number of employees on site or per shift;¡ type of product being produced;¡ number of lines operating; and
procedures (e.g. number of rinses or cycles ¡on washing operations).
You may wish to develop a diagram to help you keep track of your findings. Such a diagram can be particularly useful if no plan of the water supply distribution system is available.
¡ Identify the points where water enters the site or is abstracted on site.
¡ Trace the water supply pipes from these points to any plant/equipment that uses water.Draw a flow diagram of pipework ¡connections.
Water use survey helps wallpaper manufacturer achieve significant savingsBy mapping its site water services and developing a water balance, a wallpaper manufacturer reduced water consumption at one of its sites by nearly 40%. These actions, together with recommendations from process improvement teams investigating site water use, highlighted how water was being used and where it was being wasted. Estimated annual savings of £143,000 were achieved at virtually no cost.
2.4.3 Identify sources of effluentThe next stage is to find out where effluent is generated and being disposed of.
¡ Obtain drawings of the effluent drainage, surface water drainage and foul sewer systems. If these are not available, it may help to develop diagrams for your site. Appendix E provides guidance on how to produce and use site drainage plans to identify sources of effluent.
¡ Walk around your site/process finding out where water goes and looking for sources of effluent. Make a note of your observations.
¡ Talk to other people about where effluent is produced.Locate any effluent meters or sampling ¡points.
As well as discharges to sewer or watercourses, find out about liquid wastes and slurries removed off site in tankers.
Use the list of typical effluent sources in Table 6 to help you identify all your sources of effluent and water losses.

Tracking Water Use to Cut CostsWRAP 20
Home 1 Why is saving water important?
3 Dealing with more complex sites
4 Action plan 5 Further information
Appendices2 A six-step procedure
Table 6: Typical effluent sources and water losses
Effluent sources/water losses Examples
General
Water treatment units Filter backwash, wet sludges, chemical spillages, ion exchange regeneration, reverse osmosis effluents
Water storage, including boiler system Leaks and overflows
Storms/surface water run-off Additions to effluent drains
Groundwater Infiltration to effluent drains
Fire-fighting water systems Leaks, unnecessary use, wrong connections, safety/pump testing
Car park Vehicle washing wastewater
Fuelling depot Spilt fuel and oils to drain
Refrigeration units Condensate
Laboratories Condensate, cooling water, liquid effluents, mains water vacuum pumps
Drying processes Evaporation
Hot processes Steam, condensate
Oil interceptors Water/effluent removal
Storage tanks Bund water/effluent drainage, tank overflows, delivery pump/shaft seal leaks
Site cleaning Hoses
Commercial
Laundry Effluent, steam, evaporation from dryers
Kitchens Effluent, steam, liquid wastes
Toilets/bathrooms/washrooms Effluent, steam
Swimming pool and leisure facilities Wash block effluent, swimming pool water
Boiler/heating systems/air-conditioning Blowdown, condensate, steam
Gardens and water features Excess water run-off, overflows
Vehicle washing Effluent, detergents
Industrial
Cooling tower Blowdown, evaporation, spray/mist
Steam system Steam leaks and relief valve discharges, steam trap condensate, steam and evaporation, boiler scale and sludge, blowdown
Condensate recovery Vent losses to atmosphere, leaks and overflows
Condensate Loss to product, loss to drain (excluding recovery)
Process/production Effluent, evaporation, water in product
Scrubbers/strippers Overflows, mist/vapour
Safety showers Leaks, unnecessary use
Effluent treatment plant Treated effluent, sludge, aerosols, liquid wastes (e.g. reverse osmosis concentrate)

Tracking Water Use to Cut CostsWRAP 21
Home 1 Why is saving water important?
3 Dealing with more complex sites
4 Action plan 5 Further information
Appendices2 A six-step procedure
Domestic wastewater usually goes down a foul sewer for treatment by your local water company or sewerage provider. Uncollected and uncontaminated rainwater should preferably be discharged to a soakaway or to a surface water drain.
To avoid unnecessary treatment charges:
¡ check that rainwater is not entering the foul sewer;
¡ keep domestic sewage and surface water drainage separate from trade effluent; andlabel or colour code all drains. Make sure ¡that staff are aware of the difference.
2.4.4 Consider other water lossesTo complete your water balance, you need to consider other ways in which water is lost from your site/process, for example:
¡ water may ‘leave’ the site in product (e.g. in soft drinks manufacture); andas steam (e.g. some food processing uses ¡large quantities of steam).
Without information about these other losses, it will be difficult to complete a representative water balance for your site.
Remember to check for water losses in:
products and by-products; ¡emissions to atmosphere (e.g. evaporation, ¡steam, mist, spray and losses from pressure relief valves);spillages, leaks and overflows; ¡slurry and sludge wastes; ¡hoses and taps left on; ¡cooling water (including once-through); and ¡leaks from underground tanks or pipes. ¡
2.4.5 Quantify water use and effluent flowsOnce you have identified all major water uses and effluent sources, the next stage is to place them in order from largest to smallest. Do this through a combination of common sense, your own knowledge and discussions with other people.
¡ Starting with the largest anticipated water use/flow, find out how much water is used each time and how often it is used. Simple but effective methods include recording meter readings or timing water flow into a container of known volume (see Figure 14).
¡ Starting with the largest effluent source, find out how much effluent is generated each time and how often it is generated. The effluent flow may be the same as the flow of water used.

Tracking Water Use to Cut CostsWRAP 22
Home 1 Why is saving water important?
2 A six-step procedure
3 Dealing with more complex sites
4 Action plan 5 Further information
Appendices2 A six-step procedure
700
600
500
400
300
200
100
0
Wat
erus
e(m
3 )
Jan Feb Mar Apr May Jun Jul Aug Sep Oct Nov Dec
2001 2002 2003 2004
1 6 4 0 2
Water in the product
Total
84m3/day
79m3/day
Evaporationand steam
Evaporationand steam Liquid raw materials
Meter
Domestic wastewater/trade effluent
Con
den
sate
reco
very
Leaks Boiler blowdown/condensate
Laundry andwashrooms
Toilets, handbasins and showers
Washing machinesTumble dryers
FactoryEquipment washingWater added to
productBoiler
Steam generationCondensate recoveryWater softening
Shop and canteenToilets and sinksDishwasherFood preparation
85m3/day
5m3/day
65m3/day
75m3/day
1m3/day
? ?
?
?
?
?
?
Key ? To be assessed
Sub-meterInputsOutputsRecirculation
Mains water
(a)
(b)
1 6 4 0 2
Water in the product
Total
84m3/day
79 m3/day
Evaporationand steam
Evaporationand steam
Liquidraw materials
Meter
Domestic wastewater/trade effluent
Con
den
sate
reco
very
Leaks Boiler blowdown/condensate
Laundry andwashrooms
Toilets, handbasins and showers
Washing machinesTumble dryers
FactoryEquipment washingWater added to
productBoiler
Steam generationCondensate recoveryWater softening
Shop and canteenToilets and sinksDishwasherFood preparation
70 m3/day
85m3/day
5m3/day≈ 5m3/day ≈ 4m3/day
5m3/day 4m3/day
1m3/day
65m3/day
5m3/day
75m3/day
1m3/day
Key
Sub-meterInputsOutputsRecirculation
0.05m3/day
Mains water
Values from earlier assessmentshown in Figure 12Newly assessed values
Figure 14: Two simple ways of measuring flow, (a) record meter readings (b) using a bucket and stopwatch approach
Water flow can be measured either in pipelines or in channels. There are numerous options for flow measurement, each with its own advantages and disadvantages. More details are given in Section 3.2.2.
You can quantify flows in a number of ways. In order of preference, these are:
¡ measure directly:flow meter measurements; and -bucket and stopwatch approach; -
¡ calculate from other measurements where applicable;
¡ calculate from manufacturers’ published information;
¡ calculate from typical use information; andestimate from knowledge of the process. ¡
Bucket and stopwatch approachThe direct measurement technique described below involves performing a spot check on the flow from a piece of equipment or process using a bucket or another container and a stopwatch (or a wristwatch with a second hand). The flow rate can be calculated from the volume of water/effluent collected over a known time. You may need to undo a pipe connection temporarily to allow water/effluent to flow into your container. This technique, which will not be applicable to all flows, is described below.
¡ Assess health and safety requirements (e.g. use gloves and safety glasses).
¡ Assemble equipment (e.g. bucket, timer, note-pad, pen and rope for lowering bucket into drain).
¡ Find a measuring point where it is possible to catch all the flow in the bucket.

Tracking Water Use to Cut CostsWRAP 23
Home 1 Why is saving water important?
2 A six-step procedure
3 Dealing with more complex sites
4 Action plan 5 Further information
Appendices2 A six-step procedure
Figure 15: Example calculation of water use by a hose
¡ Position the empty bucket and start the stopwatch (or note the exact time) immediately the bucket starts to catch the flow.
¡ Remove the bucket, stop the timer and note the time when the bucket is nearly full (but not overflowing).
¡ Measure the contents of the bucket in litres using either graduations on the bucket or a measuring cylinder.
¡ Calculate the flow rate in litres/second by dividing the volume of effluent collected in litres by the number of seconds over which collection took place.Alternatively, calculate the flow based on ¡the weight of the effluent and assuming the effluent has the density of water (i.e. where 1kg of effluent occupies 1 litre).
Measure the flow at representative times, including both continuous and intermittent discharges. As this is a one-off measurement, repeat the test to determine variations in flows or average flow rates.
Using manufacturers’ dataIf direct measurement is not practicable, consider obtaining data from manufacturers’ brochures, such as water use for washing equipment. Take care to use data for the exact
model and note any modifications. If possible, compare these data with actual water use. Savings are possible if the unit is operating at above its recommended consumption.
Estimating water use based on knowledge of the processIf necessary, you may have to estimate water use based on your knowledge of the process. For example, for a tank filled each time for a pre-rinse and a wash, measure the tank dimensions and calculate the volume of water used. Remember to allow for partial filling or overflows.
Take measurements to cover all operations affecting water or effluent quantities. In particular, check intermittent activities (e.g. cleaning) where water use is often variable and wasteful. More information about measuring water use and flow is given in Section 3.2.2.
Monitoring washing/cleaning operationsMonitor washing and cleaning operations by estimating or recording hose or tap use (for example, frequency, duration and flow rate) and calculating water/effluent quantities. Figure 15 shows an example calculation of water use by a hose. The same calculation can be applied to effluent generation.
Calculation Result
Instantaneous flow/average flow rate A Measured 0.5 litres/second = 1,800 litres/hour
Length of event B Measured 2 hours
Amount/event C A × B 3,600 litres
Frequency of event D Measured Twice a day
Daily total E C × D 7,200 litres/day
Daily flow F E/1,000 7.2m3/day

Tracking Water Use to Cut CostsWRAP 24
Home 1 Why is saving water important?
3 Dealing with more complex sites
4 Action plan 5 Further information
Appendices2 A six-step procedure
Estimating non-process usesIf you have combined domestic and effluent sewers, you may need to estimate domestic sewage quantities. Typical values for domestic water consumption are shown in Table 7.
Water use in toilets can be estimated from the frequency of use and cistern volume. WC cistern volumes can be calculated from measurements obtained by gently tying up the ballcock before flushing the toilet and filling the cistern from a graduated bucket.
Use in washbasins can be estimated by temporarily disconnecting the ‘U’ bend and running the waste into a large, graduated plastic bucket while using clean water to simulate normal use, such as washing hands.
2.4.6 Record your informationWhen tracking water use, it is important to keep accurate records of your findings for future use. You can do this either as a water use chart or on a worksheet.
Water use chartProducing a simple block diagram will help you to determine flows for your water balance. Figures 16 and 17 show example charts for a commercial site and an industrial site respectively.
Table 7: Typical rates of domestic water use
Item Average water use
Toilets 6 – 9 litres/flush
Sinks 3 – 6 litres/event
Showers 45 – 65 litres/event (higher use for power showers)
Baths 60 – 170 litres/event
Dishwasher 20 – 40 litres/event
Laundry (washing machine)
60 – 100 litres/event
Vehicle washing Ranges from 100 litres/vehicle using buckets up to 900 litres/vehicle using a hose
Garden hose 8 – 30 litres/minute (500 – 1,800 litres/hour)
Residential occupant
150 litres/day/person
Employee (full-time, no canteen)
25 litres/day/person
Employee (full-time, with canteen)
40 litres/day/person
Date: 31/03/12Time: 14.30 hrsInvestigator: M BrownUnit operation: Laundry
Location: Hotel
Source: Mains water
Metered/unmetered
Use 2: Sink
Volume: 0.24m3/day
Use 1: Washing machine
Volume: 2.4m3/day
Date: 31/03/12Time: 10.30 hrsInvestigator: D WhiteUnit operation: Cooling tower
Location: Brewery
Use 1: Make-up water
Volume: 7m3/day
Source: Mains water
Metered/unmetered
Use 2: Hose
Volume: 5.4m3/day
Unit operation: Sweets production
Location: Confectionery
Flow 2: Milk make-up vessel
COD185kg/day
TSS23kg/day
Volume15m3/day
Flow 3: Polishing pan cleaning
COD65kg/day
TSS7kg/day
Volume55m3/day
Flow 1: Toffee cooker
COD770kg/day
TSS50kg/day
Volume1 ,630m3/day
Total effluent
COD1,020kg/day
TSS80kg/day
Volume1,700m3/day
Figure 16: Water use chart: commercial example

Tracking Water Use to Cut CostsWRAP 25
Home 1 Why is saving water important?
3 Dealing with more complex sites
4 Action plan 5 Further information
Appendices2 A six-step procedure
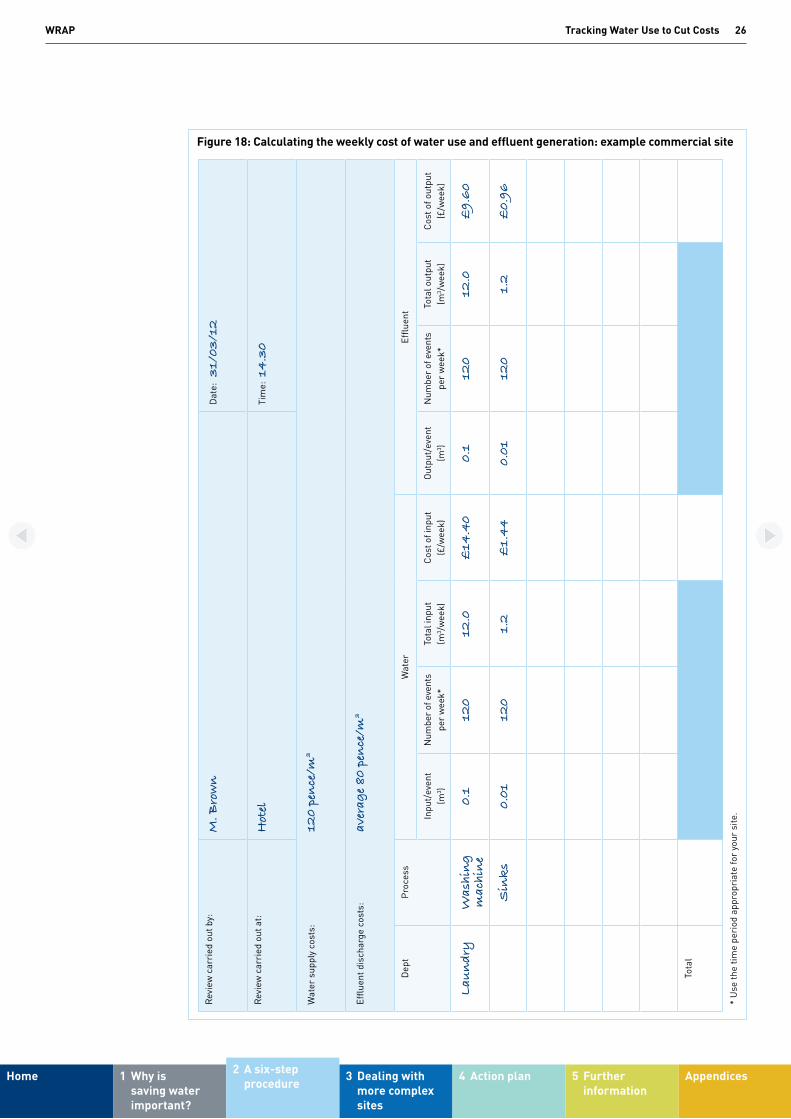
WorksheetEntering quantity and cost data on a worksheet will help you use the water balance to identify and prioritise water saving opportunities (see Section 2.5).
Keep units consistent and choose the time period that is most convenient for you.
The example worksheets shown in Figures 18 and 19 are based on weekly use.
Figure 18 shows an example worksheet for a fictitious commercial site (the same site used to produce the water use chart shown in Figure 16). The number of times the sinks are used is calculated assuming three employees, each washing their hands eight times a day for five days per week. The calculations assume negligible use of liquid detergent/fabric softener and negligible water losses as steam/evaporation.
Figure 19 shows an example worksheet for a fictitious industrial site (the same site used to produce the water use chart shown in Figure 17). The amount of evaporation is calculated from the volume of make-up water minus the volume of blowdown and assuming no leaks and/or overflows. The calculation assumes that hose use amounts to 15 hours/week (3 hours/day, 5 days/week) at a flow rate of 0.5 litres/second (1.8m3/hour).
Date: 31/03/12Time: 14.30 hrsInvestigator: M BrownUnit operation: Laundry
Location: Hotel
Source: Mains water
Metered/unmetered
Use 2: Sink
Volume: 0.24m3/day
Use 1: Washing machine
Volume: 2.4m3/day
Date: 31/03/12Time: 10.30 hrsInvestigator: D WhiteUnit operation: Cooling tower
Location: Brewery
Use 1: Make-up water
Volume: 7m3/day
Source: Mains water
Metered/unmetered
Use 2: Hose
Volume: 5.4m3/day
Unit operation: Sweets production
Location: Confectionery
Flow 2: Milk make-up vessel
COD185kg/day
TSS23kg/day
Volume15m3/day
Flow 3: Polishing pan cleaning
COD65kg/day
TSS7kg/day
Volume55m3/day
Flow 1: Toffee cooker
COD770kg/day
TSS50kg/day
Volume1 ,630m3/day
Total effluent
COD1,020kg/day
TSS80kg/day
Volume1,700m3/day
Figure 17: Water use chart: industrial example
Tracking Water Use to Cut CostsWRAP 26
Home 1 Why is saving water important?
3 Dealing with more complex sites
4 Action plan 5 Further information
Appendices2 A six-step procedure
Rev
iew
car
ried
out
by:
M. B
row
nD
ate:
3
1/0
3/1
2
Rev
iew
car
ried
out
at:
Hot
elTi
me:
14
.30
Wat
er s
uppl
y co
sts:
12
0 p
ence
/m3
Effl
uent
dis
char
ge c
osts
: av
erag
e 8
0 p
ence
/m3
Dep
tP
roce
ssW
ater
Effl
uent
Inpu
t/ev
ent
(m3 )
Num
ber
of e
vent
s pe
r w
eek*
Tota
l inp
ut(m
3 /w
eek)
Cos
t of i
nput
(£/w
eek)
Out
put/
even
t(m
3 )N
umbe
r of
eve
nts
per
wee
k*To
tal o
utpu
t(m
3 /w
eek)
Cos
t of o
utpu
t(£
/wee
k)
Lau
nd
ryW
ashi
ng
m
achi
ne
0.1
120
12.0
£14
.40
0.1
120
12.0
£9
.60
Sin
ks
0.0
112
01.
2£
1.4
40
.01
120
1.2
£0
.96
Tota
l
* U
se th
e tim
e pe
riod
app
ropr
iate
for
your
site
.
Figure 18: Calculating the weekly cost of water use and effluent generation: example commercial site

Tracking Water Use to Cut CostsWRAP 27
Home 1 Why is saving water important?
3 Dealing with more complex sites
4 Action plan 5 Further information
Appendices2 A six-step procedure
Figure 19: Calculating the weekly cost of water use and effluent generation: example industrial site
Rev
iew
car
ried
out
by:
D. W
hite
Dat
e:
31/
03
/12
Rev
iew
car
ried
out
at:
Bre
wer
yTi
me:
10
.30
Wat
er s
uppl
y co
sts:
12
0 p
ence
/m3
Effl
uent
dis
char
ge c
osts
: av
erag
e 8
0 p
ence
/m3 f
or h
ose
use
wit
h m
oder
ate
poll
uti
on a
ssu
min
g 4
2 p
ence
/m3 f
or b
low
dow
n
(bas
ed o
n v
olu
me
char
ges
on
ly)
Dep
tP
roce
ssW
ater
Effl
uent
Inpu
t/ev
ent
(m3 )
Num
ber
of e
vent
s pe
r w
eek*
Tota
l inp
ut(m
3 /w
eek)
Cos
t of i
nput
(£/w
eek)
Out
put/
even
t(m
3 )N
umbe
r of
eve
nts
per
wee
k*To
tal o
utpu
t(m
3 /w
eek)
Cos
t of o
utpu
t(£
/wee
k)
Coo
lin
g
tow
erW
ater
m
ake-
up
57
35
.0£
42
.00
––
––
Hos
e1.
8
(per
hou
r)15
27
.0£
32
.40
1.8
152
7.0
£2
1.6
0
––
––
3.0
72
1.0
–
Blo
wd
own
––
––
2.0
714
.0£
5.8
8
Tota
l
* U
se th
e tim
e pe
riod
app
ropr
iate
for
your
site
.

Tracking Water Use to Cut CostsWRAP 28
Home 1 Why is saving water important?
3 Dealing with more complex sites
4 Action plan 5 Further information
Appendices2 A six-step procedure
2.4.7 Completing the water balanceAdding the information obtained from your investigations of water use and effluent generation to your block diagram should enable you to complete your water balance. In some cases, it may now be easier to expand the diagram by dividing a‘block’ into two or more activities.
The water balance should be a schematic representation of your process showing:
¡ all known points of water flowing into the process;
¡ all known points of water flowing out of the process, as effluent, liquid waste, product or evaporative loss (see Appendix F for steam); and
the amounts of these flows (in consistent ¡units).
In theory, the total of all the inputs should equal the total of all the outputs for either individual unit operations or the whole process. However, this is rarely the case in practice. Aim initially for an accuracy of ±10% on the total amount of water you can account for.
Figure 20 shows the completed water balance for the example company from Step 3 (see Section 2.3). The company has now produced data for all flows and identified major water leaks from the factory. In this example, 84m3/day out of the input of 85m3/day of water has now been accounted for.
700
600
500
400
300
200
100
0
Wat
erus
e(m
3 )
Jan Feb Mar Apr May Jun Jul Aug Sep Oct Nov Dec
2001 2002 2003 2004
1 6 4 0 2
Water in the product
Total
84m3/day
79m3/day
Evaporationand steam
Evaporationand steam Liquid raw materials
Meter
Domestic wastewater/trade effluent
Con
den
sate
reco
very
Leaks Boiler blowdown/condensate
Laundry andwashrooms
Toilets, handbasins and showers
Washing machinesTumble dryers
FactoryEquipment washingWater added to
productBoiler
Steam generationCondensate recoveryWater softening
Shop and canteenToilets and sinksDishwasherFood preparation
85m3/day
5m3/day
65m3/day
75m3/day
1m3/day
? ?
?
?
?
?
?
Key ? To be assessed
Sub-meterInputsOutputsRecirculation
Mains water
(a)
(b)
1 6 4 0 2
Water in the product
Total
84m3/day
79 m3/day
Evaporationand steam
Evaporationand steam
Liquidraw materials
Meter
Domestic wastewater/trade effluent
Con
den
sate
reco
very
Leaks Boiler blowdown/condensate
Laundry andwashrooms
Toilets, handbasins and showers
Washing machinesTumble dryers
FactoryEquipment washingWater added to
productBoiler
Steam generationCondensate recoveryWater softening
Shop and canteenToilets and sinksDishwasherFood preparation
70 m3/day
85m3/day
5m3/day≈ 5m3/day ≈ 4m3/day
5m3/day 4m3/day
1m3/day
65m3/day
5m3/day
75m3/day
1m3/day
Key
Sub-meterInputsOutputsRecirculation
0.05m3/day
Mains water
Values from earlier assessmentshown in Figure 12Newly assessed values
Figure 20: Completed water balance for a simple example site
Tracking Water Use to Cut CostsWRAP 29
Home 1 Why is saving water important?
3 Dealing with more complex sites
4 Action plan 5 Further information
Appendices2 A six-step procedure
Further example water balances for an industrial site and a hotel are shown in Appendix D.
If the inputs and outputs shown in your water balance are not equal, consider:
Where else is water coming from or ¡effluent going to?Are there hidden losses (e.g. an undetected ¡leak)?How accurate is the information? ¡Can it be improved? ¡
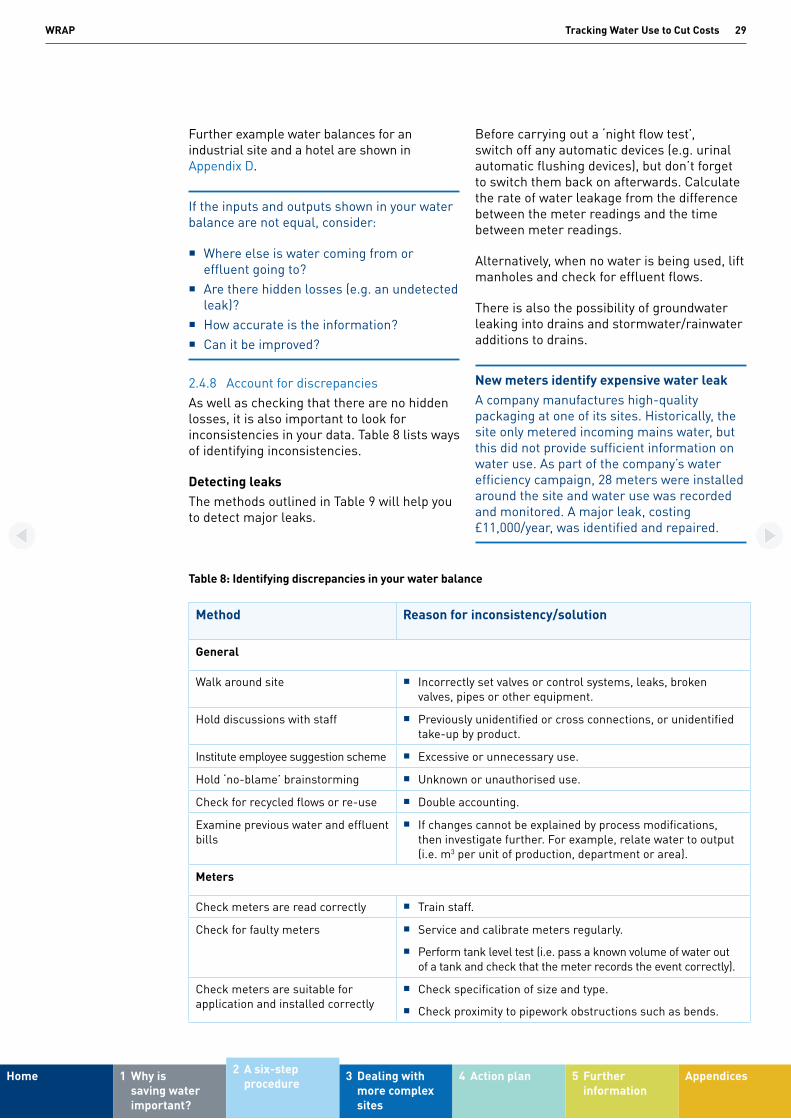
2.4.8 Account for discrepanciesAs well as checking that there are no hidden losses, it is also important to look for inconsistencies in your data. Table 8 lists ways of identifying inconsistencies.
Detecting leaksThe methods outlined in Table 9 will help you to detect major leaks.
Before carrying out a ‘night flow test’, switch off any automatic devices (e.g. urinal automatic flushing devices), but don’t forget to switch them back on afterwards. Calculate the rate of water leakage from the difference between the meter readings and the time between meter readings.
Alternatively, when no water is being used, lift manholes and check for effluent flows.
There is also the possibility of groundwater leaking into drains and stormwater/rainwater additions to drains.
New meters identify expensive water leakA company manufactures high-quality packaging at one of its sites. Historically, the site only metered incoming mains water, but this did not provide sufficient information on water use. As part of the company’s water efficiency campaign, 28 meters were installed around the site and water use was recorded and monitored. A major leak, costing £11,000/year, was identified and repaired.
Table 8: Identifying discrepancies in your water balance
Method Reason for inconsistency/solution
General
Walk around site Incorrectly set valves or control systems, leaks, broken ¡valves, pipes or other equipment.
Hold discussions with staff Previously unidentified or cross connections, or unidentified ¡take-up by product.
Institute employee suggestion scheme Excessive or unnecessary use. ¡
Hold ‘no-blame’ brainstorming Unknown or unauthorised use. ¡
Check for recycled flows or re-use Double accounting. ¡
Examine previous water and effluent bills
If changes cannot be explained by process modifications, ¡then investigate further. For example, relate water to output (i.e. m3 per unit of production, department or area).
Meters
Check meters are read correctly Train staff. ¡
Check for faulty meters Service and calibrate meters regularly. ¡
Perform tank level test (i.e. pass a known volume of water out ¡of a tank and check that the meter records the event correctly).
Check meters are suitable for application and installed correctly
Check specification of size and type. ¡
Check proximity to pipework obstructions such as bends. ¡

Tracking Water Use to Cut CostsWRAP 30
Home 1 Why is saving water important?
3 Dealing with more complex sites
4 Action plan 5 Further information
Appendices2 A six-step procedure
2.5 Step 5 – Using the water balance to save money
As you carry out investigations for your water balance, you may find taps left on, faulty valves and leaks. You can often take action to sort out such problems immediately.
Note down what you have done and record the anticipated savings.
Many of the benefits of producing a water balance arise from increasing people’s awareness of the importance of using water efficiently. However, the full effects will only be gained by analysing each use of water carefully.
2.5.1 Identifying opportunities to reduce water use
Use the water balance to identify major water uses and sources of wastewater/effluent generation. Then use the checklist in Figure 7 (see Section 2.2) to help you analyse water use and effluent generation. Your answers to the questions in this checklist will help you to identify opportunities to reduce water use and thus save money. Photocopy this checklist as necessary for use by your water saving team.
Ask the people who operate water-using equipment for their suggestions for reducing water use and wastewater/effluent generation.
Suggestions for reducing water use are given in Table 10. Many of these suggestions are no-cost and low-cost measures. The others are likely to cost more, but are still worth considering.
Use the cost data from your completed water use worksheet (see Section 2.4.6) to help you prioritise and implement measures to reduce water use and wastewater/effluent generation.
Water balance leads dairy to significant cost benefits and water savingsA detailed water balance prepared by staff at a milk processing factory highlighted the areas where significant amounts of water were used and wastewater generated. A major source of wastewater was evaporative condensate. This warm and relatively clean wastewater stream is now recovered, treated by reverse osmosis and re-used for a number of applications on site including boiler feed make-up water and hot CIP operations. The reliance on mains water has reduced significantly, with potential savings of up to 1,100m3/day.
Table 9: Leak detection methods
Type Method
Look Inside – walk around the site or process, examining water-using plant and supply ¡pipework carefully.
Outside – look for lush vegetation or continuously boggy/damp areas. Check the ¡proximity of these areas to supply pipes.
Listen When the area is quiet, listen for drips or flow of water. ¡
Test Carry out a ‘night flow test’ and listen for flow at meters: ¡
read the water meter when all employees have left and all processes have -stopped;
read the meter again some time later before anyone returns and uses water; and -
if the water meter shows a significant increase, suspect a leak and investigate -further. Use sub-meters around the site to carry out detailed investigations in different areas.
Contractors Use a leak detection service provided by a water company or external contractor. ¡

Tracking Water Use to Cut CostsWRAP 31
Home 1 Why is saving water important?
3 Dealing with more complex sites
4 Action plan 5 Further information
Appendices2 A six-step procedure
Table 10: Cost-effective water saving opportunities
Issu
eTe
chni
que
Exam
ples
Pote
ntia
l cos
t
Gen
eral
Goo
d ho
usek
eepi
ng (i
.e. u
sing
wat
er
wis
ely)
.U
se d
ry c
lean
ing
met
hods
initi
ally
to m
inim
ise
wat
er u
se to
one
sho
rt w
ash
(i.e.
use
scr
aper
s or
br
ushe
s fir
st to
rem
ove
mat
eria
l fro
m e
quip
men
t for
dis
posa
l as
solid
was
te).
Low
Red
uce
unne
cess
ary
gard
en w
ater
ing
or w
ater
with
per
fora
ted
pipe
s in
stea
d of
a h
ose
or s
prin
kler
to
redu
ce w
ater
loss
by
evap
orat
ion.
Low
Kee
ping
foul
sew
er, t
rade
eff
luen
t and
su
rfac
e w
ater
dra
ins
sepa
rate
.En
sure
rai
nfal
l run
-off
(from
unc
onta
min
ated
are
as) d
rain
s to
sur
face
wat
er d
rain
s or
col
lect
for
re-u
se.
Hig
h
Hig
h-gr
ade
and
low
-gra
de w
ater
sup
ply
syst
ems.
Col
lect
rai
nwat
er fo
r lo
w-g
rade
use
s (e
.g. g
arde
n w
ater
ing
and
yard
was
hing
).Lo
w
Mon
itori
ngM
easu
ring
to m
anag
e.Se
t sta
ged
goal
s fo
r re
duci
ng w
ater
use
.Lo
w
Rea
l-tim
e re
port
ing.
Rep
ort w
ater
use
and
eff
luen
t gen
erat
ion
daily
or
wee
kly
so th
at e
xces
sive
use
can
be
iden
tifie
d an
d re
med
ial a
ctio
n ta
ken
imm
edia
tely
.Lo
w
Trai
ning
Was
te r
educ
tion
cult
ure.
Pro
mot
e w
ith p
rogr
ess
repo
rts,
com
petit
ions
, sug
gest
ion
sche
mes
, etc
.Lo
w
Envi
ronm
enta
l aw
aren
ess
and
wat
er
savi
ngs.
Use
leaf
lets
, pos
ters
, stic
kers
and
dep
artm
ent/
grou
p m
eetin
gs to
edu
cate
em
ploy
ees.
Low
Impr
oved
m
aint
enan
ceEq
uipm
ent r
epai
r.R
epai
r le
akin
g va
lves
, sea
ls a
nd p
ipes
, dri
ppin
g ta
ps a
nd o
verf
low
ing
cist
erns
imm
edia
tely
.Lo
w
Pre
vent
ive
mai
nten
ance
.Se
rvic
e eq
uipm
ent r
egul
arly
to r
educ
e un
plan
ned
dow
ntim
e of
mac
hine
ry a
nd a
ssoc
iate
d w
ashi
ng
oper
atio
ns.
Low
Ope
rati
ons
Pro
duct
ion
sche
dulin
g.R
educ
e ne
ed fo
r w
ashi
ng b
y pr
ogre
ssin
g fr
om li
ght/
clea
n to
dar
k/di
rty
item
s or
pro
duct
ion,
re-
usin
g w
ash
wat
er w
here
pos
sibl
e.Lo
w
Pro
cedu
ral c
hang
es.
Enco
urag
e th
e us
e of
sho
wer
s ra
ther
than
bat
hs w
here
pos
sibl
e.Lo
w
Opt
imis
e th
e nu
mbe
r of
cle
anin
g ri
nses
and
rin
sing
met
hods
.Lo
w
Rep
lace
wor
n-ou
t equ
ipm
ent w
ith lo
w-w
ater
use
mod
els.
On
dish
was
hers
and
was
hing
mac
hine
s,
also
look
for
feat
ures
suc
h as
qui
ck w
ashe
s fo
r lig
htly
soi
led
load
s.H
igh
Rep
lace
man
ual c
lean
ing
with
cle
anin
g-in
-pla
ce (C
IP) a
utom
ated
sys
tem
s.H
igh
Key
: Low
= e
asy
no-c
ost a
nd lo
w-c
ost m
easu
res
(i.e.
less
than
a fe
w h
undr
ed p
ound
s); H
igh
= hi
gher
cos
t, m
ore
deta
iled
mea
sure
s.

Tracking Water Use to Cut CostsWRAP 32
Home 1 Why is saving water important?
3 Dealing with more complex sites
4 Action plan 5 Further information
Appendices2 A six-step procedure
Table 10: Cost-effective water saving opportunities (continued)
Issu
eTe
chni
que
Exam
ples
Pote
ntia
l cos
t
Ope
rati
ons
(con
tinu
ed)
Mod
ifica
tion
of o
pera
tiona
l tec
hniq
ues.
Try
to u
se m
achi
nes
(e.g
. dis
hwas
hers
and
was
hing
mac
hine
s) o
nly
whe
n th
ey h
ave
a fu
ll lo
ad.
Low
Rin
se it
ems
in a
sin
k ra
ther
than
und
er r
unni
ng w
ater
.Lo
w
Avoi
d w
ashi
ng r
inse
s th
at o
verf
low
. Use
a m
ixer
or
hot w
ater
or
allo
w e
quip
men
t to
soak
in o
rder
to
use
wat
er e
ffic
ient
ly.
Low
Red
uce
the
size
of w
ashi
ng b
owls
or
othe
r ve
ssel
s to
dec
reas
e th
e am
ount
of w
ater
nee
ded
to fi
ll th
em.
Hig
h
Use
spr
ays
or je
ts o
f hig
h pr
essu
re w
ater
inst
ead
of la
rger
qua
ntiti
es o
f low
pre
ssur
e w
ater
.H
igh
Col
lect
was
h w
ater
, eff
luen
t, bl
owdo
wn
or c
onde
nsat
e, tr
eat i
t and
re-
use.
Hig
h
Impr
oved
inst
rum
enta
tion
and
cont
rol.
Use
pre
ssur
e re
duce
rs o
r flo
w r
estr
icto
rs to
red
uce
wat
er u
se (e
.g. o
n ha
nd w
ashi
ng b
asin
s an
d ho
ses)
.Lo
w
Inst
all a
utom
atic
flus
hing
dev
ices
on
urin
als
and/
or r
educ
e to
ilet c
iste
rn v
olum
es.
Low
Use
aut
omat
ic s
hut-
off v
alve
s fo
r ho
ses
(i.e.
trig
ger
guns
) and
tank
filli
ng p
ipew
ork.
Inst
all p
ush
taps
on
bas
ins.
Low
Inst
all t
ampe
r pr
even
tion
devi
ces
(e.g
. loc
ks fo
r va
lves
) to
prev
ent u
naut
hori
sed
adju
stm
ent.
Low
Use
aut
omat
ic c
ontr
ols
whe
re p
ossi
ble
(e.g
. aut
omat
ic b
low
dow
n co
ntro
l).H
igh
Con
side
r us
ing
bloc
k va
lves
(i.e
. non
-adj
usta
ble)
inst
ead
of a
djus
tabl
e va
lves
to a
void
inco
rrec
t se
ttin
gs.
Hig
h
Rep
lace
men
t of p
roce
ss.
Mic
row
ave
food
inst
ead
of b
oilin
g it.
Low
Con
side
r dr
y cl
eani
ng fo
r cl
othe
s an
d fa
bric
s.Lo
w
Use
air
coo
ling
inst
ead
of w
ater
coo
ling.
Hig
h
Mat
chin
g qu
ality
and
ava
ilabi
lity
to
req
uire
men
ts to
re-
use
wat
er.
Re-
use
the
last
rin
se –
usu
ally
cle
an –
as
initi
al r
inse
of n
ext w
ash
cycl
e –
usua
lly d
irty
(i.
e. c
ount
ercu
rren
t rin
sing
).Lo
w
Re-
use
cool
ing
wat
er fo
r an
othe
r us
e (e
.g. w
ashi
ng) o
r re
-use
aft
er tr
eatm
ent (
e.g.
in a
hea
t ex
chan
ger)
.H
igh
Key
: Low
= e
asy
no-c
ost a
nd lo
w-c
ost m
easu
res
(i.e.
less
than
a fe
w h
undr
ed p
ound
s); H
igh
= hi
gher
cos
t, m
ore
deta
iled
mea
sure
s.
Tracking Water Use to Cut CostsWRAP 33
Home 1 Why is saving water important?
3 Dealing with more complex sites
4 Action plan 5 Further information
Appendices2 A six-step procedure
2.5.2 Examples to give you ideasThe following examples are intended to give you ideas about how your company could save money by reducing water use.
Company example 1Water use in a commercial building was monitored using water meters and a water balance was developed. Comparison of water use in different areas revealed markedly different water use between two washrooms, even though they were a similar size and had a similar level of use. Investigations identified a leaking pipe, a broken tap (water was running continuously) and a faulty valve leading to excessive water for toilet flushing. Simple repairs saved 500m3/year of water and associated wastewater charges.
Company example 2During a survey of its water distribution system, a company noticed that cooling water was discharged straight to drain after only one use. Following investigation, it proved cost-effective to install a cooling unit to enable water re-use.
Company example 3Investigations at a site identified taps running continuously in workshops to provide cold drinking water (the supply pipes came through hot process areas) and to cool milk for tea. Significant amounts of water and money were saved by installing chilled drinking water fountains and small refrigerators for milk or bottled water.
Company example 4One company found that its water balance did not ‘balance’; the site meter registered much more water as being used than had been measured. To investigate the discrepancy, each water-using operation was examined more closely. In one area, it was found that a hose was frequently left on unnecessarily during a washing operation. Fitting a trigger gun to the hose solved the problem and reduced water and effluent charges significantly.
2.6 Step 6 – Continuous improvementYour first water balance should be reviewed and updated regularly. The review will allow you to demonstrate that savings are being made.
Regular recording of flows, water and effluent costs, meter readings and updating of site drainage plans will minimise the work required during a water balance review.
During your regular review:
¡ gather more detailed data (if necessary);¡ improve estimated data by measurement
or better estimation;¡ update water supply and drainage system
drawings/plans as appropriate; andincorporate any relevant changes ¡(e.g. methods, products and employee numbers).
With time, your water balance will become increasingly accurate as you account for and eliminate discrepancies (see Section 2.4.8).
To maintain motivation, let everyone in the company know about the success of the water saving initiative through your intranet, via posters on notice-boards, in company newsletters, etc.Send regular reports to top-level management to maintain their commitment to water saving.

Tracking Water Use to Cut CostsWRAP 34
Home 1 Why is saving water important?
2 A six-step procedure
4 Action plan 5 Further information
Appendices3 Dealing with more complex sites
3 Dealing with more complex sites
At larger, more complex sites, it takes longer to refine the initial water balance and to identify and implement all cost-effective water saving opportunities.
This section builds on Section 2 by explaining how you can investigate water and, particularly, effluent flows in more detail to uncover further water saving opportunities.
3.1 Gathering more dataFor Step 2 – A preliminary review (see Section 2.2), it is necessary for more complex sites to gather more data. Table 11 provides other sources of information that will help you to complete the water balance for a more complex site.
3.2 Finding out more about effluent flowsFor more complex sites, you need to investigate:
¡ discharges to sewers and watercourses;¡ effluent removed off site in tankers; and
other liquid wastes (e.g. small quantities ¡removed from the site in drums).
Talk to the relevant staff to obtain the necessary details and records.
Talk to the relevant staff to obtain the necessary details and records.
Table 11: Additional relevant data for more complex sites
Subject Details
Site levelling data Site plan showing levels.
Drainage network details Condition, age, size and materials of construction.
Water quality standards Internal specifications for different plant/areas.
Water storage System type and capacity.
Water and effluent transfer Whether pumped, gravity-fed or manual.
Effluent removed from site Use of tankers and drums.
Effluent disposal standards Trade effluent consent conditions.
Effluent volume and strength Basis for calculation and billing (i.e. application of Mogden Formula).
Correspondence with regulators Details of any problems or pollution incidents.
Rainfall data Run-off volume and rate calculations (e.g. Met Office data).
Process details Process equipment arrangements, sketches and plans.
Operational practices Cleaning routines, number of employees and shift patterns.
Substances and chemicals Quantities used.
Health and safety data sheets.
Future development proposals Possible changes in production or number of employees.
Potential future costs Changes to charging scheme.
Increases in treatment/disposal costs.
Forthcoming legislation.
Historical data Past environmental, engineering, health and safety reports.

Tracking Water Use to Cut CostsWRAP 35
Home 1 Why is saving water important?
2 A six-step procedure
4 Action plan 5 Further information
Appendices3 Dealing with more complex sites
3.2.1 Carry out a drain entry point surveyThe points at which pipes or channels containing effluent enter the site drainage system are known as drain entry points. Carry out a site survey of drain entry points, measuring and recording all potential effluent flows to the drains. Figure 21 shows an example record from a drain entry point survey for a fictitious site.
3.2.2 Examine each effluent flow in more detail
You now need to examine the effluent characteristics at each drain entry point. Useful information includes:
¡ source of effluent;¡ number of sources of each type of effluent;¡ a description of the effluent (e.g.
temperature, clarity and colour);
¡ what the water is used for to produce an effluent (e.g. cleaning);
¡ possible contaminants (e.g. raw material, product and detergents);
¡ details of the pipe or channel through which the effluent joins the drainage system;
¡ flow rate;¡ whether the flow is intermittent or
continuous;¡ frequency of flow; and
duration of flow. ¡
Record your observations and measurements on a suitable worksheet. Figure 22 shows an example worksheet for the same site as Figure 21.

Tracking Water Use to Cut CostsWRAP 36
Home 1 Why is saving water important?
2 A six-step procedure
4 Action plan 5 Further information
Appendices3 Dealing with more complex sites
Figure 21: Example drain entry point survey sheet
Site
: A
mbe
rly
Roa
dFe
edin
g to
dra
in e
ntry
poi
nt n
umbe
r:
14
Loca
tion:
B
uil
din
g 3
Exac
t loc
atio
n:
Man
hole
in
pat
h by
nor
th f
ace
Dep
artm
ent:
P
roce
ssin
gM
arke
d on
map
num
ber:
2
of
3
Inve
stig
ator
: J.
Sm
ith
Dat
e:
3
1/0
3/1
2Ti
me:
1
4.3
0
For
each
pip
e/ch
anne
l fee
ding
into
dra
in e
ntry
poi
nt n
ote:
Sour
ce (i
f kno
wn)
Num
ber
Con
stru
ctio
n m
ater
ial
Col
our
of p
ipe
Pip
e di
amet
erH
oriz
onta
l or
vert
ical
Is fl
ow p
rese
nt?
Des
crib
eC
hara
cter
istic
s of
flow
(e.g
. hot
/col
d, c
lear
/col
oure
d, s
olid
s pr
esen
t, od
our)
.
Not
kn
own
1S
tain
less
ste
elS
ilve
ry g
rey
50
mm
Ver
tica
lS
lig
ht t
rick
leC
old
, mil
ky
col
our

Tracking Water Use to Cut CostsWRAP 37
Home 1 Why is saving water important?
2 A six-step procedure
4 Action plan 5 Further information
Appendices3 Dealing with more complex sites
Figure 22: Example effluent source information sheet
Site
: A
mbe
rly
Roa
dFe
edin
g to
dra
in e
ntry
poi
nt n
umbe
r:
14
Loca
tion:
B
uil
din
g 3
Exac
t loc
atio
n:
Man
hole
in
pat
h by
nor
th f
ace
Dep
artm
ent:
P
roce
ssin
gM
arke
d on
map
num
ber:
2
of
3
Inve
stig
ator
: J.
Sm
ith
Dat
e:
3
1/0
3/1
2Ti
me:
14
.30
For
each
pip
e/ch
anne
l fee
ding
into
dra
in e
ntry
poi
nt n
ote:
Sour
ce p
roce
ssN
umbe
rW
ater
use
to
prod
uce
effl
uent
Inte
rmitt
ent o
r co
ntin
uous
Pip
e or
cha
nnel
*D
escr
iptio
n
of e
fflu
ent
Pos
sibl
e co
ntam
inan
tsR
ate
of fl
ow, f
requ
ency
an
d du
ratio
n (w
ith u
nits
)
Ove
n c
lean
ing
1C
lean
ing
Inte
rmit
ten
tP
ipe,
st
ain
less
st
eel,
ver
tica
l
Foa
min
g,
brow
n, h
otD
eter
gen
ts,
bak
ed
and
bu
rnt
prod
uct
0.1
m3/e
ven
t in
clu
din
g
rin
sin
g.
On
ce e
very
tw
o w
eek
s, p
lus
ann
ual
shu
tdow
n c
lean
of
0.2
m3
* D
escr
iptio
n as
giv
en o
n dr
ain
entr
y po
int s
urve
y sh
eet.

Tracking Water Use to Cut CostsWRAP 38
Home 1 Why is saving water important?
2 A six-step procedure
4 Action plan 5 Further information
Appendices3 Dealing with more complex sites
Measuring flow ratesConsider the following questions before selecting a flow measurement system or contacting a supplier of flow measurement equipment:
¡ What level of accuracy is required?¡ Will the flow rate obtained by ‘bucket
and stopwatch’ methods be sufficiently accurate?
¡ How big are the pipes and can they be opened to insert an invasive flow measurement system?
¡ What are the temperature, pressure and range of speed of the water/effluent?
¡ Is the water clean or dirty? If dirty, what is the nature of the contamination?
¡ Is pipework old and corroded? Corrosion can cause problems for strap-on flow meters.
¡ Is pipework insulated or trace heated?¡ Will a pressure drop across an invasive
metering element be acceptable?Is a signal for output to online monitoring ¡or recording systems required?
Flow measurement systemsFlow measurement systems are summarised in Table 12. Note that the accuracy of flow measurement equipment is affected by the proximity of:
¡ valves;¡ bends; and
other items that affect the flow of water/ ¡effluent.
One benefit of using flow measurement systems is that the electrical signals produced by such systems can be collected in data loggers for trend analysis.
Dip tube methodAnother method of measuring the water level is a variation of the pressure technique. This uses a small dip tube to gently blow air bubbles into the water from below the surface. The amount of excess air pressure required to expel air is related to the depth of water above the end of the dip tube; the deeper the water, the higher the pressure required to expel air.

Tracking Water Use to Cut CostsWRAP 39
Home 1 Why is saving water important?
2 A six-step procedure
4 Action plan 5 Further information
Appendices3 Dealing with more complex sites
Table 12: Commonly used flow measurement techniques
Sens
or e
lem
ent
Type
Pri
ncip
leA
pplic
abili
tyCo
mm
on p
robl
ems
Turb
ine
(A)
IR
otat
ion
of tu
rbin
e bl
ades
by
flow
CW
PSo
lids
or s
olve
nts
Rot
amet
erI
Vari
able
are
aC
WP
Mus
t be
vert
ical
Ori
fice
(B)
IP
ress
ure
diff
eren
tial
CW
PSo
lids
may
blo
ck p
ress
ure
tapp
ings
Mag
netic
ID
isto
rtio
n of
mag
netic
fiel
dC
W/D
WP
Mus
t rem
ain
full*
Ther
mal
dilu
tion
IR
ate
of c
oolin
gC
W/D
WP
/C
Ult
raso
nic
(C) –
tim
e-of
-flig
htI/
NVe
ctor
add
ition
of v
eloc
ities
CW
/SD
WP
Mig
ht n
ot w
ork
in d
irty
wat
er
Ult
raso
nic
(C) –
Dop
pler
I/N
Ref
lect
ions
from
par
ticle
s in
wat
erD
WP
Will
not
wor
k in
cle
an w
ater
Ult
raso
nic
plus
pre
ssur
eI
Dop
pler
for
flow
pre
ssur
e fo
r de
pth
DW
P/C
Smal
l wei
r m
ay b
e re
quir
ed
Wei
r (D
)I/
NLe
vel u
pstr
eam
of w
eir
CW
/DW
CSe
ttlin
g so
lids
will
req
uire
rem
oval
Flum
e (D
)I/
NLe
vel u
pstr
eam
of f
lum
eC
W/D
WC
Sett
ling
solid
s w
ill r
equi
re r
emov
al
Buc
ket a
nd s
topw
atch
–Ti
me
take
n to
col
lect
a k
now
n vo
lum
eC
W/D
W‘S
pot’
flow
mea
sure
men
t
Dro
p ta
nk te
st (E
)–
Rat
e of
cha
nge
of d
epth
of t
ank
‘Spo
t’ flo
w m
easu
rem
ent
* So
me
new
sys
tem
s w
ill m
easu
re fl
ow in
par
t-fu
ll pi
pes.
(A
), (B
), et
c: s
ee o
verl
eaf f
or n
otes
on
thes
e di
ffer
ent s
yste
ms.
Key
:I =
in
vasi
veN
=
non-
inva
sive
CW
=
clea
n w
ater
DW
=
dirt
y w
ater
SDW
= s
light
ly d
irty
wat
erP
=
pipe
C =
ch
anne
l

Tracking Water Use to Cut CostsWRAP 40
Home 1 Why is saving water important?
2 A six-step procedure
4 Action plan 5 Further information
Appendices3 Dealing with more complex sites
(A) Turbine metersTurbine meters usually provide a direct visual display of cumulative flow. Instantaneous flow signals can usually be acquired from optional sensors which bolt onto the turbine casing and provide pulsed electrical outputs.
Installing a few inexpensive turbine-type water meters at key points in the water distribution system can enhance the results obtained from a water use survey. A flow meter for a 12.5mm (1/2”) pipe costs about £45 and for a 50mm (2”) pipe about £200.
(B) Orifice metersNumerous versions of inexpensive orifice meters, which give direct readings of instantaneous flow, are available.
(C) Ultrasonic metersStrap-on ultrasonic flow meters can give good results, but older pipework may cause problems.
(D) Weirs and flumesLevels at weirs or flumes, and hence the flow, can be measured non-invasively by ultrasonic distance measuring systems or invasively by pressure gauges.
(E) Drop tank testThese can be used to calibrate flow measurement systems.
It is important to consider the composition of the effluent.
¡ Foam on the surface of effluents can cause problems with ultrasonic systems.Effluent with a high solids content can ¡block standard pressure transmitters.Large diameter diaphragm-based pressure systems may be more suitable in such cases.
3.2.3 Cooling towers and steam relief valvesIf your site has cooling towers and/or steam relief valves, use the simplified approach described in Appendix F to calculate water use and losses. However, a more cost-effective approach to determining water use by a cooling tower is to fit a water meter on the make-up water pipeline.
3.3 Using the water balance to save money3.3.1 Using the results of the water balanceFor Step 5 (see Section 2.5), the water balance should also be used to identify:
¡ opportunities to reduce water use and wastewater/effluent generation. It is possible to reduce cleaning costs by up to 60%; and
¡ materials present in the effluent that contribute to pollution load (for which you pay higher trade effluent charges). Look for ways of eliminating or reducing the presence of these materials. Such materials include:
raw materials; -products; -by-products; and -wastes. -
You could save a substantial amount of money by recovering raw materials and product from your effluents. Section 3.3.3 describes how to calculate the pollution load and the associated reduction in trade effluent charges.
Chemical company recovers product worth £200,000/year from process effluentAn investment of £20,000 in new pipework and tanks enabled a chemical company to recycle a liquid waste stream. This saved the company £20,000/year in effluent charges and £200,000/year in recovered product and reduced disposal costs.
3.3.2 Consider options for water re-useIn some cases, it may be possible to re-use wastewater/effluents directly for another duty (e.g. low-grade cleaning) or to treat the effluent for water re-use and/or recovery of materials.
When considering water re-use, assess quality requirements and potential problems by talking to operators, equipment suppliers and your maintenance, quality control and health and safety departments.

Tracking Water Use to Cut CostsWRAP 41
Home 1 Why is saving water important?
2 A six-step procedure
4 Action plan 5 Further information
Appendices3 Dealing with more complex sites
Factors you should consider include:
¡ water quality (as a minimum):pH; -temperature; -chemical oxygen demand (COD); -dissolved and suspended solids; -specific substances used in the process; -microbiological concentrations; and -toxicity issues; -
¡ water availability;¡ frequency of use;¡ variability; and
flow patterns. ¡
Major savings with improved cask washing processA brewery knew that its cask washing plant used water inefficiently. A quality improvement team formed to evaluate the washing process identified a number of opportunities to achieve major savings. Final rinse water from cask washing is now recovered and re-used in other stages of the process (i.e. external rinses, pre-rinses, oil cooling/bung finding equipment and conveyor washing). Water consumption at the brewery fell significantly to give annual savings worth £23,000.
3.3.3 Reduce the pollution loadPollution load in an effluent is commonly expressed as:
¡ COD - this is a measure of the potential oxygen requirement of an effluent during natural breakdown of the polluting substances (i.e. its pollution potential); andtotal suspended solids (TSS) ¡ - this is a measure of solids present in the effluent.
Appendix G provides formulae to help you calculate the pollutant load and concentration of a pollutant in an effluent.
The benefits of investigating and implementing measures to reduce the pollution load include:
¡ reduced material losses to drain, leading to increased profits;
¡ reduced trade effluent charges (see Appendix A);
¡ recovered raw materials (usually the largest cost saving); andreduced load on effluent treatment plant ¡and other equipment.
In some cases, it may also be possible to increase concentrations to the point where material recovery becomes cost-effective.
To determine the concentration of material in an effluent flow:
¡ obtain a laboratory analysis of a representative sample; orcalculate the average concentration based ¡on the volume of effluent and the quantity of substance used. You will need to allow for the amount of substance released as product or to another waste stream, and thus not released in the effluent. This calculation will only provide a guideline figure.
It is important to remember that material concentrations in an effluent could vary considerably owing to the nature of the process and the timescales involved.
Advice on how to calculate concentrations and pollution loads for mixed flows is given in Appendix G.

Tracking Water Use to Cut CostsWRAP 42
Home 1 Why is saving water important?
2 A six-step procedure
4 Action plan 5 Further information
Appendices3 Dealing with more complex sites
Annual pollution loadUse your information to calculate the pollution load (e.g. on an annual basis) for the different flows. Figure 23 shows this information for an example factory (with three flows) displayed as a block diagram.
Use the information in your diagram to identify unnecessary or excessive pollution loads. Then consider ways of reducing the pollution load. Use Appendices A and G to estimate how much you would save by reducing the COD of your trade effluent. Don’t forget to count the cost of recovered or avoided materials in the savings.
Investigate those flows with a high pollution load. Find out:
¡ why the pollution load (i.e. COD or TSS) is so high;
¡ if the pollution load can be reduced; andif the flow can be reduced. ¡
Water companies use the Mogden Formula (see Appendix A) to calculate trade effluent charges. Reducing both the volume and the load of an effluent will reduce your costs. However, it is important to note that water saving measures that reduce individual effluents with a low pollution load will increase the average concentration of the overall effluent. It is therefore essential to check before taking action that the site’s trade effluent consent conditions will not be breached.
Date: 31/03/12Time: 14.30 hrsInvestigator: M BrownUnit operation: Laundry
Location: Hotel
Source: Mains water
Metered/unmetered
Use 2: Sink
Volume: 0.24m3/day
Use 1: Washing machine
Volume: 2.4m3/day
Date: 31/03/12Time: 10.30 hrsInvestigator: D WhiteUnit operation: Cooling tower
Location: Brewery
Use 1: Make-up water
Volume: 7m3/day
Source: Mains water
Metered/unmetered
Use 2: Hose
Volume: 5.4m3/day
Unit operation: Sweets production
Location: Confectionery
Flow 2: Milk make-up vessel
COD185kg/day
TSS23kg/day
Volume15m3/day
Flow 3: Polishing pan cleaning
COD65kg/day
TSS7kg/day
Volume55m3/day
Flow 1: Toffee cooker
COD770kg/day
TSS50kg/day
Volume1 ,630m3/day
Total effluent
COD1,020kg/day
TSS80kg/day
Volume1,700m3/day
Figure 23: Example annual effluent pollution load block diagram

Tracking Water Use to Cut CostsWRAP 43
Home 1 Why is saving water important?
2 A six-step procedure
3 Dealing with more complex sites
5 Further information
Appendices4 Action plan
4 Action plan
You should now be in a position to begin to develop an action plan to identify activities to improve water use in your organisation.
You should be able to identify some of these priority areas by looking at the data you have gathered. Your organisation will have its own goals determined by its own policies and practices. However, the easiest and lowest-cost actions will probably be carried through first as they do not require capital investment or time commitments and produce results that can be seen very quickly.
Development of a water balance should be carried out as part of a campaign to reduce water use and wastewater generation at your site. A systematic approach to reducing your water use is described in the WRAP guide ‘Saving Money Through Resource Efficiency: Reducing Water Use’ (www.wrap.org.uk) and the four phases of a typical water saving campaign are shown in Figure 6 (see Section 1.5).
Your organisation will have its own goals determined by its own policies and practices.
Find out how much your organisation is paying in water and effluent charges.
Construct a water balance for your site by following the six-step procedure described in this guide.
Use your water balance to identify opportunities to reduce water use and effluent generation.
Estimate potential savings from reducing water use and effluent generation.
Agree targets.
Identify and evaluate measures to reduce water use and effluent generation.
Implement cost-effective measures and monitor progress.
Review your water balance regularly.
If you want to reduce your water and effluent costs

Tracking Water Use to Cut CostsWRAP 44
Home 1 Why is saving water important?
2 A six-step procedure
3 Dealing with more complex sites
4 Action plan Appendices5 Further information
5 Further information
WRAP guides and tools¡ Saving Money Through Resource Efficiency: Reducing Water Use.¡ Reducing Your Water Consumption.¡ Resource Efficiency for Managers.¡ Environmental Strategic Review Guide.¡ Waste Mapping: Your Route to More Profit.¡ Workforce Partnerships for Resource Efficiency.¡ Green Office: A Guide to Running a More Cost-effective and Environmentally Sustainable
Office.¡ The Rippleffect: this provides a wealth of free advice and support to help your business to
save money by using water more efficiently.¡ Mogden Formula tool.¡ Water monitoring tool.
Useful links¡The Federation House Commitment: an agreement by companies in the food and drink
industry to reduce their water use www.fhc2020.co.uk/fhc/cms/¡ Water Technology List: Visit www.hmrc.gov.uk/capital-allowances/fya/water.htm or call
0844 875 5885.
The following agencies offer advice on regulations affecting water use and wastewater discharge:
¡ Environment Agency: Tel: 03708 506 506 www.environment-agency.gov.uk¡ Environment Agency Wales: Tel: 0370 850 6506
www.environment-agency.gov.uk/aboutus/organisation/35675.aspx¡ Scottish Environment Protection Agency (SEPA): Tel: 01786 457700 (Corporate Office)
www.sepa.org.uk¡ Northern Ireland Environment Agency (NIEA): Tel: 028 9262 3100 (Water Management
Unit) www.doeni.gov.uk/niea/
The following organisations are regulators of the water and sewerage industry in the UK:
¡ Ofwat: The Water Services Regulation Authority (Ofwat) is the economic regulator of the water and sewerage industry in England and Wales. Tel: 0121 644 7500 (www.ofwat.gov.uk)
¡ Water Industry Commission for Scotland: Tel: 01786 430200 (www.watercommission.co.uk)¡ Utility Regulator (Northern Ireland): Tel: 028 9031 1575
(www.uregni.gov.uk/)
Useful sources of information

Tracking Water Use to Cut CostsWRAP 45
Home 1 Why is saving water important?
2 A six-step procedure
3 Dealing with more complex sites
4 Action plan Appendices5 Further information
WRAP (Waste & Resources Action Programme) works in England, Scotland, Wales and Northern Ireland to help businesses and individuals reap the benefits of reducing waste, develop sustainable products and use resources in an efficient way.
Since its creation WRAP has funded projects that will, over their lifetimes, deliver over 120 million tonnes of waste diverted from landfill and over 20 million tonnes of CO2 equivalent greenhouse gases saved. Visit www.wrap.org.uk for more information on all of WRAP’s services.
What support can you get from WRAP?UK businesses could save £23 billion per year and help create and protect jobs by improving the way they use resources.
WRAP provides a range of free resource efficiency support for organisations including:
¡ WRAP Resource Efficiency Helpline on 0808 100 2040;¡ online tools and guidance; ¡ online training initiatives;¡ tailored business support for recycling companies;¡ case studies; and
guides. ¡
Visit www.wrap.org.uk to find out more.
WRAP

Tracking Water Use to Cut CostsWRAP 46
Home 1 Why is saving water important?
2 A six-step procedure
3 Dealing with more complex sites
4 Action plan 5 Further information
Appendices
Appendix A: UK charging schemes
This appendix provides information on UK charging schemes for April 2011-March 2012. However, such schemes are subject to change and updating. For the latest information on charging schemes affecting your site, please contact your local water company, sewerage undertaker or the regulator.
There is considerable variation throughout the UK with respect to charging for water and effluent services. There are a number of factors that affect charging, including:
¡ the service provider;¡ the size of the meter;¡ the tariff structure agreed with your service
provider – water volume is banded and the band into which a company falls will determine the charging tariff; andthe year – unit costs are reviewed on an ¡annual basis.
This appendix provides information about how water and effluent bills are calculated to help you understand:
¡ how your site is being charged for water use and wastewater discharge; andthe effect on your site’s charges of different ¡measures to reduce water use and effluent generation.
Details of UK charging schemes are summarised in Table A11 at the end of this appendix. The type of information provided on a water bill and a trade effluent bill, together with explanatory notes, is shown in Figure A1 and Figure A2 respectively.
Get into the habit of comparing meter readings on your bills with your own records. This is particularly important when your bills are based on estimated readings.
Water Company
Customer address:
Customer reference:
Meter serial no:
Meter location:
Meter size (actual): (agreed):
No. dials:
Tariff:
Previous reading:Present reading:
Standing charge:
Water charge
TOTAL CHARGE
Sewerage charge
Period:
X
Volume:
m3
Pence/m3
Pence/m3
i.e.Factorm3
Y
to
£
£
X – Y
Refers topipe size (mm)
Refers tothe numbershown aswhite digits
Dictatesunit costs
Relates to agreedpipe size
Unit cost relatedto tariff –see note 3
Only applies to afew water companies Unit costs are specific to
the water provider andwill change each yearMay appear on
trade effluent bill
Non-return to sewer allowance – specific toeach water company
2
3
4
5
6
8
9
7
1 Water andSewerage Company
Customer address:
Customer reference:
Consent no:
Sample point:
Trade effluent volume
Domestic charge
TOTAL CHARGE
LESS volume allowances
Steam losses
Water in product
Other allowances/losses
Period:
X
to
total m3m3
m3You will be asked toprovide data/calculationsfor these allowances
You will be asked toprovide this information
Unit costs are specific tothe sewerage undertakerand will change each year
Refers to tradeeffluent consentagreement
The water company willtake 4-6 samples a year
to analyse for COD andsuspended solids
1
6
Date A Date B2
X
Y
ZAverage strengths and solids
Average suspended solids mg/litre (St)
Average COD mg/litre (Ot)
LESS domestic volume adjustment
No. of employees or full-time equivalents
No. of days worked in period
Canteen present?
Daily per capita consumption (litres/head)
3
4
See note 2
Flow = (X-Y-Z)m
5
CHARGING DETAILS
Pence/m3
Pence/m3
£
mg/litre
Volume (m )3
Z
R Reception charge V Primary treatment charge
B Biological treatment charge
Bv Additional volume charge (if there is biological treatment)
S Sludge treatment charge
M Marine charge (effluent goes to sea)
OsSs Suspended solids concentration in crude sewage
Chemical oxygen demand of settled sewage
Trade effluent Charge = (R + V + Bv + M + [B(Ot/Os)] + [S(St/Ss)]) x volume of effluent (m3)
R C = Flow x R
V C = Flow x V
Bv C = Flow x Bv
M C = Flow x M
B C = Flow x (S x St/Ss)
S C = Flow x (B x Ot/Os)
Os
Ss
Figure A1: Information given on a water bill

Tracking Water Use to Cut CostsWRAP 47
Home 1 Why is saving water important?
2 A six-step procedure
3 Dealing with more complex sites
4 Action plan 5 Further information
Appendices
Water Company
Customer address:
Customer reference:
Meter serial no:
Meter location:
Meter size (actual): (agreed):
No. dials:
Tariff:
Previous reading:Present reading:
Standing charge:
Water charge
TOTAL CHARGE
Sewerage charge
Period:
X
Volume:
m3
Pence/m3
Pence/m3
i.e.Factorm3
Y
to
£
£
X – Y
Refers topipe size (mm)
Refers tothe numbershown aswhite digits
Dictatesunit costs
Relates to agreedpipe size
Unit cost relatedto tariff –see note 3
Only applies to afew water companies Unit costs are specific to
the water provider andwill change each yearMay appear on
trade effluent bill
Non-return to sewer allowance – specific toeach water company
2
3
4
5
6
8
9
7
1 Water andSewerage Company
Customer address:
Customer reference:
Consent no:
Sample point:
Trade effluent volume
Domestic charge
TOTAL CHARGE
LESS volume allowances
Steam losses
Water in product
Other allowances/losses
Period:
X
to
total m3m3
m3You will be asked toprovide data/calculationsfor these allowances
You will be asked toprovide this information
Unit costs are specific tothe sewerage undertakerand will change each year
Refers to tradeeffluent consentagreement
The water company willtake 4-6 samples a year
to analyse for COD andsuspended solids
1
6
Date A Date B2
X
Y
ZAverage strengths and solids
Average suspended solids mg/litre (St)
Average COD mg/litre (Ot)
LESS domestic volume adjustment
No. of employees or full-time equivalents
No. of days worked in period
Canteen present?
Daily per capita consumption (litres/head)
3
4
See note 2
Flow = (X-Y-Z)m
5
CHARGING DETAILS
Pence/m3
Pence/m3
£
mg/litre
Volume (m )3
Z
R Reception charge V Primary treatment charge
B Biological treatment charge
Bv Additional volume charge (if there is biological treatment)
S Sludge treatment charge
M Marine charge (effluent goes to sea)
OsSs Suspended solids concentration in crude sewage
Chemical oxygen demand of settled sewage
Trade effluent Charge = (R + V + Bv + M + [B(Ot/Os)] + [S(St/Ss)]) x volume of effluent (m3)
R C = Flow x R
V C = Flow x V
Bv C = Flow x Bv
M C = Flow x M
B C = Flow x (S x St/Ss)
S C = Flow x (B x Ot/Os)
Os
Ss
Figure A2: Information given on a trade effluent bill

Tracking Water Use to Cut CostsWRAP 48
Home 1 Why is saving water important?
2 A six-step procedure
3 Dealing with more complex sites
4 Action plan 5 Further information
Appendices
Water useMains supplyCharges for mains supply consist of two components:
¡ standing charge – a fixed annual sum, determined by the size of the meter; andvolumetric charge ¡ – a unit cost (pence/m3) charged on the actual amount of metered water used on-site. For a standard user tariff, the average cost of mains supply water for the UK is £1.20/m3 (2011/2012 prices), ranging from around 60p/m3 to £1.83/m3 depending on the service provider. The cost is subject to conditions (see below).
Unit costs are revised each year in April and vary between service providers. For an up-to-date list for England and Wales, visit www.ofwat.gov.uk
An example water bill is shown in Figure A1. For details of individual charging schemes, contact your service provider.
Abstraction from borehole or surface waterA charge for the abstraction of water from groundwater (borehole) or surface water (river, stream etc) applies to companies based in England, Wales, Scotland and Northern Ireland.
Abstractors are advised to consult their local regulator for up-to-date advice.
Charges in England and WalesThe annual charge payable under the abstraction licensing system administered by the Environment Agency is the sum of the standard charge and the compensation charge, calculated according to the following formula.
Annual charge = standard charge + compensation charge = (V × A × B × C × SUC) + (V × B × C × D × EIUC)
where: V = Volume specified on the licence (in thousand m3)
A = Source factor (supported, unsupported or tidal)
B = Season factor (summer, winter or all year)
C = Loss factor (high, medium, low or very low)
SUC = Standard Unit Charge (£ per thousand m3)
D = Adjusted source factor
EIUC = Environmental Improvement Unit Charge (£ per thousand m3)
¡ Volume. The annual charge is calculated from the volume (V) specified on the licence (in thousand m3) rather than volume abstracted.
¡ Source factor. The source factor (A) consists of three categories:
Unsupported (factor 1.0) – where -‘supported’ and ‘tidal’ do not apply;Supported (factor 3.0) – if the source of -the authorised abstraction is included in Schedule 1 of the Environment Agency Scheme of Abstraction Charges; andTidal (factor 0.2) – refers to those parts -of inland waters downstream of the normal tidal limit as marked on the 1:25000 Ordnance Survey map.
¡ Season factor. The season factor (B) consists of three categories:
Summer (factor 1.6) – abstraction -authorised between 1 April and 31 October inclusive;Winter (factor 0.16) – abstraction -authorised between 1 November and 31 March inclusive; andAll year (factor 1.0) – abstraction -authorised all year or not covered by either of the above categories.

Tracking Water Use to Cut CostsWRAP 49
Home 1 Why is saving water important?
2 A six-step procedure
3 Dealing with more complex sites
4 Action plan 5 Further information
Appendices
¡ Loss factor. The loss factor (C) consists of four categories:
High loss (factor 1.0) – spray irrigation, -dust suppression and other purposes where, due to evaporation, water use is not returned either directly or indirectly to any source of supply;Medium loss (factor 0.6) – public -and private supply, commercial and industrial purposes not specified elsewhere, boiler feed, use as a means of conveying material, bottling and uses which incorporate water in the product, agricultural purposes (excluding spray irrigation, fish farms and watercress growing) and anti-frost spraying;Low loss (factor 0.03) – includes mineral -and vegetable washing, and non- evaporative cooling; andVery low loss (factor 0.003) – power -generation of greater than 5MW, amenity pools through flow, hydraulic testing, fish farms, watercress growing, and effluent dilution.
¡ Standard Unit Charge (SUC). This refers to the fixed charge for the region in which the abstraction is authorised (in £ per thousand m3) and is subject to annual review. The average SUC in 2011/2012 across nine regions in England and Wales was around £17.7 per thousand m3. This equates to 1.7 pence/m3 and is considerably cheaper than mains supply water. However, abstracted water may require treatment (e.g. softening) before use.
¡ Adjusted source factor. The adjusted source factor (D) consists of two categories:
Non-tidal (factor 1.0) – for supported and -unsupported sources; andTidal (factor 0.2). -
¡ Environmental Improvement Unit Charge (EIUC). This funds compensation for the Restoring Sustainable Abstraction (RSA) programme and is collected on a regional basis.
An abstraction licence is not required under the following conditions:
¡ abstraction of less than 20m3 per day, used for any purpose;
¡ water used for fire fighting; andwith the regulator’s consent, abstraction ¡of more than 20m3 per day to test underground strata for the presence, quantity or quality of water.
There are several other cases where an abstraction licence may not be required, but it is advised that you check with the Environment Agency if in any doubt.
Charges in ScotlandUnder the Water Environment (Controlled Activities) (Scotland) Regulations 2011 (CAR), a CAR authorisation is required for abstraction from surface waters and groundwaters.
Annual subsistence charges will apply to licensed abstractions.
The abstraction subsistence charges are calculated for a licence and not for each individual controlled activity. This is because abstraction licences can include large numbers of activities managed within a single scheme. Monitoring and regulation is undertaken at the scheme level. In calculating abstraction charges, operators will only be charged once for the abstraction of water. Abstraction costs will be allocated between activities according to eight factors:
Subsistence (annual) charge (£) = Va × Lo × Le × So x Se × Pa × Na x Fa
where: Va = Volume abstracted factor (applies to the maximum daily volume authorised)
Lo = Loss factor
Le = Length affected factor
So = Source of abstraction factor
Se = Seasonality factor
Pa = Proportion of flow factor
Na = Number of abstractions factor
Fa = Financial factor

Tracking Water Use to Cut CostsWRAP 50
Home 1 Why is saving water important?
2 A six-step procedure
3 Dealing with more complex sites
4 Action plan 5 Further information
Appendices
Charges in Northern Ireland Abstraction is controlled under the Water Abstraction and Impoundment (Licensing) Regulations (Northern Ireland) 2009 (Fees and Charges).
Fees and charges:
Annual charge (£) = Vol x ST x S x Co x Fin
Where: Vol = Volume (for abstractions more than 100m3 per day)
ST = Source type
S = Seasonality
Co = Consumptiveness
Fin = Financial factor (annual standing charge)
Table A1: Charges in Scotland – components, bands and factors
Component Band Factor
Va More than 0m3 to 50m3 per day
More than 50m3 up to and including 100m3/day
More than 100m3 up to and including 2,000m3/day
More than 2,000m3 up to and including 10,000m3/day
More than 10,000m3 up to and including 50,000m3/day
More than 50,000m3 up to and including 150,000m3/day
More than 150,000m3/day
0
0.3
1
5
9.3
13.7
22.8
Lo Non-consumptive use
Partially consumptive use
Consumptive use
0.3
1
1.1
Le Returned less than 500m from abstraction
Returned 500m to less than 1km from abstraction
Returned 1km to 5km from abstraction
Returned more than 5km from abstraction
0.2
0.9
1.3
1.9
So Coastal and estuary
Inland waters
0.17
1
Se Winter only (1 October to 31 March)
Summer only (1 April to 31 October)
All year
0.1
0.3
1
Pa Less than 10% of 95th percentile flow abstracted
10% – 50% of 95th percentile flow abstracted
More than 50% of 95th percentile flow abstracted
0.95
1
1.05
Na 1 – 5
6 – 25
26 – 100
More than 100
1
2
3.6
9.4
Fa Around £1,000, updated annually (2011 – 2012 is £1,102)

Tracking Water Use to Cut CostsWRAP 51
Home 1 Why is saving water important?
2 A six-step procedure
3 Dealing with more complex sites
4 Action plan 5 Further information
Appendices
Disposal of wastewaterSewerageIn the same way as mains water, domestic sewerage charges consist of a standing charge and a volumetric charge (pence/m3). However, there are two different ways of calculating the volume attributed to this waste stream. Unit costs are revised each year in April and vary between sewerage providers. For further information, contact your service provider.
¡ Domestic wastewater only. If the only wastewater generated at the site is domestic, the sewerage volume will be based on the consumption of water supplied to the site. The sewerage charge will appear on the water bill.
If your water is supplied by a company that only supplies water, the bill will contain a charge on behalf of a sewerage undertaker.
¡ Domestic wastewater and trade effluent. If your site discharges both trade effluent and domestic wastewater, the sewerage charge will appear on the trade effluent bill. If the trade effluent is metered and the domestic wastewater is unmetered,
the volume of domestic wastewater can be calculated by subtracting the volume of trade effluent from the total volume of water supplied to the site. However, this may not be accurate if there are non-return losses such as water in product and loss from evaporation. In such cases, the site will be required to provide the following information:
number of employees or full-time -equivalents (A);number of days worked during the -period covered by the bill (B); andwhether the site has a canteen providing -hot meals (C).
The domestic allowance can then be calculated using the formula below:
A × B × Cwhere: C = typically 25 litres/person/day (no canteen)
= typically 40 litres/person/day (canteen)
Table A2: Charges in Northern Ireland – components, bands and factors
Component Band Factor
Vol 20m3 to 99m3/day
100m3 to 499m3/day
500m3 to 999m3/day
1,000m3 to 1,999m3/day
2,000m3 to 9,999m3/day
More than 10,000m3/day
0
2
5
10
15
25
ST Coastal and estuary
Inland water (river, lough, wetland, groundwaters)
0.1
1
S Seasonal
All year
0.3
1
Co Non-consumptive
Consumptive
0.05
1
Fin Annual charge financial factor (subject to annual review)
£319

Tracking Water Use to Cut CostsWRAP 52
Home 1 Why is saving water important?
2 A six-step procedure
3 Dealing with more complex sites
4 Action plan 5 Further information
Appendices
Trade effluentWater company charges for trade effluent discharged to sewer are based on the Mogden Formula. This formula links charges for a particular customer to the cost of treating the effluent (i.e. customers pay according to the volume and strength of their effluent).
Unit costs are revised each year in April and vary between service providers. For further information, contact your sewerage provider. An example trade effluent bill is shown in Figure A2.
The Mogden Formula is expressed as follows in the UK.
England, Wales and Northern Ireland
C = R + M + V + Bv + +
where: C = Total charge (pence/m3)
R = Charge for reception and conveyance (pence/m3)
M = Charge for treatment and disposal where effluent goes to a sea outfall (M for marine) (pence/m3)
V = Charge for primary treatment (V for volumetric) (pence/m3)
Bv = Additional volume charge if biological treatment is required (pence/m3). Also referred to as B1.
Ot = Chemical oxygen demand (COD) of effluent after one hour quiescent settlement at pH 7 (mg/litre)
B = Biochemical oxygen demand (BOD) of settled sewage (pence/m3). Also referred to as B2
Os = COD of crude sewage after one hour quiescent settlement (mg/litre)
St = Total suspended solids (TSS) (mg/litre) of trade effluent at pH 7
S = Charge for treatment and disposal of primary sludge (pence/m3)
Ss = Settleable solids (mg/litre), suspended solids after one hour quiescent settlement
ScotlandIn Scotland, there are two charges:
Operating charge (based on the Mogden ¡Formula):
Operating charge = AVD x [Ro +Vo +Bo x (Ot/Os) + So x (St/Ss)]
where: Ro ≡ R
Vo ≡ V
So ≡ S
Bo = Secondary treatment charging component (pence/m³)
AVD = Actual volume discharged (m3)
Annual availability charge (Ca): ¡
Ca = 365 × [CDV × (Ra + Va) + (Ba × sBODl) + (Sa × TSSl)]
where: CDV = Chargeable daily volume (m3)
Ra = Reception charge (pence/m3/day)
Va = Primary treatment charge (pence/m3/day)
Ba = Biological capacity charge (pence/kg/day)
Sa = Sludge capacity charge (pence/kg/day)
sBODl = Settled biochemical oxygen demand (BOD) load (kg/day)
TSSl = Total suspended solids (TSS) load (kg/day)
S × St Ss
B × Ot Os

Tracking Water Use to Cut CostsWRAP 53
Home 1 Why is saving water important?
2 A six-step procedure
3 Dealing with more complex sites
4 Action plan 5 Further information
Appendices
Estimating trade effluent chargesUse the Mogden Formula tool on the WRAP website to:
¡ calculate your existing effluent charges; anddetermine how much money you could save ¡by reducing the volume and strength (COD and TSS) of your effluent.
The tool contains all the necessary unit costs for each component of the Mogden Formula for all UK sewerage undertakers.
Discharge to surface and point source effluent to groundwatersEngland and WalesSince April 2010, discharges to surface waters and of point source sewage effluent to ground/groundwater have been subject to the Environmental Permitting Regulations.
A company in England and Wales must obtain the consent of the Environment Agency to discharge to controlled waters. There are two types of charges for water discharges: application charges and subsistence charges.
The subsistence charge depends on four factors:
¡ volume – maximum daily volume;¡ content of discharge;¡ receiving water – groundwaters, coastal,
surface, estuarine; andfinancial factor – fixed multiplier (£). ¡
These are multiplied together to calculate the subsistence charge.
Subsistence charge = A × B × C × Dwhere: A = Volume factor (maximum daily volume)
B = Contents factor
C = Receiving waters factor
D = Financial factor
¡ The volume factor (A) uses a banded approach and relates to the maximum daily volume (see Table A3).
¡ The contents factor (B) relates to the provisions in the consent issued by the Environment Agency controlling the contents of the discharge (see Table A4). For example, Band A includes wastewater containing organics such as pesticides, and aliphatic and aromatic hydrocarbons (chlorinated and non-chlorinated).
¡ The receiving waters factor (C) consists of four categories (see Table A5).The financial factor (D) is a fixed annual ¡fee and is subject to an annual review. For 2011/2012, the charge is £684.
Table A3: Volume factor: England and Wales
Table A4: Contents factor: England and Wales
Volume (m3) Band Factor
0 – 5
5 – 20
20 – 100
100 – 1,000
1,000 – 10,000
10,000 – 50,000
50,000 – 150,000
More than 150,000
A
B
C
D
E
F
G
H
0.3
0.5
1
2
3
5
9
14
Band Factor
A 14
B 5
C 3
D 2
E 1
F 0.5
G 0.3
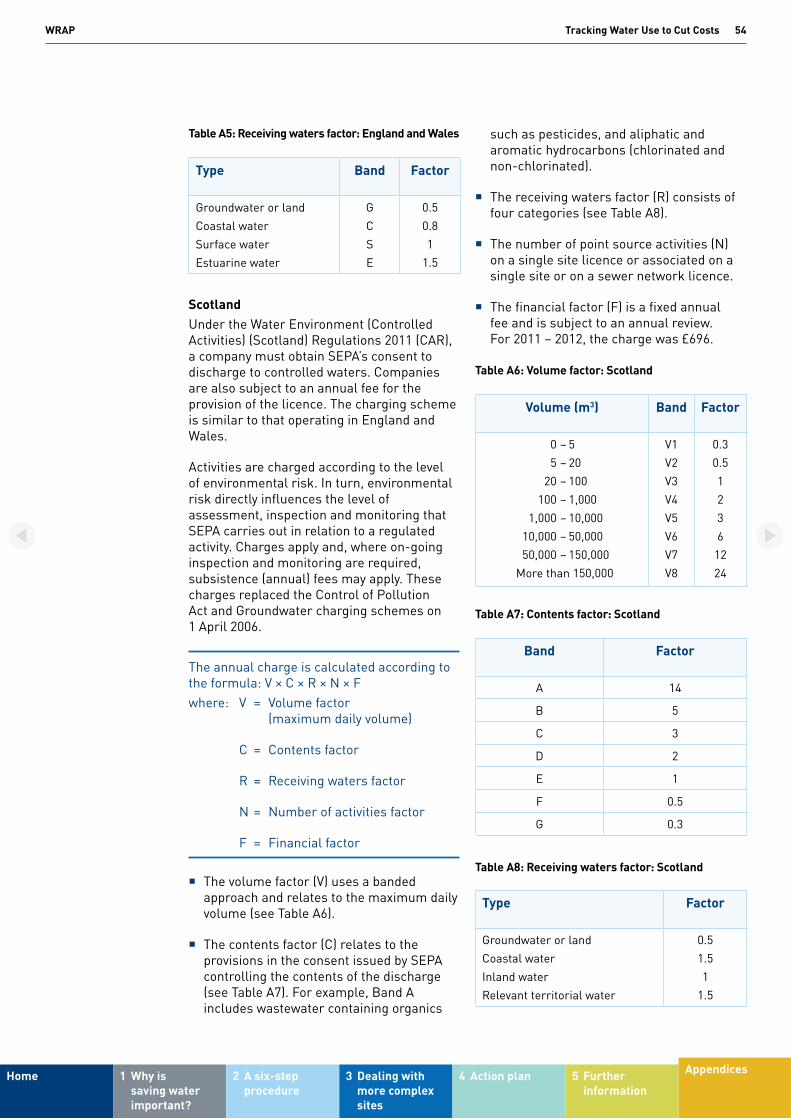
Tracking Water Use to Cut CostsWRAP 54
Home 1 Why is saving water important?
2 A six-step procedure
3 Dealing with more complex sites
4 Action plan 5 Further information
Appendices
Table A5: Receiving waters factor: England and Wales
ScotlandUnder the Water Environment (Controlled Activities) (Scotland) Regulations 2011 (CAR), a company must obtain SEPA’s consent to discharge to controlled waters. Companies are also subject to an annual fee for the provision of the licence. The charging scheme is similar to that operating in England and Wales.
Activities are charged according to the level of environmental risk. In turn, environmental risk directly influences the level of assessment, inspection and monitoring that SEPA carries out in relation to a regulated activity. Charges apply and, where on-going inspection and monitoring are required, subsistence (annual) fees may apply. These charges replaced the Control of Pollution Act and Groundwater charging schemes on 1 April 2006.
The annual charge is calculated according to the formula: V × C × R × N × Fwhere: V = Volume factor (maximum daily volume)
C = Contents factor
R = Receiving waters factor
N = Number of activities factor
F = Financial factor
The volume factor (V) uses a banded ¡approach and relates to the maximum daily volume (see Table A6).
The contents factor (C) relates to the ¡provisions in the consent issued by SEPA controlling the contents of the discharge (see Table A7). For example, Band A includes wastewater containing organics
such as pesticides, and aliphatic and aromatic hydrocarbons (chlorinated and non-chlorinated).
The receiving waters factor (R) consists of ¡four categories (see Table A8).
The number of point source activities (N) ¡on a single site licence or associated on a single site or on a sewer network licence.
The financial factor (F) is a fixed annual ¡fee and is subject to an annual review. For 2011 – 2012, the charge was £696.
Table A6: Volume factor: Scotland
Table A7: Contents factor: Scotland
Table A8: Receiving waters factor: Scotland
Type Band Factor
Groundwater or land
Coastal water
Surface water
Estuarine water
G
C
S
E
0.5
0.8
1
1.5
Type Factor
Groundwater or land
Coastal water
Inland water
Relevant territorial water
0.5
1.5
1
1.5
Band Factor
A 14
B 5
C 3
D 2
E 1
F 0.5
G 0.3
Volume (m3) Band Factor
0 – 5
5 – 20
20 – 100
100 – 1,000
1,000 – 10,000
10,000 – 50,000
50,000 – 150,000
More than 150,000
V1
V2
V3
V4
V5
V6
V7
V8
0.3
0.5
1
2
3
6
12
24

Tracking Water Use to Cut CostsWRAP 55
Home 1 Why is saving water important?
2 A six-step procedure
3 Dealing with more complex sites
4 Action plan 5 Further information
Appendices
Northern IrelandUnder the Water (Northern Ireland) Order 1999, a company must obtain the consent of the NIEA to discharge trade or sewage effluent to a waterway or into groundwater. The charging scheme is similar to that operating in the rest of the UK.
The annual charge is calculated according to the formula: V × C × F
where: V = Volume factor (maximum daily volume)
C = Contents factor
F = Financial factor
The volume factor (V) uses a banded ¡approach and relates to the maximum daily volume (see Table A9).
¡ The contents factor (C) relates to the provisions in the consent issued by the NIEA controlling the contents of the discharge (see Table A10). For example, Band A includes wastewater containing organics such as pesticides, and aliphatic and aromatic hydrocarbons (chlorinated and non-chlorinated).The financial factor (F) is a fixed annual ¡fee and is subject to an annual review. For 2012, this charge is £445.
Table A9: Volume factor: Northern Ireland
Table A10: Contents factor: Northern Ireland
Surface drainage
Surface drainage refers to rainwater from roof run-off and from car park run-off that discharges to the public surface drainage sewer. It should not be confused with discharge direct to surface water (covered above). A company can be charged for surface drainage:
¡ on the basis of the rateable value of the property;
¡ as part of the sewerage standing charge;¡ as part of the sewerage volumetric charge;
andon the basis of the surface area of the site. ¡
If your company diverts surface water drains to foul sewer or to an effluent treatment plant prior to discharge, then you may be being charged twice (i.e. once as surface water and then again as trade effluent). Consult your service provider as you may be entitled to a rebate.
Non-return allowanceIn cases where water and wastewater do not return to sewer, you may be entitled to a non-return allowance. These include the following.
¡ Domestic sewerage allowance. Most, but not all, water companies assume that on average up to 10% of the metered water supplied to the consumer is not returned to sewer. This allowance should be included in the calculation of charges and appear on the bill as a factor (e.g. a 10% allowance would appear as a factor of 0.90).
Band Factor
A 14
B 5
C 3
D 2
E 1
F 0.5
G 0.3
Volume (m3) Factor
0 – 5
5 – 20
20 – 100
100 – 1,000
1,000 – 10,000
10,000 – 50,000
50,000 – 150,000
More than 150,000
0.3
0.5
1
2
3
5
9
14
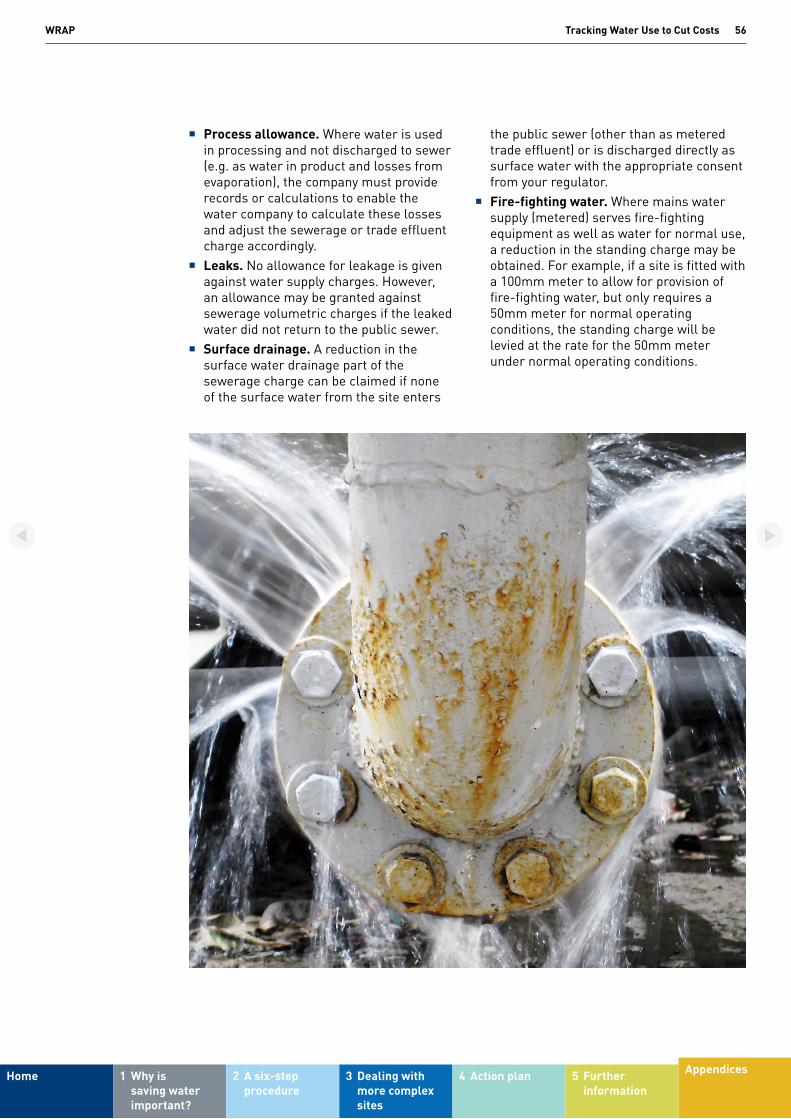
Tracking Water Use to Cut CostsWRAP 56
Home 1 Why is saving water important?
2 A six-step procedure
3 Dealing with more complex sites
4 Action plan 5 Further information
Appendices
¡ Process allowance. Where water is used in processing and not discharged to sewer (e.g. as water in product and losses from evaporation), the company must provide records or calculations to enable the water company to calculate these losses and adjust the sewerage or trade effluent charge accordingly.
¡ Leaks. No allowance for leakage is given against water supply charges. However, an allowance may be granted against sewerage volumetric charges if the leaked water did not return to the public sewer.
¡ Surface drainage. A reduction in the surface water drainage part of the sewerage charge can be claimed if none of the surface water from the site enters
the public sewer (other than as metered trade effluent) or is discharged directly as surface water with the appropriate consent from your regulator.
¡ Fire-fighting water. Where mains water supply (metered) serves fire-fighting equipment as well as water for normal use, a reduction in the standing charge may be obtained. For example, if a site is fitted with a 100mm meter to allow for provision of fire-fighting water, but only requires a 50mm meter for normal operating conditions, the standing charge will be levied at the rate for the 50mm meter under normal operating conditions.

Tracking Water Use to Cut CostsWRAP 57
Home 1 Why is saving water important?
2 A six-step procedure
3 Dealing with more complex sites
4 Action plan 5 Further information
Appendices
Table A11: Summary of UK charging schemes as of March 2012
Regi
onW
ater
Mai
nsA
bstr
acte
d
Engl
and
üVo
lum
etri
c ch
arge
+ S
tand
ing
char
geü
Ann
ual c
harg
e =
(V ×
A ×
B ×
C ×
SU
C) +
(V ×
B ×
C ×
D ×
EIU
C)
Wal
esü
Volu
met
ric
char
ge +
Sta
ndin
g ch
arge
üA
nnua
l cha
rge
= (V
× A
× B
× C
× S
UC
) + (V
× B
× C
× D
× E
IUC
)
Scot
land
üVo
lum
etri
c ch
arge
+ S
tand
ing
char
geü
Ann
ual c
harg
e =
Va ×
Lo
× Le
× S
o ×
Se ×
Pa
× N
a x
Fa
Nor
ther
n Ir
elan
dü
Volu
met
ric
char
ge +
Sta
ndin
g ch
arge
üA
nnua
l cha
rge
= Vo
l × S
T ×
S ×
Co
× Fi
n
Regi
onW
aste
wat
er
Sew
erag
eSu
rfac
e dr
aina
geTr
ade
effl
uent
Dis
char
ge to
con
trol
led
wat
er*
Engl
and
üV+
Sü
Vari
ous*
*ü
Mog
den
Form
ula
üA
nnua
l cha
rge
= A
× B
× C
× D
Wal
esü
V+S
üVa
riou
s**
üM
ogde
n Fo
rmul
aü
Ann
ual c
harg
e =
A ×
B ×
C ×
D
Scot
land
üV+
Sü
Rat
eabl
e va
lue
of p
rope
rty*
**ü
Ope
ratin
g ch
arge
†an
d Av
aila
bilit
ych
arge
üA
nnua
l cha
rge
= V
× C
× R
× F
Nor
ther
n Ir
elan
dü
V+S
üVo
lum
e ch
arge
üM
ogde
n Fo
rmul
aü
Ann
ual c
harg
e =
V ×
C ×
F
V+S
Vo
lum
etri
c ch
arge
+ S
tand
ing
char
ge.
†
Bas
ed o
n M
ogde
n Fo
rmul
a.*
R
efer
red
to a
s di
scha
rge
cons
ent i
n N
orth
ern
Irel
and.
**
Incl
udes
vol
ume
char
ge, s
tand
ing
char
ge a
nd s
urfa
ce a
rea
of s
ite.
***
A
com
pone
nt o
f the
sew
erag
e ch
arge
.
Uni
t cos
ts a
re r
evie
wed
eac
h ye
ar a
nd v
ary
betw
een
serv
ice
prov
ider
s. F
or fu
rthe
r de
tails
incl
udin
g un
it co
sts,
con
tact
you
r se
rvic
e pr
ovid
er.
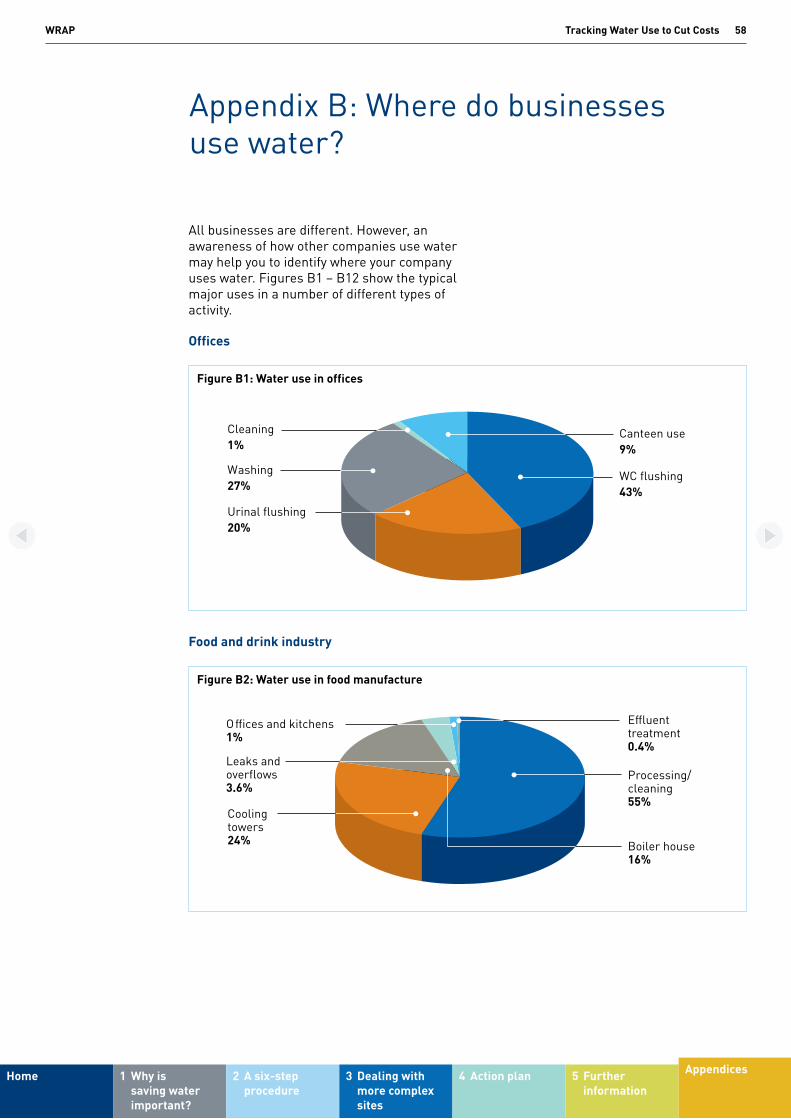
Tracking Water Use to Cut CostsWRAP 58
Home 1 Why is saving water important?
2 A six-step procedure
3 Dealing with more complex sites
4 Action plan 5 Further information
Appendices
Appendix B: Where do businesses use water?
All businesses are different. However, an awareness of how other companies use water may help you to identify where your company uses water. Figures B1 – B12 show the typical major uses in a number of different types of activity.
Offices
WC flushing43%
Canteen use9%
Urinal flushing20%
Cleaning1%
Washing27%
Processing/cleaning55%
Boiler house16%
Coolingtowers24%
Effluenttreatment0.4%
Leaks andoverflows3.6%
Offices and kitchens1%
Brewhouse3%
Packaging/cleaning70%
Conditioning12%
Product15%
Rinsing of containers 4%
Boiler house 4%
Pasteurisers 6%
Other 1%Floor washing 1%Domestic use 3%
Equipmentpreparation 3%
Product 78%
Lairage washing 3%
Scald tank 7%Cooling water 6%
Vehicle washing 5%Knife sterilising 5%
Personal hygiene 10%
Sprays and rinses 31%
Floor/equipmentcleaning 33%
Vehicle washing 1%(cold water)
Personal hygiene 2%
Scald tank 9%(hot water)
Evisceration 24%(67% hot water)
Feather fluming 1%(cold water)
Crate and modulewashing 6%(cold water)
Floor washing 30%(50% hot water)
Carcass chilling 27%(cold water)
Boiler10%
CIP hot13%
Processapplications23%
CIP cold 13%
Hygiene3%
Fridgeevaporativecondenser38%
Processing20%
Generalwashing25%
Rinsing55%
Boilers10%
Finishing15%
Batch dyeing75%
Boilers10%
Finishing13%
Preparation27%
Batch dyeing50%
Vacuum systems 1%
Housekeeping 3%Product washing 3%
Domestic uses 3% Effluent dilution 6%
Cooling 27%
Air pollutioncontrol 7%
Plant and vesselwashing 4%
Steamproduction25%
Raw material 21%
Refiner sealing water 2%Screen rejects dilution 2%
Felt cleaning 2%
Vacuum pump 29%
Disc thickenershowers 10%
Wire showers 16%
Other 3%
Pulper showers 5%
Hoses 4%Chemical carryingwater 4%
Box lubricationshowers 8%
Pump glandsealing water 10%
Sheetknock-off 5%
Figure B1: Water use in offices
Food and drink industry
WC flushing43%
Canteen use9%
Urinal flushing20%
Cleaning1%
Washing27%
Processing/cleaning55%
Boiler house16%
Coolingtowers24%
Effluenttreatment0.4%
Leaks andoverflows3.6%
Offices and kitchens1%
Brewhouse3%
Packaging/cleaning70%
Conditioning12%
Product15%
Rinsing of containers 4%
Boiler house 4%
Pasteurisers 6%
Other 1%Floor washing 1%Domestic use 3%
Equipmentpreparation 3%
Product 78%
Lairage washing 3%
Scald tank 7%Cooling water 6%
Vehicle washing 5%Knife sterilising 5%
Personal hygiene 10%
Sprays and rinses 31%
Floor/equipmentcleaning 33%
Vehicle washing 1%(cold water)
Personal hygiene 2%
Scald tank 9%(hot water)
Evisceration 24%(67% hot water)
Feather fluming 1%(cold water)
Crate and modulewashing 6%(cold water)
Floor washing 30%(50% hot water)
Carcass chilling 27%(cold water)
Boiler10%
CIP hot13%
Processapplications23%
CIP cold 13%
Hygiene3%
Fridgeevaporativecondenser38%
Processing20%
Generalwashing25%
Rinsing55%
Boilers10%
Finishing15%
Batch dyeing75%
Boilers10%
Finishing13%
Preparation27%
Batch dyeing50%
Vacuum systems 1%
Housekeeping 3%Product washing 3%
Domestic uses 3% Effluent dilution 6%
Cooling 27%
Air pollutioncontrol 7%
Plant and vesselwashing 4%
Steamproduction25%
Raw material 21%
Refiner sealing water 2%Screen rejects dilution 2%
Felt cleaning 2%
Vacuum pump 29%
Disc thickenershowers 10%
Wire showers 16%
Other 3%
Pulper showers 5%
Hoses 4%Chemical carryingwater 4%
Box lubricationshowers 8%
Pump glandsealing water 10%
Sheetknock-off 5%
Figure B2: Water use in food manufacture

Tracking Water Use to Cut CostsWRAP 59
Home 1 Why is saving water important?
2 A six-step procedure
3 Dealing with more complex sites
4 Action plan 5 Further information
Appendices
WC flushing43%
Canteen use9%
Urinal flushing20%
Cleaning1%
Washing27%
Processing/cleaning55%
Boiler house16%
Coolingtowers24%
Effluenttreatment0.4%
Leaks andoverflows3.6%
Offices and kitchens1%
Brewhouse3%
Packaging/cleaning70%
Conditioning12%
Product15%
Rinsing of containers 4%
Boiler house 4%
Pasteurisers 6%
Other 1%Floor washing 1%Domestic use 3%
Equipmentpreparation 3%
Product 78%
Lairage washing 3%
Scald tank 7%Cooling water 6%
Vehicle washing 5%Knife sterilising 5%
Personal hygiene 10%
Sprays and rinses 31%
Floor/equipmentcleaning 33%
Vehicle washing 1%(cold water)
Personal hygiene 2%
Scald tank 9%(hot water)
Evisceration 24%(67% hot water)
Feather fluming 1%(cold water)
Crate and modulewashing 6%(cold water)
Floor washing 30%(50% hot water)
Carcass chilling 27%(cold water)
Boiler10%
CIP hot13%
Processapplications23%
CIP cold 13%
Hygiene3%
Fridgeevaporativecondenser38%
Processing20%
Generalwashing25%
Rinsing55%
Boilers10%
Finishing15%
Batch dyeing75%
Boilers10%
Finishing13%
Preparation27%
Batch dyeing50%
Vacuum systems 1%
Housekeeping 3%Product washing 3%
Domestic uses 3% Effluent dilution 6%
Cooling 27%
Air pollutioncontrol 7%
Plant and vesselwashing 4%
Steamproduction25%
Raw material 21%
Refiner sealing water 2%Screen rejects dilution 2%
Felt cleaning 2%
Vacuum pump 29%
Disc thickenershowers 10%
Wire showers 16%
Other 3%
Pulper showers 5%
Hoses 4%Chemical carryingwater 4%
Box lubricationshowers 8%
Pump glandsealing water 10%
Sheetknock-off 5%
Figure B3: Water use in brewing
WC flushing43%
Canteen use9%
Urinal flushing20%
Cleaning1%
Washing27%
Processing/cleaning55%
Boiler house16%
Coolingtowers24%
Effluenttreatment0.4%
Leaks andoverflows3.6%
Offices and kitchens1%
Brewhouse3%
Packaging/cleaning70%
Conditioning12%
Product15%
Rinsing of containers 4%
Boiler house 4%
Pasteurisers 6%
Other 1%Floor washing 1%Domestic use 3%
Equipmentpreparation 3%
Product 78%
Lairage washing 3%
Scald tank 7%Cooling water 6%
Vehicle washing 5%Knife sterilising 5%
Personal hygiene 10%
Sprays and rinses 31%
Floor/equipmentcleaning 33%
Vehicle washing 1%(cold water)
Personal hygiene 2%
Scald tank 9%(hot water)
Evisceration 24%(67% hot water)
Feather fluming 1%(cold water)
Crate and modulewashing 6%(cold water)
Floor washing 30%(50% hot water)
Carcass chilling 27%(cold water)
Boiler10%
CIP hot13%
Processapplications23%
CIP cold 13%
Hygiene3%
Fridgeevaporativecondenser38%
Processing20%
Generalwashing25%
Rinsing55%
Boilers10%
Finishing15%
Batch dyeing75%
Boilers10%
Finishing13%
Preparation27%
Batch dyeing50%
Vacuum systems 1%
Housekeeping 3%Product washing 3%
Domestic uses 3% Effluent dilution 6%
Cooling 27%
Air pollutioncontrol 7%
Plant and vesselwashing 4%
Steamproduction25%
Raw material 21%
Refiner sealing water 2%Screen rejects dilution 2%
Felt cleaning 2%
Vacuum pump 29%
Disc thickenershowers 10%
Wire showers 16%
Other 3%
Pulper showers 5%
Hoses 4%Chemical carryingwater 4%
Box lubricationshowers 8%
Pump glandsealing water 10%
Sheetknock-off 5%
Figure B4: Water use in soft drinks manufacture – carbonates or dilutables category
WC flushing43%
Canteen use9%
Urinal flushing20%
Cleaning1%
Washing27%
Processing/cleaning55%
Boiler house16%
Coolingtowers24%
Effluenttreatment0.4%
Leaks andoverflows3.6%
Offices and kitchens1%
Brewhouse3%
Packaging/cleaning70%
Conditioning12%
Product15%
Rinsing of containers 4%
Boiler house 4%
Pasteurisers 6%
Other 1%Floor washing 1%Domestic use 3%
Equipmentpreparation 3%
Product 78%
Lairage washing 3%
Scald tank 7%Cooling water 6%
Vehicle washing 5%Knife sterilising 5%
Personal hygiene 10%
Sprays and rinses 31%
Floor/equipmentcleaning 33%
Vehicle washing 1%(cold water)
Personal hygiene 2%
Scald tank 9%(hot water)
Evisceration 24%(67% hot water)
Feather fluming 1%(cold water)
Crate and modulewashing 6%(cold water)
Floor washing 30%(50% hot water)
Carcass chilling 27%(cold water)
Boiler10%
CIP hot13%
Processapplications23%
CIP cold 13%
Hygiene3%
Fridgeevaporativecondenser38%
Processing20%
Generalwashing25%
Rinsing55%
Boilers10%
Finishing15%
Batch dyeing75%
Boilers10%
Finishing13%
Preparation27%
Batch dyeing50%
Vacuum systems 1%
Housekeeping 3%Product washing 3%
Domestic uses 3% Effluent dilution 6%
Cooling 27%
Air pollutioncontrol 7%
Plant and vesselwashing 4%
Steamproduction25%
Raw material 21%
Refiner sealing water 2%Screen rejects dilution 2%
Felt cleaning 2%
Vacuum pump 29%
Disc thickenershowers 10%
Wire showers 16%
Other 3%
Pulper showers 5%
Hoses 4%Chemical carryingwater 4%
Box lubricationshowers 8%
Pump glandsealing water 10%
Sheetknock-off 5%
Figure B5: Water use in red meat processing

Tracking Water Use to Cut CostsWRAP 60
Home 1 Why is saving water important?
2 A six-step procedure
3 Dealing with more complex sites
4 Action plan 5 Further information
Appendices
WC flushing43%
Canteen use9%
Urinal flushing20%
Cleaning1%
Washing27%
Processing/cleaning55%
Boiler house16%
Coolingtowers24%
Effluenttreatment0.4%
Leaks andoverflows3.6%
Offices and kitchens1%
Brewhouse3%
Packaging/cleaning70%
Conditioning12%
Product15%
Rinsing of containers 4%
Boiler house 4%
Pasteurisers 6%
Other 1%Floor washing 1%Domestic use 3%
Equipmentpreparation 3%
Product 78%
Lairage washing 3%
Scald tank 7%Cooling water 6%
Vehicle washing 5%Knife sterilising 5%
Personal hygiene 10%
Sprays and rinses 31%
Floor/equipmentcleaning 33%
Vehicle washing 1%(cold water)
Personal hygiene 2%
Scald tank 9%(hot water)
Evisceration 24%(67% hot water)
Feather fluming 1%(cold water)
Crate and modulewashing 6%(cold water)
Floor washing 30%(50% hot water)
Carcass chilling 27%(cold water)
Boiler10%
CIP hot13%
Processapplications23%
CIP cold 13%
Hygiene3%
Fridgeevaporativecondenser38%
Processing20%
Generalwashing25%
Rinsing55%
Boilers10%
Finishing15%
Batch dyeing75%
Boilers10%
Finishing13%
Preparation27%
Batch dyeing50%
Vacuum systems 1%
Housekeeping 3%Product washing 3%
Domestic uses 3% Effluent dilution 6%
Cooling 27%
Air pollutioncontrol 7%
Plant and vesselwashing 4%
Steamproduction25%
Raw material 21%
Refiner sealing water 2%Screen rejects dilution 2%
Felt cleaning 2%
Vacuum pump 29%
Disc thickenershowers 10%
Wire showers 16%
Other 3%
Pulper showers 5%
Hoses 4%Chemical carryingwater 4%
Box lubricationshowers 8%
Pump glandsealing water 10%
Sheetknock-off 5%
Figure B6: Water use in poultry meat processing
Figure B7: Water use in skimmed milk processing
WC flushing43%
Canteen use9%
Urinal flushing20%
Cleaning1%
Washing27%
Processing/cleaning55%
Boiler house16%
Coolingtowers24%
Effluenttreatment0.4%
Leaks andoverflows3.6%
Offices and kitchens1%
Brewhouse3%
Packaging/cleaning70%
Conditioning12%
Product15%
Rinsing of containers 4%
Boiler house 4%
Pasteurisers 6%
Other 1%Floor washing 1%Domestic use 3%
Equipmentpreparation 3%
Product 78%
Lairage washing 3%
Scald tank 7%Cooling water 6%
Vehicle washing 5%Knife sterilising 5%
Personal hygiene 10%
Sprays and rinses 31%
Floor/equipmentcleaning 33%
Vehicle washing 1%(cold water)
Personal hygiene 2%
Scald tank 9%(hot water)
Evisceration 24%(67% hot water)
Feather fluming 1%(cold water)
Crate and modulewashing 6%(cold water)
Floor washing 30%(50% hot water)
Carcass chilling 27%(cold water)
Boiler10%
CIP hot13%
Processapplications23%
CIP cold 13%
Hygiene3%
Fridgeevaporativecondenser38%
Processing20%
Generalwashing25%
Rinsing55%
Boilers10%
Finishing15%
Batch dyeing75%
Boilers10%
Finishing13%
Preparation27%
Batch dyeing50%
Vacuum systems 1%
Housekeeping 3%Product washing 3%
Domestic uses 3% Effluent dilution 6%
Cooling 27%
Air pollutioncontrol 7%
Plant and vesselwashing 4%
Steamproduction25%
Raw material 21%
Refiner sealing water 2%Screen rejects dilution 2%
Felt cleaning 2%
Vacuum pump 29%
Disc thickenershowers 10%
Wire showers 16%
Other 3%
Pulper showers 5%
Hoses 4%Chemical carryingwater 4%
Box lubricationshowers 8%
Pump glandsealing water 10%
Sheetknock-off 5%
Figure B8: Water use in leather manufacture
Leather and textile industries

Tracking Water Use to Cut CostsWRAP 61
Home 1 Why is saving water important?
2 A six-step procedure
3 Dealing with more complex sites
4 Action plan 5 Further information
Appendices
WC flushing43%
Canteen use9%
Urinal flushing20%
Cleaning1%
Washing27%
Processing/cleaning55%
Boiler house16%
Coolingtowers24%
Effluenttreatment0.4%
Leaks andoverflows3.6%
Offices and kitchens1%
Brewhouse3%
Packaging/cleaning70%
Conditioning12%
Product15%
Rinsing of containers 4%
Boiler house 4%
Pasteurisers 6%
Other 1%Floor washing 1%Domestic use 3%
Equipmentpreparation 3%
Product 78%
Lairage washing 3%
Scald tank 7%Cooling water 6%
Vehicle washing 5%Knife sterilising 5%
Personal hygiene 10%
Sprays and rinses 31%
Floor/equipmentcleaning 33%
Vehicle washing 1%(cold water)
Personal hygiene 2%
Scald tank 9%(hot water)
Evisceration 24%(67% hot water)
Feather fluming 1%(cold water)
Crate and modulewashing 6%(cold water)
Floor washing 30%(50% hot water)
Carcass chilling 27%(cold water)
Boiler10%
CIP hot13%
Processapplications23%
CIP cold 13%
Hygiene3%
Fridgeevaporativecondenser38%
Processing20%
Generalwashing25%
Rinsing55%
Boilers10%
Finishing15%
Batch dyeing75%
Boilers10%
Finishing13%
Preparation27%
Batch dyeing50%
Vacuum systems 1%
Housekeeping 3%Product washing 3%
Domestic uses 3% Effluent dilution 6%
Cooling 27%
Air pollutioncontrol 7%
Plant and vesselwashing 4%
Steamproduction25%
Raw material 21%
Refiner sealing water 2%Screen rejects dilution 2%
Felt cleaning 2%
Vacuum pump 29%
Disc thickenershowers 10%
Wire showers 16%
Other 3%
Pulper showers 5%
Hoses 4%Chemical carryingwater 4%
Box lubricationshowers 8%
Pump glandsealing water 10%
Sheetknock-off 5%
Figure B9: Water use in textile dyeing and finishing – fibre and yarn sector
WC flushing43%
Canteen use9%
Urinal flushing20%
Cleaning1%
Washing27%
Processing/cleaning55%
Boiler house16%
Coolingtowers24%
Effluenttreatment0.4%
Leaks andoverflows3.6%
Offices and kitchens1%
Brewhouse3%
Packaging/cleaning70%
Conditioning12%
Product15%
Rinsing of containers 4%
Boiler house 4%
Pasteurisers 6%
Other 1%Floor washing 1%Domestic use 3%
Equipmentpreparation 3%
Product 78%
Lairage washing 3%
Scald tank 7%Cooling water 6%
Vehicle washing 5%Knife sterilising 5%
Personal hygiene 10%
Sprays and rinses 31%
Floor/equipmentcleaning 33%
Vehicle washing 1%(cold water)
Personal hygiene 2%
Scald tank 9%(hot water)
Evisceration 24%(67% hot water)
Feather fluming 1%(cold water)
Crate and modulewashing 6%(cold water)
Floor washing 30%(50% hot water)
Carcass chilling 27%(cold water)
Boiler10%
CIP hot13%
Processapplications23%
CIP cold 13%
Hygiene3%
Fridgeevaporativecondenser38%
Processing20%
Generalwashing25%
Rinsing55%
Boilers10%
Finishing15%
Batch dyeing75%
Boilers10%
Finishing13%
Preparation27%
Batch dyeing50%
Vacuum systems 1%
Housekeeping 3%Product washing 3%
Domestic uses 3% Effluent dilution 6%
Cooling 27%
Air pollutioncontrol 7%
Plant and vesselwashing 4%
Steamproduction25%
Raw material 21%
Refiner sealing water 2%Screen rejects dilution 2%
Felt cleaning 2%
Vacuum pump 29%
Disc thickenershowers 10%
Wire showers 16%
Other 3%
Pulper showers 5%
Hoses 4%Chemical carryingwater 4%
Box lubricationshowers 8%
Pump glandsealing water 10%
Sheetknock-off 5%
Figure B10: Water use in textile dyeing and finishing – woven cloth sector
WC flushing43%
Canteen use9%
Urinal flushing20%
Cleaning1%
Washing27%
Processing/cleaning55%
Boiler house16%
Coolingtowers24%
Effluenttreatment0.4%
Leaks andoverflows3.6%
Offices and kitchens1%
Brewhouse3%
Packaging/cleaning70%
Conditioning12%
Product15%
Rinsing of containers 4%
Boiler house 4%
Pasteurisers 6%
Other 1%Floor washing 1%Domestic use 3%
Equipmentpreparation 3%
Product 78%
Lairage washing 3%
Scald tank 7%Cooling water 6%
Vehicle washing 5%Knife sterilising 5%
Personal hygiene 10%
Sprays and rinses 31%
Floor/equipmentcleaning 33%
Vehicle washing 1%(cold water)
Personal hygiene 2%
Scald tank 9%(hot water)
Evisceration 24%(67% hot water)
Feather fluming 1%(cold water)
Crate and modulewashing 6%(cold water)
Floor washing 30%(50% hot water)
Carcass chilling 27%(cold water)
Boiler10%
CIP hot13%
Processapplications23%
CIP cold 13%
Hygiene3%
Fridgeevaporativecondenser38%
Processing20%
Generalwashing25%
Rinsing55%
Boilers10%
Finishing15%
Batch dyeing75%
Boilers10%
Finishing13%
Preparation27%
Batch dyeing50%
Vacuum systems 1%
Housekeeping 3%Product washing 3%
Domestic uses 3% Effluent dilution 6%
Cooling 27%
Air pollutioncontrol 7%
Plant and vesselwashing 4%
Steamproduction25%
Raw material 21%
Refiner sealing water 2%Screen rejects dilution 2%
Felt cleaning 2%
Vacuum pump 29%
Disc thickenershowers 10%
Wire showers 16%
Other 3%
Pulper showers 5%
Hoses 4%Chemical carryingwater 4%
Box lubricationshowers 8%
Pump glandsealing water 10%
Sheetknock-off 5%
Figure B11: Water use in speciality chemicals manufacturing
Chemical industry

Tracking Water Use to Cut CostsWRAP 62
Home 1 Why is saving water important?
2 A six-step procedure
3 Dealing with more complex sites
4 Action plan 5 Further information
Appendices
WC flushing43%
Canteen use9%
Urinal flushing20%
Cleaning1%
Washing27%
Processing/cleaning55%
Boiler house16%
Coolingtowers24%
Effluenttreatment0.4%
Leaks andoverflows3.6%
Offices and kitchens1%
Brewhouse3%
Packaging/cleaning70%
Conditioning12%
Product15%
Rinsing of containers 4%
Boiler house 4%
Pasteurisers 6%
Other 1%Floor washing 1%Domestic use 3%
Equipmentpreparation 3%
Product 78%
Lairage washing 3%
Scald tank 7%Cooling water 6%
Vehicle washing 5%Knife sterilising 5%
Personal hygiene 10%
Sprays and rinses 31%
Floor/equipmentcleaning 33%
Vehicle washing 1%(cold water)
Personal hygiene 2%
Scald tank 9%(hot water)
Evisceration 24%(67% hot water)
Feather fluming 1%(cold water)
Crate and modulewashing 6%(cold water)
Floor washing 30%(50% hot water)
Carcass chilling 27%(cold water)
Boiler10%
CIP hot13%
Processapplications23%
CIP cold 13%
Hygiene3%
Fridgeevaporativecondenser38%
Processing20%
Generalwashing25%
Rinsing55%
Boilers10%
Finishing15%
Batch dyeing75%
Boilers10%
Finishing13%
Preparation27%
Batch dyeing50%
Vacuum systems 1%
Housekeeping 3%Product washing 3%
Domestic uses 3% Effluent dilution 6%
Cooling 27%
Air pollutioncontrol 7%
Plant and vesselwashing 4%
Steamproduction25%
Raw material 21%
Refiner sealing water 2%Screen rejects dilution 2%
Felt cleaning 2%
Vacuum pump 29%
Disc thickenershowers 10%
Wire showers 16%
Other 3%
Pulper showers 5%
Hoses 4%Chemical carryingwater 4%
Box lubricationshowers 8%
Pump glandsealing water 10%
Sheetknock-off 5%
Figure B12: Water use in paper and board processing
Paper and board industry
Even for companies in the same line of business, water use varies from company to company. The factors that affect the amount of water used by a company include:
¡ raw materials used;¡ number of different products made;¡ technologies employed;¡ throughput;¡ number of staff; and
staff facilities on site. ¡
Typical water uses are listed in Table B1.
When considering your water balance, you may find it useful to consider your water use in three categories:
¡ general use – this may include on-site washroom facilities and a canteen. Substantial savings can be obtained by detecting and fixing leaks, faulty control valves, leaking cisterns, etc. You may wish to include some process-related issues (e.g. leaks and overflows from pipes/storage tanks) in this category;
¡ process use – this includes cooling towers, liquid ring vacuum pumps, heat exchanger circuits, etc. Substantial savings can be achieved, but these are generally site specific; and
¡ cleaning and washdown – this covers mainly process-related activities, but may also include cleaning offices and washrooms. Cleaning often provides major opportunities for cost savings. In particular, watch out for extravagant use of hoses – you could save thousands of pounds per year.

Tracking Water Use to Cut CostsWRAP 63
Home 1 Why is saving water important?
2 A six-step procedure
3 Dealing with more complex sites
4 Action plan 5 Further information
Appendices
Table B1: Typical water uses at industrial and commercial sites
Type Description Examples
General Sanitary Toilet flushing
Sinks
Showers
Domestic Heating/air-conditioning
Laundry
Drinking
Cooking
Washing up
Recreation Swimming
Jacuzzi
Ice rink
Gardens Watering plants/lawns
Fountains
Garage Vehicle washing
Vehicle maintenance
Industrial Heating/cooling/sealing Rotating machinery and process materials
Heat exchange
Condensing vapours
Processing Dilution/mixing
Heating/cooling
Separation
Product use
Cleaning and washing Tanks
Vessels
Floors
Pipework
Pumps
Steam raising Process use
Heating
Trace lagging
Treating spills/leaks/drips Abnormal events where water is used to dilute and disperse
Commercial Cleaning and washing Canteens
Laundries
Laboratories Condensers
Vacuum pumps
Special Hospital therapy pools
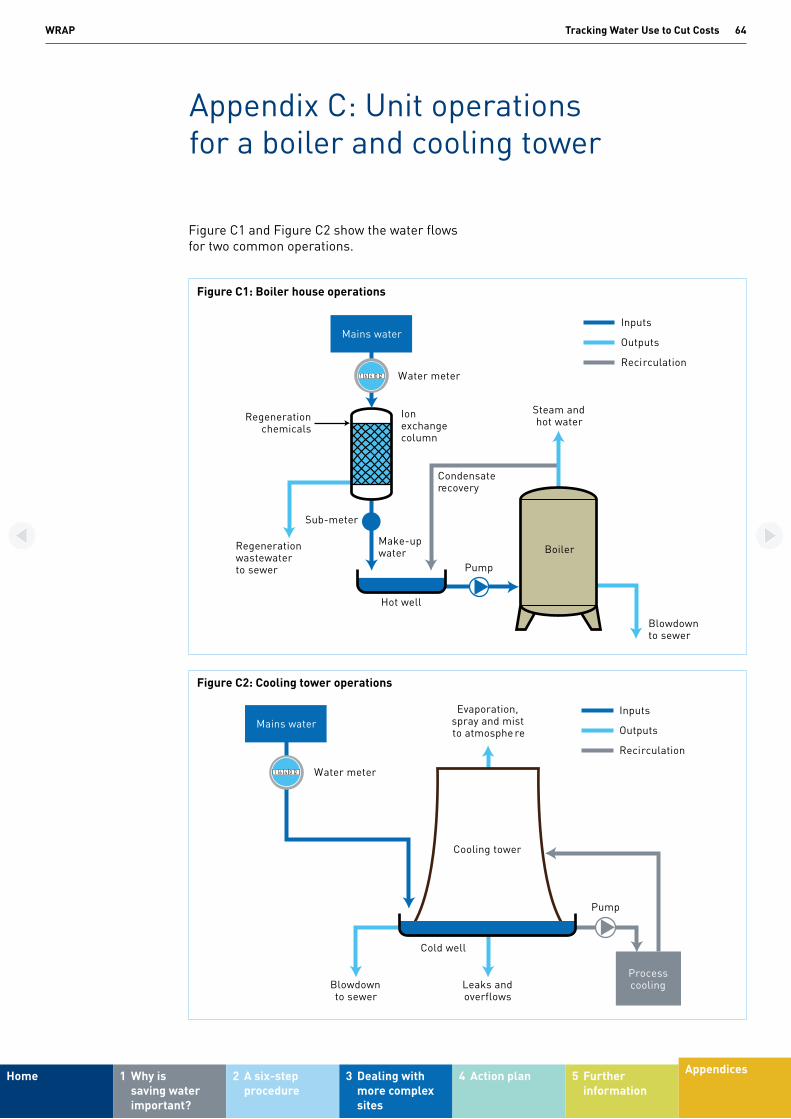
Tracking Water Use to Cut CostsWRAP 64
Home 1 Why is saving water important?
2 A six-step procedure
3 Dealing with more complex sites
4 Action plan 5 Further information
Appendices
Appendix C: Unit operations for a boiler and cooling tower
Figure C1 and Figure C2 show the water flows for two common operations.
1 6 4 0 2 Water meter
Mains water
Sub-meter
Regenerationchemicals
Ionexchangecolumn
Steam andhot water
Pump
Hot well
Blowdownto sewer
Make-upwater
Regenerationwastewaterto sewer
Condensaterecovery
Boiler
Inputs
Outputs
Recirculation
1 6 4 0 2 Water meter
Cooling tower
Mains water
Processcooling
Pump
Cold well
Evaporation,spray and mistto atmosphe re
Blowdownto sewer
Leaks andoverflows
Inputs
Outputs
Recirculation
1 6 4 0 2 Water meter
Mains water
Sub-meter
Regenerationchemicals
Ionexchangecolumn
Steam andhot water
Pump
Hot well
Blowdownto sewer
Make-upwater
Regenerationwastewaterto sewer
Condensaterecovery
Boiler
Inputs
Outputs
Recirculation
1 6 4 0 2 Water meter
Cooling tower
Mains water
Processcooling
Pump
Cold well
Evaporation,spray and mistto atmosphe re
Blowdownto sewer
Leaks andoverflows
Inputs
Outputs
Recirculation
Figure C1: Boiler house operations
Figure C2: Cooling tower operations

Tracking Water Use to Cut CostsWRAP 65
Home 1 Why is saving water important?
2 A six-step procedure
3 Dealing with more complex sites
4 Action plan 5 Further information
Appendices
Appendix D: Example water balances
Example industrial siteFigure D1 shows the water inputs and outputs for an example industrial site, which has the water balance shown in Figure D2. Note the need to consider recirculated water.
Water inproducts
Industrial/manufacturing processes and utilities(including laboratory operations, toilets/wash
block/canteen)
Coldwater
Hotwater
Steam andevaporation
– drying processes
Cooling tower
Effluenttreatment
plantSludgestorage
1 6 4 0 2
1 6 4 0 2
1 6 4 0 2
1 6 4 0 2
Water in liquid wastes,including sludge
Discharges to sewerincluding fire-fighting water*
and domestic sewage
Treatedeffluent
Surface water
*Potentially contaminated fire-fighting water should be collected separately.
Surface waterdischarges including
via oil interceptors
Water leaksinto ground
includingfire-fighting
water*
Cleaningchemicals,raw materials
Watermeter
Treatmentchemicals
Water supply
Water supply
OutputsInputs
1 6 4 0 2
Inputs Outputs Recirculation
1 6 4 0 2
1 6 4 0 2
1 6 4 0 2
Industrial/manufacturing process 537m3/day
Coolingtower
Effluenttreatment
plantSludges
19m3/dayblowdownto sewer
38m3/dayto foulsewer
484m3/dayto seweror river
495m3/day
495m3/day
555m3/day
535m3/day
489m3/day
5m3/day
2m3/day
3m3/day
sludgetankeredoff site
5m3/dayleaks1m3/day
to atmosphere
in products
2m3/dayliquidraw
materials
20m3/day
steam andevaporation
Laundry Kitchen
Boiler/air-conditioning/heating/cooling tower
Blowdown andcondensate to
foul sewer
Treatmentchemicals
Domestic wastewaterto foul sewer
Steam
Evaporationand steam Detergents
1 6 4 0 2
Hotel
Wash blocksand
bathrooms
Water supply
OutputsInputs
Inputs
Outputs
Laundry Washingmachine
KitchenDishwasherSink
Hotel bathroomsToiletsShowers and baths
Boiler/air-conditioningsystem
9m3/day
1m3/day 5m3/day 1m3/day2m3/day
2m3/day 1m3/day
9m3/day
5m3/day 1m3/day
0.005m3/dayliquid
raw materials
0.005m3/dayevaporationand steam
0.05m3/daytreatmentchemicals
0.05m3/daysteam
domestic wastewater
blowdown/ condensate
1 6 4 0 2
Water supply
Mains water
Restaurant/barDishwasherToilets
GardensHoses
Old 20-bedroom complexShowers/bathsToilets and sinks
New 10-bedroom wingShowers/bathsToilets and sinks
Swimming poolMake-up water
Leisure facilitiesShowers/bathsToilets and sinks
KitchensDishwashersFood preparation
LaundryWashing machines
Sub-meter
Sub-meter
Sub-meter
Known
Estimated
Calculated1 6 4 0 2Water
meter
Water meter
Water meter
Water meter
21,650m3/year
1,554m3/year
4m3/year
298m3/year
149m3/year
2,241m3/year
248m3/year
318m3/year
Figure D1: Water inputs and outputs for an example industrial site

Tracking Water Use to Cut CostsWRAP 66
Home 1 Why is saving water important?
2 A six-step procedure
3 Dealing with more complex sites
4 Action plan 5 Further information
Appendices
Example hotelFigure D3 shows the water inputs and outputs for an example hotel, which has the water balance shown in Figure D4.
Water inproducts
Industrial/manufacturing processes and utilities(including laboratory operations, toilets/wash
block/canteen)
Coldwater
Hotwater
Steam andevaporation
– drying processes
Cooling tower
Effluenttreatment
plantSludgestorage
1 6 4 0 2
1 6 4 0 2
1 6 4 0 2
1 6 4 0 2
Water in liquid wastes,including sludge
Discharges to sewerincluding fire-fighting water*
and domestic sewage
Treatedeffluent
Surface water
*Potentially contaminated fire-fighting water should be collected separately.
Surface waterdischarges including
via oil interceptors
Water leaksinto ground
includingfire-fighting
water*
Cleaningchemicals,raw materials
Watermeter
Treatmentchemicals
Water supply
Water supply
OutputsInputs
1 6 4 0 2
Inputs Outputs Recirculation
1 6 4 0 2
1 6 4 0 2
1 6 4 0 2
Industrial/manufacturing process 537m3/day
Coolingtower
Effluenttreatment
plantSludges
19m3/dayblowdownto sewer
38m3/dayto foulsewer
484m3/dayto seweror river
495m3/day
495m3/day
555m3/day
535m3/day
489m3/day
5m3/day
2m3/day
3m3/day
sludgetankeredoff site
5m3/dayleaks1m3/day
to atmosphere
in products
2m3/dayliquidraw
materials
20m3/day
steam andevaporation
Laundry Kitchen
Boiler/air-conditioning/heating/cooling tower
Blowdown andcondensate to
foul sewer
Treatmentchemicals
Domestic wastewaterto foul sewer
Steam
Evaporationand steam Detergents
1 6 4 0 2
Hotel
Wash blocksand
bathrooms
Water supply
OutputsInputs
Inputs
Outputs
Laundry Washingmachine
KitchenDishwasherSink
Hotel bathroomsToiletsShowers and baths
Boiler/air-conditioningsystem
9m3/day
1m3/day 5m3/day 1m3/day2m3/day
2m3/day 1m3/day
9m3/day
5m3/day 1m3/day
0.005m3/dayliquid
raw materials
0.005m3/dayevaporationand steam
0.05m3/daytreatmentchemicals
0.05m3/daysteam
domestic wastewater
blowdown/ condensate
1 6 4 0 2
Water supply
Mains water
Restaurant/barDishwasherToilets
GardensHoses
Old 20-bedroom complexShowers/bathsToilets and sinks
New 10-bedroom wingShowers/bathsToilets and sinks
Swimming poolMake-up water
Leisure facilitiesShowers/bathsToilets and sinks
KitchensDishwashersFood preparation
LaundryWashing machines
Sub-meter
Sub-meter
Sub-meter
Known
Estimated
Calculated1 6 4 0 2Water
meter
Water meter
Water meter
Water meter
21,650m3/year
1,554m3/year
4m3/year
298m3/year
149m3/year
2,241m3/year
248m3/year
318m3/year
Figure D2: Water balance for an example industrial site
Figure D3: Water inputs and outputs for an example hotel

Tracking Water Use to Cut CostsWRAP 67
Home 1 Why is saving water important?
2 A six-step procedure
3 Dealing with more complex sites
4 Action plan 5 Further information
Appendices
Water inproducts
Industrial/manufacturing processes and utilities(including laboratory operations, toilets/wash
block/canteen)
Coldwater
Hotwater
Steam andevaporation
– drying processes
Cooling tower
Effluenttreatment
plantSludgestorage
1 6 4 0 2
1 6 4 0 2
1 6 4 0 2
1 6 4 0 2
Water in liquid wastes,including sludge
Discharges to sewerincluding fire-fighting water*
and domestic sewage
Treatedeffluent
Surface water
*Potentially contaminated fire-fighting water should be collected separately.
Surface waterdischarges including
via oil interceptors
Water leaksinto ground
includingfire-fighting
water*
Cleaningchemicals,raw materials
Watermeter
Treatmentchemicals
Water supply
Water supply
OutputsInputs
1 6 4 0 2
Inputs Outputs Recirculation
1 6 4 0 2
1 6 4 0 2
1 6 4 0 2
Industrial/manufacturing process 537m3/day
Coolingtower
Effluenttreatment
plantSludges
19m3/dayblowdownto sewer
38m3/dayto foulsewer
484m3/dayto seweror river
495m3/day
495m3/day
555m3/day
535m3/day
489m3/day
5m3/day
2m3/day
3m3/day
sludgetankeredoff site
5m3/dayleaks1m3/day
to atmosphere
in products
2m3/dayliquidraw
materials
20m3/day
steam andevaporation
Laundry Kitchen
Boiler/air-conditioning/heating/cooling tower
Blowdown andcondensate to
foul sewer
Treatmentchemicals
Domestic wastewaterto foul sewer
Steam
Evaporationand steam Detergents
1 6 4 0 2
Hotel
Wash blocksand
bathrooms
Water supply
OutputsInputs
Inputs
Outputs
Laundry Washingmachine
KitchenDishwasherSink
Hotel bathroomsToiletsShowers and baths
Boiler/air-conditioningsystem
9m3/day
1m3/day 5m3/day 1m3/day2m3/day
2m3/day 1m3/day
9m3/day
5m3/day 1m3/day
0.005m3/dayliquid
raw materials
0.005m3/dayevaporationand steam
0.05m3/daytreatmentchemicals
0.05m3/daysteam
domestic wastewater
blowdown/ condensate
1 6 4 0 2
Water supply
Mains water
Restaurant/barDishwasherToilets
GardensHoses
Old 20-bedroom complexShowers/bathsToilets and sinks
New 10-bedroom wingShowers/bathsToilets and sinks
Swimming poolMake-up water
Leisure facilitiesShowers/bathsToilets and sinks
KitchensDishwashersFood preparation
LaundryWashing machines
Sub-meter
Sub-meter
Sub-meter
Known
Estimated
Calculated1 6 4 0 2Water
meter
Water meter
Water meter
Water meter
21,650m3/year
1,554m3/year
4m3/year
298m3/year
149m3/year
2,241m3/year
248m3/year
318m3/year
Figure D4: Water balance for an example hotel
Constructing a water balance for a medium-sized hotelThe water and sewerage charges at one of the hotels in a chain had jumped from £8,496/year to £38,969/year in consecutive years.
The hotel has 30 bedrooms, with a restaurant and bar (open to non-residents). Ten of the rooms are in a separate new wing. All of the bedrooms are equipped with a bath, shower and WC. Other facilities include a swimming pool and leisure facilities. The hotel also has its own kitchens equipped with two large dishwashers and separate laundry facilities with two washing machines. Outside there are extensive gardens.
The hotel is supplied with water only from the mains. In addition to the water company’s meter, there are sub-meters on the old bedroom complex (fed by an independent pipeline off the incoming water main), on the kitchens and on the pipeline serving the swimming pool, leisure facilities and new bedroom complex.
In the year with the particularly high water and sewerage charges, the hotel had a 60% occupancy rate. The gardens were only watered on two afternoons in July using a hose fed off the mains supplying the bar and toilets. Because some laundry is charged to clients, a record is kept of machine use. The larger (23kg wash) was used 231 times during the year and the other (5.5kg wash) was used 450 times. Machine specifications show that the larger machine uses 112 litres/fill and each wash cycle takes five fills. The smaller machine takes 60 litres/fill and seven fills. The sub-meters on the kitchens show that 248m3 of water was used during the year.
The first step is to draw a block representation of the hotel and fill in available data for the year. The first values to be entered are those from the sub-meters:
¡ 298m3 for the old bedroom complex;¡ 2,241m3 for the flow to the swimming pool,
leisure complex and new bedroom wing; and248m ¡ 3 for the kitchens.

Tracking Water Use to Cut CostsWRAP 68
Home 1 Why is saving water important?
2 A six-step procedure
3 Dealing with more complex sites
4 Action plan 5 Further information
Appendices
The next step is to do some calculations to determine other flows.
¡ At a cost of around £1.80/m3 (water and sewerage combined), the year’s bill of £38,969 gives a water input from the mains supply of 21,649m3/year.In the laundry, the large machine used ¡129m3/year (see equation A) and the small machine used 189m3/year (see equation B). This gives a total of 318m3/year.
Equation A = (231 uses × 112 litres/fill × 5 fills/use)/1,000
Equation B = (450 uses × 60 litres/fill × 7 fills/use)/1,000
The average water consumption of an ¡occupied bedroom is approximately 68 litres/day. A cross-check shows that the metered water use for the old bedroom complex agrees with the value calculated from the occupancy rate and assumed average water use (i.e. 298m3/year) (see equation C). Assuming the two sets of bedrooms use water at the same rate, then water use for the ten-bedroom wing is 149m3/year.
Equation C = (20 bedrooms × 68 litres/day × 365 days/year × 0.6 occupancy rate)/1,000
¡ In the garden, one hose was used for two afternoons in July – say for four hours. A garden hose uses 8.3 litres/minute as a minimum. The water use is estimated at 4.0m3/year (see equation D).
Equation D = (2 hoses × 8.3 litres/minute × 60 minutes/hour × 4 hours)/1,000
No data exist for the restaurant and bar. ¡It is estimated at two sinks with a maximum of two taps each with one tap running for 6 hours/day for 5 days/week. Assuming that the taps run at the same rate as the hose, a reasonable ‘guessestimate’ is 1,554m3/year (see equation E).
Equation E = (2 taps × 8.3 litres/minute × 60 minutes/hour × 6 hours/day × 5 days/week × 52 weeks/year)/1,000
Figure D5 shows the water balance for the hotel. The total water consumption by the various areas of the hotel therefore equals 4,663m3/year (1,554 + 298 + 2,241 + 248 + 318 + 4). This compares favourably with the value for total water use of 4,720m3/year calculated from the first year’s bill. Managers have thus proved that water use had been excessive in the second year.

Tracking Water Use to Cut CostsWRAP 69
Home 1 Why is saving water important?
2 A six-step procedure
3 Dealing with more complex sites
4 Action plan 5 Further information
Appendices
Steps that the hotel could take to investigate its water use include:
¡ checking the accuracy of the incoming water meter;
¡ turning off all water-using devices and then observing the meters and checking the drains for any flow (but not the drains that also receive rainwater);
¡ fitting more sub-meters to obtain more accurate data;
¡ looking for leaks;¡ examining water use in the swimming pool
and leisure facilities; and¡ checking comparative occupancy rates
between the new and old bedroom complexes.
Water inproducts
Industrial/manufacturing processes and utilities(including laboratory operations, toilets/wash
block/canteen)
Coldwater
Hotwater
Steam andevaporation
– drying processes
Cooling tower
Effluenttreatment
plantSludgestorage
1 6 4 0 2
1 6 4 0 2
1 6 4 0 2
1 6 4 0 2
Water in liquid wastes,including sludge
Discharges to sewerincluding fire-fighting water*
and domestic sewage
Treatedeffluent
Surface water
*Potentially contaminated fire-fighting water should be collected separately.
Surface waterdischarges including
via oil interceptors
Water leaksinto ground
includingfire-fighting
water*
Cleaningchemicals,raw materials
Watermeter
Treatmentchemicals
Water supply
Water supply
OutputsInputs
1 6 4 0 2
Inputs Outputs Recirculation
1 6 4 0 2
1 6 4 0 2
1 6 4 0 2
Industrial/manufacturing process 537m3/day
Coolingtower
Effluenttreatment
plantSludges
19m3/dayblowdownto sewer
38m3/dayto foulsewer
484m3/dayto seweror river
495m3/day
495m3/day
555m3/day
535m3/day
489m3/day
5m3/day
2m3/day
3m3/day
sludgetankeredoff site
5m3/dayleaks1m3/day
to atmosphere
in products
2m3/dayliquidraw
materials
20m3/day
steam andevaporation
Laundry Kitchen
Boiler/air-conditioning/heating/cooling tower
Blowdown andcondensate to
foul sewer
Treatmentchemicals
Domestic wastewaterto foul sewer
Steam
Evaporationand steam Detergents
1 6 4 0 2
Hotel
Wash blocksand
bathrooms
Water supply
OutputsInputs
Inputs
Outputs
Laundry Washingmachine
KitchenDishwasherSink
Hotel bathroomsToiletsShowers and baths
Boiler/air-conditioningsystem
9m3/day
1m3/day 5m3/day 1m3/day2m3/day
2m3/day 1m3/day
9m3/day
5m3/day 1m3/day
0.005m3/dayliquid
raw materials
0.005m3/dayevaporationand steam
0.05m3/daytreatmentchemicals
0.05m3/daysteam
domestic wastewater
blowdown/ condensate
1 6 4 0 2
Water supply
Mains water
Restaurant/barDishwasherToilets
GardensHoses
Old 20-bedroom complexShowers/bathsToilets and sinks
New 10-bedroom wingShowers/bathsToilets and sinks
Swimming poolMake-up water
Leisure facilitiesShowers/bathsToilets and sinks
KitchensDishwashersFood preparation
LaundryWashing machines
Sub-meter
Sub-meter
Sub-meter
Known
Estimated
Calculated1 6 4 0 2Water
meter
Water meter
Water meter
Water meter
21,650m3/year
1,554m3/year
4m3/year
298m3/year
149m3/year
2,241m3/year
248m3/year
318m3/year
Figure D5: Water balance for the hotel

Tracking Water Use to Cut CostsWRAP 70
Home 1 Why is saving water important?
2 A six-step procedure
3 Dealing with more complex sites
4 Action plan 5 Further information
Appendices
Appendix E: Producing and using site drainage plans
Producing site drainage plans¡ Locate all drainage manholes and draw a
sketch plan of their approximate location.¡ Identify the type of each drain, for example:
foul (domestic) sewer (F); -effluent (E); -surface water (S); and -combined. -
¡ Record this information on your plan. Mark (F, E, S) or colour-code the manholes for future reference.
¡ Identify the direction of flow. If there is no flow, pour in some water and see which way it drains. If there is a flow, add a tracer dye or an object that will float and observe its flow. Be careful not to contaminate the effluent, risk pollution, break consent conditions or block the drains.Identify connections to other manholes ¡(using added water or tracer dye) and draw on the plan.
Using drainage plans to identify effluent sourcesObtain drainage plans for the different drainage systems. For each drainage system:
¡ lift the manholes and draw all pipes or channels connecting to the manhole on the plan. Note the number, size and direction of pipes (even if no flow is observed) and number them;
¡ trace the pipes or channels back to above-ground connections. These are called drain entry points. Look for trench scars on the floor or, if necessary, use water/tracer dyes;
¡ at each entry point, note the pipes or channels feeding into it from process equipment and number them on the plan; and
¡ identify the process plant/equipment feeding each pipe/channel (i.e. the sources of effluent).

Tracking Water Use to Cut CostsWRAP 71
Home 1 Why is saving water important?
2 A six-step procedure
3 Dealing with more complex sites
4 Action plan 5 Further information
Appendices
Appendix F: Calculating water flows for cooling towers and steam relief valves
Calculating cooling tower water consumptionThe following simplified approach gives an estimate of the water used by a cooling tower (see Figure F1). The variations and inaccuracies in water use can be large, particularly between summer/winter and day/night.
To calculate water use by a cooling tower (i.e. volume of make-up water required), you need to know:
¡ flow (i.e. the flow rate of cool water to the process). This is obtained from a flow meter or pump hours-run meter;
¡ Tout (i.e. the temperature of process water leaving the cooling tower in °C);
¡ Tin (i.e. the temperature of process water entering the cooling tower in °C);
¡ airflow (i.e. the flow rate of air into the cooling tower). If this is not known, assume it is equal to the flow of cool water to the process; andT ¡ air (i.e. the temperature of air entering the cooling tower in °C).
Then follow the steps in Table F1 to calculate water use by the cooling tower. The units for the flow and the airflow should be litres/second and kg/second respectively.
Coolingtower
Flow
Blowdown
Evaporation
Process
Tin
Tout
TairAirflow
Make-up water
Steam vent stack
D
V
Figure F1: Cooling tower schematic

Tracking Water Use to Cut CostsWRAP 72
Home 1 Why is saving water important?
2 A six-step procedure
3 Dealing with more complex sites
4 Action plan 5 Further information
Appendices
Table F1: Calculation of water consumption by a cooling tower
Step Calculation Symbol Units Formula
1 Thermal load A kW A = Flow × 4.2kJ/kg°C × (Tin - Tout)
where 4.2kJ/kg°C is the specific heat of water.
2 Cooling load due to airflow B kW B = Airflow × 1kJ/kg°C × [(Tair - (Tin - 3))]
where 1kJ/kg°C is the specific heat of air.NB B could be negative.
3 Evaporative load C kW C = A + B
4 Evaporation D kg/second D =
where 2,430kJ/kg is the latent heat of evaporation of water at 30°C.
5 Make-up volume Vs litres/second
Vs = D × ( 1 + ( ))where N = number of concentrations* in the tower.
Typical N values are:
1.5 very hard water2 hard water3 soft water6 deionised water
* Relates to the extent to which solids are concentrated in the cooling tower cold well.
1 N – 1
C 2,430kJ/kg
Table F2: Calculation of water loss from a steam vent
Step Calculation Symbol Units Formula
1 Surface area of the stack A m2A =
2 Volumetric release rate R m3/second R = A × V
3 Water loss V m3/second V = R × 0.6where 0.6kg/m3 is the density of water vapour at 100°C and 1 atmosphere pressure.
3.14 x D2 4
Calculating water release from a steam ventThe following simplified approach gives an estimate of the water lost from a steam vent (see Figure F2).
To calculate the volume of water lost from the steam vent you need to know:
¡ the diameter of the stack (D) in metres; andthe velocity of steam exiting the vent (V) ¡in metres/second. If this is not known, assume a value of 3 metres/second.
Then follow the steps in Table F2 to calculate the water loss from the vent.
Coolingtower
Flow
Blowdown
Evaporation
Process
Tin
Tout
TairAirflow
Make-up water
Steam vent stack
D
V
Figure F2: Steam vent stack schematic

Tracking Water Use to Cut CostsWRAP 73
Home 1 Why is saving water important?
2 A six-step procedure
3 Dealing with more complex sites
4 Action plan 5 Further information
Appendices
The pollutant load and concentration of a pollutant in an effluent can be calculated using the following formulae (remember 1m3
= 1,000 litres and 1kg = 1,000,000mg):
Example calculationsRows 1 and 2 of Table G1 show an example calculation of the load in kg/day of total dissolved solids (TDS) in a cleaning effluent and a boiler blowdown. The flow volume and concentration of the dissolved solids have been either measured or estimated.
Row 3 of Table G1 shows the calculation of the concentration of a combined flow made up of the two individual flows – the cleaning effluent and boiler blowdown in rows 1 and 2. The total volume was determined by adding together the volumes for the individual flows, and the total load by adding together the loads for the individual flows. The concentration was then calculated using the formula given above.
Table G1: Example calculation of pollutant concentration and load
Row Effluent Contaminant Flow volume(m3/day)
Concentration(mg/litre)
Load(kg/day)
1 Cleaning effluent TDS 5 500 2.5
2 Boiler blowdown TDS 20 2,500 50
3 Combined flow TDS 25 2,100 52.5
Appendix G: Determining pollutant loads
Load (mg/day) = Concentration (mg/litre) × Flow volume (m3/day) × 1,000
Load (kg/day) = Concentration (mg/litre) × Flow volume (m3/day) × 1,000
1,000,000
= Concentration (mg/litre) × Flow volume (m3/day)
1,000
Concentration
(mg/litre)
= Load (kg/day) × 1,000,000
Flow (m3/day) × 1,000
= Load (kg/day) × 1,000
Flow (m3/day)

Tracking Water Use to Cut CostsWRAP 74
Home 1 Why is saving water important?
2 A six-step procedure
3 Dealing with more complex sites
4 Action plan 5 Further information
Appendices
www.wrap.org.uk/brehub
While we have tried to make sure this guide is accurate, we cannot accept responsibility or be held legally responsible for any loss or damage arising out of or in connection with this information being inaccurate, incomplete or misleading. This material is copyrighted. You can copy it free of charge as long as the material is accurate and not used in a misleading context. You must identify the source of the material and acknowledge our copyright. You must not use material to endorse or suggest we have endorsed a commercial product or service. For more details please see our terms and conditions on our website at www.wrap.org.uk
We hope that you have found this guide helpful on your route to greater resource efficiency. Don’t forget that WRAP is here to help you to improve resource efficiency. Visit the website at www.wrap.org.uk or contact the WRAP Resource Efficiency Helpline on 0808 100 2040.
Waste & ResourcesAction Programme
The Old Academy21 Horse FairBanbury, OxonOX16 0AH
Tel: 01295 819 900Fax: 01295 819 911Email: [email protected]
Resource Efficiency Helpline:0808 100 2040
March 2013