Embed Size (px)
Citation preview

Tracking, Assessing and Improving the Distribution of
Food Aid in Rural Huron County

The Team
• Janice Dunbar, Project Coordinator
• Mary Ellen Zielman, Executive Director, Huron County Food Bank Distribution Centre
• Marg Deichert, Administrative Assistant, Huron County Food Bank Distribution Centre
• Pam Hanington, Community Developer, Huron County Health Unit
• Dr. Jason Gilliland, Director, Human Environment Analysis Laboratory
• Angela Piaskoski, MSc Candidate, Human Environment Analysis Laboratory
• Dr. Andrew Clark, Post-Doctoral Fellow/Project Coordinator, Human Environment Analysis Laboratory
2

What We Learned• Pounds of food distributed by the Huron County Food Bank
Distribution Centre (HCFBDC) during this project to food banks and aid agencies: 289,911 lbs
• People are NOT meeting their food needs through monthly visits to food banks.
• Many people eat once a day or miss meals so that they can feed their children or make their food last longer
• Nutritious foods (eggs, milk, meats, cheese, vegetables, fruits) are a priority for food bank clients to receive - in sufficient quantities to support their families
• People appreciate being treated with dignity and respect at food banks and being able to make their own food choices
• Food bank users are coming from throughout the county; however, there are areas with high proportions of households with potential food insecurity who are not accessing food banks.
3

Table of ContentsSection Page
What We Learned 3
Table of Contents 4
List of Charts, Figures & Tables 5
Introduction 6
Access to Food in Huron County 9
Food Tracking Survey 13
Food Security Focus Groups 24
Food Bank and Food Aid Agency Interviews 27
4

List of Charts, Figures & TablesName Page
Figure 1: Food banks and food aid agencies, Huron County, 2016 9
Figure 2: Access to Food Banks, Huron County, 2016 10
Figure 3: Grocery Stores, Huron County, 2016 11
Figure 4: Access to Grocery Stores, Huron County, 2016 12
Table 1: Towns where surveys were administered, Huron County Food Tracking Project Survey, 2017 13
Table 2: Age of Respondents, Huron County Food Tracking Project Survey, 2017 14
Table 3: Household Living Characteristics, Huron County Food Tracking Project Survey, 2017 15
Table 4: Income Source, Huron County Food Tracking Project Survey, 2017 16
Chart 1: Eating Behaviour, Fruit Juice, Survey Question, Huron County Food Tracking Project Survey, 2017 17
Chart 2: Eating Behaviour, Fresh Fruit, Survey Question, Huron County Food Tracking Project Survey, 2017 18
Chart 3: Eating Behaviour, Carrots, Survey Question, Huron County Food Tracking Project Survey, 2017 19
Chart 4: Eating Behaviour, Potatoes, Survey Question, Huron County Food Tracking Project Survey, 2017 19
Chart 5: Eating Behaviour, Green Salad, Survey Question, Huron County Food Tracking Project Survey, 2017 20
Chart 6: Eating Behaviour, Vegetables, Survey Question, Huron County Food Tracking Project Survey, 2017 20
Table 5: Food Security, Survey Questions, Huron County Food Tracking Project Survey, 2017 21
Chart 7: Food Security Daily, Survey Question, Huron County Food Tracking Project Survey, 2017 22
Chart 7: Food Security Children, Survey Question, Huron County Food Tracking Project Survey, 2017 22
Table 6: Mode of Access to the Food Bank, Huron County Food Tracking Project Survey, 2017 23
5

IntroductionsAt the community level, food security exists when allcommunity residents obtain a safe, personallyacceptable, nutritious diet through a sustainable foodsystem that maximizes healthy choices, communityself-reliance and equal access for everyone (Dietitiansof Canada, 2007).
In 2008, the Huron County Food Bank DistributionCentre (HCFBDC) was established in response to anincreasing demand for food from new and existingfood banks to a surge in demand for food in HuronCounty.
6

IntroductionsThe HCFBDC delivers food to 10 food banks in sevencommunities and also to social service (aid) agenciesworking with people who face significant socialbarriers, particularly those living with low income.These aid agencies disclosed that many of theirclients were living with hunger due to a number offactors including income insecurity exacerbated bythe inaccessibility of food sources in smallercommunities and isolated areas, especially thosewithout food banks.
The HCFBDC currently delivers to 15 aid agencies thatprovide service across the county on a regular basis.To our knowledge, this is a unique rural response toaddressing rural food insecurity.
7

Introductions
We hoped to learn how people are meeting their foodneeds, and about the gaps in our response to foodinsecurity in Huron County. By locating and mappingfood sources, revealing the roles played by foodbanks and aid agencies in meeting food needs, andtracking the distribution system, we will learn howour current distribution system can be enhanced tobetter meet the needs of people experiencing foodinsecurity. Some of our questions: Where is foodgoing, to whom and why? How does this compare tofood source locations in the county? Where is thereneed that is not being met?
8

Food Banks and Food Aid AgenciesThere are 10 Food Banks and 23 Food Aid Agencies in Huron County. Most are located in Population Centres.
There are a lack of food banks and aid agencies in Ashfield, Wawanosh, Howick, Morris and Grey Census Subdivisions
9Figure 1: Food banks and food aid agencies, Huron County, 2016

Access to Food BanksThis map includes the 10 food banks within Huron County as well as all of the nearby food banks in neighbouringcounties. In our survey analysis we had noted that some food bank patrons come from outside of the county, we would also assume those that live within the county may leave the county to access food aid.
10Figure 2: Access to Food Banks, Huron County, 2016

Grocery StoresThere are 14 grocery stores across Huron County that sell fresh foods. The Northeast and Northwest corners of the county do not have grocery stores.
11Figure 3: Grocery Stores, Huron County, 2016

Access to Grocery StoresIncludes grocery stores that sell fresh foods only. Note that seasonal food sources such as farmers markets were not included. Grocery stores outside of the county were included in the analysis to account for edge effect.
12Figure 4: Access to Grocery Stores, Huron County, 2016

Food Tracking Project - SurveyInformation about the survey
The Food Tracking Survey was administered over three different occasions in most of the Food Banks across Huron County. Note that St .Vincent De Paul did not participate.
Round 1: June 19th – 23rd
Round 2: August 21st – 26th
Round 3: October 10th-13th
13
Table 1: Towns where surveys were administeredHuron County Food Tracking Project Survey, 2017
Where was the survey administered?

Who Responded?
14
• 194 respondents
• 56% female and 44% male
• Median age of respondents 46 years old and the median age in Huron County is 46 years old.
Age
% of
Respondents
Under 20 1.03%
20-29 15.46%
30-39 13.92%
40-49 28.35%
50-59 23.20%
Over 60 14.95%
n/a 3.09%Table 2: Age of Respondents, Huron County Food Tracking Project Survey, 2017

Household Characteristics• The respondents represented 436 people
• 66.5% of households surveyed had no children living in the house
15
Table 3: Household Living Characteristics, Huron County Food Tracking Project Survey, 2017
Household Living Characteristics
% of
Respondents
Two or more adults with children 19%
Two or more adults without children 26%
One adult with children 15%
One adult without children 40%
Unknown 1%

Financial Characteristics• Average reported monthly income $1,500
• Average reported monthly rent or mortgage $596
• Average reported monthly utilities $257
• Average reported monthly phone/cable/internet $157
• Average reported monthly vehicle costs $300
16
*Note: Other sources included military, child support, trillium benefits, other pension, etc.
Table 4: Income Source, Huron County Food Tracking Project Survey, 2017
Income Source
% of respondents
reported
Ontario Disability Support Program 54%
Canada Child Benefit 20%
Ontario Works 19%
Canada Pension Plan 15%
Canada Pension Plan Disability Benefit 9%
Other 8%
Full Time Employment 7%
Old Age Security 7%
Part Time Employment 6%
Workers Compensation 2%

Eating Behaviour37% of respondents said they never or rarely drink fruit juices, while 20% drank them less than 1 time per day.
17Chart 1: Eating Behaviour, Fruit Juice, Survey Question, Huron County Food Tracking Project Survey, 2017

Eating BehaviourAlmost 60% of respondents ate fresh fruit either never, rarely, or less than 1 time per day
18Chart 2: Eating Behaviour, Fresh Fruit, Survey Question, Huron County Food Tracking Project Survey, 2017

Eating Behaviour30% of respondents ate carrots never or rarely and 14% of respondents ate potatoes never or rarely
19
Chart 3: Eating Behaviour, Carrots, Survey Question, Huron County Food Tracking Project Survey, 2017
Chart 4: Eating Behaviour, Potatoes, Survey Question, Huron County Food Tracking Project Survey, 2017
Eating Behaviour33% never/rarely ate green salad and 48% ate other vegetables less than 1 time per day or never/rarely.
20
Chart 5: Eating Behaviour, Green Salad, Survey Question, Huron County Food Tracking Project Survey, 2017
Chart 6: Eating Behaviour, Vegetables, Survey Question, Huron County Food Tracking Project Survey, 2017

Question Yes No N/A
Over the past 12 months, did you ever eat
less than you felt you should because there
wasn't enough money to buy food?
80% 18% 2%
Over the past 12 months, were you ever
hungry but didn't eat because you couldn't
afford food?
57% 41% 2%
Over the past 12 months, did you lose
weight because you didn’t have enough
money for food?
42% 56% 2%
Food Security• 81% of respondents said that in the past year they ate less than they felt they
should because there wasn’t enough money to buy food
• 57% of respondents said that in the past year they were hungry but didn’t eat because they couldn’t afford food
• 42% of respondents said that they lost weight over the past year, because they didn’t have enough money for food.
21
Table 5: Food Security, Survey Questions, Huron County Food Tracking Project Survey, 2017
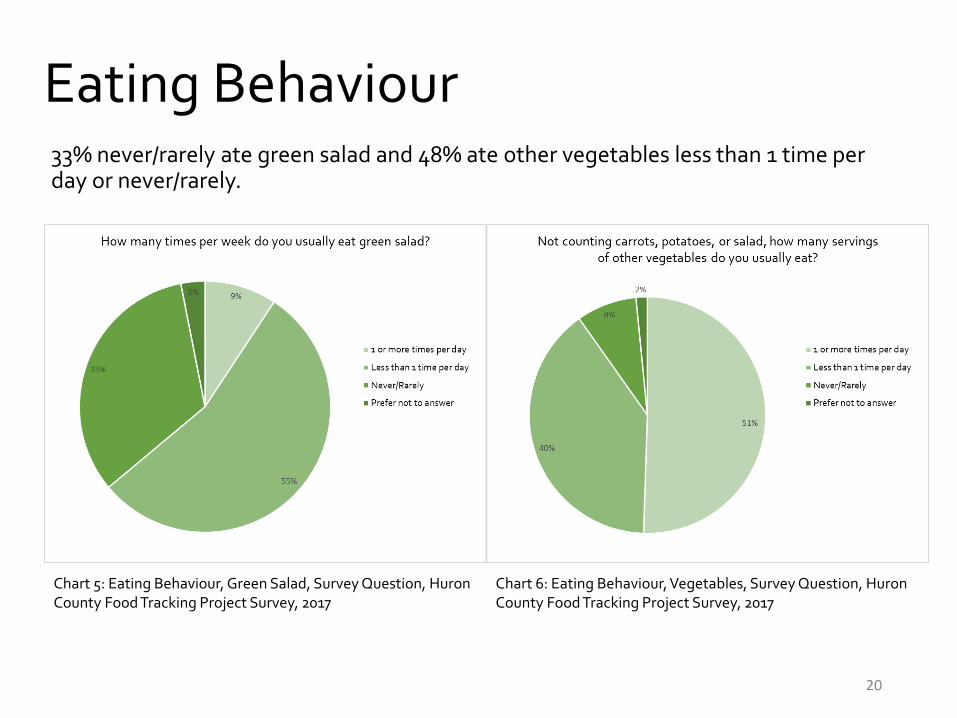
Food Security• Almost 50% responded that there were days in the last year that they did not eat for a
whole day because there wasn’t enough money for food, for 19% this happens every month.
• Out of the 34% of respondents who had children living at home, 86% of them said in the past year, they had at some point relied on only a few kinds of low cost foods to feed their children because they were running out of money to buy food. Only 10% said that this situation never occurred.
22Chart 7: Food Security Daily, Survey Question, Huron County Food Tracking Project Survey, 2017
Chart 8: Food Security Children, Survey Question, Huron County Food Tracking Project Survey, 2017

Mode of Access45% of those surveyed drove their own car to access the food bank, for the rest, another method of transportation is necessary, for many this is walking or getting a ride with someone else.
23
Mode of Transportation % Respondents
Drive my own car 45%
Walk 31%
Someone else drives me 27%
Bicycle 7%
Taxi 4%
Borrow Vehicle 2%Table 6: Mode of Access to the Food Bank, Survey Questions, Huron County Food Tracking Project Survey, 2017

Focus Groups
24
Date Town Location Time18-Oct Bayfield 9 Jane Street 1:30-2:30pm30-Oct Clinton Centre for Employment and Learning 1-2pm3-Nov Exeter Centre for Employment and Learning 1-2pm6-Nov Seaforth Community Futures Huron 2-3pm13-Nov Wingham Centre for Employment and Learning 10:30-11:30am13-Nov Goderich Goderich Library 4-5pm14-Nov Zurich Zurich Library 2-3pm27-Nov Goderich Goderich Library 3-4pm
Eight focus groups took place within the communities with food banks: Bayfield, Clinton, Exeter, Goderich, Seaforth, Wingham and Zurich from mid October to mid November.

Focus GroupsSummary of key points from focus groups
• Once a month access is not enough
• Would like to receive more meats, produce, milk, eggs and cheese on a regular basis and in sufficient quantities – this was a consistent response
• Value being treated with respect and dignity – and this doesn’t always happen
• Prefer to make their own food choices
• Would like products to be complementary or “meal-based” – thanks for the hamburger helper, where is the hamburger..
• Many acknowledged link between foods with low nutritional value and mental health
• Expired food is not safe, they want to know where their food is coming from
• Would like to be able to give back as a volunteer – many have skills in food prep, basic bookkeeping, etc.
• “food just fills your stomach, there is no nutrition”
25
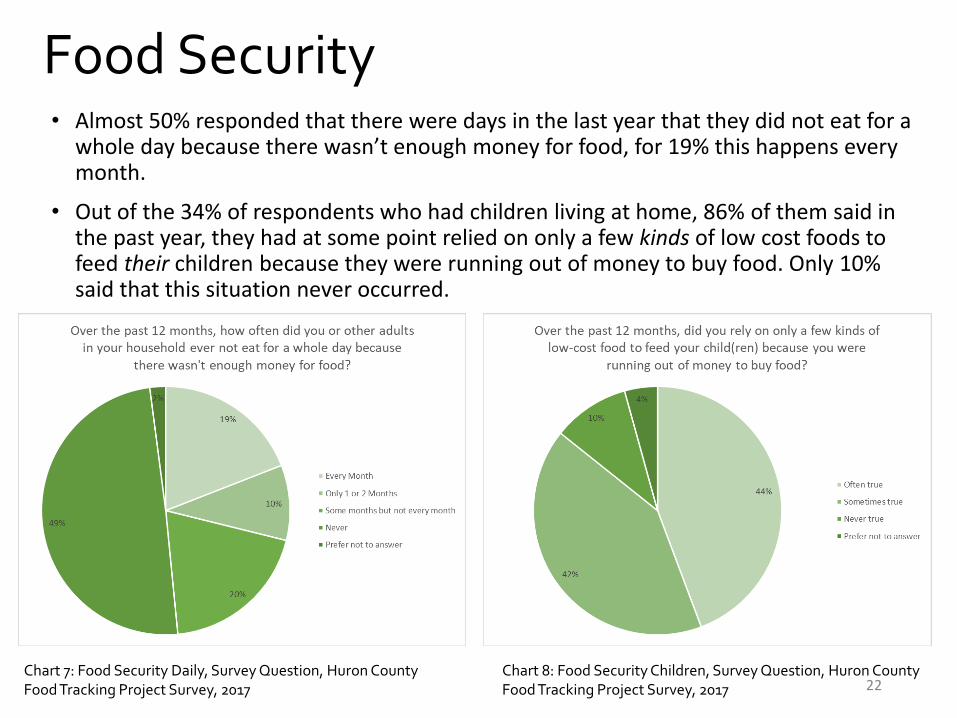
Five A’s of Food Security1. Availability - Is there enough food? For everyone? At all
times?
2. Accessibility - Can you get to the food? Can the food get to you? Can you afford it?
3. Acceptability - Is the food and the system of delivery culturally acceptable and appropriate?
4. Adequacy - Is the food adequately nutritious? Is it safe to eat? How sustainable is the food supply? How about the sources?
5. Action - If any of the previous four elements are not being met, is there a policy and procedure in place for you to take steps to change that situation?
26
http://avefsn.weebly.com/the-5-as.html

Food Bank and Food Aid Agency InterviewsTelephone interviews took place with administrative staff at 13 food banks and aid agencies during November and December. The goal of these interviews was to learn more about the their culture, capacity and practices.
• Process varies at each food bank – from personal shopping to a pre-packaged bag of food
• Quantities provided depend on food bank inventory
• They would like to see a consistent supply of milk, eggs, meats, cheese and produce from the HCFBDC for clients – good nutritional value for their money
• Volunteer training informal or not at all• Customer service training
• Safe Food Handling
• Guidelines for handling best before and expired food varies• Wish to only provide foods that they would eat themselves
• Deliveries from the HCFBDC generally on the right day and time – just not enough of the top five choices
27