Embed Size (px)
Citation preview

Tracing Retinal Blood Vessels by Matrix-ForestTheorem of Directed Graphs
Li Cheng1,3, Jaydeep De1,2, Xiaowei Zhang1, Feng Lin2, and Huiqi Li4
1 Bioinformatics Institute, A*STAR, Singapore2 School of Computer Engineering, Nanyang Technological University, Singapore
3 School of Computing, National University of Singapore, Singapore4 Beijing Institute of Technology, China
Abstract. This paper aims to trace retinal blood vessel trees in fundusimages. This task is far from being trivial as the crossover of vessels arecommonly encountered in image-based vessel networks. Meanwhile it isoften crucial to separate the vessel tree structures in applications such asdiabetic retinopathy analysis. In this work, a novel directed graph basedapproach is proposed to cast the task as label propagation over directedgraphs, such that the graph is to be partitioned into disjoint sub-graphs,or equivalently, each of the vessel trees is traced and separated fromthe rest of the vessel network. Then the tracing problem is addressedby making novel usage of the matrix-forest theorem in algebraic graphtheory. Empirical experiments on synthetic as well as publicly availablefundus image datasets demonstrate the applicability of our approach.
1 Introduction
Topological and geometrical properties of retinal blood vessels in fundus imagescan provide valuable clinical information in diagnosing diseases. In particular,vascular anomaly in retina is one of the clinical manifestations of retinal diseasessuch as diabetic retinopathy, glaucoma, and hypertensive retinopathy. Take dia-betic retinopathy as an example, it is a leading cause of blindness in the working-age population of most developed countries. Diabetic retinopathy is the resultof progressive damage to the network of tiny blood vessels that supply bloodto the retina. Proliferative diabetic retinopathy is specifically characterized bythe formation of newly formed vessels in the retina [1]. This thus requires thedescription of blood vessel tree structure in clinical diagnosis, and as a result,calls for the tracing and separation of each vessel tree in the fundus images.
Existing efforts in retinal vessel analysis can be roughly categorized intosegmentation-based and tracking-based. The segmentation-based methods (e.g.[2]) often use pixel classification to produce a binary segmentation (i.e a pixel isclassified into vessel or non-vessel). The tracking-based methods (e.g. [3]) usu-ally start with a seed, and track the intended vessel based on local intensity ortexture information. Segmentation-based methods tend to produce many dis-connected and isolated segments, less favourable for retaining the important

Fig. 1. Overview of our tracing pipeline where our focus is the tracing step.
topological properties of vessel networks. Meanwhile vessel tracking methods of-ten better preserve the connectivity structure of vessel segments. Nonethelessthey encounter great difficulties with the occurrence of crossover at the junctionpoints. Current methods often fail to trace properly, as it is nontrivial to predictwhether the vessel segments at a junction point belong to one tree or multipletrees, and for the later case, to which tree each segment belongs. In this paper,we dedicate our attention to addressing this bottleneck crossover issue.
We consider a different tracing approach that can take into account bothlocal and global contextual information of the vessel network, as summarizedbelow: After initial pixel-based segmentation and skeleton extraction, a noveldirected graph (or digraph) representation is formed, where each segment inthe skeleton map becomes a node, and a direct contact between two adjacentsegments corresponds to an edge of the two corresponding nodes. The segmentsin the skeleton map touching the optic disk area are considered as the root nodes.The number of trees to-be-found in the the vessel network thus equals the numberof root nodes. The tracing problem is now formulated as label propagation ondirected graphs or digraphs: The goal is to propagate tree labels from known rootnodes to the rest of the graph, such that the digraph will be split into disjointsub-graphs, which corresponds to trees of the vessel network. This allows usto consider and make novel usage of the recent development of matrix-foresttheorem [4] studied in algebraic digraph theory.
In term of major contributions, our approach offers a principled way of ad-dressing the tracing with crossover problem. By connecting to the well-establishedalgebraic directed graph theory [4], local and global contextual information canbe both considered explicitly. We expect the digraph theoretical representationcan open the door to some insightful understanding of the characteristics ofcrossover sections in vessel networks. Finally, our algorithm is also simple andeasy to implement.
2 Our Approach
The problem of vessel tracing is to trace blood vessels by separating them intodisjoint vessel trees, each starting from a unique root segment within the opticdisk, as illustrated in red dots at Figure 1(b). Figure 1 describes the pipeline

of our approach that consists of two main steps: The preprocessing step mainlyconsists of segmentation, skeleton extraction, and digraph construction; Thetracing step then focuses on digraph-based label propagation using Matrix-foresttheorem — the main focus of this paper.
2.1 Preprocessing
The preprocessing step is comprised of the following three modules: Segmenta-tion: As illustrated in Figure 1 (a)→(b), an input retinal image is segmentedinto a binary image, with vessel pixels being foreground and the rest as back-ground. Note this step is skipped for synthetic retinal images as they are al-ready binary images. Skeleton map: Build a skeleton map from the binaryimage, and remove the optic disk area as marked within red ellipse in Fig-ure 1(b). The cusps attached to the removed optic disk are the tips of rootsegments, which are also presented as red dots in Figure 1(c), a zoom-in subsetof (b). Skeleton to digraph: A segment is defined in the skeleton as the groupof connected pixels that ends in either a junction or a tip. This segment corre-sponds to a node in the resulting digraph, as shown in Figure 1(c)→(d). Twonodes are then linked with a directed edge, when the two coinciding segmentsfrom the skeleton map contact and satisfy the ordering criteria, a modifica-tion of the well-known stream ordering method from the hydrology community(http://en.wikipedia.org/wiki/Strahler_number). More details can be found atour previous work [5].
2.2 Tracing by Matrix-Forest Theorem on Digraphs
The tracing problem becomes that of separating the vessel trees with only tree rootsknown, which can be equivalently formulated as a digraph-based label propagationproblem with one labeled node per class (vessel tree). That is, all the source nodesare labeled in this problem, each with a unique label (tree), and the task is to makepredictions on the remaining unlabeled nodes by propagating the class labels followingthe underlying digraph structure.
Problem Set-up Let G = (V, E ,W ) denote a digraph, where V = {v1, v2, . . . vn} isthe set of nodes, E the set of directed edges each connecting two adjacent nodes,and W = [wij ] ∈ Rn×n the asymmetric non-negative matrix with wij ≥ 0 being theweight of the directed edge from vi to vj . The out-degree of each node vi is computedas d+i =
∑nj=1 wij . Denote the out-degree matrix D = Diag(d+1 , · · · , d+n ), that is,
D = Diag(W1), with 1 an all-one column vector. Define the digraph Laplacian L =D−W . A row-stochastic transition probability matrix P = [pij ] can be constructed aspij =
wij
d+i, or equivalently as P = D−1W . Note undirected graphs can be regarded as
special digraphs characterized algebraically by their symmetric weight matrix W , i.e.the symmetric pair wij & wji correspond to bi-directional edges with equal weights.We focus here on a transductive inference scenario where labels from the set of fewlabeled nodes Vl are to be propagated to the rest unlabeled nodes Vu, with V = Vl∪Vu.The labels are multiclass, each corresponds to a separate vessel tree. To simplified thenotation we assume Vl contains the first l nodes, Vl = {v1, . . . , vl}. To accommodatelabel information, define a label matrix Y of size n ×K (assuming there are K class

labels available), with each entry Yik containing 1 if node i belongs to Vl and is labeledwith class k, and 0 otherwise. Also define the length n ground-truth label vector y thatincludes two disjoint parts yl and yu: yl is the input label vector of length l over theset of labeled nodes, with each entry yi for the input class assignment of node vi ∈ Vl;yu is the hold-out ground-truth label for the unlabeled nodes, i.e. a vector of lengthn− l. Similarly, define the initial label vector y containing also two parts, yl := yl andyu = 0, where 0 is an all-zero vector of length n − l. Define the prediction vector y∗
with also two parts y∗l := yl, as well as y∗u of length n − l, containing the predictionresults, where each y∗i denotes the predicted class assignment for a node vi ∈ Vu.
The proposed label propagation algorithm (shown in Algorithm 1 and referred toas MFTD) is derived based on matrix-forest theorem [4] of algebraic digraph theory [6],as follows. Let wmax denote the entry inW containing the strongest signal, i.e. wmax =maxi,j
∣∣wij∣∣. The forest matrix is defined as
S1 := (I + αL)−1, (1)
a normalized forest matrix where each (i, j)-th entry denotes the number of trees rootedat node i that also include the j-th node, as in Theorem 4 of [4]. It can be viewed asa generalization of the celebrated matrix-tree theorem (e.g. [7]) for undirected graphsto digraphs. Further, let L := limα→∞(I + αL)−1, which is a matrix of normalizedspanning forests. Both S1 and L has a number of interesting properties [8]: Each entryof both matrices is non-negative, and both matrices are row-stochastic; L resides in thenull space of digraph Laplacian L, as LL = LL = 0; rank(L) = n− rank(L); L+ βL isnon-singular for any β > 0, and is the “complementary perturbation of L” [9]. Indeed,this brings forward the second forest matrix,
S2 := (L+ βL)−1, (2)
which is also termed the matrix of dense forest in [4]. As presented in what follows,varying the preprocessing schemes of normalizing W , we have two variants: MFTDa
starts with a preprocessing effort to normalize W , W ← Wwmax
; MFTDb considers adifferent normalization of W as W ← D−1W instead, i.e. P =W .
Proposition 1. Under normalization scheme of W ← D−1W , the forest matrix be-comes S1 = (1− τ)(I − τP )−1, with τ = α
1+α.
When applied on the second forest matrix S2 using (2), this clearly leads to two addi-tional variants that are denoted as MFTDc & MFTDd, respectively.
Algorithm 1 Label Propagation by Matrix-Forest Theorem of Digraphs (MFTD)Input: A digraph G = (V, E ,W ), label information Y , yl, and α ∈ (0, 1).Output: y∗uCompute the out-degree matrix D.Compute the affinity matrix by A = SY and (1) (or (2)).Predict y∗u: Compute the i-th entry by (3), for any unlabeled node vi ∈ Vu.
One can interpret the (i, j)-th entry Sij of the forest matrix S (being either S := S1
or S := S2) as quantifying the accessibility of a particle from a node vi to visit node
vj along the digraph structure. This provides a notion of affinity from state i to j. Theintuition is, if a state j is close to the initial state i in terms of graph structure, itwill be visited by the particle more often than if it is far away from initial state, i.e.,we visit our close relatives more often than our distant ones. Now define the affinitymatrix as A = SY , a matrix of size n×K, with each entry aik being associated withan affinity score of state i belonging to class k. To infer y∗u of the unlabeled states Vu,our algorithm predicts each entry’s class assignment by identifying a label with thelargest affinity score,
y∗i = argmaxk
aik, ∀vi ∈ Vu. (3)
MTTDa MFTDb MFTDc MFTDd
10−5 10−4 10−3 10−2 10−1 100 101 102 103 104 1050.65
0.7
0.75
0.8
0.85
0.9
α
Accu
racy
(AC
)
10−5 10−4 10−3 10−2 10−1 100 101 102 103 104 1050.5
0.6
0.7
0.8
0.9
β
Accu
racy
(AC
)
10−5 10−4 10−3 10−2 10−1 100 101 102 103 104 1050.65
0.7
0.75
0.8
0.85
0.9
α
Accu
racy
(AC
)
10−5 10−4 10−3 10−2 10−1 100 101 102 103 104 1050.5
0.6
0.7
0.8
0.9
β
Accu
racy
(AC
)
DRIVE STARE
10−5 10−4 10−3 10−2 10−1 100 101 102 103 104 1050.5
0.55
0.6
0.65
0.7
0.75
α
Accu
racy
(AC
)
10−5 10−4 10−3 10−2 10−1 100 101 102 103 104 1050.4
0.5
0.6
0.7
0.8
β
Accu
racy
(AC
)
Synthetic Dataset
Fig. 2. Performance (AC) as a function of varying α or β of MFTDa−d.
PAC-Bayesian Label-propagation Bound We report an investigation of the general-ization bound of our approach on unseen data, which is an adaptation of [10]. We startby reformulating our algorithm (i.e. both (1) and (2)) as an equivalent representationh = Sy, where y is the initial label vector with partial labels yi ∈ {±1} for vi ∈ Vl,and yi = 0 otherwise. The obtained h is the “soft” label vector with hi being the ”soft”label for node vi, which will be assigned with class label sign(hi) when making pre-dictions. The hypothesis space is defined as H :=
{h∣∣∣ h = Sy, ‖y‖2 ≤
√l}. For any
label vector h, define the test error as Ll,n(h) := 1n−l
∑ni=l+1 `(hi, yi) w.r.t. its 0/1
loss function ` satisfying `(hi, yi) = 1 if hi 6= yi and 0 otherwise, and let the empiricalerror of h be Ll,n(h) := 1
l
∑li=1 `(hi, yi).
Theorem 1. For any δ ∈ (0, 1), with probability at lest 1− δ over random draws of Vlfrom V, the following bound holds for any h ∈ H
Ll,n(h) ≤ Ll,n(h) +
√√√√( 2Ll,n(h)n
n − l
)ln lδ
+ 7ln(n + 1)
l − 1+
2(ln lδ
+ 7ln(n + 1))
l − 1.

3 Experiments
Our approach is evaluated in our in-house synthetic dataset 5, as well as two testbeds,DRIVE [11] and STARE [12]. The synthetic dataset contains 17, 000 synthesized retinalimages with varying densities of blood vessels. Meanwhile, DRIVE dataset contains 40retinal fundus images, and STARE has 20 fundus images. Exemplar images of the threedatasets are illustrated in Figure 3.
Synthetic DatasetCDRN WVRN CTKd CTKu SGL MFTD
AC 0.63 0.65 0.63 0.71 0.71 0.75DS 0.62 0.62 0.61 0.68 0.64 0.72
DRIVE [11]CDRN WVRN CTKd CTKu SGL MFTD
AC 0.69 0.67 0.73 0.79 0.76 0.81DS 0.68 0.64 0.72 0.74 0.75 0.76
STARE [12]CDRN WVRN CTKd CTKu SGL MFTD
AC 0.71 0.73 0.75 0.83 0.79 0.89DS 0.68 0.69 0.74 0.78 0.76 0.84
Table 1. Comparison with leading label propagation methods. See text for details.
Our approach is compared with the following label propagation methods: ClassDistribution Relational Neighbor classifier (CDRN) [13], Weighted Vote RelationalNeighbor classifier (WVRN) [13], Digraph variant of the Commute Time Kernel clas-sifier (CTKd), and the original Commute Time Kernel classifier for undirected graphs(CTKu) [14], and Symmetrized Graph Laplacian (SGL) [15]. To summarize, CTKu isan undirected graph-based method, CTKd, SGL, and the proposed MFTD are digraph-based methods, while the rest methods are not graph-theoretical. To ensure fair evalu-ations, the internal parameters of the comparison methods are either set to as is fromthe authors’ original source code, or as suggested in the papers. In terms of evalua-tion metric, the micro-averaged accuracy (AC)is utilized, which is the sum of all truepositive counts divided by the total number of instances. Besides, the DIADEM score(DS) [16] is also employed, being a dedicated measure that has been widely used bythe biological tracing community.
Effect of Varying α (or β) of Our Approach Our first experiment is to evaluatethe effect of varying the value of our algorithmic parameter, namely α in MFTDa−b,or β in MFTDc−d. This is performed on all three datasets. As presented in Figure 2,the performance (AC) is displayed as a function of varying parameter value (α inrow 1 & β in row 2) of our proposed algorithms MFTDa−d, with x-axis being in log-scale. Surprisingly, all four variants of our MFTD framework produces exactly the sameresults when α ≥ 1 and β ≤ 10−4, which is also verified under the AC criterion as in thefigure. This is very interesting as despite their differences in algebraic forms and graph-theoretical interpretations, effectively these variants are equivalent characterized by
5 Downloadable at http://web.bii.a-star.edu.sg/~jaydeepd/tracing.htm.
their ability of tracing retinal blood vessels. To avoid redundancies, we will collectivelyrefer to the performance of all these four variants as MFTD, and fix α = 1 and β = 10−4
during the rest experiments.
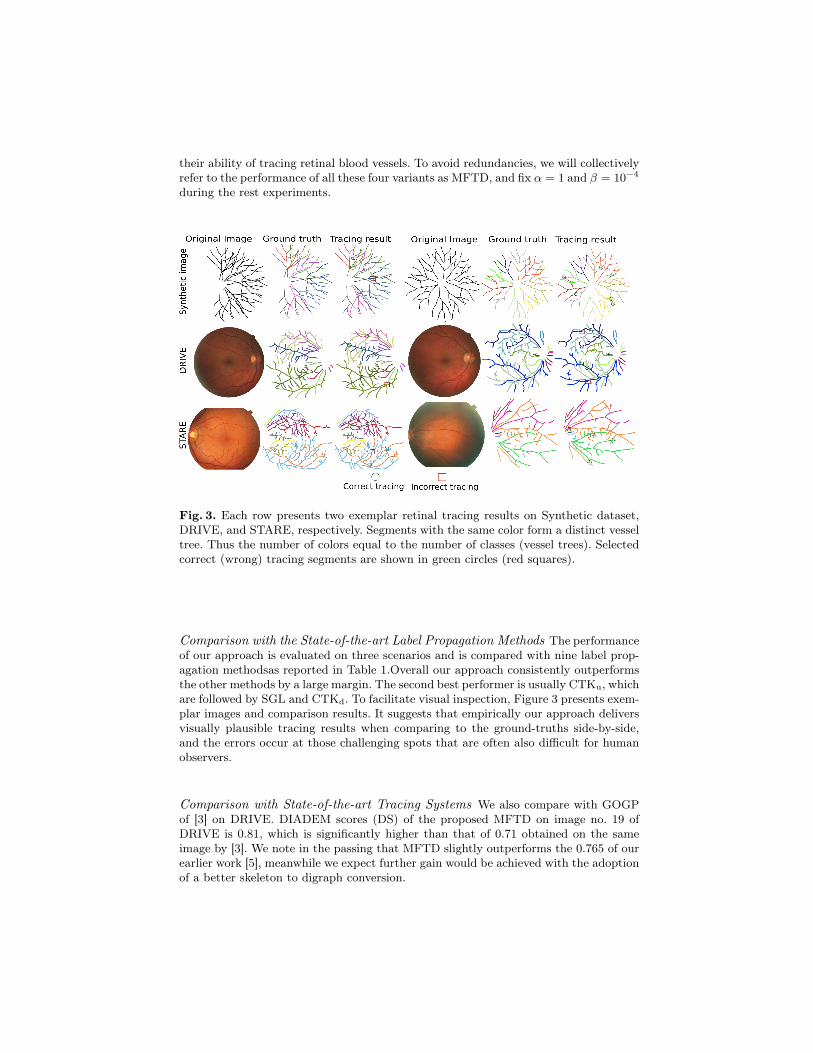
Fig. 3. Each row presents two exemplar retinal tracing results on Synthetic dataset,DRIVE, and STARE, respectively. Segments with the same color form a distinct vesseltree. Thus the number of colors equal to the number of classes (vessel trees). Selectedcorrect (wrong) tracing segments are shown in green circles (red squares).
Comparison with the State-of-the-art Label Propagation Methods The performanceof our approach is evaluated on three scenarios and is compared with nine label prop-agation methodsas reported in Table 1.Overall our approach consistently outperformsthe other methods by a large margin. The second best performer is usually CTKu, whichare followed by SGL and CTKd. To facilitate visual inspection, Figure 3 presents exem-plar images and comparison results. It suggests that empirically our approach deliversvisually plausible tracing results when comparing to the ground-truths side-by-side,and the errors occur at those challenging spots that are often also difficult for humanobservers.
Comparison with State-of-the-art Tracing Systems We also compare with GOGPof [3] on DRIVE. DIADEM scores (DS) of the proposed MFTD on image no. 19 ofDRIVE is 0.81, which is significantly higher than that of 0.71 obtained on the sameimage by [3]. We note in the passing that MFTD slightly outperforms the 0.765 of ourearlier work [5], meanwhile we expect further gain would be achieved with the adoptionof a better skeleton to digraph conversion.

4 Conclusion and Outlook
A novel approach is proposed for tracing vessels in fundus images. The tracing problemis solved by utilizing matrix-forest theorem of digraphs. Empirical evaluation demon-strates the superior performance of our approach. For future direction we plan to workwith broader applications such as neurite tracing.
Acknowledgements
This research was partially supported by A*STAR JCO grants, as well as NSFC (No.81271650) and NCET-10-0041.
References
1. Viswanath, K., McGavin, D.: Diabetic retinopathy: Clinical findings and manage-ment. Community Eye Health 16(46) (2003) 21–24
2. Becker, C., Rigamonti, R., Lepetit, V., Fua, P.: Supervised feature learning forcurvilinear structure segmentation. In: MICCAI. (2013)
3. Turetken, E., Gonzalez, G., Blum, C., Fua, P.: Automated reconstruction of den-dritic and axonal trees by global optimization with geometric priors. Neuroinfor-matics 9 (2011) 279–302
4. Agaev, R.P., Chebotarev, P.Y.: Spanning forests of a digraph and their applica-tions. Automation and Remote Control 62(3) (2001) 443–466
5. De, J., Li, H., Cheng, L.: Tracing retinal vessel trees by transductive inference.BMC Bioinformatics 15(20) (2014) 1–20
6. Harary, F., Norman, R., Cartwright, D.: Structural models : an introduction tothe theory of directed graphs. Wiley (1965)
7. Brualdi, R., Ryser, H.: Combinatorial Matrix Theory. Cambridge Uni. Press (1991)8. Chebotarev, P.Y., Agaev, R.P.: Forest matrices around the laplacian matrix. Linear
Algebra and its Applications 356(1-3) (2002) 253–2479. Meyer, C., Stadelmaier, M.: Singular m-matrices and inverse positivity. Linear
Algebra and its Applications 22 (1978) 139–15610. Derbeko, P., El-Yaniv, R., Meir, R.: Explicit learning curves for transduction and
application to clustering and compression algorithms. J. Artif. Intell. Res. 22(2004) 117–142
11. Staal, J., Abramoff, M., Niemeijer, M., Viergever, M., van Ginneken, B.: Ridgebased vessel segmentation in color images of the retina. IEEE Trans. Med. Imag.23(4) (2004) 501–509
12. Hoover, A., Kouznetsova, V., Goldbaum, M.: Locating blood vessels in retinalimages by piecewise threshold probing of a matched filter response. IEEE TransMed Imag 19(3) (2000) 203 –210
13. Macskassy, S., Provost, F.: Classification in networked data: A toolkit and a uni-variate case study. JMLR 8 (2007) 935–983
14. Fouss, F., Francoisse, K., Yen, L., Pirotte, A., Saerens, M.: An experimental inves-tigation of kernels on graphs for collaborative recommendation and semisupervisedclassification. Neural Network 31 (2012) 53–72
15. Zhou, D., Huang, J., Schölkopf, B.: Learning from labeled and unlabeled data ona directed graph. In: ICML. (2005)
16. Gillette, T.A., Brown, K.M., Ascoli, G.A.: The diadem metric: comparing multiplereconstructions of the same neuron. Neuroinformatics 9(2-3) (2011) 233–245