Embed Size (px)
Citation preview
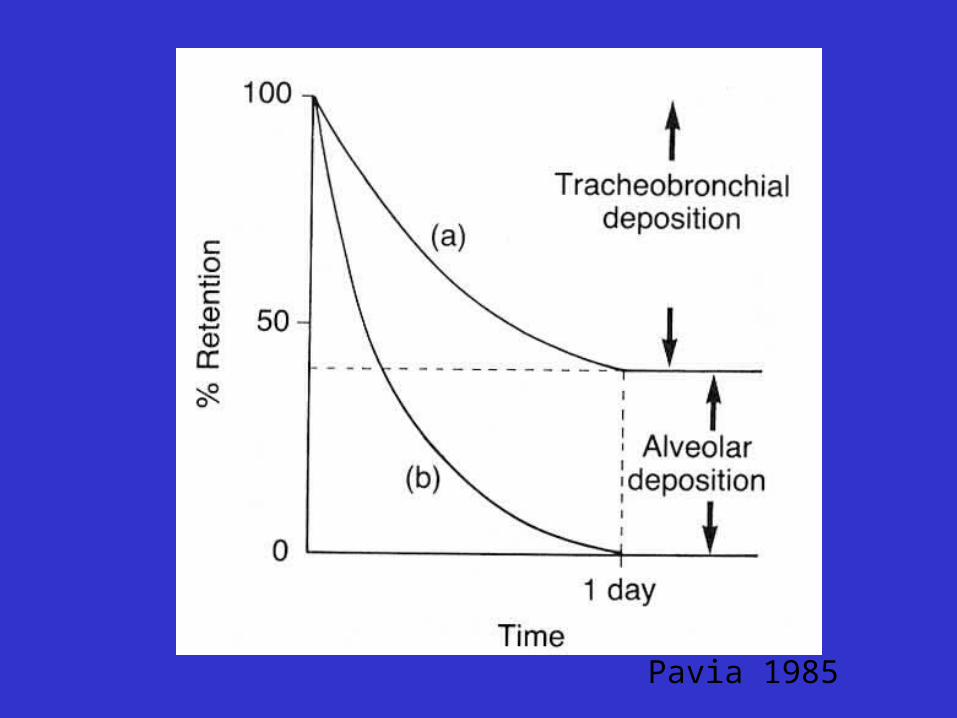
“Tracheobronchial” Clearance
Fast clearance from the bronchi and bronchioles
J E AgnewRoyal Free Hampstead NHS Trust and
Royal Free & University College Medical School
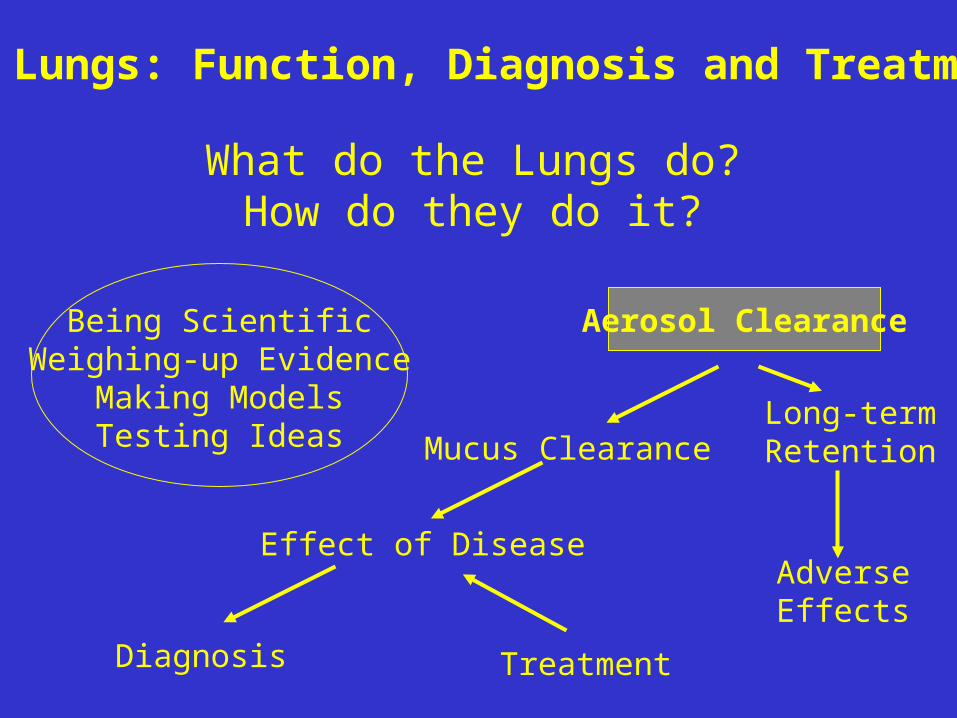
The Lungs: Function, Diagnosis and Treatment
What do the Lungs do?How do they do it?
Being ScientificWeighing-up Evidence
Making ModelsTesting Ideas
Aerosol Clearance
Mucus Clearance
Effect of Disease
Diagnosis Treatment
Long-termRetention
AdverseEffects

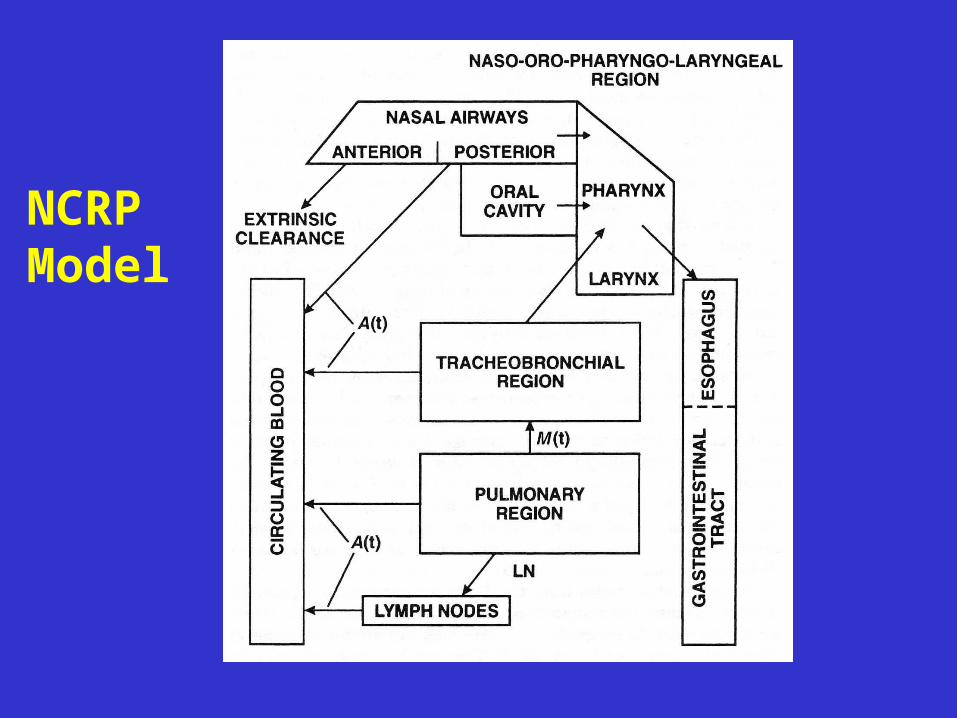
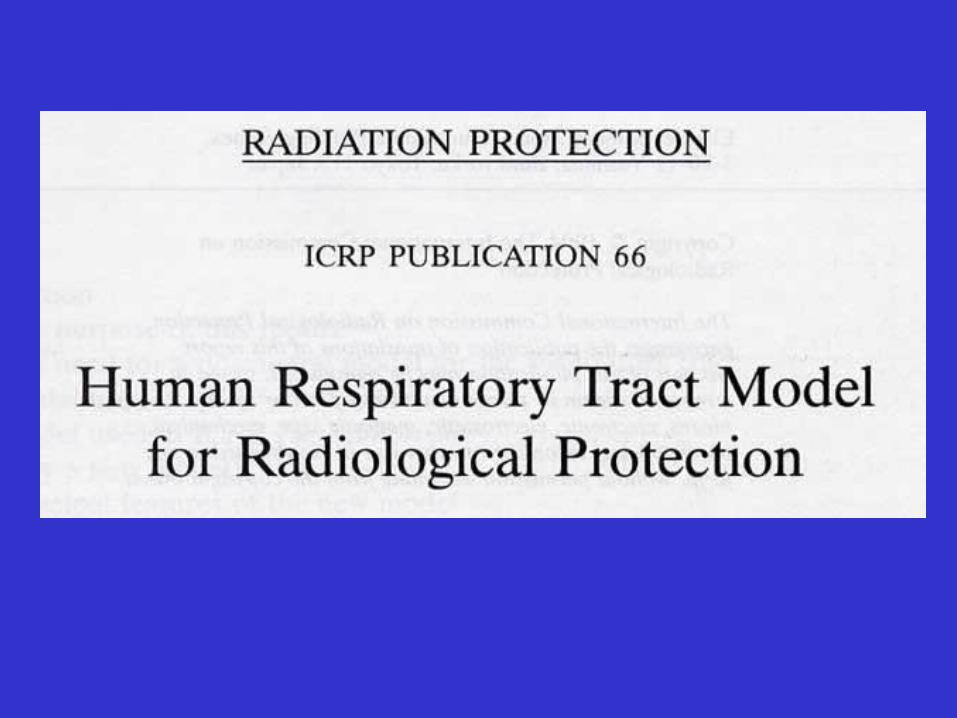
The ICRP Respiratory Tract Model

ET
BB
bb
LymphNodes
Blood
GItract
AI
ClearanceRoutesfrom theRespiratoryTract
based onthe ICRP
model
ICRPPublication
66
NCRPModel
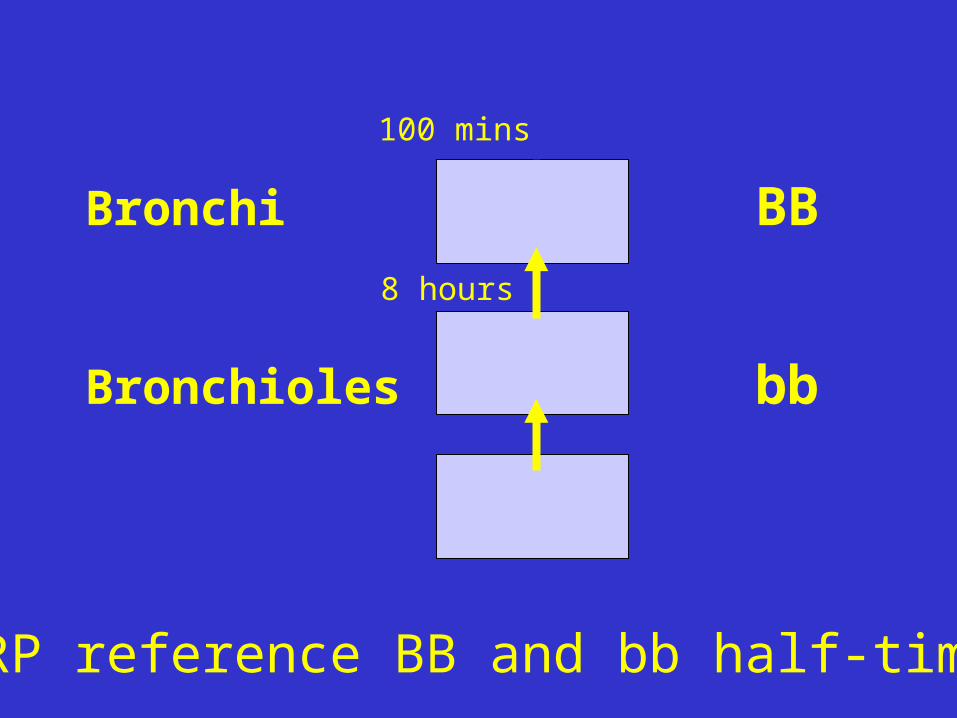
Bronchi BB
Bronchioles bb
100 mins
8 hours
ICRP reference BB and bb half-times
0
20
40
60
80
100
% In
itia
l Th
ora
cic
De
po
sitio
n
0 20 40 60 80 100Hours after inhalation
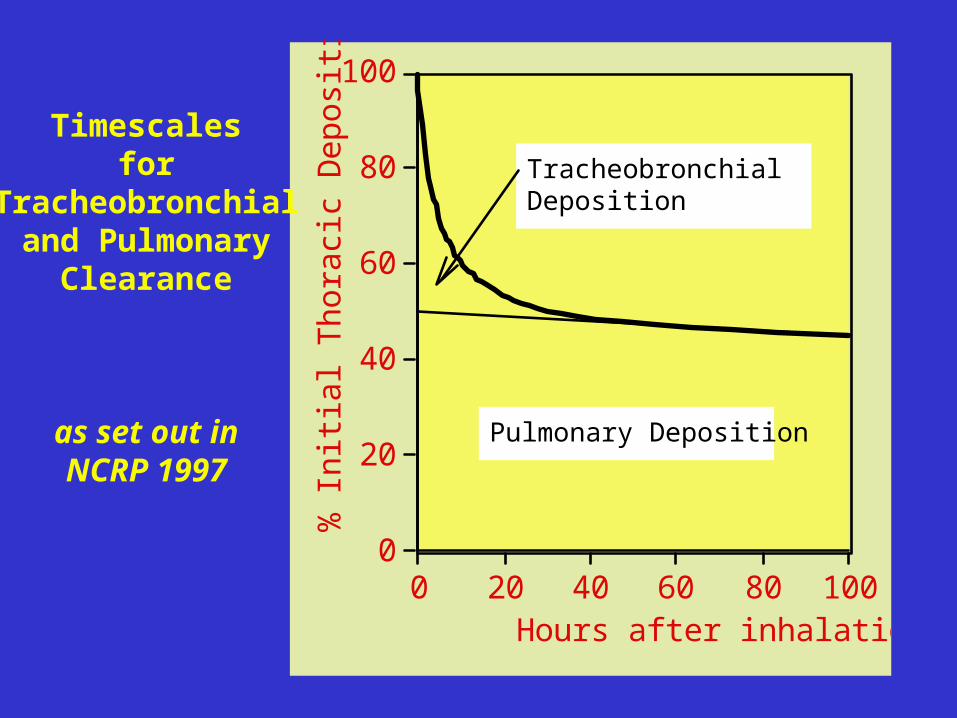
Pulmonary Deposition
TracheobronchialDeposition
Timescalesfor
Tracheobronchialand Pulmonary
Clearance
as set out inNCRP 1997

Aerosol Particles
•Inert polystyrene particles•5m diameter•Tc-99m labelled•Inhaled “slowly”•Retention measured 0-6h & 24h•Initial Gamma Camera Image
0
10
20
30
40
50
Normal CF-mild CF-mod CF-sev
0.00
0.20
0.40
0.60
Normal CF-mild CF-mod CF-sev
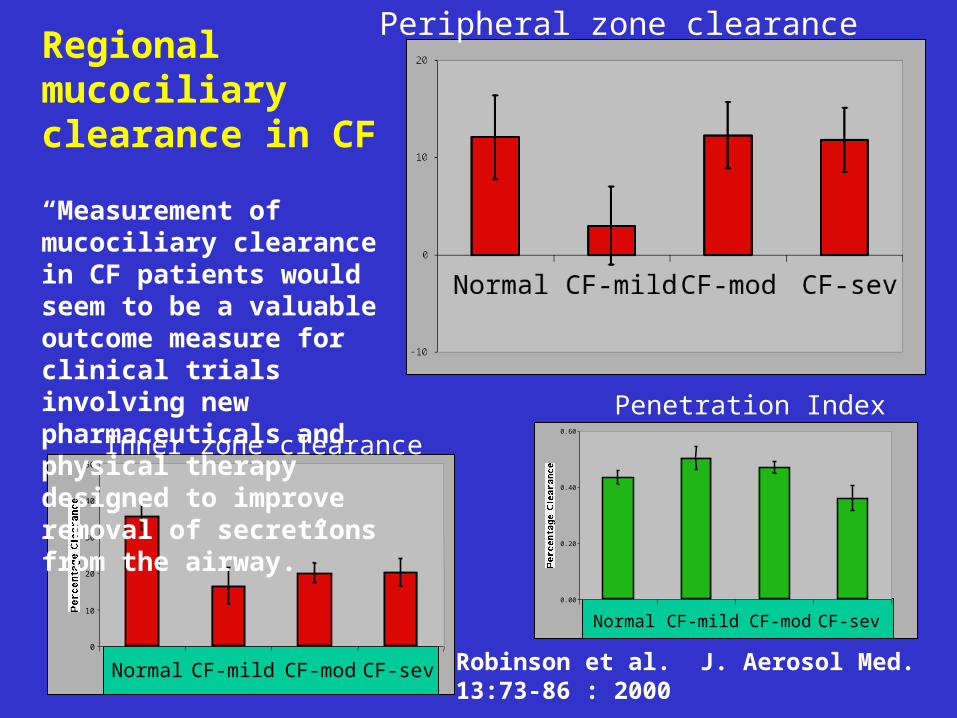
Regional mucociliaryclearance in CF
“Measurement of mucociliary clearance in CF patients would seem to be a valuable outcome measure for clinical trials involving new pharmaceuticals and physical therapy designed to improve removal of secretions from the airway.”
Peripheral zone clearance
Inner zone clearance
Penetration Index
Robinson et al. J. Aerosol Med. 13:73-86 : 2000

0
2
4
6
8
10
12
14
16
18
Intermediate Zone Outer Zone
Control FET
Control FET
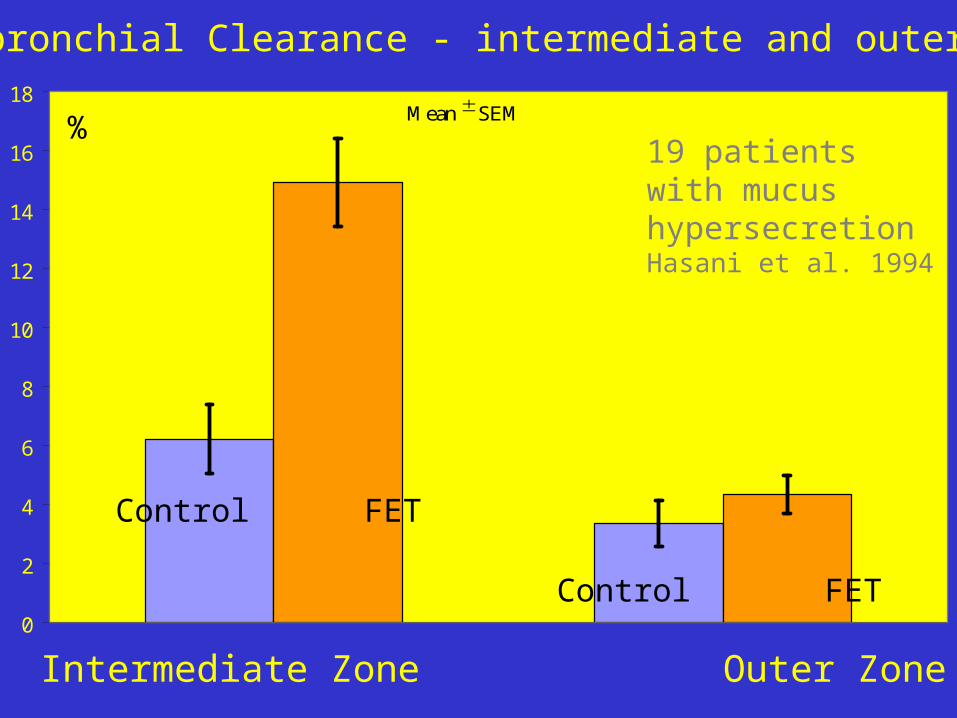
Tracheobronchial Clearance - intermediate and outer zones
Mean SEM%
19 patientswith mucushypersecretionHasani et al. 1994

TheLungs ?
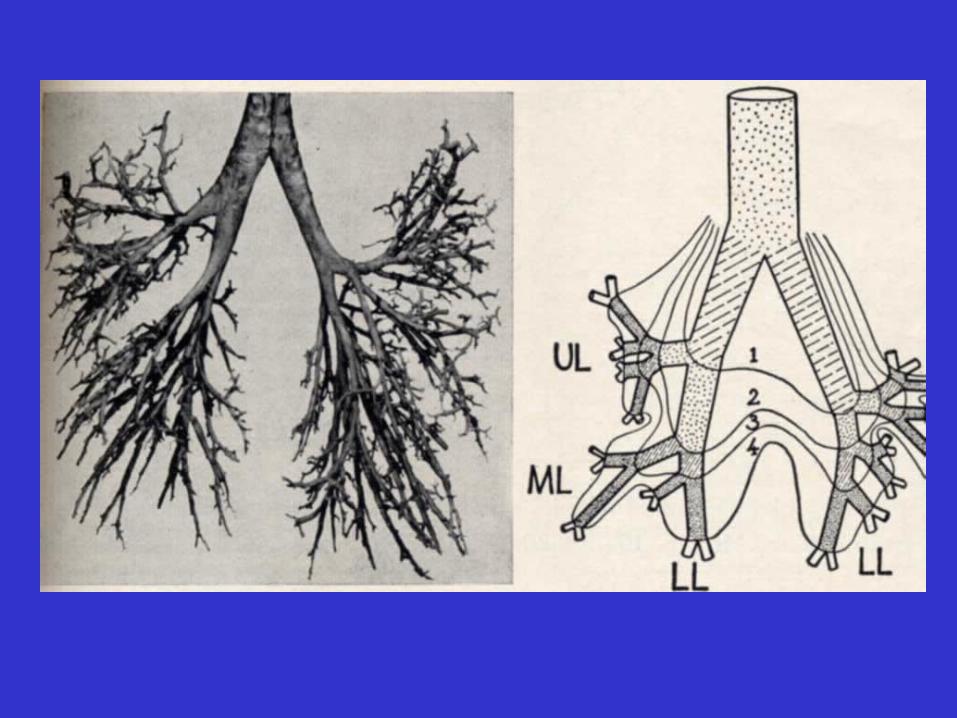
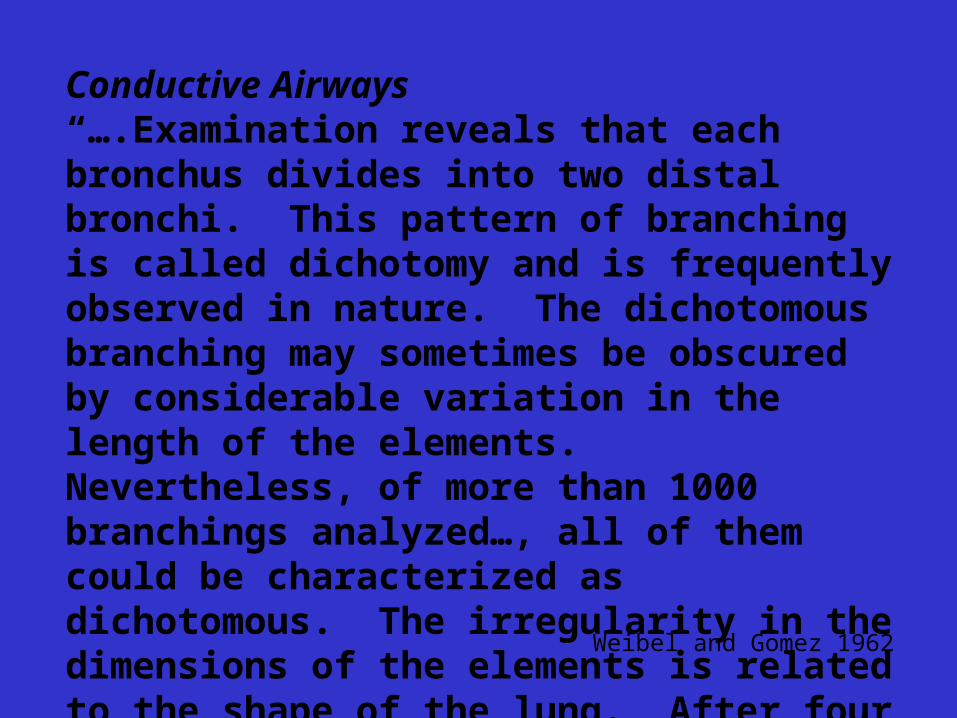
Conductive Airways“….Examination reveals that each bronchus divides into two distal bronchi. This pattern of branching is called dichotomy and is frequently observed in nature. The dichotomous branching may sometimes be obscured by considerable variation in the length of the elements. Nevertheless, of more than 1000 branchings analyzed…, all of them could be characterized as dichotomous. The irregularity in the dimensions of the elements is related to the shape of the lung. After four generations of airway branching… the basic shape of the lung appears to be outlined.”
Weibel and Gomez 1962

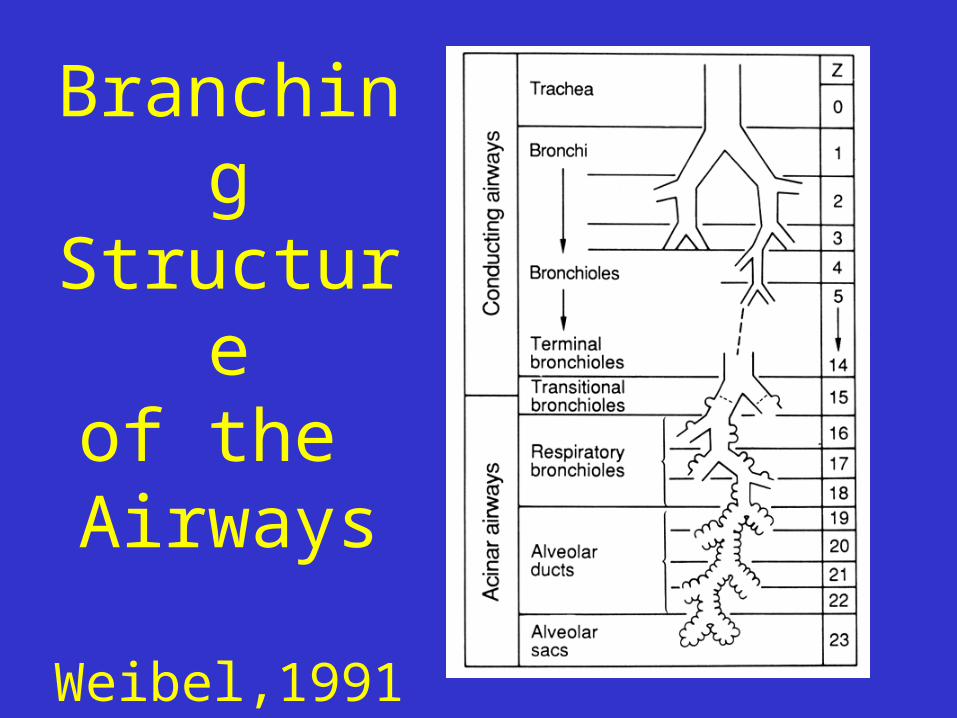
BranchingStructure
of the Airways
Weibel,1991original version
Weibel, 1963

The‘Tracheo-bronchial’
tree
from
Contours ofBreathing (1980)
based on
Weibel (1963)

BronchialEpithelium(seen incross-section)
Royal Free
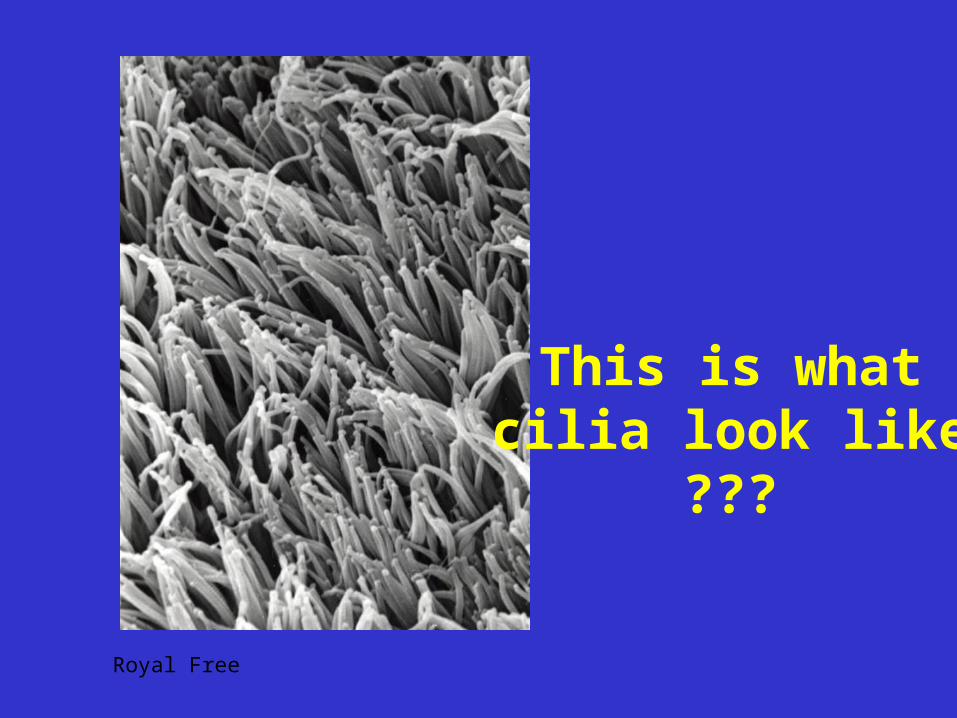
This is whatcilia look like
???
Royal Free
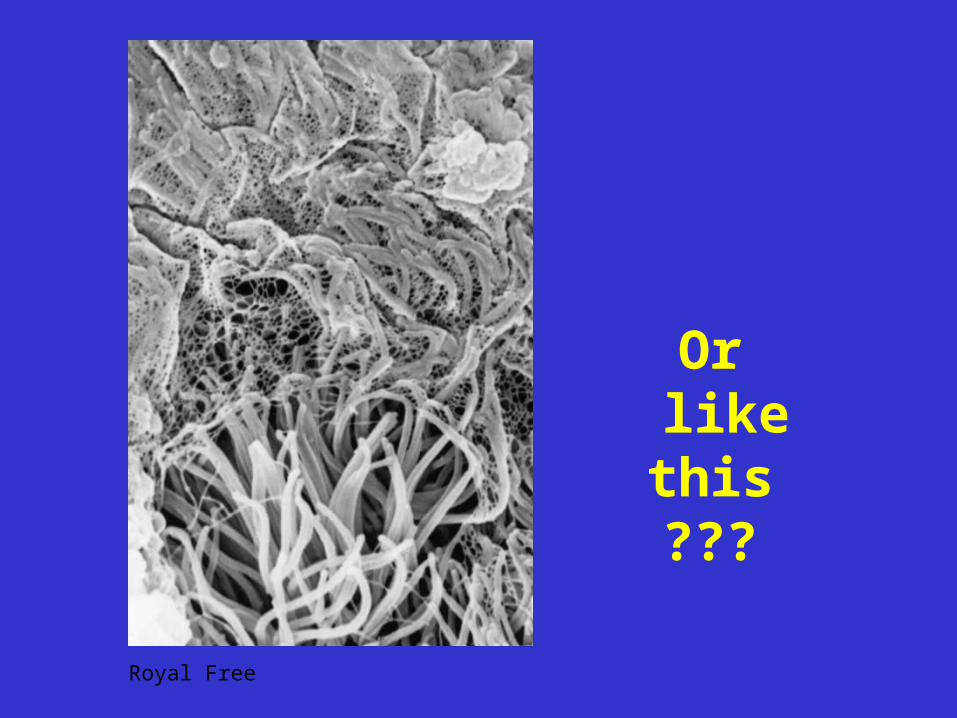
Or likethis???
Royal Free
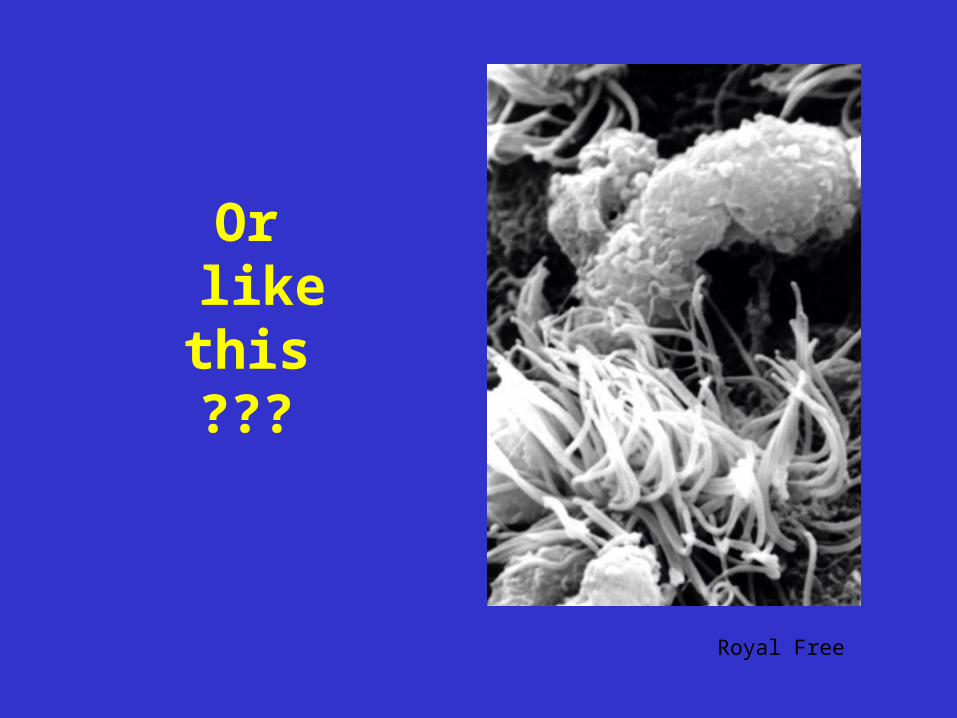
Or likethis???
Royal Free

Trachealepithelium
BC basal cellsTBC tall basal
cellsCC ciliated cellsGC goblet cellsIC intermediate
cells
Evans et al Exp Lung Res 2001: 27: 401-5
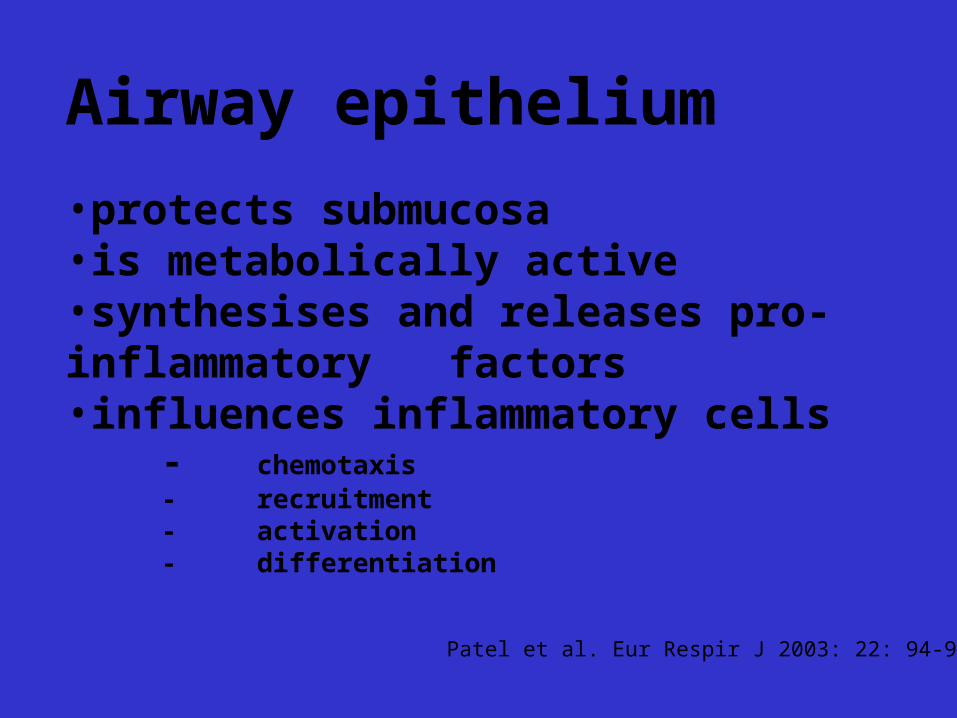
Airway epithelium
•protects submucosa•is metabolically active•synthesises and releases pro-inflammatory
factors•influences inflammatory cells
- chemotaxis- recruitment- activation- differentiation
Patel et al. Eur Respir J 2003: 22: 94-9
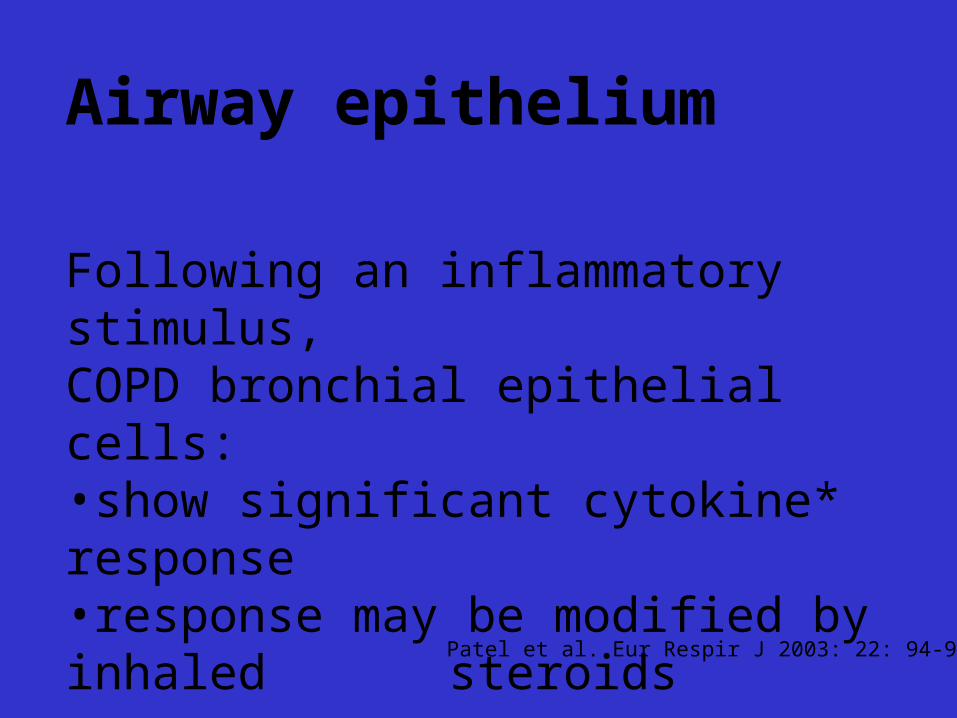
Airway epithelium
Following an inflammatory stimulus,COPD bronchial epithelial cells:•show significant cytokine* response•response may be modified by inhaled
steroids
*interleukin (IL)-6 and (IL)-8
Patel et al. Eur Respir J 2003: 22: 94-9
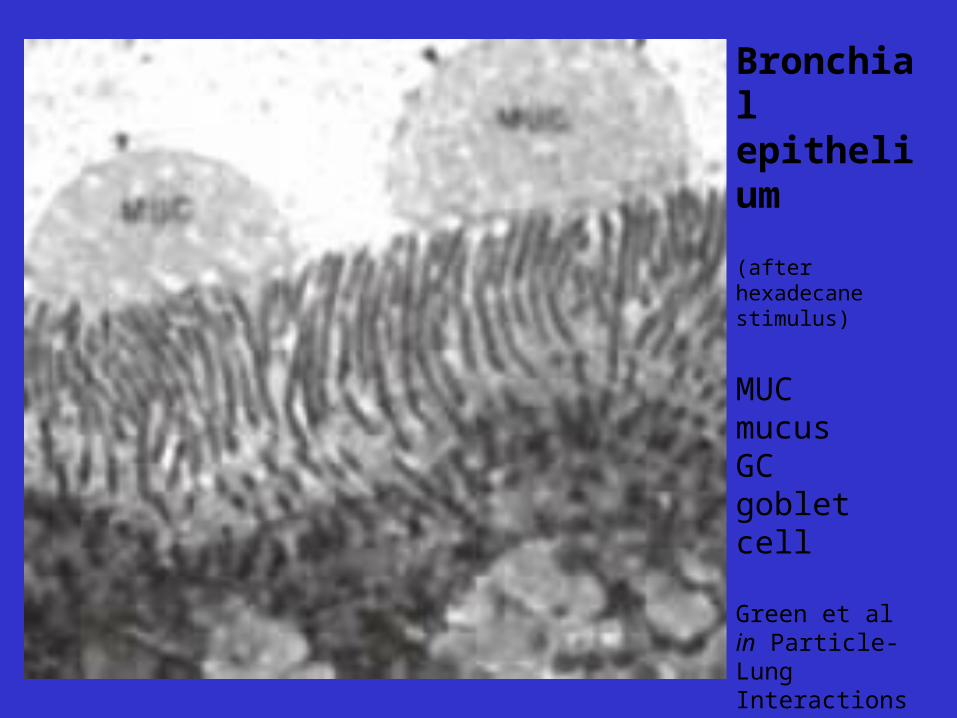
Bronchialepithelium
(after hexadecanestimulus)
MUCmucusGCgoblet cell
Green et alin Particle-LungInteractionsed. Gehrand HeyderMarcel Dekker2000
Royal Free
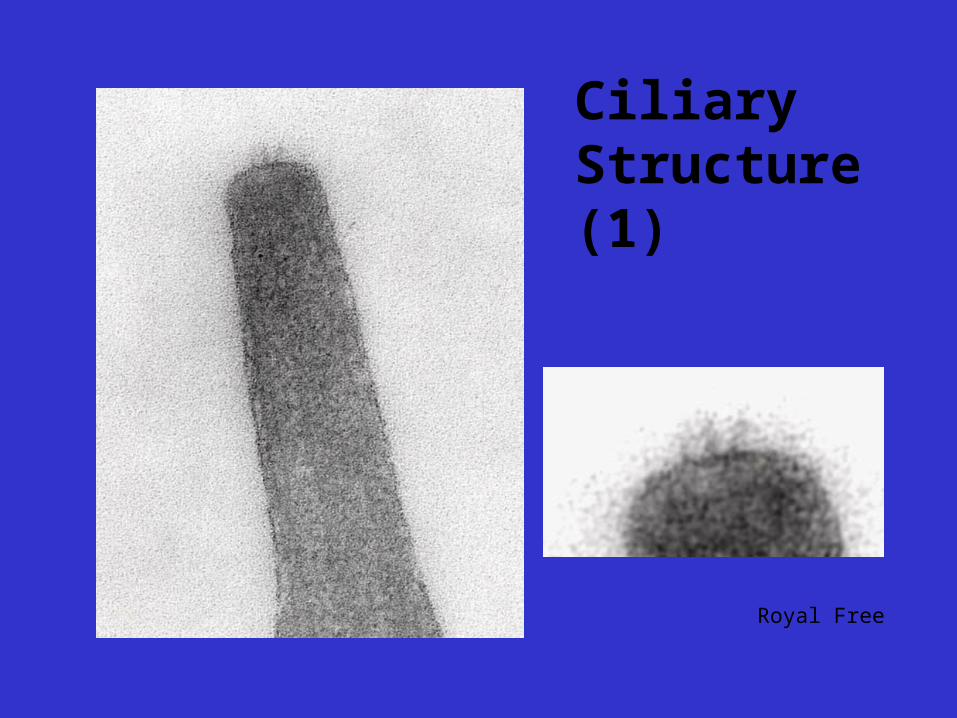
Ciliary Structure(1)

Royal Free
Ciliary Structure(2)
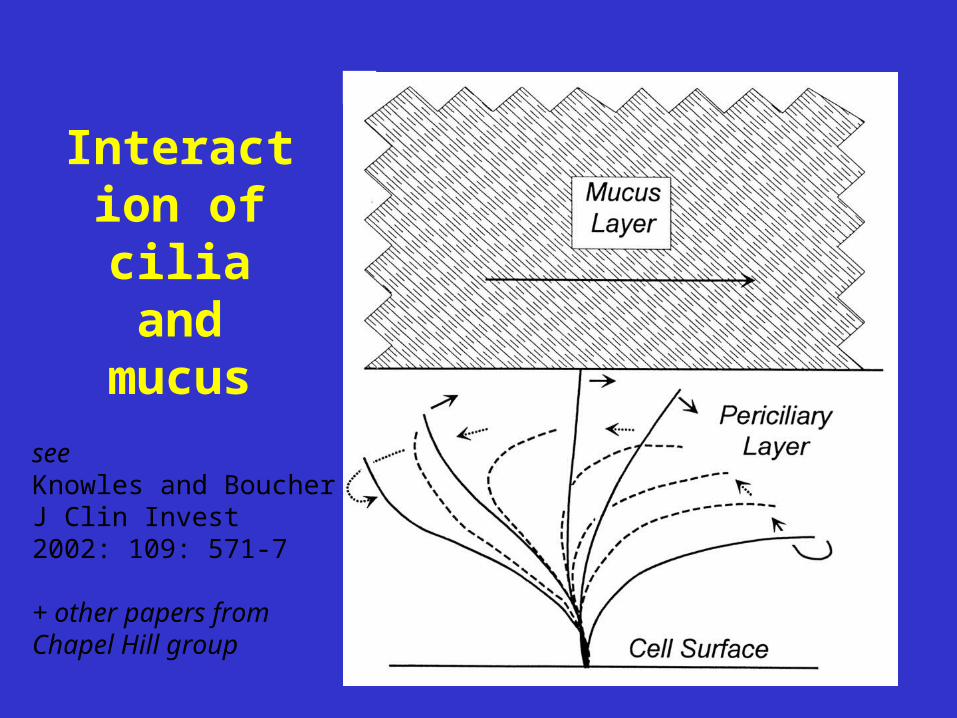
Interaction of cilia and
mucus
seeKnowles and BoucherJ Clin Invest2002: 109: 571-7
+ other papers fromChapel Hill group
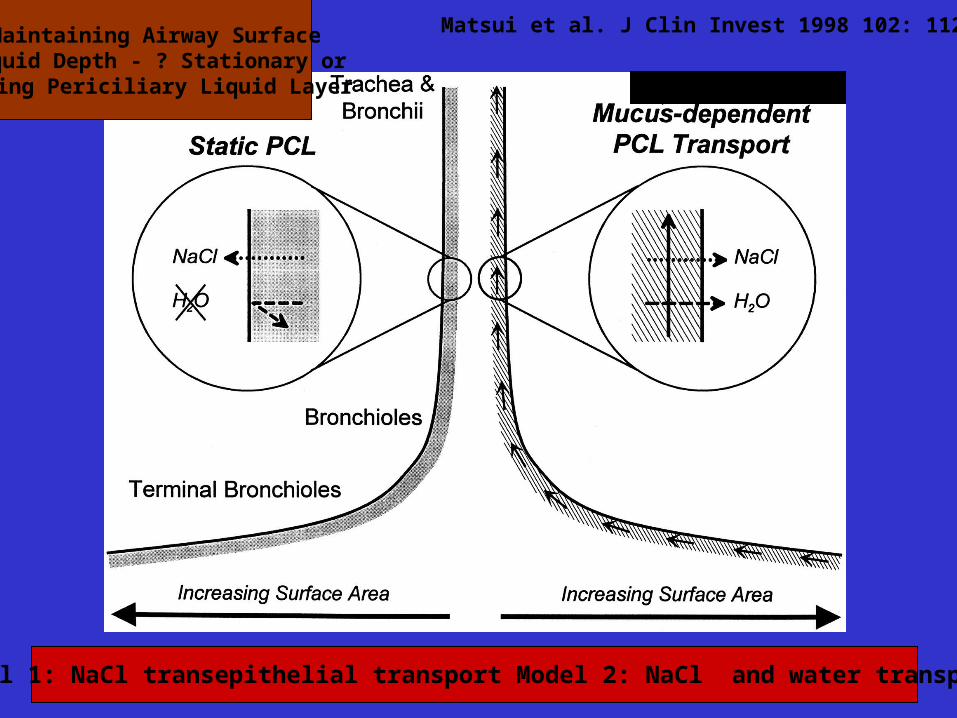
Maintaining Airway SurfaceLiquid Depth - ? Stationary or
Moving Periciliary Liquid Layer
Model 1: NaCl transepithelial transport Model 2: NaCl and water transport
Matsui et al. J Clin Invest 1998 102: 1125-31
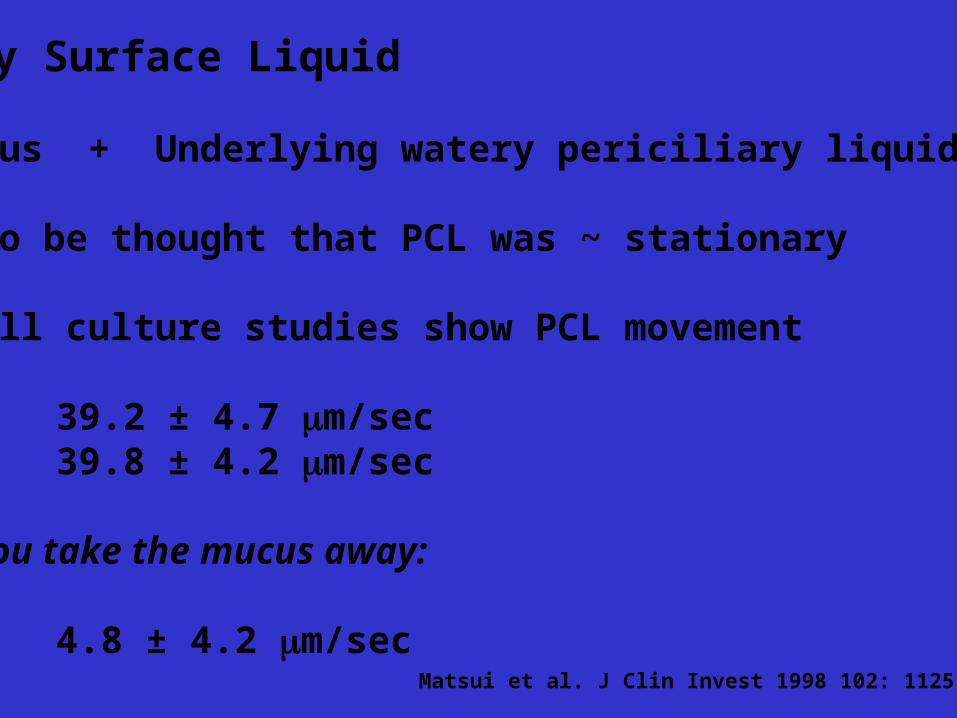
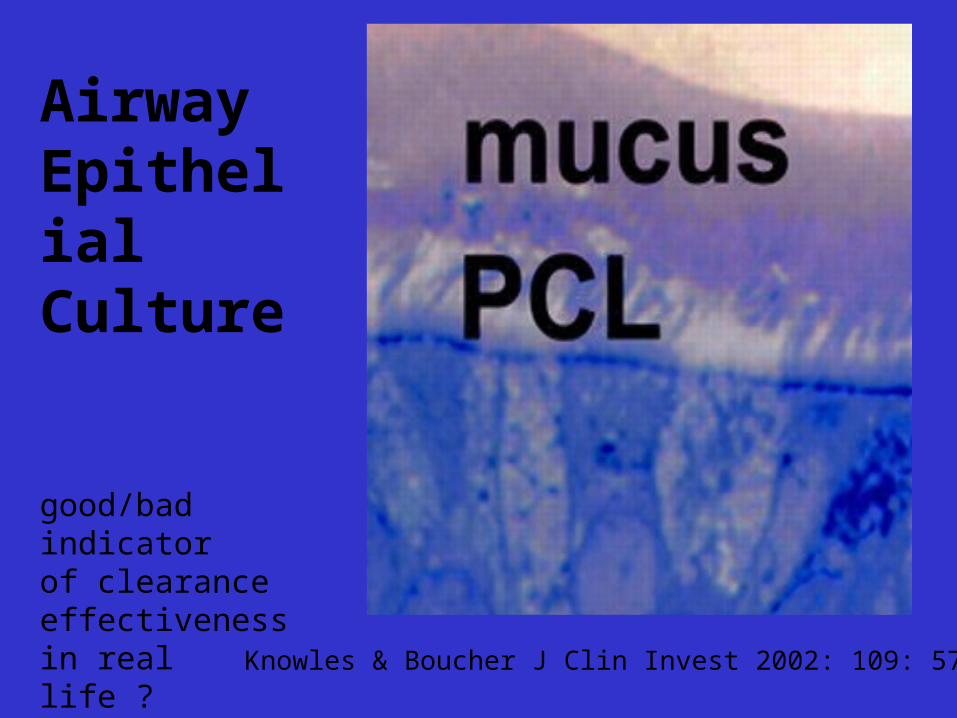
Airway Surface Liquid
= Mucus + Underlying watery periciliary liquid (PCL)
Used to be thought that PCL was ~ stationary
Now cell culture studies show PCL movement
Mucus 39.2 ± 4.7 m/secPCL 39.8 ± 4.2 m/sec
But if you take the mucus away:
PCL 4.8 ± 4.2 m/secMatsui et al. J Clin Invest 1998 102: 1125-31
Airway Surface Liquid
“The cephalad movement of PCL along airway epithelial surfaces makes .. mucus-driven transport an important component of salt and water physiology in the lung in health and disease.”
Matsui et al. J Clin Invest 1998 102: 1125-31
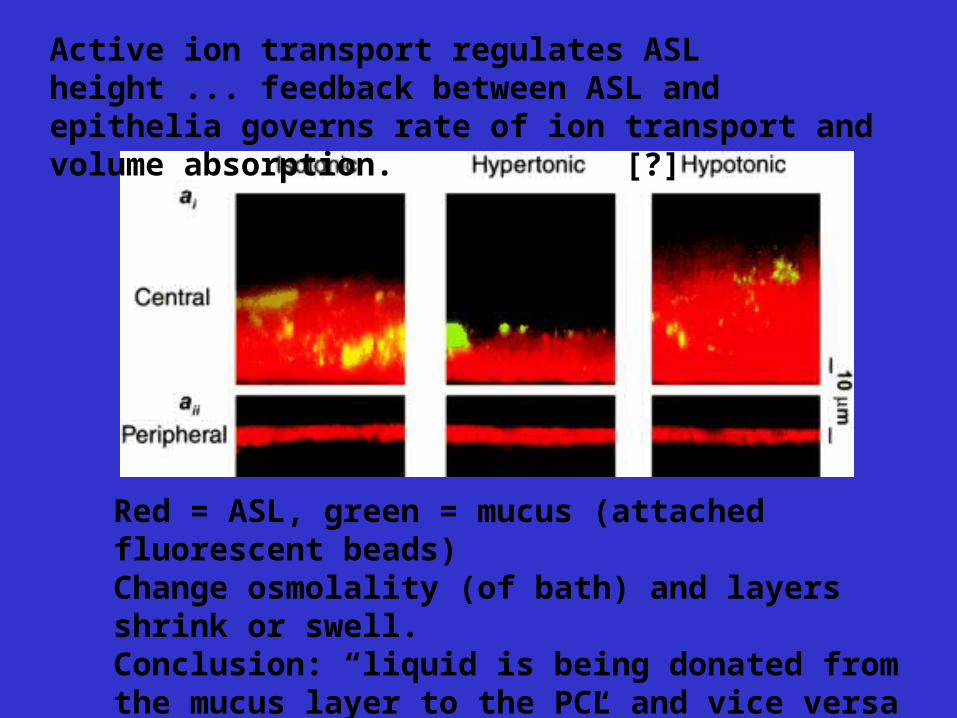
Red = ASL, green = mucus (attached fluorescent beads)Change osmolality (of bath) and layers shrink or swell.Conclusion: “liquid is being donated from the mucus layer to the PCL and vice versa in a spongelike fashion…”
Tarran et al. J Gen Physiol 2001: 118: 223-36
Active ion transport regulates ASL height ... feedback between ASL and epithelia governs rate of ion transport and volume absorption. [?]

Tarran et al. J Gen Physiol 2001: 118: 223-36
Mucus transport - as seen by time-lapse photos in cell culture experiments
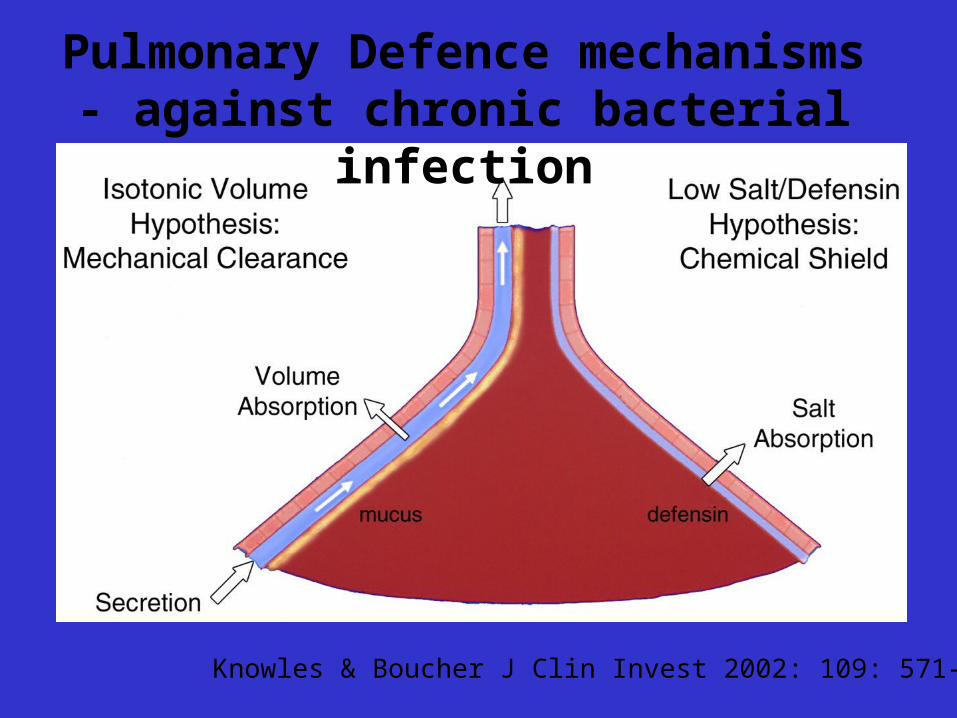
Pulmonary Defence mechanisms - against chronic bacterial infection
Knowles & Boucher J Clin Invest 2002: 109: 571-7
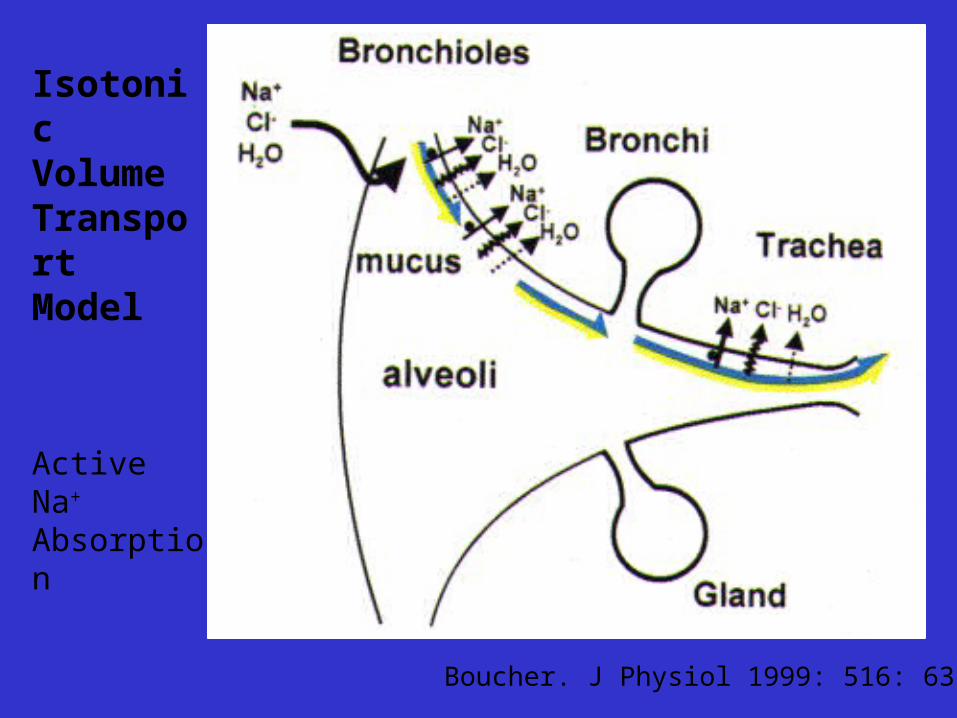
IsotonicVolumeTransportModel
ActiveNa+
Absorption
Boucher. J Physiol 1999: 516: 631-8
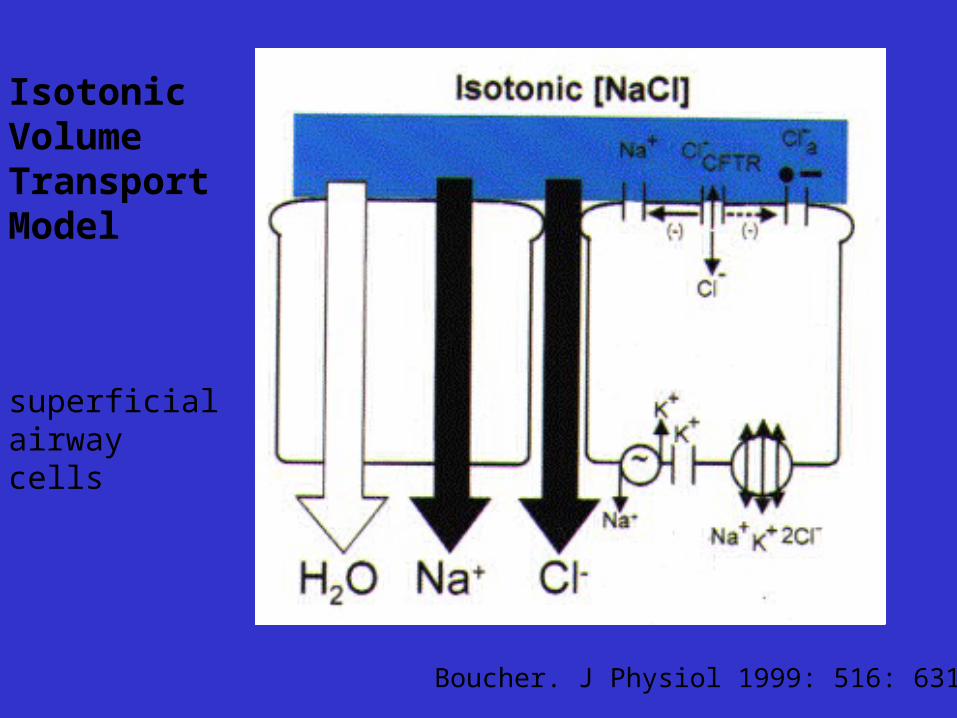
IsotonicVolumeTransportModel
superficialairwaycells
Boucher. J Physiol 1999: 516: 631-8

IsotonicVolumeTransportModel
submucosalgland
glandductsabsorbNaClbut notwater
Boucher. J Physiol 1999: 516: 631-8

“Hypotonic ASL physiology” Boucher. J Physiol 1999: 516: 631-8
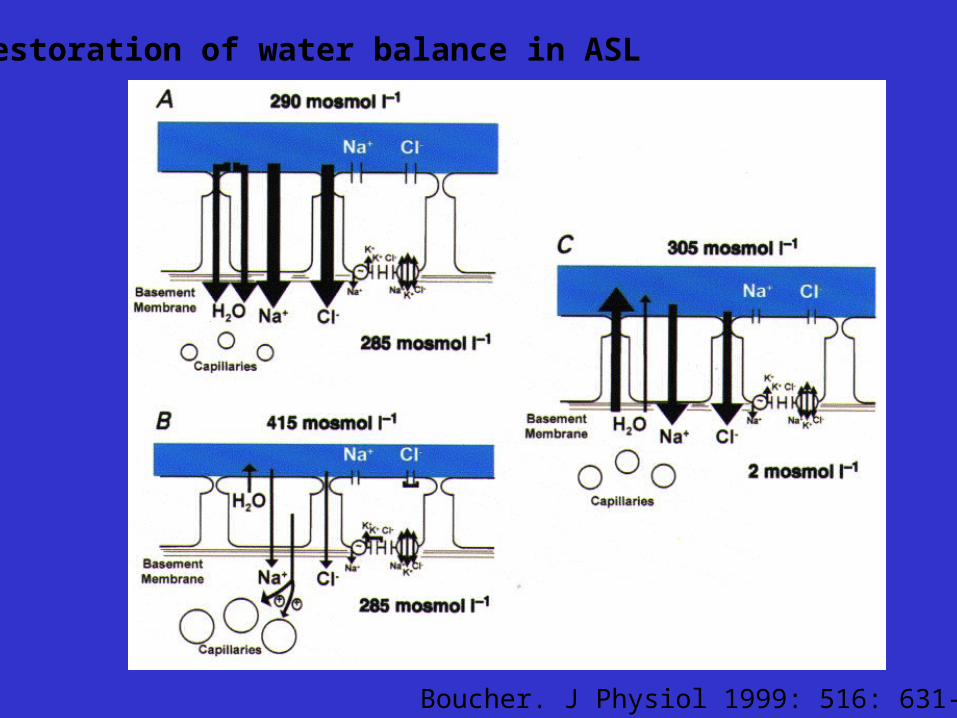
Restoration of water balance in ASL
Boucher. J Physiol 1999: 516: 631-8
Knowles & Boucher J Clin Invest 2002: 109: 571-7
AirwayEpithelialCulture
good/badindicatorof clearanceeffectivenessin real life ?
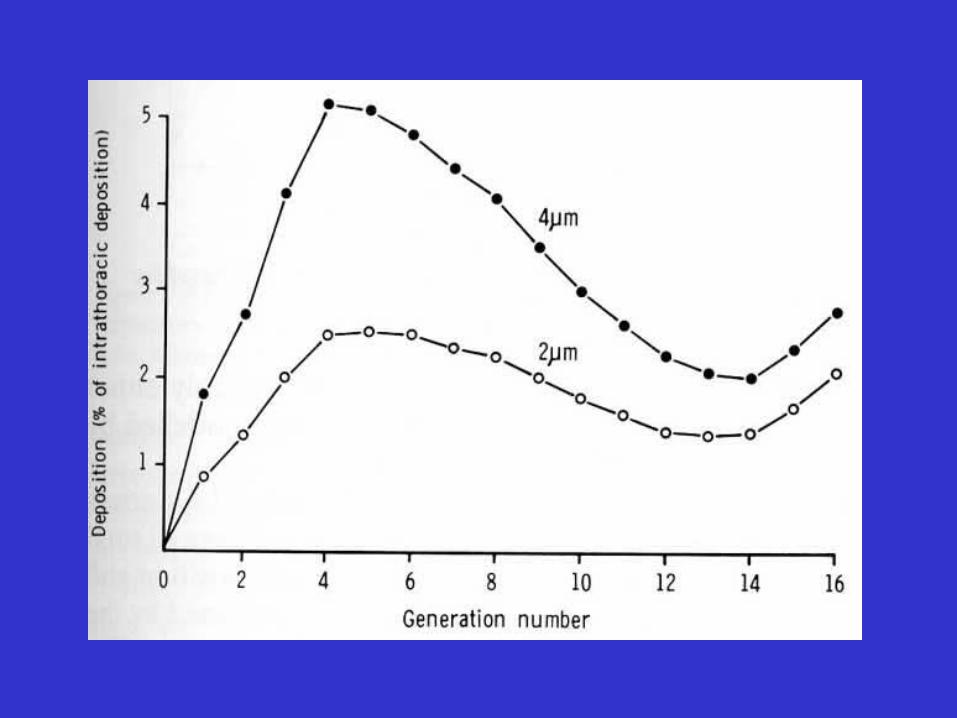

Clearance measurements dependon deposition distribution
Pavia 1985

ICRP 66based on Burri & Weibel 1973
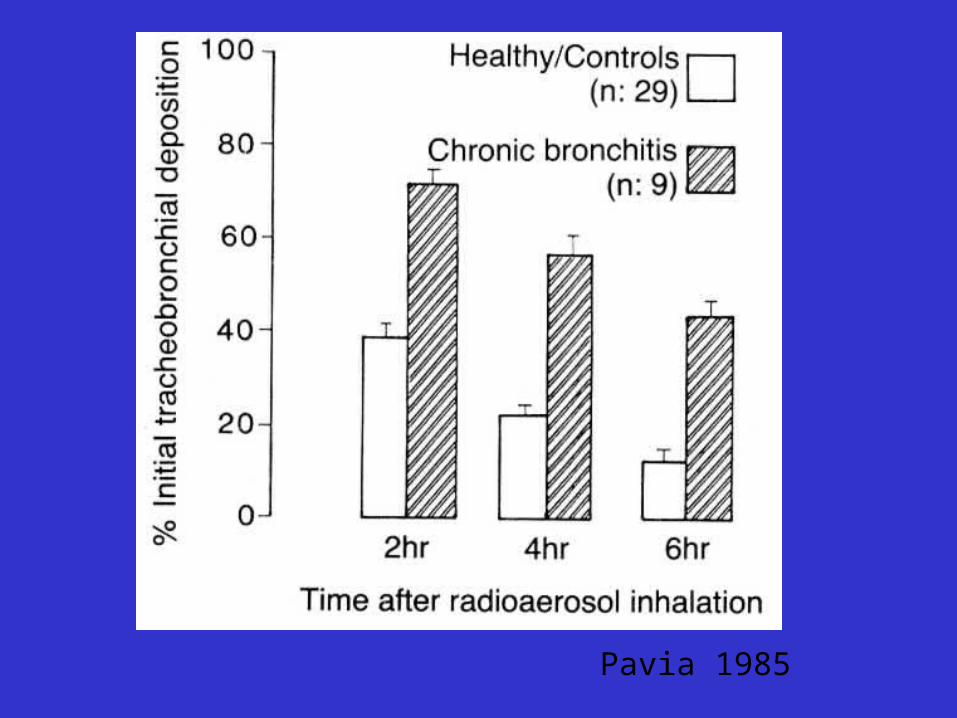
Pavia 1985
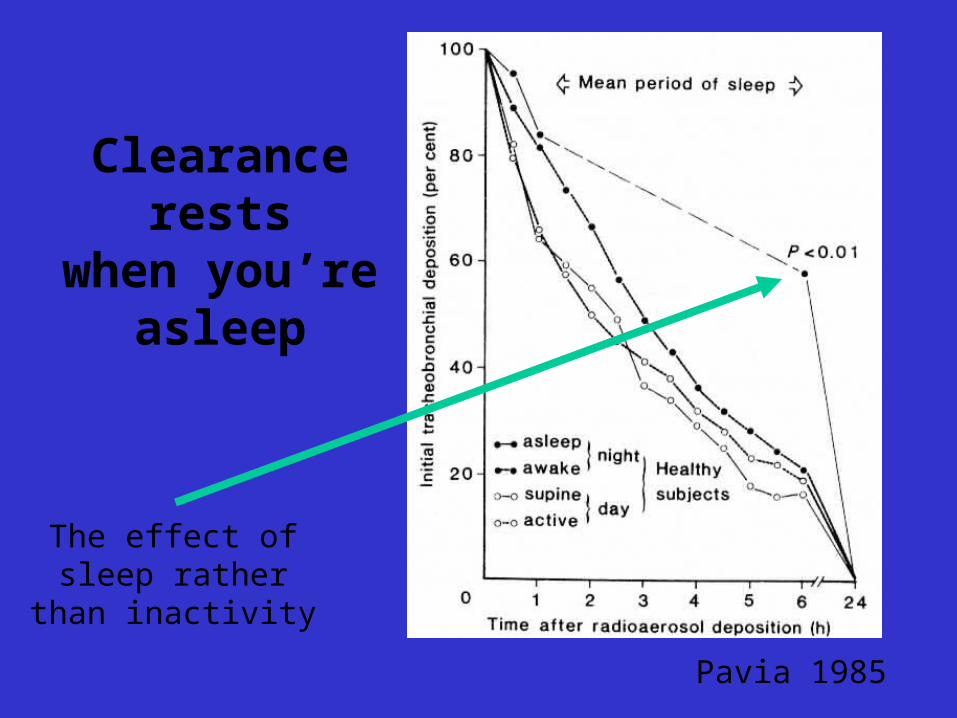
Pavia 1985
Pavia 1985
Clearance restswhen you’re
asleep
The effect ofsleep rather
than inactivity
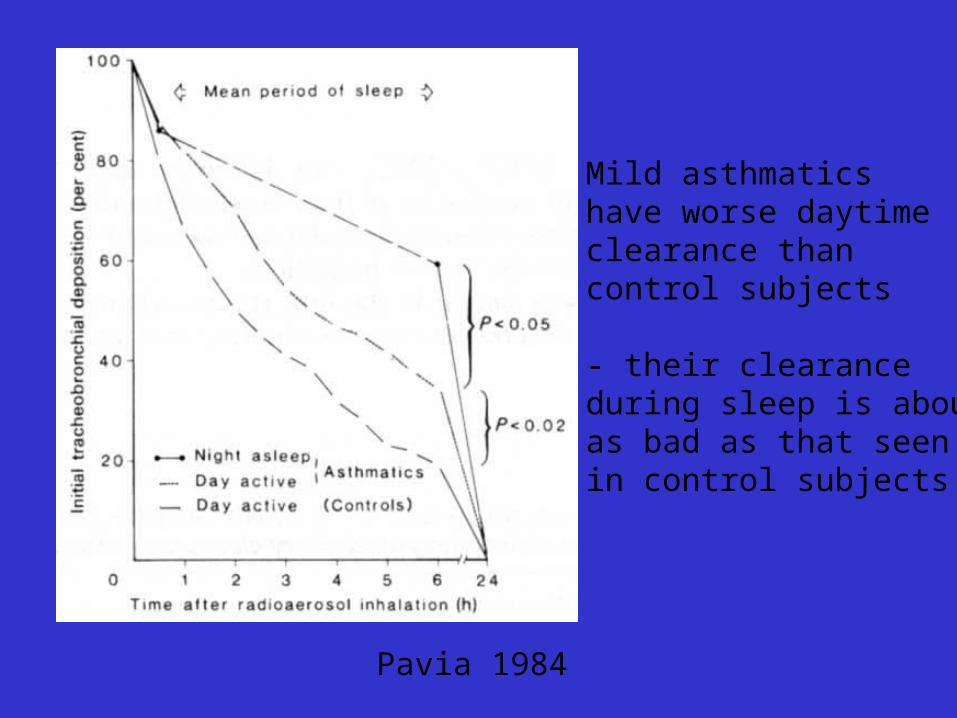
Pavia 1984
Mild asthmaticshave worse daytimeclearance thancontrol subjects
- their clearance during sleep is aboutas bad as that seenin control subjects
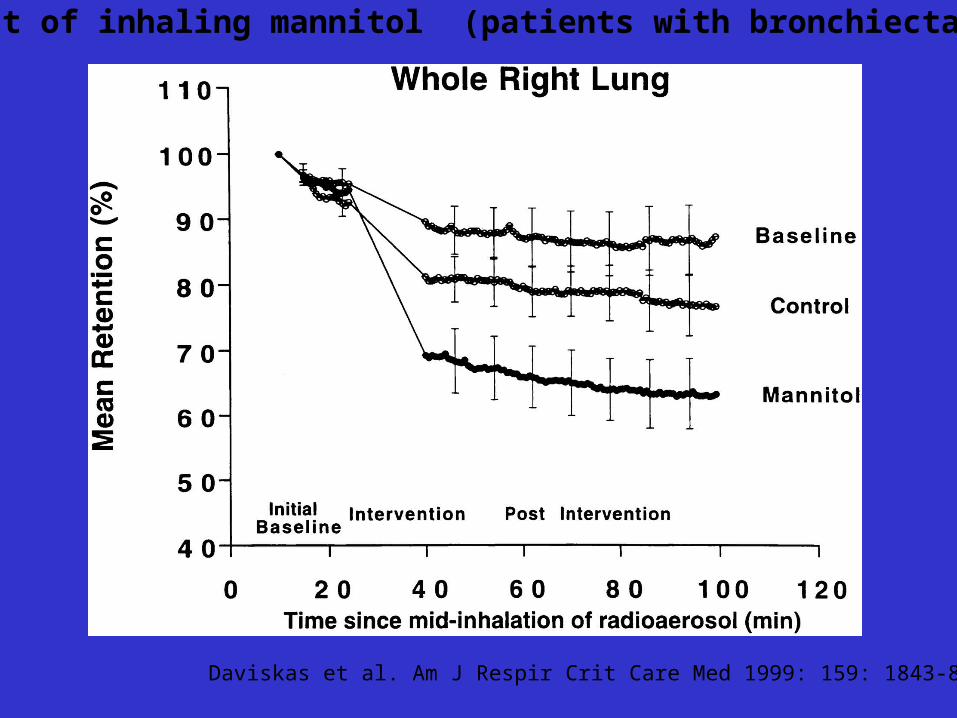
Effect of inhaling mannitol (patients with bronchiectasis)
Daviskas et al. Am J Respir Crit Care Med 1999: 159: 1843-8
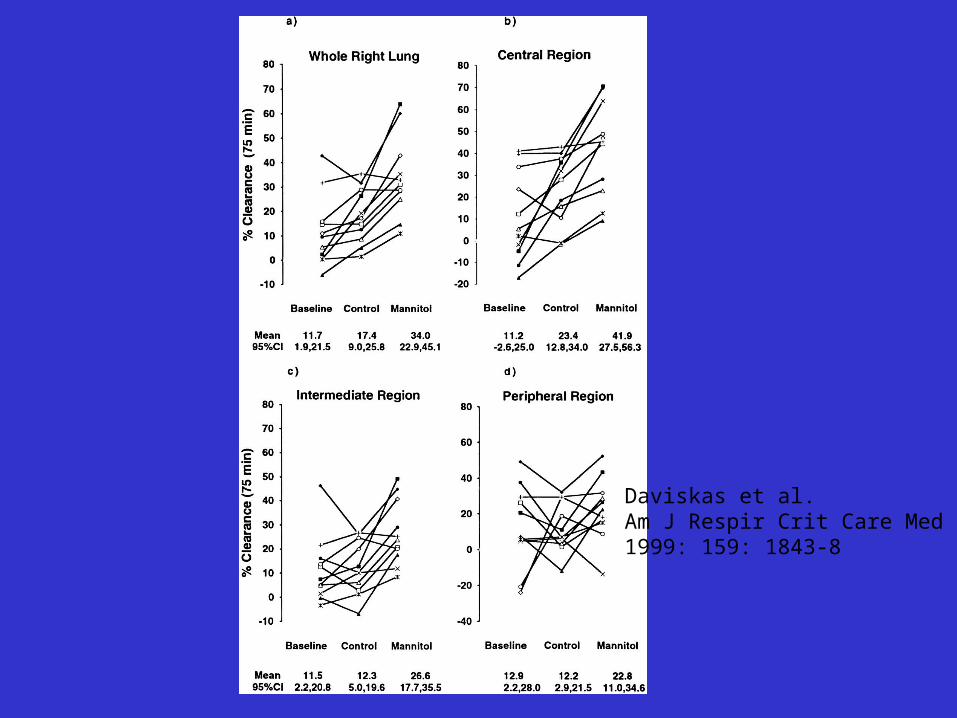
Daviskas et al. Am J Respir Crit Care Med 1999: 159: 1843-8
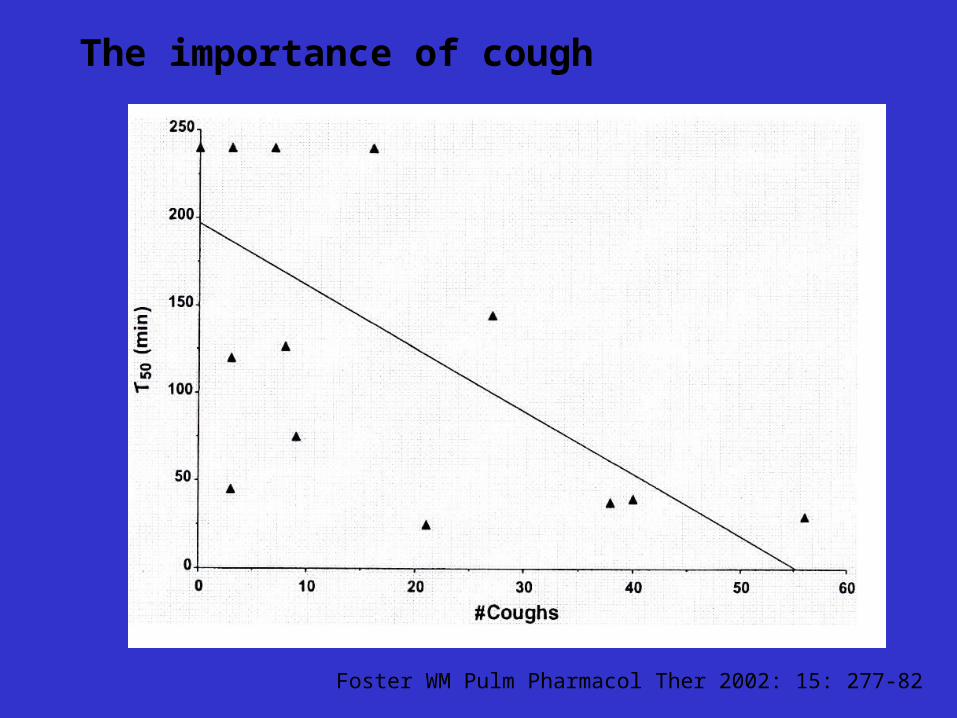
The importance of cough
Foster WM Pulm Pharmacol Ther 2002: 15: 277-82
0
20
40
60
80
100
0 2 4 6
Whole Lung"Background"
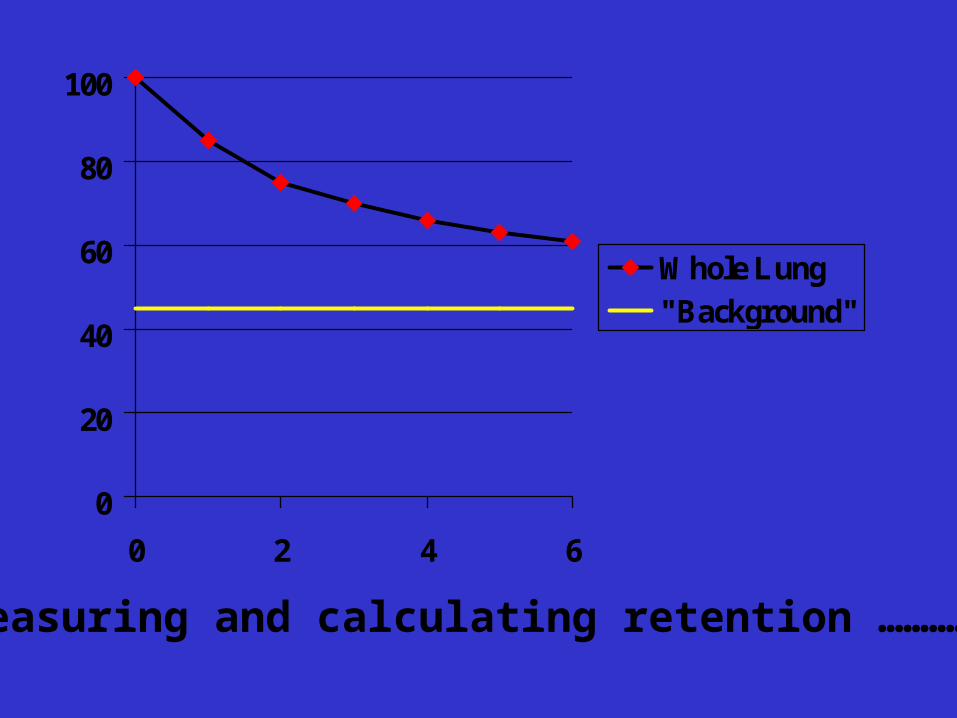
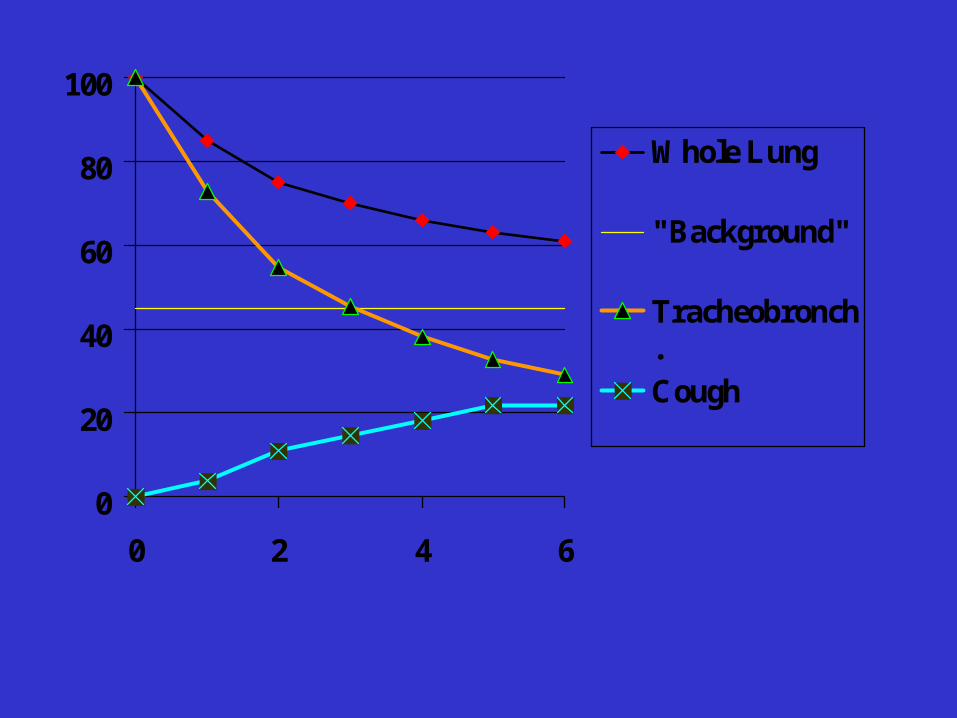
Measuring and calculating retention …………..

0
20
40
60
80
100
0 2 4 6
Whole Lung
"Background"
Tracheobronch.
0
20
40
60
80
100
0 2 4 6
Whole Lung
"Background"
Tracheobronch.Cough
0
20
40
60
80
100
0 2 4 6
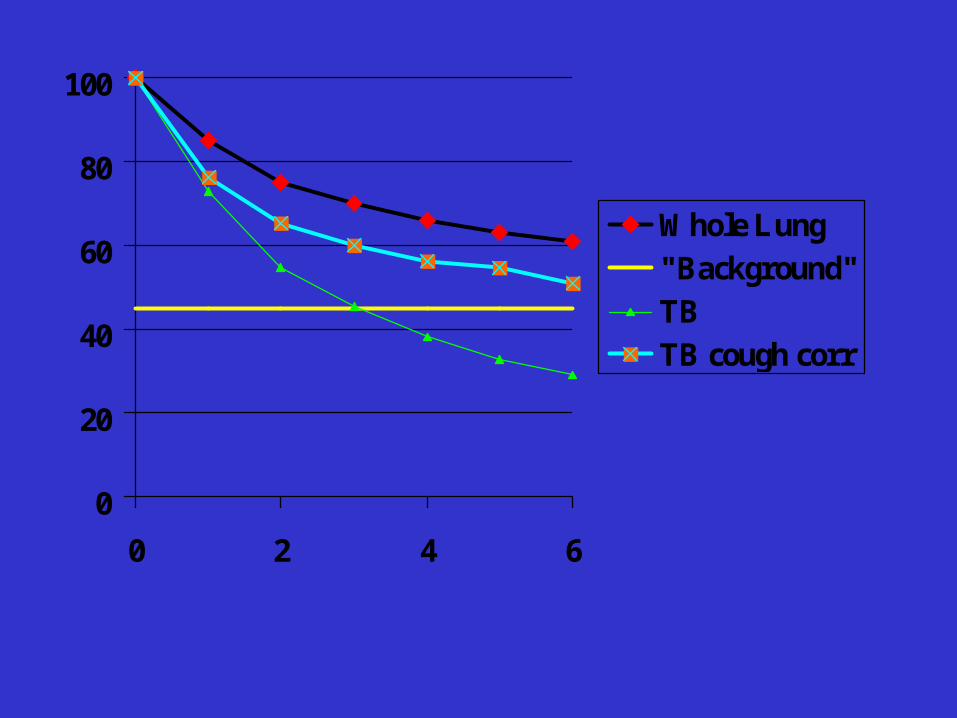
Whole Lung"Background"TBTB cough corr
0
20
40
60
80
100
0 2 4 6
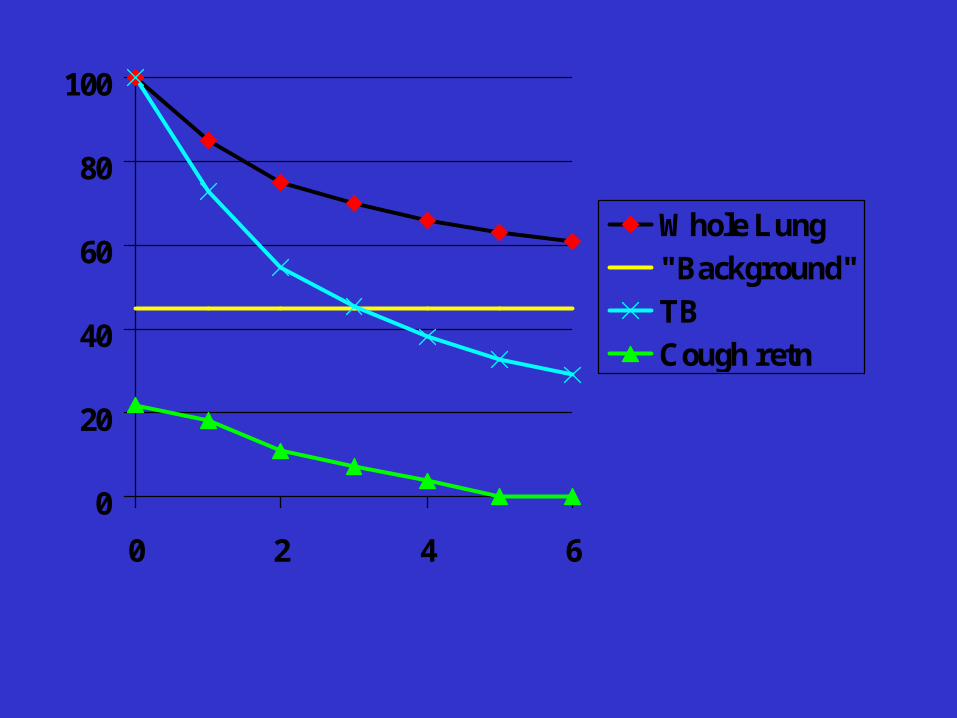
Whole Lung"Background"TBCough retn

0
20
40
60
80
100
0 2 4 6
Whole Lung"Background"TBCough retnTB cough corr
34
0
.349
.122
.094
89.022
Count
Num. Missing
R
R Squared
Adjusted R Squared
RMS Residual
Regression SummaryDeltaAUC vs. DeltaAD
1 35151.886 35151.886 4.436 .0431
32 253597.055 7924.908
33 288748.941
DF Sum of Squares Mean Square F-Value P-Value
Regression
Residual
Total
ANOVA TableDeltaAUC vs. DeltaAD
-26.082 15.842 -26.082 -1.646 .1095
4.265 2.025 .349 2.106 .0431
Coeff icient Std. Error Std. Coeff. t-Value P-Value
Intercept
DeltaAD
Regression CoefficientsDeltaAUC vs. DeltaAD
-350
-300
-250
-200
-150
-100
-50
0
50
100
150D
elta
AU
C
-15 -10 -5 0 5 10 15 20 25 30DeltaAD
Y = -26.082 + 4.265 * X; R^2 = .122
Regression Plot
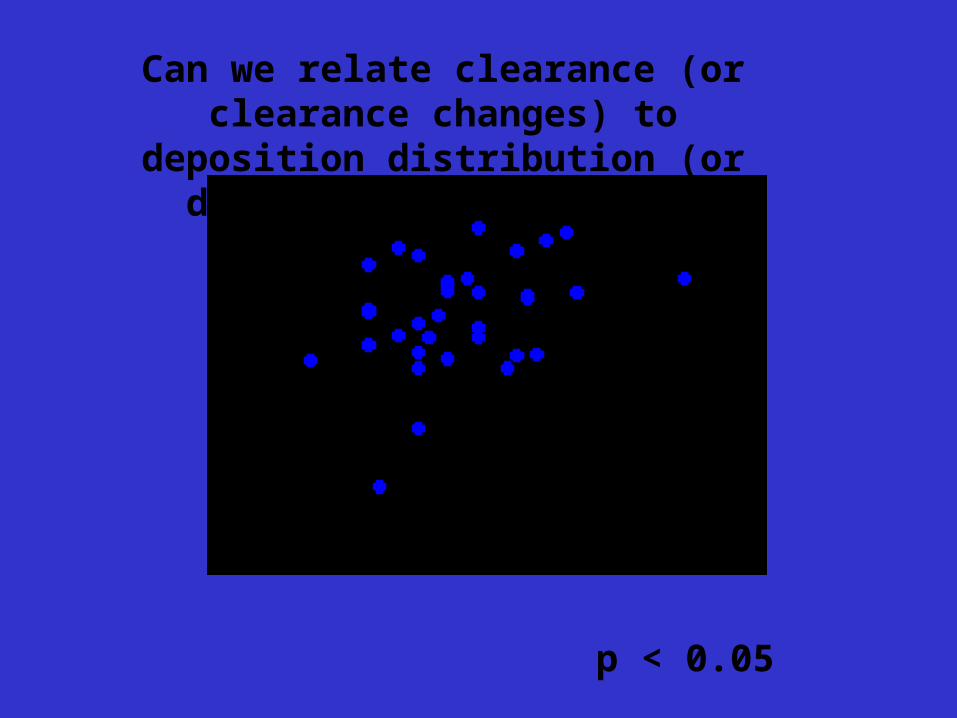
Can we relate clearance (or clearance changes) todeposition distribution (or distribution changes) ?
p < 0.05

-60
-40
-20
0
20
40
60
AU
Cdb
-40 -30 -20 -10 0 10 20 30 40 50R48db
Y = -5.77 + .383 * X; R^2 = .129
Regression Plot
-60
-40
-20
0
20
40
60
AU
Cdb
-60 -40 -20 0 20 40 60PEFRdb
Y = -2.434 - .322 * X; R^2 = .068
Regression Plot
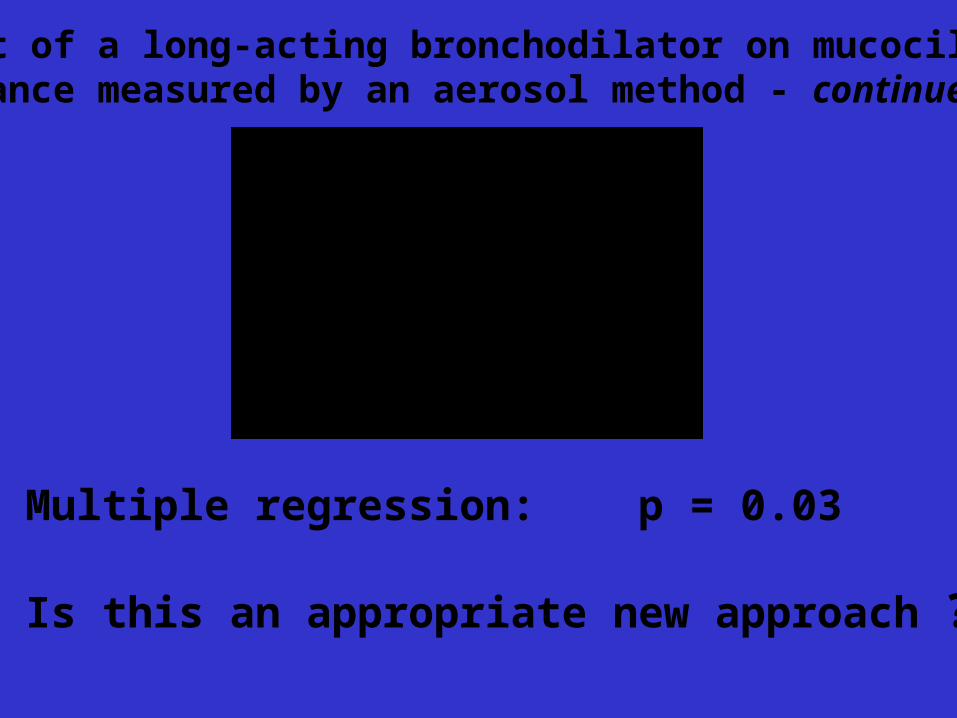
Effect of a long-acting bronchodilator on mucociliaryclearance measured by an aerosol method
Change in retention
Change in “R48” Change in PEFR
p = 0.06 p = 0.18
2 3705.352 1852.676 4.057 .0298
25 11415.274 456.611
27 15120.625
DF Sum of Squares Mean Square F-Value P-Value
Regression
Residual
Total
ANOVA TableAUCdb vs. 2 Independents
-3.709 4.241 -3.709 -.875 .3901
.459 .189 .430 2.424 .0229
-.431 .220 -.348 -1.960 .0613
Coeff icient Std. Error Std. Coeff. t-Value P-Value
Intercept
R48db
PEFRdb
Regression CoefficientsAUCdb vs. 2 Independents
Effect of a long-acting bronchodilator on mucociliaryclearance measured by an aerosol method - continued
Multiple regression: p = 0.03
Is this an appropriate new approach ?
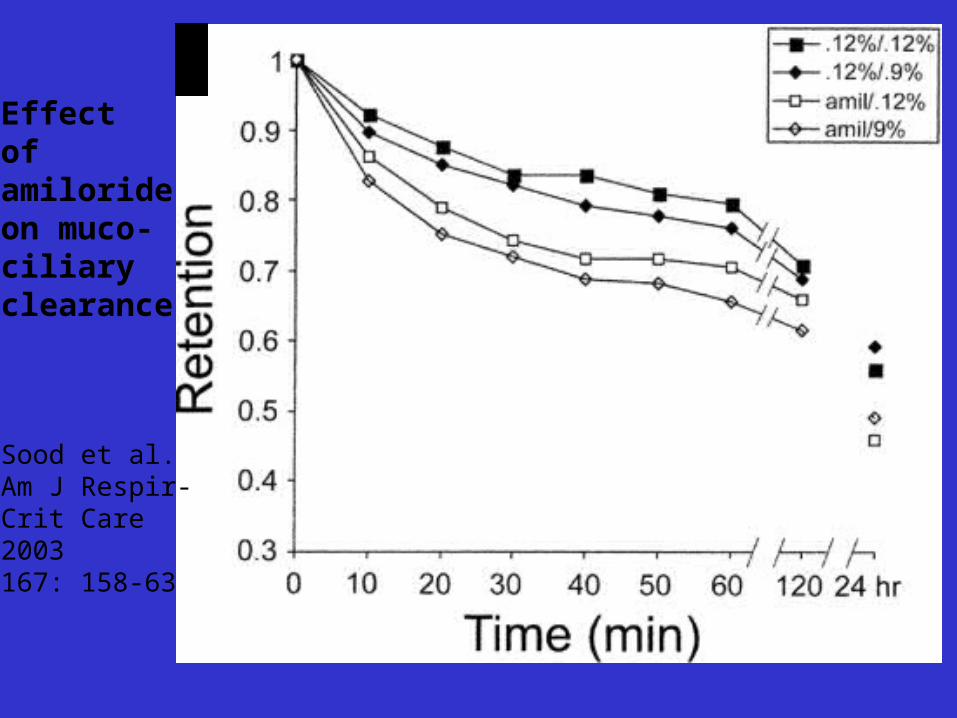
Effectofamilorideon muco-ciliaryclearance
Sood et al.Am J Respir-Crit Care2003167: 158-63


1
10
100
Asthma
Normal
Transit times through the bronchioles
10
100
1000
10000T
ran
sit
tim
e (m
in)
8 10 12 14 16
Generation No.
Lee et al. '79
NCRP '97
0
.2
.4
.6
.8
1
0 20 40 60 80 1000
.2
.4
.6
.8
1
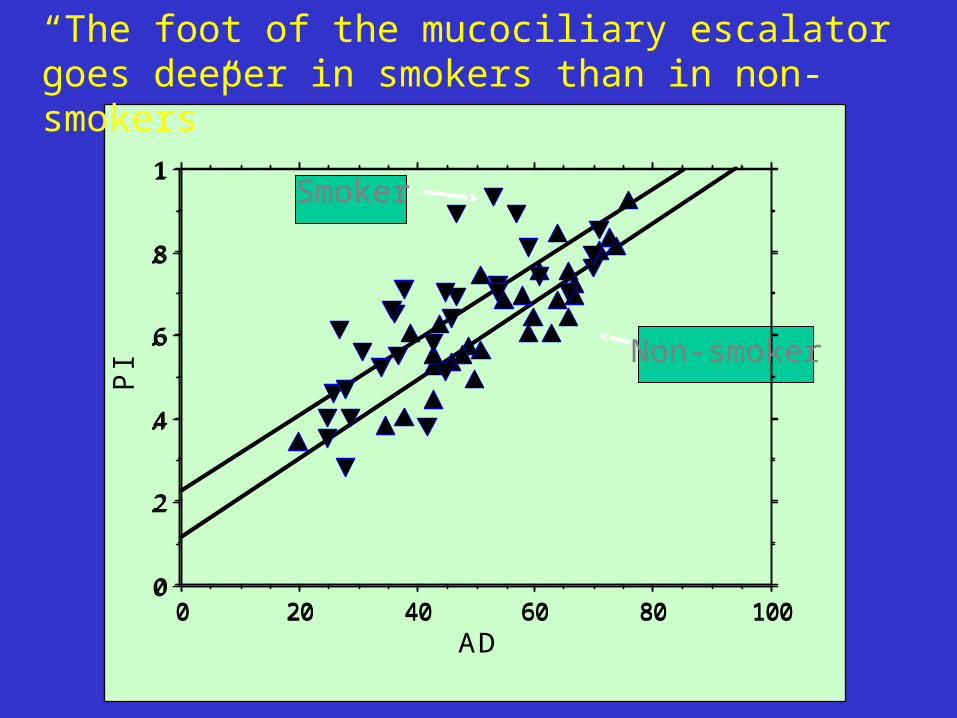
PI
0 20 40 60 80 100AD
Smoker
Non-smoker
“The foot of the mucociliary escalator goes deeper in smokers than in non-smokers”
0
2
4
6
8
10
12
14
16
18
Intermediate Zone Outer Zone
Control FET
Control FET
Tracheobronchial Clearance - intermediate and outer zones
Mean SEM%
19 patientswith mucushypersecretionHasani et al. 1994


Clearance - Mucociliary / Cough
Whole Lung / Tracheobronchial
Cough-corrected ( ? how)
Dependence on Deposition Distribution
Mucus / Salt and Water
Effects of Medication / Physiotherapy