Embed Size (px)
Citation preview

Tracerco Diagnostics™FCCU Study

Johnson Matthey is an international specialty chemicalscompany that is focused on the development of valueadded, high technology products and services.
The Johnson Matthey Process Technologies division is aglobal supplier of catalysts and additives, licensingtechnologies and process diagnostic services related to thepetrochemical, syngas, oil refining, and gas processingindustries.
Within Process Technologies our focus is to improve theprofitability, energy efficiency and environmental performanceof customers’processes through hydrogen catalysts,purification solutions, hydroprocessing catalysts, fluid catalyticcracking (FCC) additives and addition systems, and processoptimization and diagnostic services. Johnson Mattheycatalysts, additives, and process diagnostics are brought tothe market through a range of well-known brands; thisincludes TRACERCO™, INTERCATJM™, KATALCOJM™,PURASPECJM™, and CATACELJM™.
INTERCATJM - FCC Additives and addition systemsINTERCATJM FCC additives are used in refinery FCC’sglobally to tailor the selectivity of the FCC, boost LPG yield atthe expense of LCO and HCO, decrease bottom yields, andreduce regenerator SOx, NOx and CO emissions. JohnsonMatthey’s patented INTERCATJM addition systems allowrefiners to accurately and reliably add either fresh catalyst oradditives to the FCC unit on a near continuous basis. Oursystems are proven to reduce FCC additive and catalystusage, improve FCC profitability through yield improvements,
reduce maintenance costs, and simplify the negotiation of finalFCC emission limits through data compilation and verificationof testing results.
KATALCOJM - hydrogen production catalyst and servicesKATALCOJM catalysts for use in on-purpose hydrogenmanufacture ensure an efficient and reliable hydrogenfeedstock to the refinery. KATALCO PERFORMANCEJM
offers a unique range of hydrogen related services that rangefrom process optimization to asset improvement.
CATACELJM SSR- Reaction technologyCATACELJM SSR, stackable structural reactors made from aspecial grade of high temperature stainless steel foil coatedwith reforming catalyst, offer high performance heatexchanging catalyst technology solutions for the steamreforming process for the production of hydrogen.
PURASPECJM - Impurity removal systemsPURASPECJM absorbents and process technologiesspecifically designed to remove undesired impurities such aschloride, mercury, sulphur, and arsenic from hydrocarbonstreams in both gas and liquid duties.
TRACERCO™ - Online diagnostic studies to help improvethe performance of all major components of FCC units.
Tracerco Diagnostics™ FCCU study utilizes diagnosticcapabilities with both sealed source and tracer technologies tomeasure density profiles within vessels as well as the velocity,distribution and residence time of the catalyst or vapor phasethrough any part of the system. This includes testing todetermine the efficiency of riser termination devices, cyclonesor distribution devices.
Meet Johnson Matthey Process Technologies
2
www.JMProtech.com
purification solutions SSR (stackable structuralreactor) reaction technology
catalysts for hydrogenproduction
FCC additives and addition systems
specialist measurement and diagnostic services

Tracerco Diagnostics™FCCU Study
3
Reactor
Cyclone Operation and Distribution Study
Catalyst Bed Level Measurement
Efficiency of Riser Termination Device
Residence Time
Spent Catalyst & RegeneratedCatalyst Standpipes
Catalyst Slugging Study
Catalyst Density Profile
Regenerator
Cyclone Operation
Cyclone Distribution Study
Catalyst Bed Level Measurementand Extent of Bed Dilute - Phase
Catalyst and Air Distribution Study
Residence Time
Stripping Section
Density Profile
Catalyst and VaporFlow Distribution &Residence Time
Reactor Riser
Riser Density Profile
Catalyst and VaporDistribution
Catalyst and VaporVelocities (Slip Ratio)
The Fluidized Catalytic Cracking Unit (FCCU) is the economicheart of a modern refinery. Even small increases in its yield can bring about significant overall gains inproductivity and revenue.
Tracerco is a world leading industrial technology company
providing unique and specialized detection, diagnostic
and measurement solutions.
A Tracerco Diagnostics™ FCCU Study will provide you withthe information you need to optimize or troubleshoot yourspecific process:
� All testing is performed while the FCCU is online.
� There is no interference with normal unit operations orproduction scheduling.
� Data collected can be used to identify operating parameterchanges to improve unit productivity or gauge the accuracyof process modeling and simulation.
� Tracerco’s experience involves numerous studiesperformed on units worldwide.
A typical study may employ upwards of 75 detectors,measuring almost the entire system from a common injectionpoint. The tagged process stream can be followed completelythrough either the Reactor or the Regenerator.
For example, tracer material injected into the riser can provide:
� Catalyst and vapor traffic velocities and slip ratio throughthe riser
� Determination of efficiency of the riser termination device
� Flow distribution through the reactor and stripper
� Cyclone distribution/operating characteristics
� Reactor/stripper residence times
Vapor traffic is tagged using an inert gas. The catalyst trafficmay be tagged using system native catalyst – E-Cat, Fines, orany specific particle size distribution – which has beenactivated by Tracerco.
Tracerco Diagnostics™ FCCU Studies utilize both sealedsource and tracer technologies. A typical study will use thesetechnologies to measure the density of the catalyst/vapormixture, and the velocity, distribution, and residence time ofthe catalyst and vapor through each part of the FCC including:
� Reactor Riser
� Reactor
� Reactor Stripping Section
� Regenerator
� Spent Catalyst & Regenerated Catalyst Standpipes
The operation of the associated downstream MainFractionator column can also be investigated using Tracerco’s TRU-SCAN® technology.
In order to offer our customers a rapid response we operatefrom a number of regional bases strategically close to majorindustrial centers.

Riser Density Profile: TRU-SCAN®
Poor fluidization or poor mixing of catalyst and oil causeslocalized variances in the oil-to-catalyst ratio and crackingreactions. The over-cracked portion of the feed generateslow-value light components, while at the same time theunder-cracked portion produces more residue.
A TRU-SCAN® of the riser provides the catalyst densityprofile up the length of the riser. Results illustrated inFigure 1 show the density profiles at high and low steamrates. In this example, the aerated catalyst density in theriser feed zone at scan elevation 13-18 ft. decreases withthe higher steam rate. The scan also indicated that thefeed expansion zone covered approximately 8 ft. from thefeed nozzles.
Catalyst and Vapor Distribution:ThruVision™ ScanThis method generates a detailed cross-sectional densityprofile of the reactor riser at a fixed elevation or riser cross section.
The information is used to determine the uniformity ofdistribution between the catalyst and feed and to identifyflow inefficiencies, such as catalyst mal-distribution. A ThruVision™ Scan is often used to evaluate changes indesign and operation of feed injection or lift steam nozzles.An example of this is shown in Figure 2, where two ThruVision™ Scans were performed, one with all six feednozzles open and another with one of the nozzles shut(nozzle #3) to simulate a plugged or fouled nozzle.
Reactor Riser: ScanningDensity Profile and Flow Distribution
Gamma Source
Radiation Detector
Feed
Catalyst Particles
Feed
TRU-SCAN® of FCC Riser
Figure 1: TRU-SCAN® detector placement and density profile. Figure 2: ThruVision™ Scan simulated plugged nozzle.
ThruVision™ Scan scanline orientation.
4

One common application applied to an FCCU ismeasurement of stream velocities. Ideally, catalyst andvapor should be in plug flow condition to eliminate back-mixing, which can produce undesirable secondaryreactions. However, because of its greater density, thecatalyst always flows up the riser at a lower velocity thanthe vapor. This phenomenon is known as “catalyst slip”.An ideal plug flow riser should have a slip ratio of 1.0.
Discrepancy from 1.0 or design expectation is often used as a measure of the fluidization performance. The slip factor can be determined by measuring thevelocities of the vapor and catalyst via a TracercoDiagnostics™ Flow study. Figure 4 represents test resultsthat involve two tracer injections, one for the oil vaporphase and the other for the catalyst phase. The velocitiesof the vapor phase and catalyst phase are measured overthe same section of the riser.
Reactor Riser: Tracer
TO FRACTIONATOR
REAC
TOR
RISE
R
Radiation DetectorNumber 2
Radiation DetectorNumber 1
RadiotaggedFeedCatalyst
Distance X
Pulsed Injection
Injection DetectorRiser DetectorInjection DetectorRiser Detector
Catalyst Slip Factor = 1.8042.2 ft/s 23.5 ft/s
-5 5 15 25Time In Seconds
Radi
atio
n In
tens
ity
Figure 3: Riser trafficvelocity tracer testdetector positions.
Flowrate of Catalyst and Vapor Phases
Figure 4: Riser traffic velocity.
5

Cyclone Operation: TRU-SCAN®
The loss of catalyst through the reactor cyclones is a fairlycommon problem. Identifying the reason for the loss isoften difficult. TRU-SCAN® gamma scans can be apowerful tool for gathering essential information about theproblem. In Figure 5, four TRU-SCAN® gamma scanswere performed to obtain a density profile of each reactorcyclone. The scans identified that there was one pluggedcyclone and a dipleg that was full of catalyst.
Catalyst Bed Level MeasurementTRU-SCAN® gamma scans can be performed to obtaininformation on the reactor or regenerator bed levels. In the example below, operations personnel were suspiciousof the calibration of the level gauge. Results from the threescans performed (Figure 6) found that when the instrumentreading was 100" pressure (the normal level reading untilrecently), the bed was too low and the diplegs wereuncovered. The TRU-SCAN® results helped recalibrate thelevel instrument and avoid a shutdown.
Reactor: Scanning
West Secondary CycloneSouth Primary Cyclone
East Secondary CycloneNorth Primary Cyclone
1000 10000
Plugged Cyclone Dipleg
BRACING
MANWAY
FLAPPER VALVE
2'
4'
6'
8'
10'
12'
14'
16'
18'
20'
22'
24'
26'
28'
30'
Catalyst
EXTERNAL LINING
N
Figure 6: TRU-SCAN® results assist with level instrument calibration.Figure 5: Reactor cyclones distribution study.
Flooded Cyclones @ 125" PressureUnsealed Diplegs @ 100" PressureNormal Operations @ 112" Pressure
100 1000
BRACING
CYCL
ONES
BRACING
2'
4'
6'
8'
10'
12'
14'
16'
18'
20'
22'
24'
26'
28'
30'
32'
SECONDARY CYCLONE DIPLEGS
FREEBOARD INTENSITY
PRIMARY CYCLONE DIPLEGS
6

Cyclone Distribution StudySince FCCU’s have been modified to achieve thecracking reaction in the riser instead of the reactor, the reactor’s present-day role is to minimize post riserreactions by providing efficient catalyst/hydrocarbondisengagement.
A Tracerco Diagnostics™ Distribution study is used to determine relative amounts of vapor or catalyst trafficentering the primary reactor cyclones. A group ofradiation detectors are placed at the cyclone inlets andoutlets (Figure 7). Usually only the primary cyclone inletand the secondary cyclone outlets can be monitored,because the cyclone pairs are internally coupled. For anormal cyclone system, each of the primary cyclonesshould receive the same amount of vapor and catalysttraffic, so all of the detectors should receive the sameamount of tracer radiation response. Comparing theintegration of the areas beneath each of the distributiondetector responses allows identification of flow mal-distribution (Figure 8).
Reactor: Tracer
Outlet Detector
Secondary Cyclone OutletRing of Detectors
Primary Cyclone InletRing of Detectors
Bed LevelRing of Detectors
6 Detectors ateach elevation
Injection Detector
Vapor Distribution at Cyclone Inlets
Time (seconds)
Rad
iatio
n In
tens
ity
Figure 8: The Tracerco Diagnostics™ Distribution study illustrated is an example of a typical distribution profile exhibiting mal-distribution at theReactor cyclone inlets.
Figure 7: Illustrated above is a typical set-up showing the placement ofradiation detectors used in a Tracerco Diagnostics™ Distribution study.
7

Density ProfileThe Spent Catalyst Stripper is designed to preventhydrocarbon from being carried from the reactor to theregenerator with the catalyst. Steam is injected countercurrent to the flow of catalyst to strip the hydrocarbonadsorbed onto the catalyst.
A Tru-Grid™ Scan of the reactor stripping section canidentify differences in the density of the aerated catalyst toshow:
� If maldistribution of the stripping steam is occuring.
� If excessive catalyst hold-up is occuring on any of the trays.
� Whether or not the trays are in place.
In a Tru-Grid™ Scan, four scans are performed through thestripper in an orthogonal grid pattern (Figure 9).
When the results of the four scans are overlaid on a singleplot (Figure 10), areas where the scan results do not overlayare areas of the stripper where the aerated catalyst densityis different. The absence of low density areas under eachtray is an indication of flooded trays.
Stripping Section: Scanning
West ScanlineNorth Scanline
100 1000 10000
MANWAY
STEAM NOZZLES
BOTTOM TANGENT
MANWAY
Tray 5
2'
4'
6'
8'
10'
12'
14'
16'
East ScanlineSouth Scanline
Tray 3
Tray 1
Figure 9: Tru-Grid™ Scan detector placement.
Figure 10: Response profiles.
8
In the stripping section, trays or packing, are installed toimprove the stripping efficiency. Steam/catalyst distributioncan be inferred from the Stripper Tru-Grid™ Scan resultspreviously described. However, if superficial velocities andmean residence times are to be measured, then the relativesteam/catalyst distribution can be measured using a tracerinjection technique. Uniform distribution of catalyst andsteam in the stripper is critical to achieve high strippingefficiency (less carry-down of the hydrocarbon productsfrom reactor to regenerator).
A Tracerco Diagnostics™ Distribution study of the strippingsection of an FCCU requires two groups of radiationdetectors (four or more detectors for each group), placedrespectively at the top and bottom of the stripper (Figure11). The steam and catalyst response profiles can be overlaid and interpreted for superficial velocity anddistribution (Figures 12 and 13).
Stripping Section: Tracer
18000
16000
14000
12000
10000
8000
6000
4000
2000
030 7050 90 190170150130110 230210 250 270 290 310 330
Catalyst Flow and Distribution in Stripper
T
Inte
nsity
North Top- 27%
East Top- 32%
South Top- 20%
West Top- 21%
North Bottom- 62%
East Bottom- 10%
South Bottom- 20%
West Bottom- 7%
Figure 11: Detector placement.
Figure 12: Catalyst flow and distribution.
900
800
700
600
500
400
300
200
100
070 75 80 85 90 95 100 105 110 115 120 125 130
Time (seconds)
Inten
sity
North Top- 28%
East Top- 34%
South Top- 18%
West Top- 20%
North Bottom- 19%
East Bottom- 20%
South Bottom- 25%
West Bottom- 36%
Figure 13: Steam distribution.
Figure 12 and 13: Study of the catalyst and steam flow requires two tracers injected separately, one for tracing the catalyst and one for tracing the steam.
Catalyst/Vapor Flow Distribution
9

Catalyst Bed Level MeasurementThe dense bed level elevation in a Regenerator can bedetermined with the sealed source TRU-SCAN® and Tru-Grid™ Scan technology (Figure 14). The TRU-SCAN®
will produce a density profile at the catalyst bed level areathat will indicate dense phase and dilute phase levels. It canbe performed over varying operational conditions to assessthe changes in level and help calibrate level control.
By using four scan lines in a grid arrangement (Figure 14), a more accurate indication of the Regenerator’s catalyst bed level can be determined. Overlaying the four scan lineswill identify the dense and dilute phase catalyst levels anddetermine if the levels are uneven which may be indicativeof air mal-distribution and air grid problems (Figure 15).
Cyclone Density StudyAs with Reactor Cyclones, a TRU-SCAN® can beperformed on each Regenerator Cyclone to search forhigh catalyst levels in diplegs or plugged Cyclones that will explain high catalyst loss.
Regenerator: Scanning
Northwest ScanlineSouthwest Scanline
100
FCC REGENERATORDate 10:32 - 12:22 X-Axis: 50 - 20000
1000 10000
Cyclones
Upper Set of Detectors
Bracing Level B
DenseCatalyst
Manway
Lower Set of Detectors
(Top Tangent)
Weld
Bracing Level C
Primary Dipleg Valve ElevationSecondary Depleg Valve Elevation (Bottom Tangent)
Dilute PhaseCatalyst
2'
4'
6'
8'
10'
12'
14'
16'
18'
20'
22'
24'
26'
28'
30'
32'
34'
36'
Southeast ScanlineNortheast Scanline
Figure 15: Tru-Grid™ Scan results to determine the Regenerator catalystbed level.
Figure 14: Illustration of a Tru-Grid™ Scan orientation used on aRegenerator.
10
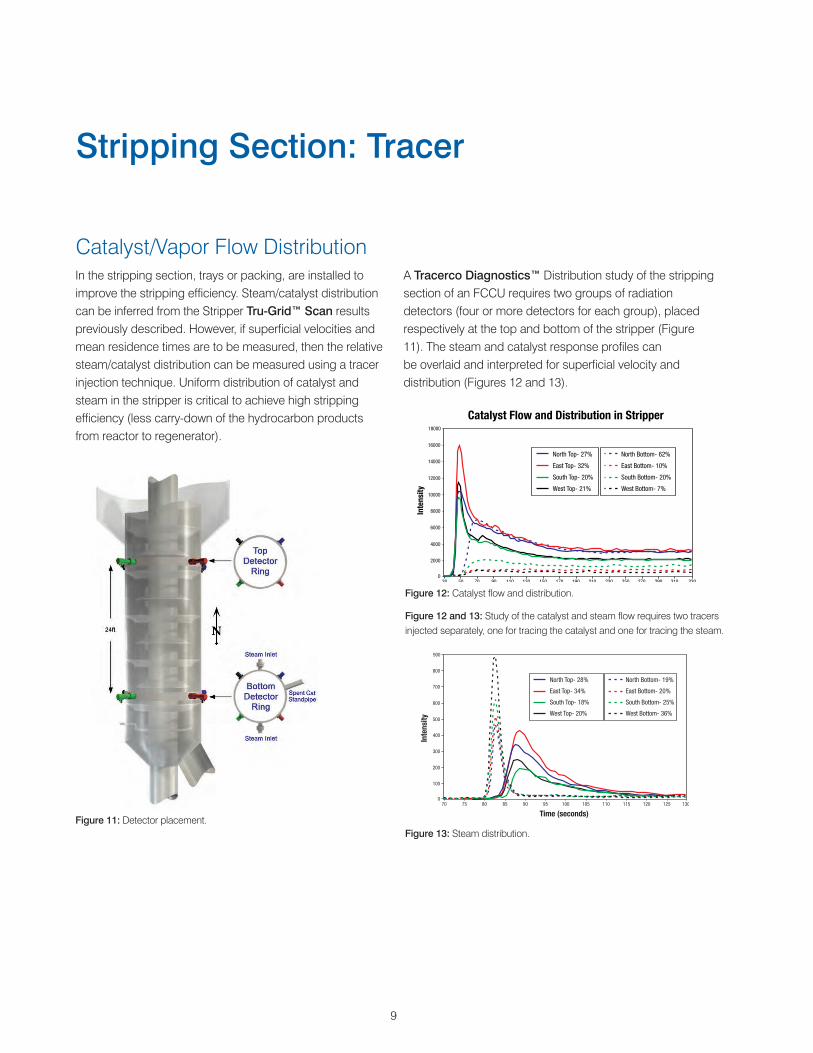
Air Flow and Distribution StudyA Tracerco Diagnostics™ Flow study can measure severalflow parameters around the Regenerator with a singleinjection of radiotracer. For example, both the air rate and flue gas rate can be determined simultaneouslywith a study of the air distribution from the air grid and/or the vapor distribution to the cyclones.
This is accomplished by placing a group of detectors at a known distance apart on the air supply line to theRegenerator and another set on the flue gas line leaving theRegenerator (Figure 16). The flow rates will be calculated byconverting the measured velocities to volumetric flow withrespect to line diameter, process pressure and temperature.
Figures 17 and 18 illustrate vapor distribution test resultsfrom when eight detectors were positioned near the eightprimary cyclone inlets (Figure 17) and twelve detectors werepositioned in a ring just above the upper air ring (Figure 18).Test results showed that some detectors had much largerresponses than others, indicating mal-distribution.
Regenerator: Tracer
Y1: N CycloneY1: S CycloneY1: Overhead Line
200
150RADIATION
INTENSITY
TIME (seconds)
100
50
0470 480 490 500 510 520 530 540 550 560
Y1: NE CycloneY1: SW Cyclone
Y1: E CycloneY1: W Cyclone
Y1: SE CycloneY1: NW Cyclone
N CycloneNE Cyclone
E CycloneSE Cyclone
S CycloneSW Cyclone
W CycloneNW Cyclone
30.8%23.6%
6.9%2.5%3.7%3.4%5.0%
24.1%
PercentArea
Position
Y1: Air 1Y1: Air 5Y1: Air 10
220
200
180
160
140
120
100
80
60
40
20
RADIATION
INTENSITY
TIME (seconds)
0135 145 155 165 175 185 195 205
Y1: Air 2Y1: Air 6Y1: Air 11
Y1: Air 3Y1: Air 7Y1: Air 12
Y1: Air 4Y1: Air 9Y1: Overhead Line
Air 1Air 2Air 3Air 4Air 5Air 6Air 7Air 8Air 9
Air 10Air 11Air 12
14.4%13.4%
4.0%6.0%
10.5%5.3%7.4%
10.6%5.3%
10.0%5.8%7.3%
PercentArea
Position
Figure 16: Detector placement.
Figure 17: Vapor distribution at cyclone inlets.
Figure 18: Vapor distribution above air grids.
11
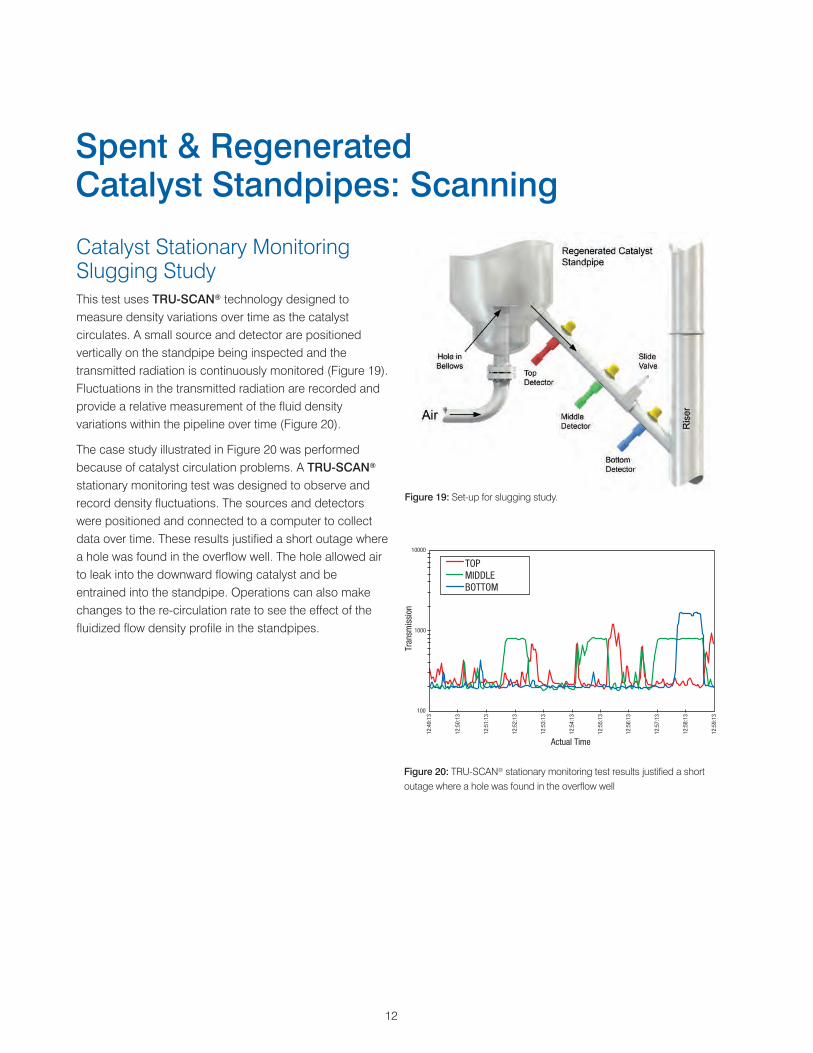
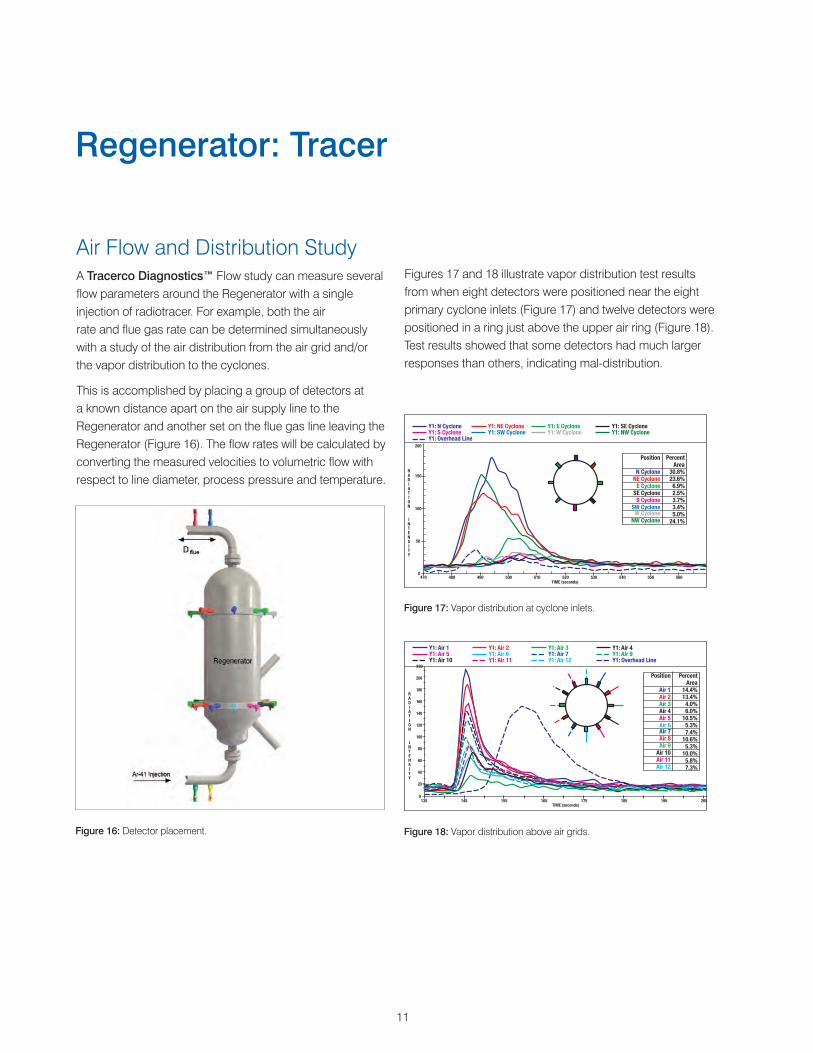
Catalyst Stationary MonitoringSlugging StudyThis test uses TRU-SCAN® technology designed tomeasure density variations over time as the catalystcirculates. A small source and detector are positionedvertically on the standpipe being inspected and thetransmitted radiation is continuously monitored (Figure 19).Fluctuations in the transmitted radiation are recorded andprovide a relative measurement of the fluid densityvariations within the pipeline over time (Figure 20).
The case study illustrated in Figure 20 was performedbecause of catalyst circulation problems. A TRU-SCAN®
stationary monitoring test was designed to observe andrecord density fluctuations. The sources and detectorswere positioned and connected to a computer to collectdata over time. These results justified a short outage wherea hole was found in the overflow well. The hole allowed airto leak into the downward flowing catalyst and beentrained into the standpipe. Operations can also makechanges to the re-circulation rate to see the effect of thefluidized flow density profile in the standpipes.
Spent & Regenerated Catalyst Standpipes: Scanning
Figure 20: TRU-SCAN® stationary monitoring test results justified a shortoutage where a hole was found in the overflow well
Actual Time
12:4
9:13
12:5
0:13
12:5
1:13
12:5
2:13
12:5
3:13
12:5
4:13
12:5
5:13
12:5
6:13
12:5
7:13
12:5
8:13
12:5
9:13
100
1000
10000
Tran
smis
sion
TOPMIDDLEBOTTOM
Figure 19: Set-up for slugging study.
12

Catalyst Density ProfileA TRU-SCAN® of the spent catalyst standpipe can beperformed to investigate the cause of circulationproblems. Scan results from two scans of a spent catstandpipe showed an increase in density in the standpipe,but the red scan (N-S vertical scan, Figure 21) showed anarea of very low density below the area of high density.This was theorized to be a blockage that caused thecatalyst to flow to one side of the standpipe, leaving thearea under the blockage clear of catalyst. With thisinformation, a shutdown was authorized and a large pieceof refractory was found to be causing the blockage.
Spent & Regenerated Catalyst Standpipes: Scanning
NW-SE Vertical1000
RingRing
Ring
Ring
Area of High Densityin Both Scans -Probable Blockage
Area of Lower thanNormal Density
Area of Much Lower thanNormal Density -Probably Void Space
5m
6m
7m
8m
9m
10m
11m
N-S Vertical
Figure 21: A TRU-SCAN® of the spent cat standpipe can be performed toinvestigate the cause of circulation problems.
13

Tracerco has provided gamma scanning services worldwideto evaluate trayed and packed towers to identify damage,fouling, flooding, mal-distribution and many other problemsthat can exist inside of the tower. This service is providedonline, externally to the column, with no interference tonormal plant operations. The ability to accurately determinewhat is happening inside the column, without having to shutit down for a visual inspection, effectively provides ourcustomers with ‘insight onsite’.
A Main Fractionator was not operating properly at normalcapacity and was showing symptoms of flooding from tray 2 (red curve, Figure 22). Tracerco’s TRU-SCAN® applicationpinpointed the location of flooding that was probably due tofouling (coking).
After the Main Fractionator was cleaned, a baseline scan(blue curve) was performed to use for future diagnosis ofcoking problems at an earlier stage before the floodingreached such a severe condition.
A scan a few months later (green curve) showed that Tray 2was again starting to show the same problem with cokingand the subsequent liquid hold-up and flooding. Using thisdata, plant operations and maintenance were able todetermine where the limitation in the column was occurringand prepare corrective action.
Main Fractionator Scan: TRU-SCAN®
Figure 22: TRU-SCAN® baseline and troubleshooting results providedoperations and maintenance personnel advance warnings of approachingproblems so they could prepare for corrective action.
14

Main Fractionator: Optimus™ BUG
Tracerco provides a range ofspecialist measurement solutions tothe process industry, measuring key parameters such as level, densityand interface. These instruments areall non-wetted devices, allowingthem to be used in the harshest ofprocess conditions such as hightemperatures, slurries and corrosive materials.
Optimus™ BUGThe Optimus™ BUG (Build-upGauge), provides real time measure-ments to FCC Main Frac towers tomeasure the bottom liquids level.The gauge is mounted externally on the tower for easyretrofit or new build installation. There are no movingparts, which eliminates the possibility of mechanicalfailure or fouling by debris such as coke.
The inaccurate measurement of a tower’s base liquidlevel is one of the most problematic causes of towermalfunctions. In an industry survey problems with the
tower base and reboiler return was the number 2 causeof tower malfunctions. Tracerco, relying on its developedexpertise in radiation detection instruments has a rangeof reliable nuclear instruments including liquid levelinstruments. If you have a particularly challenging ortroublesome base liquid measurement application,contact a Tracerco Technical Advisor in your area.
15

www.tracerco.com/processdiagnostics [email protected]
North American Headquarters:4106 New West DrivePasadena, TX 77507 USATel: 281 291 7769Fax: 281 291 7709Toll Free: 800 288 8970
Field Office Locations:Corpus Christi, TX 78408 USATel: 361 888 8233
Concord, CA 94520 USATel: 925 687 0900
Newark, DE 19702 USATel: 302 454 1109
Merrillville, IN 46410 USATel: 219 945 0400
Baton Rouge, LA 70820 USATel: 225 761 0621
West Valley City, UT 84119 USATel: 801 478 0736
Edmonton, AB, T6E 6A6 CANADATel: 780 469 0055
Calgary, AB, T2Y 2Z7 CANADATel: 403 931 6705
Sarnia, ON, N7S 5G5 CANADATel: 519 332 6160
Rio de Janerio, RJ, Brasil, CEP 22775-044Tel: +55 21 3535 7600
© 2016 Johnson Matthey Group
XM0075/0/E
TRACERCO is a trademark of the Johnson Matthey Group of companies.
Front cover image supplied by Praxis Technical Group www.praxistech.com
A worldwide network of agents and service partners enable Tracerco to deliver its products and services to ourcustomers anywhere in the world, while still retaining the important aspect of local service.
Tracerco’s operational offices across the world
Billingham, UKTel: +44 (0) 1642 375500
Brussels, BelgiumTel: +32 (0) 2 465 85 20
Villefontaine, FranceTel: +33 (0) 4 74 94 79 88
Milan, ItalyTel: +39 02 90989971
Bergen, NorwayTel: +47 55 36 55 40
Perth, AustraliaTel: +61 (0) 8 9209 3905
Rio de Janerio, RJ, BrasilTel: +55 (21) 3385 6800
Kuala Lumpur, MalaysiaTel: +603 7803 4622
Baku, AzerbaijanTel: +994 12 5141619
SingaporeTel: +65 6316 3626
Abu Dhabi, United Arab EmiratesTel: +971 (0) 2 554 1672
Muscat, OmanTel: +971 (0) 2 554 1672
Maharashtra, IndiaTel: +91 2227401427/428 Ext: 321