Embed Size (px)
Citation preview

Traceloop and BPFLinux Plumbers Conference | 2020.08.24https://linuxplumbersconf.org/event/7/contributions/667/
Hi, I’m AlbanAlban CrequyCo-Founder &Director of Kinvolk Labs, Kinvolk
Github: albanTwitter: @albcrEmail: [email protected]

TraceloopTraces system calls per cgroup, using BPF and overwritable ring buffers to keep the logshttps://github.com/kinvolk/traceloop
Used in Inspektor GadgetA Collection of BPF gadgets for developers of Kubernetes applicationshttps://github.com/kinvolk/inspektor-gadget

Problem statement
- Debugging distributed applications is hard
- Tracing tools can help us to see what’s going on
- strace is great but needs to attach to every processes before the event happens
❏ Would need to know when crashes happen❏ Performance impact to high if always-on
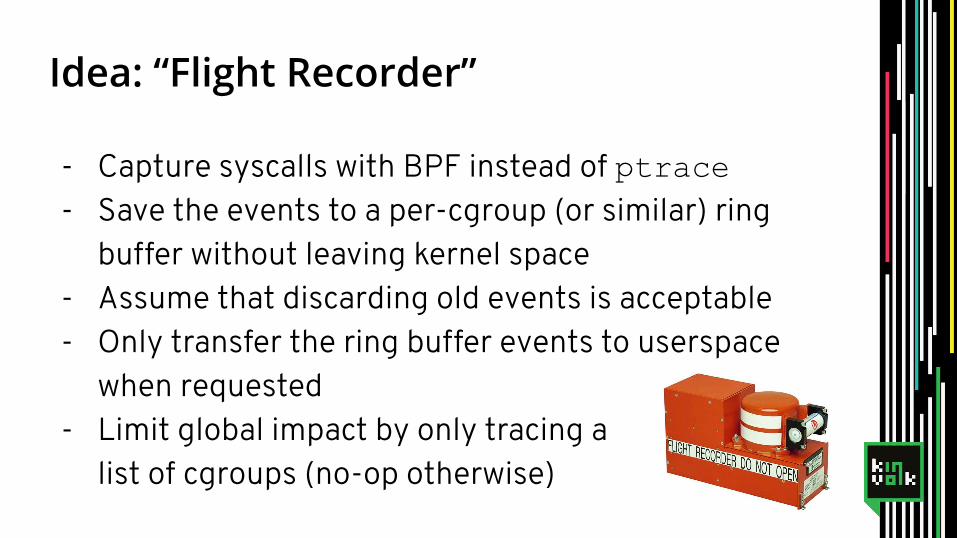
Idea: “Flight Recorder”
- Capture syscalls with BPF instead of ptrace- Save the events to a per-cgroup (or similar) ring
buffer without leaving kernel space- Assume that discarding old events is acceptable- Only transfer the ring buffer events to userspace
when requested- Limit global impact by only tracing a
list of cgroups (no-op otherwise)

Comparing strace and traceloop
strace traceloop
Capture method ptrace BPF on tracepoints
Granularity process global, filter cgroup/UTS namespace¹
Speed slow fast
Reliability SynchronousCannot lose events
AsynchronousCan lose events
Can fail to read buffers (EFAULT) when dumping syscall arguments
Maturity Covers many cases Not all syscall arguments are readOnly AMD64 syscalls recognized
¹ could also be process

Architecture
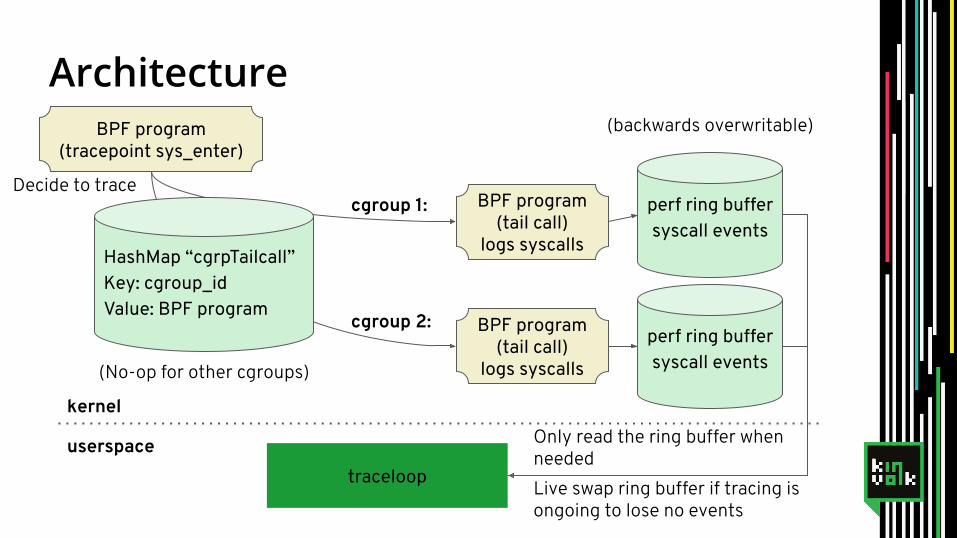
ArchitectureBPF program
(tracepoint sys_enter)
BPF program(tail call)
logs syscalls
perf ring buffersyscall events
BPF program(tail call)
logs syscalls
perf ring buffersyscall events
HashMap “cgrpTailcall”Key: cgroup_id Value: BPF program
cgroup 1:
cgroup 2:
kernel
userspacetraceloop
Only read the ring buffer when needed
(No-op for other cgroups)
Live swap ring buffer if tracing is ongoing to lose no events
(backwards overwritable)
Decide to trace
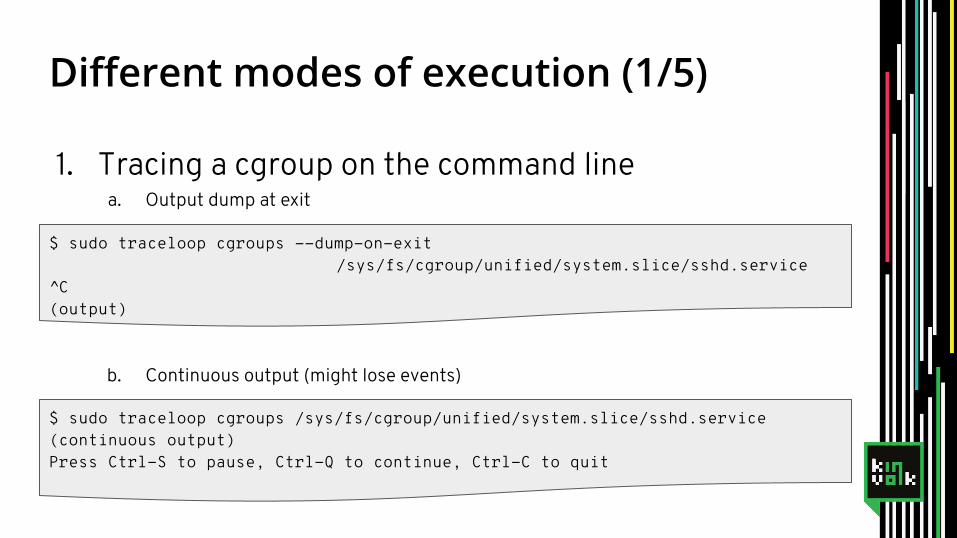
1. Tracing a cgroup on the command linea. Output dump at exit
b. Continuous output (might lose events)
$ sudo traceloop cgroups --dump-on-exit/sys/fs/cgroup/unified/system.slice/sshd.service
^C(output)
Different modes of execution (1/5)
$ sudo traceloop cgroups /sys/fs/cgroup/unified/system.slice/sshd.service(continuous output)Press Ctrl-S to pause, Ctrl-Q to continue, Ctrl-C to quit
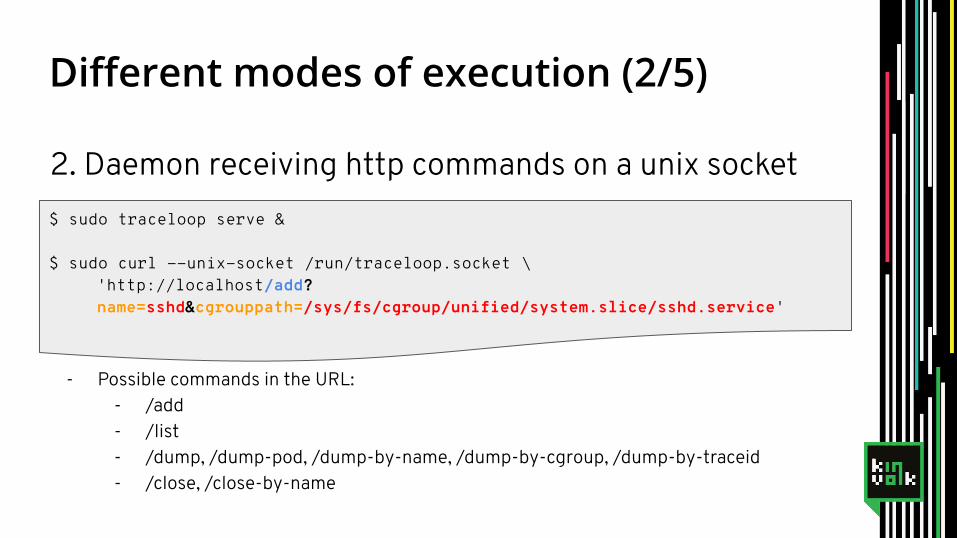
Different modes of execution (2/5)
2. Daemon receiving http commands on a unix socket
- Possible commands in the URL:- /add- /list- /dump, /dump-pod, /dump-by-name, /dump-by-cgroup, /dump-by-traceid- /close, /close-by-name
$ sudo traceloop serve &
$ sudo curl --unix-socket /run/traceloop.socket \'http://localhost/add?name=sshd&cgrouppath=/sys/fs/cgroup/unified/system.slice/sshd.service'
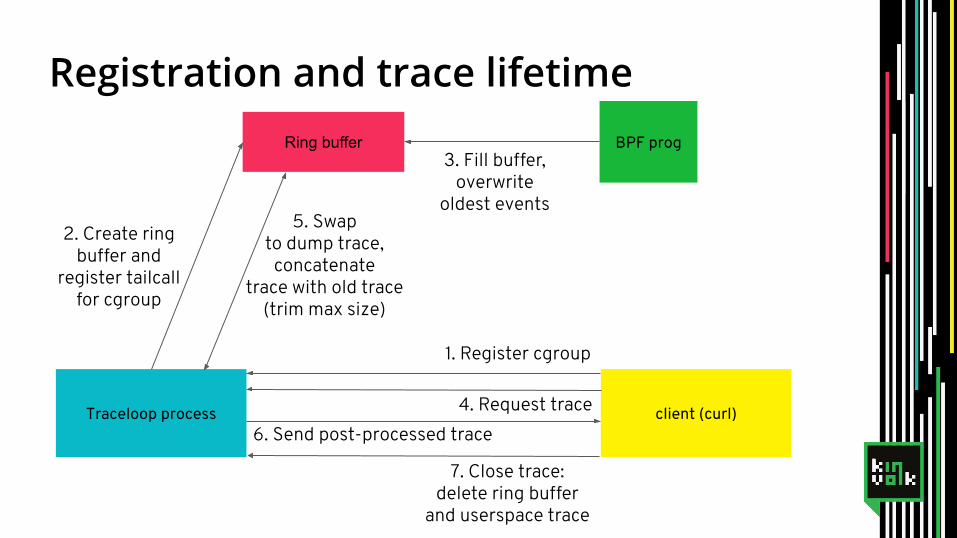
Registration and trace lifetimeRing buffer
2. Create ring buffer and
register tailcall for cgroup
3. Fill buffer, overwrite
oldest events
BPF prog
Traceloop process client (curl)
5. Swapto dump trace,
concatenatetrace with old trace
(trim max size)
4. Request trace
7. Close trace:delete ring buffer
and userspace trace
6. Send post-processed trace
1. Register cgroup
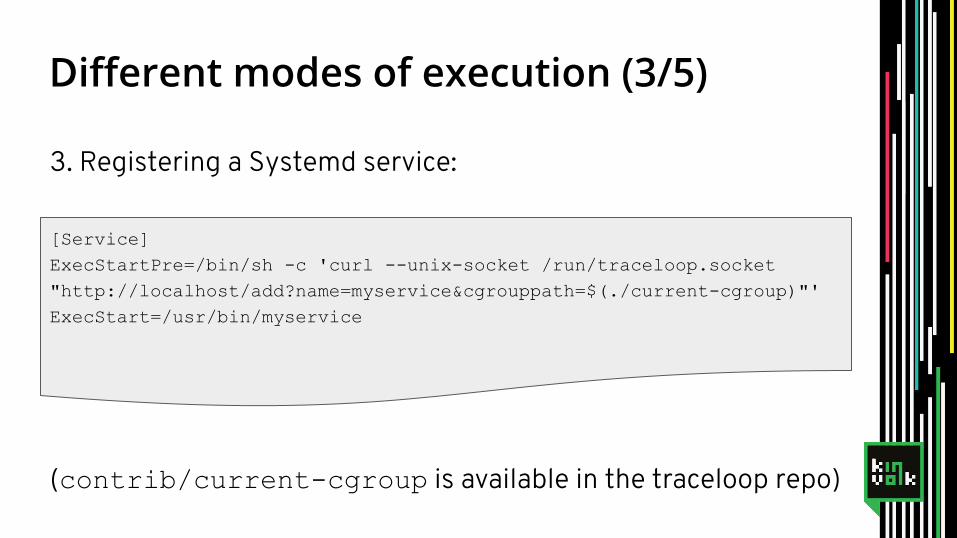
Different modes of execution (3/5)
3. Registering a Systemd service:
(contrib/current-cgroup is available in the traceloop repo)
[Service]ExecStartPre=/bin/sh -c 'curl --unix-socket /run/traceloop.socket "http://localhost/add?name=myservice&cgrouppath=$(./current-cgroup)"'ExecStart=/usr/bin/myservice
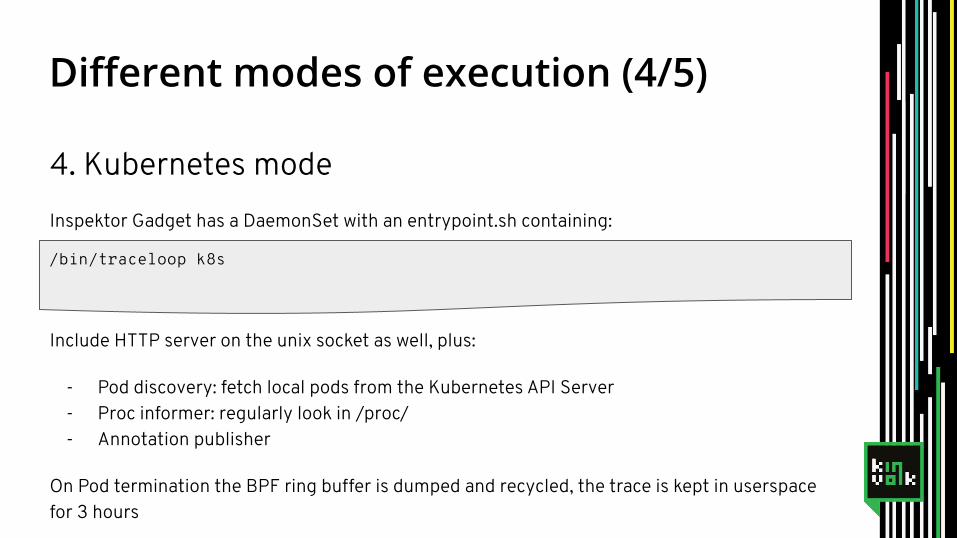
Different modes of execution (4/5)
4. Kubernetes modeInspektor Gadget has a DaemonSet with an entrypoint.sh containing:
Include HTTP server on the unix socket as well, plus:
- Pod discovery: fetch local pods from the Kubernetes API Server- Proc informer: regularly look in /proc/- Annotation publisher
On Pod termination the BPF ring buffer is dumped and recycled, the trace is kept in userspace for 3 hours
/bin/traceloop k8s

BPF perf map(overwritable)
events
BPF perf map(overwritable)
eventsBPF prog
tail-call
BPF progtail-call
UTS ns
Traceloop process
Keeping track of Kubernetes containers
Main loop
Pod discovery
Proc informer
Annotation publisher
Kubernetes API Server
/proc/*/ns/uts/proc/*/cgroupPodUID, ContainerID
UTS namespace ID?
namespace/podnamePodUID, ContainerIDs
Get local pods
Kubernetes API Server
Patch gadget annotations
BPF progtp/sys_enter
BPFhash maputsns_map
BPF progtail-call
BPF perf map(overwritable)
events
idx
BPFprog array map
tail_call_enter
tail call (idx)
register
BPF perf mapcontainer_events
New container(pid, idx, utsns, cgroup_path)
curlGet traces
kubectl gadget traceloop show $TRACE_ID
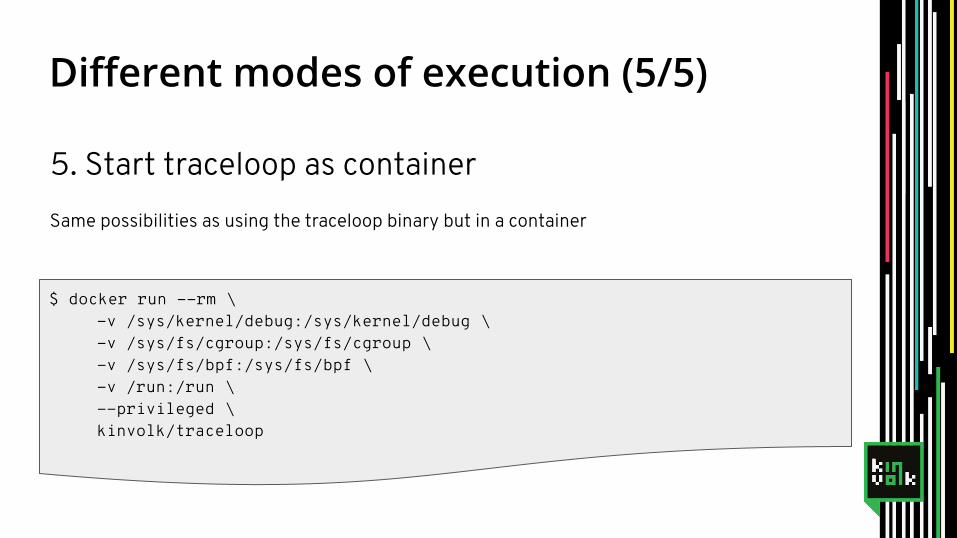
Different modes of execution (5/5)
5. Start traceloop as containerSame possibilities as using the traceloop binary but in a container
$ docker run --rm \-v /sys/kernel/debug:/sys/kernel/debug \-v /sys/fs/cgroup:/sys/fs/cgroup \-v /sys/fs/bpf:/sys/fs/bpf \-v /run:/run \--privileged \kinvolk/traceloop

How to get a list of syscalls?
Syscalls and their numbers: /usr/include/asm/unistd_64.h
Parameters: /sys/kernel/debug/tracing/events/syscalls/sys_enter_${name}/format
Post process some syscalls:
- new{uname,fstat,lstat,stat}→{uname,fstat,lstat,stat}, sendfile64→sendfile, sysctl→_sysctl, umount→umount2
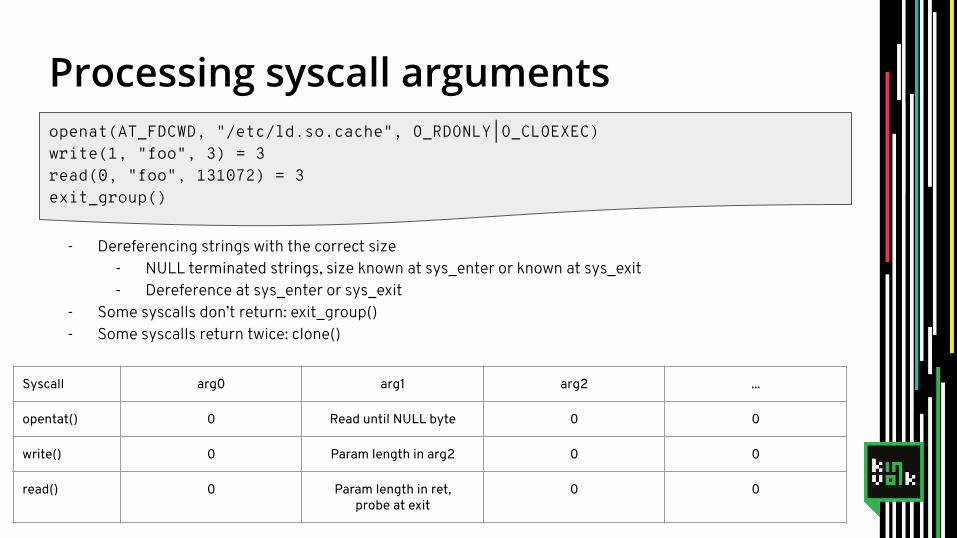
- Dereferencing strings with the correct size- NULL terminated strings, size known at sys_enter or known at sys_exit- Dereference at sys_enter or sys_exit
- Some syscalls don’t return: exit_group()- Some syscalls return twice: clone()
openat(AT_FDCWD, "/etc/ld.so.cache", O_RDONLY|O_CLOEXEC)write(1, "foo", 3) = 3read(0, "foo", 131072) = 3exit_group()
Processing syscall arguments
Syscall arg0 arg1 arg2 ...
opentat() 0 Read until NULL byte 0 0
write() 0 Param length in arg2 0 0
read() 0 Param length in ret,probe at exit
0 0
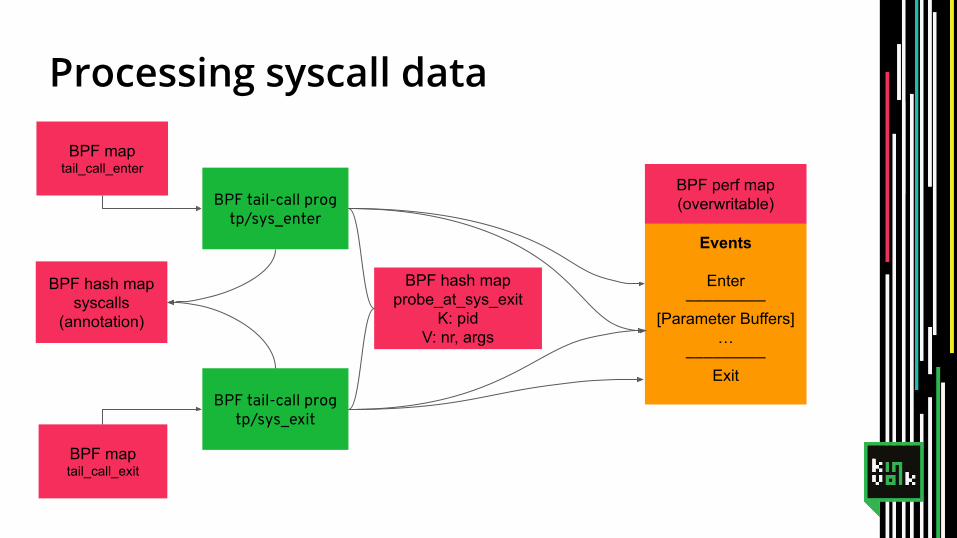
Processing syscall data
BPF tail-call progtp/sys_enter
BPF maptail_call_enter
BPF tail-call progtp/sys_exit
BPF perf map(overwritable)
BPF maptail_call_exit
BPF hash mapprobe_at_sys_exit
K: pidV: nr, args
BPF hash mapsyscalls
(annotation)
Events
Enter–––––––––
[Parameter Buffers]…
–––––––––Exit
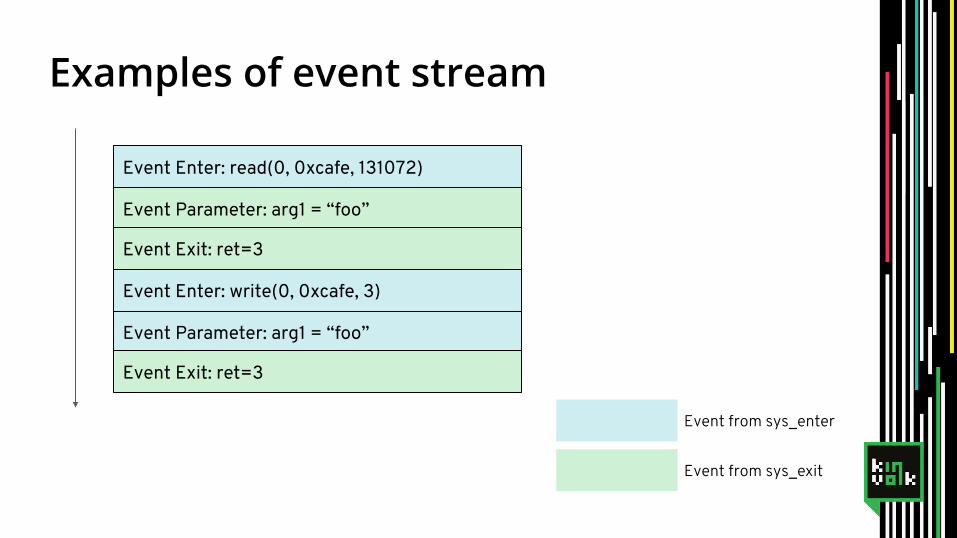
Examples of event stream
Event Enter: read(0, 0xcafe, 131072)
Event Parameter: arg1 = “foo”
Event Exit: ret=3
Event Enter: write(0, 0xcafe, 3)
Event Parameter: arg1 = “foo”
Event Exit: ret=3
Event from sys_enter
Event from sys_exit

Benchmarks
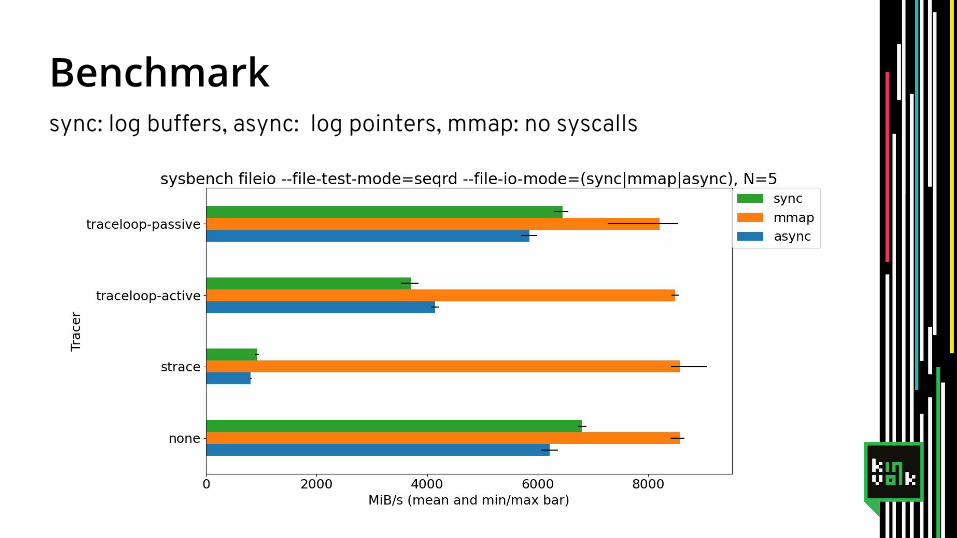
Benchmarksync: log buffers, async: log pointers, mmap: no syscalls

Limitations
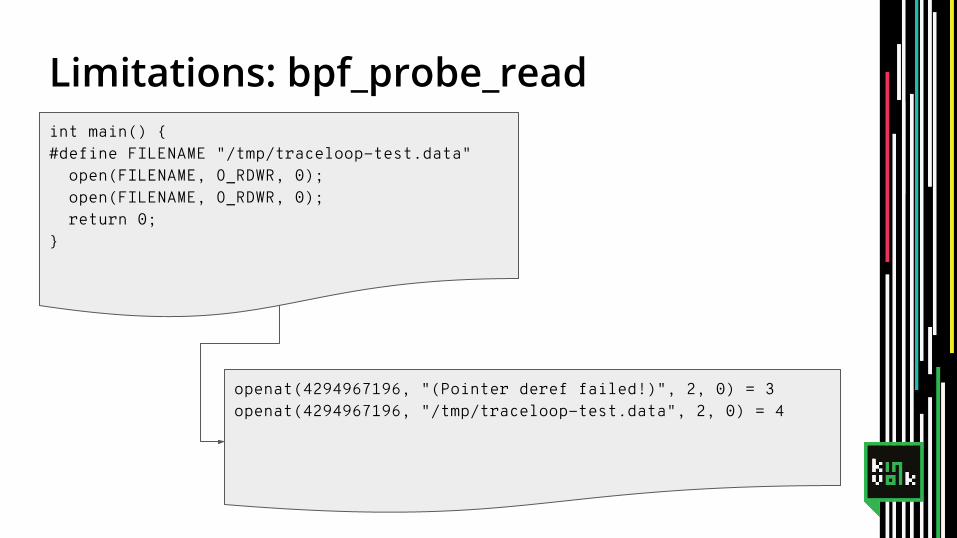
Limitations: bpf_probe_readint main() {#define FILENAME "/tmp/traceloop-test.data" open(FILENAME, O_RDWR, 0); open(FILENAME, O_RDWR, 0); return 0;}
openat(4294967196, "(Pointer deref failed!)", 2, 0) = 3openat(4294967196, "/tmp/traceloop-test.data", 2, 0) = 4
Limitations: BPF
- Memory pages may not be present when dereferencing a syscall parameter: data may not be loaded to memory at the beginning of the syscall
- Cases: First reference to data segment in binary or a reference into an mmaped file
- Workarounds can be to try again at syscall exit but that is not valid for all parameters and in general swapping/cache flushing can also happen

Limitations: Traceloop
- Doesn’t yet detect buffer wraps to mark missing events (even harder when merging per-CPU buffers)
- Merging per-CPU buffers does sorting of timestamps which can have corner cases
- The whole trace data is post-processed each time and not only the new events with those old events they refer to
- Currently max. buffer length for syscall parameters is 128 bytes- Not all syscalls have annotation for dereferencing parameters
and detecting constants or structs
Limitations: Detection of new cgroups/containers
- Possible with systemd StartPre trick if permissions are right- On Kubernetes automatic detection currently done with runc
mount tracepoint hack and a pool of free buffers- Currently traces all pods, no configuration yet- Integration with container OCI hooks was tried with Flatcar
Edge but relied on runc patches
Limitations: Memory usage
- Currently per-CPU perf buffers for a cgroup- Even if buffers are closed, dumps in userspace consume
memory too until they are closed (no compression yet)- In the Kubernetes setup, traceloop’s settings:
- Ring buffer pre-allocation for 128 containers- Traceloop uses 64 pages per ring buffer
- Scenario with 16 CPUs:- 64 * 4KiB * 16 * 128 = 512 MiB of non-swappable memory
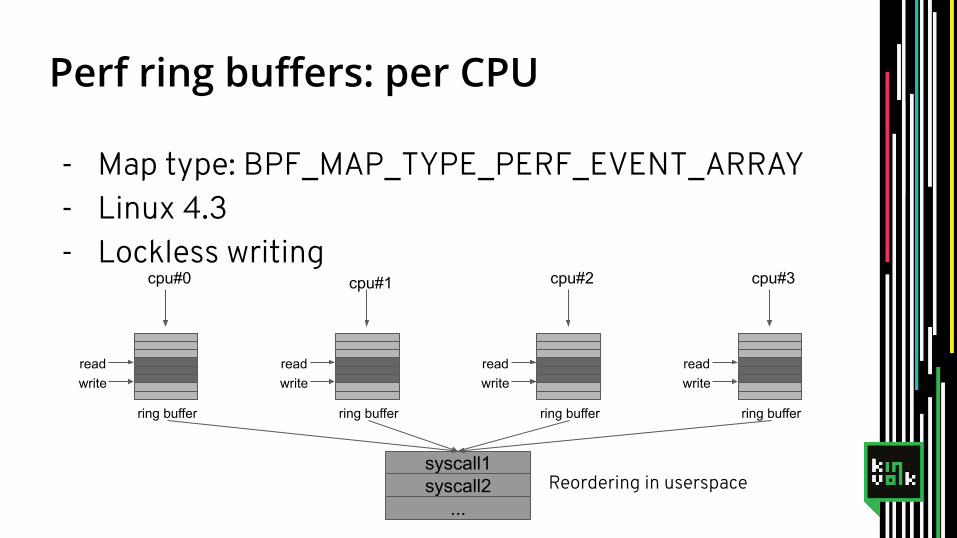
- Map type: BPF_MAP_TYPE_PERF_EVENT_ARRAY- Linux 4.3- Lockless writing
Perf ring buffers: per CPU
cpu#0
readwrite
ring buffer
cpu#1
readwrite
ring buffer
cpu#2
readwrite
ring buffer
cpu#3
readwrite
ring buffer
syscall1syscall2
...Reordering in userspace
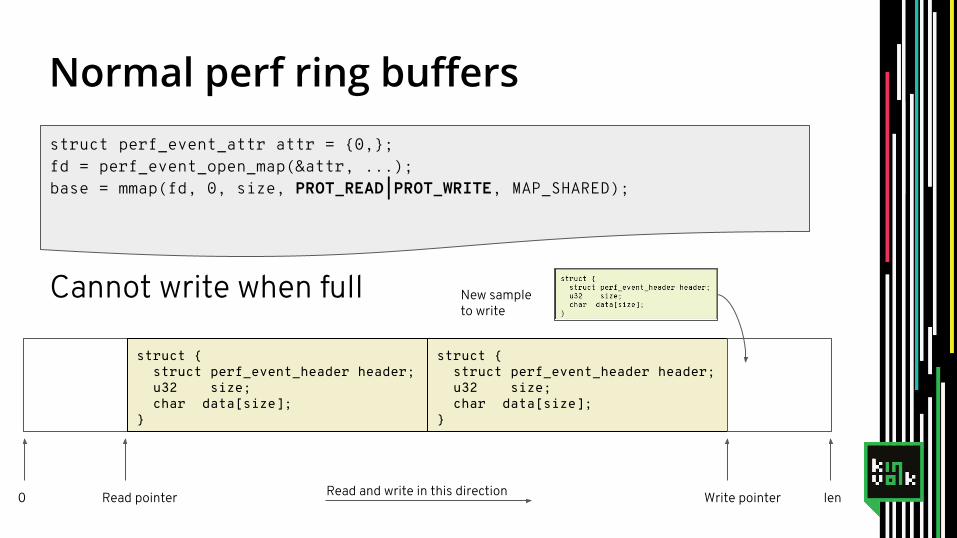
Normal perf ring buffersstruct perf_event_attr attr = {0,};fd = perf_event_open_map(&attr, ...);base = mmap(fd, 0, size, PROT_READ|PROT_WRITE, MAP_SHARED);
struct { struct perf_event_header header; u32 size; char data[size];}
struct { struct perf_event_header header; u32 size; char data[size];}
Write pointer0 lenRead pointer
New sampleto write
Cannot write when full
Read and write in this direction
Write in this direction
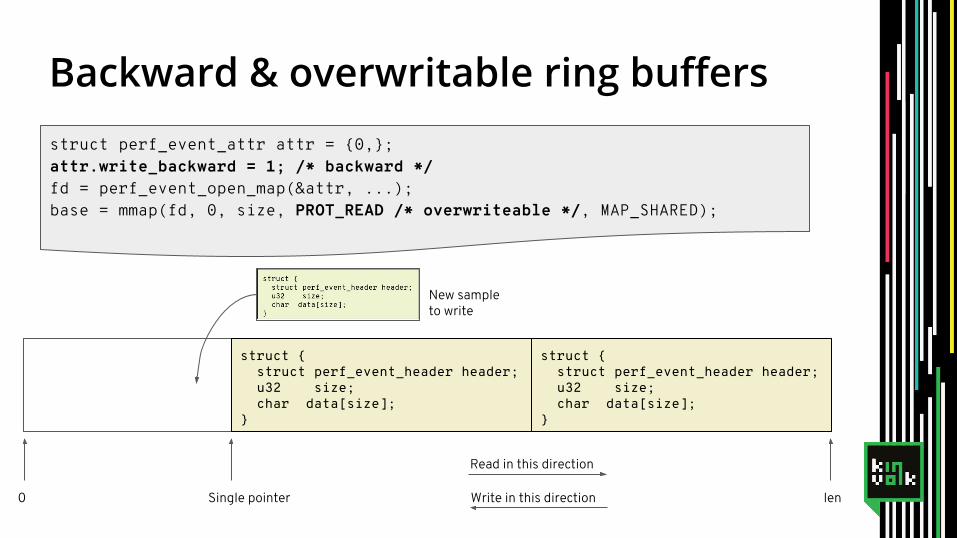
Backward & overwritable ring buffersstruct perf_event_attr attr = {0,};attr.write_backward = 1; /* backward */fd = perf_event_open_map(&attr, ...);base = mmap(fd, 0, size, PROT_READ /* overwriteable */, MAP_SHARED);
struct { struct perf_event_header header; u32 size; char data[size];}
struct { struct perf_event_header header; u32 size; char data[size];}
Single pointer0 len
New sampleto write
Read in this direction
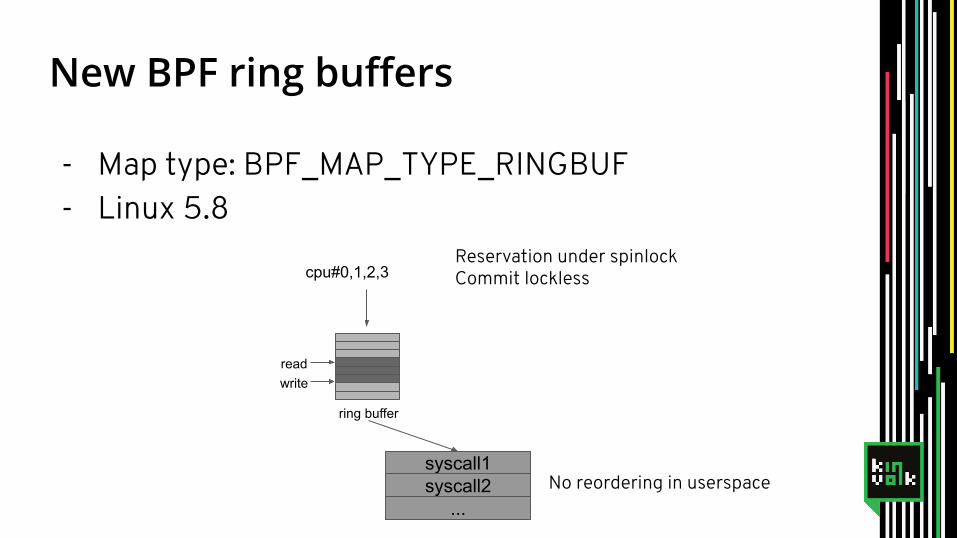
- Map type: BPF_MAP_TYPE_RINGBUF- Linux 5.8
New BPF ring buffers
cpu#0,1,2,3
readwrite
ring buffer
syscall1syscall2
...No reordering in userspace
Reservation under spinlockCommit lockless
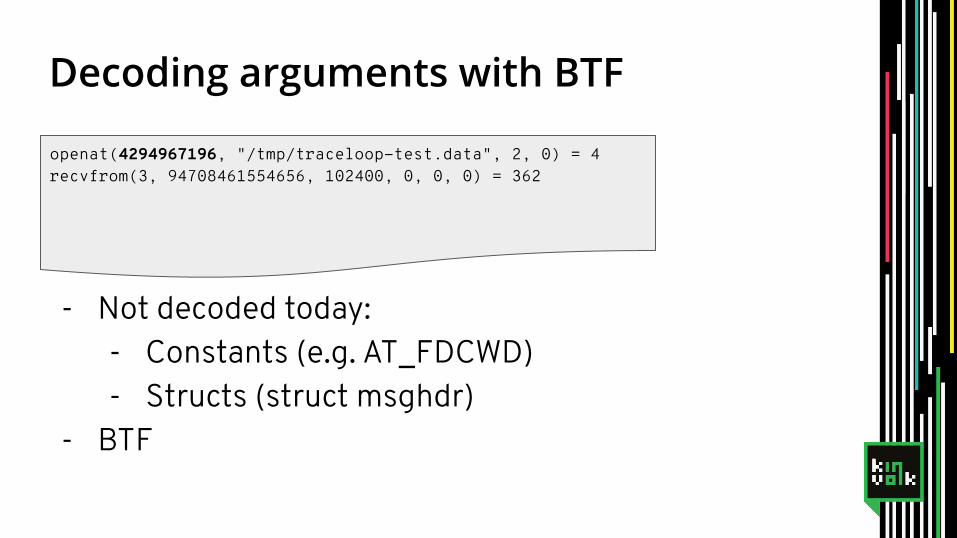
Decoding arguments with BTF
- Not decoded today:- Constants (e.g. AT_FDCWD)- Structs (struct msghdr)
- BTF
openat(4294967196, "/tmp/traceloop-test.data", 2, 0) = 4recvfrom(3, 94708461554656, 102400, 0, 0, 0) = 362
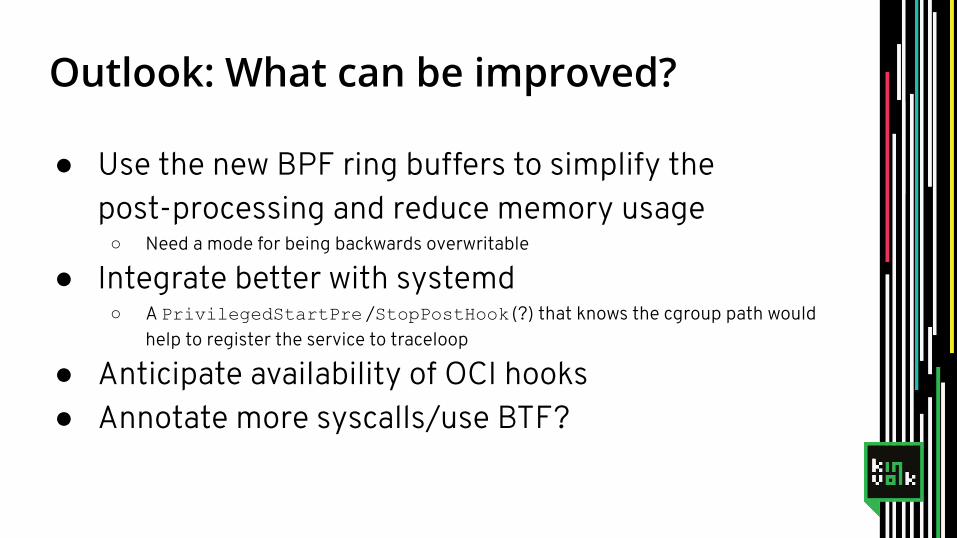
Outlook: What can be improved?
● Use the new BPF ring buffers to simplify the post-processing and reduce memory usage
○ Need a mode for being backwards overwritable
● Integrate better with systemd○ A PrivilegedStartPre /StopPostHook (?) that knows the cgroup path would
help to register the service to traceloop
● Anticipate availability of OCI hooks● Annotate more syscalls/use BTF?
Alban CrequyGithub: albanTwitter: @albcrEmail: [email protected]
Questions?
KinvolkBlog: kinvolk.io/blogTwitter: kinvolkioEmail: [email protected]
Kubernetes Slack: #inspektor-gadgetSource Code: https://github.com/kinvolk/traceloop/
Kai LükeGithub: pothosEmail: [email protected]

Backup slides
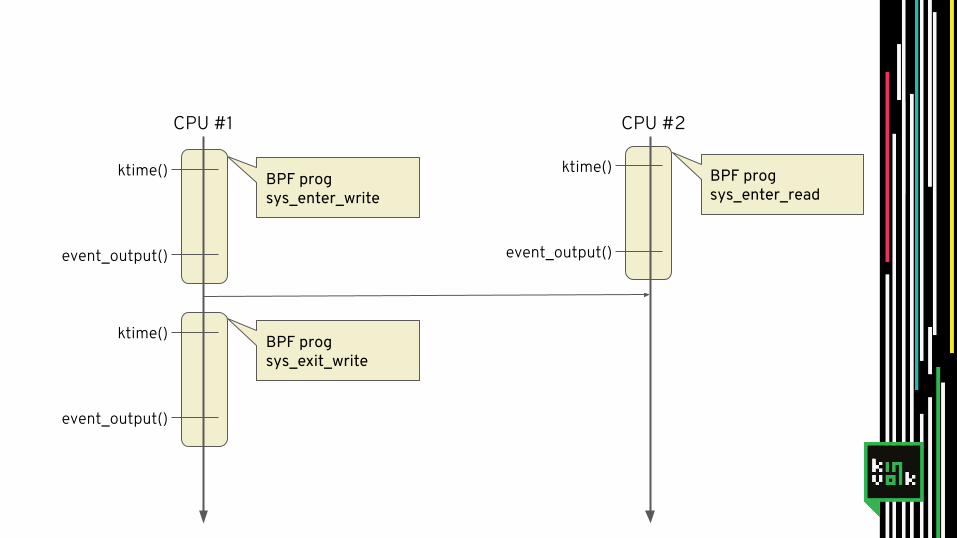
BPF progsys_exit_write
ktime()
event_output()
BPF progsys_enter_write
CPU #1
ktime()
event_output()
BPF progsys_enter_read
ktime()
event_output()
CPU #2