Embed Size (px)
Citation preview
CCQM-K123 Trace Elements in Biodiesel Fuel
Final Report
Authors: Takayoshi Kuroiwa, Yanbei Zhu, Kazumi Inagaki (NMIJ)1, Stephen Long, Steven Christopher (NIST)2, Mabel Puelles, Monica Borinsky, Nadia Hatamleh (INTI)3, John Murby, Jeffrey Merrick, Ian White, David Saxby (NMIA)4, Rodrigo Caciano de Sena, Marcelo Dominguez de Almeida (INMETRO)5, Jochen Vogl, Pranee Phukphatthanachai (BAM)6, Wai-hong FUNG, Ho-pan YAU (GLHK)7, TOM ODUOR OKUMU, JACQUELINE NJERI KANG’IRI (KEBS)8, José Antonio Salas Téllez, Edith Zapata Campos, Esther Castro Galván (CENAM)9, Nattikarn Kaewkhomdee, Sutthinun Taebunpakul, Usana Thiengmanee, Charun Yafa (NIMT)10, Nilgün TOKMAN, Murat TUNÇ, Süleyman Z. CAN (TÜBİTAK UME)11 1 National Metrology Institute of Japan 2 National Institute of Standards and Technology 3 Instituto Nacional de Tecnología Industrial – Centro de Química 4 National Measurement Institute Australia 5 National Institute of Metrology, Quality and Technology 6 Bundesanstalt für Materialforschung und -prüfung (BAM) 7 Government Laboratory, Hong Kong 8 Kenya Bureau of Standards 9 National Center of Metrology 10 National Institute of Metrology (Thailand) 11 TÜBİTAK Ulusal Metroloji Enstitüsü
Coordinated by NMIJ and NIST
January 2017

Abstract
The CCQM-K123 key comparison was organized by the Inorganic Analysis Working
Group (IAWG) of CCQM to assess and document the capabilities of the national
metrology institutes (NMIs) or the designated institutes (DIs) to measure the mass
fractions of sodium, calcium, potassium, magnesium phosphorous and sulfur in biodiesel
fuel (BDF). The National Metrology Institute of Japan (NMIJ) and National Institute of
Standards and Technology (NIST) acted as the coordinating laboratories.
Results were submitted by 11 NMIs and DIs. The participants used different
measurement methods, though most of them used inductively coupled plasma-mass
spectrometry (ICP-MS), isotope dilution technique with ICP-MS and inductively coupled
plasma-optical emission spectrometry (ICP-OES) with microwave acid digestion.
The material was quite challenging and a number of questions were raised at the IAWG
meeting. Concerning S, the variation in S results between participants, particularly those
using IDMS methods was discussed at the IAWG meeting. BAM, NIST and NMIJ
reviewed their experimental conditions, results and/or uncertainty calculations for IDMS.
According to the additional evaluation and investigation, the variances between the
revised results became smaller than the original one, the revised results were overlapping
between IDMS measurements of S content at the k=2 level. It is not possible to calculate
a KCRV with values being modified after submission. It was concluded that this KC does
not support S measurements.
Accounting for relative expanded uncertainty, comparability of measurement results for
each of Na, Ca, K, Mg and P was successfully demonstrated by the participating NMIs or
DIs. It is expected that sodium, calcium, potassium, magnesium and phosphorus at mass
fractions greater than approximately 0.1 mg/kg, 0.1 mg/kg, 0.05 mg/kg, 0.05 mg/kg and 0.1
mg/kg respectively in biodiesel fuel and similar matrices (fuels and oils etc.) can be
determined by each participant using the same technique(s) employed for this key
comparison to achieve similar uncertainties mentioned in the present report. Furthermore, the
results of this key comparison can be utilized along with the IAWG core capability approach.

Page 1 of 44 CCQM-K123
Table of Content
Page
1 Introduction 2-3 2 Participating Institutes 3
3 Samples and Instructions to Participants 4-6 3.1 Material 4
3.2 Homogeneity and Stability Studies 4-6 3.3 Instructions to Participants 6
4 Methods of Measurement 7 5 Results and Discussion 8-24
5.1 General 8-13 5.2 Traceability of Calibrants used by Participants 13 5.3 Calculation of the Reference Mass Fraction Value and
Associated Uncertainties
13-18
5.4 Equivalence Statements 19-24 6 Demonstration of Core Capabilities 25 7 Conclusions 25-26 Appendix I Appendix II Appendix III

Page 2 of 44 CCQM-K123
1. Introduction
Interest in biofuels and their utilization increase all over the world and their market has
been expanding. Asian countries and economic are actively promoting the introduction of
biofuels; especially, Southeast Asian countries are actively promoting to introduce
biodiesel fuel (BDF) as Fatty Acid Methyl Ester (FAME). However, the low-quality
biofuels raise serious concerns regarding the effect on engine performance caused by fuel
impurities and the oxidation. Therefore, quality control of biofuels in the actual market is
very important. Though regulations for quality control of BDF are varying from region to
region, some elements in BDF are regulated in most of standards. Therefore,
establishment of metrological traceability and international comparability by performing
a KC is important.
In the IAWG’s five-year plan, a comparison under the category of fuels analysis was
recommended for the year 2015. NMIJ has started a project related to BDF in
collaboration with NIST and development of a BDF CRM for analysis of water, methanol,
and some elements. In this connection, NMIJ and NIST proposed a CCQM KC (and a
parallel pilot study) of trace elements using the candidate BDF CRM as comparison
material at the IAWG meeting held on November 5-6, 2013, for participating NMIs and
DIs to demonstrate their analytical capabilities in determination of elements in BDF by
various analytical techniques so as to facilitate their claim on the Calibration and
Measurement Capabilities (CMC). At the CCQM meeting following the IAWG meeting,
the proposal was agreed as CCQM-K123 and CCQM-P157, and NMIJ and NIST were
designated as coordinating laboratories. The analytes in this key comparison were
sodium, potassium, magnesium, calcium, phosphorus and sulfur in BDF at
mass-fractions. Basically, the analytes to be measured were chosen with reference to
existing guidelines or regulatory standards. The important BDF properties and their
expected impact on vehicle condition and operation. The worsening of exhaust gas is
caused by sulfur, alkali metals, and alkaline earth metal elements. The pump failure
sticking adhesive material and the filter plugging are caused by the alkali metals and
alkaline earth metal elements. The deterioration of the property of the exhaust emission
control catalyst is caused by the alkali metals, alkaline earth metal elements, and
phosphorous.

Page 3 of 44 CCQM-K123
This study will investigate the core capabilities of participants to measure the content of
tested elements in BDF. Each participant could use any suitable method(s) of
measurement. Four measurements of each analyte had to be carried out by each
participant. They could use the results of this study as evidence(s) not only for their
CMC claims for elements in BDF but also their related CMC claims for elements in
similar matrices (fuels and oils etc.) and/or others through a Core Capability Table.
Results were submitted by 11 NMIs and DIs. The comparison results were discussed at
the IAWG meetings held October 14-15, 2014, April 16-17, November 17-18, 2015, and
April 18-19, October 4-6, 2016.
2. Participating Institutes
11 institutes were registered in the Key Comparison CCQM-K123. Table 1 depicts the
list of the participating NMIs/DIs in alphabetic order of the countries’ names.
Table 1. List of the Participating NMIs/DIs for CCQM-K123 No. Institute Country Contact Person
1 INTI Instituto Nacional de Tecnología Industrial – Centro de Química
Argentina Mabel Puelles, Monica Borinsky
2 NMIA National Measurement Institute Australia Australia John Murby
3 INMETRO National Institute of Metrology, Quality and Technology Brazil Rodrigo Caciano de
Sena
4 BAM Bundesanstalt für Materialforschung und -prüfung (BAM)
Germany Jochen Vogl
5 GLHK Government Laboratory, Hong Kong Hong Kong Wai-hong FUNG
6 NMIJ National Metrology Institute of Japan Japan Takayoshi Kuroiwa,
Yanbei Zhu
7 KEBS Kenya Bureau of Standards Kenya TOM ODUOR
OKUMU
8 CENAM National Center of Metrology
Mexico José Antonio Salas
9 NIMT National Institute of Metrology (Thailand) Thailand Nattikarn
Kaewkhomdee
10 TUBITAK UME TÜBİTAK Ulusal Metroloji Enstitüsü Turkey Nilgün TOKMAN
11 NIST National Institute of Standards and Technology USA Stephen Long

Page 4 of 44 CCQM-K123
3. Samples and Instructions to Participants
3.1 Material
The test material is a candidate material for a biodiesel fuel certified reference material
(CRM) developed by NMIJ. The raw material of the candidate CRM is commercial B100
BDF produced from palm oil in Indonesia. The target metal elements are added as
lipid-soluble reagents (phospholipid and dibutyl sulfide), sodium cyclohexanebutyrate
for Na, potassium cyclohexanebutyrate for K, calcium 2-ethylhexanoate for Ca,
magnesium 2-ethylhexanoate for Mg, phosphatidylcholine for P and dibutyl sulfide for S
to original BDF material. NMIJ confirmed that these added reagents were well dissolved
in BDF through preliminary analysis. After addition, blending was carried out by using
ultrasonication and filtering. The BDF sample was bottled in amber glass ampoules of 15
mL, which were flushed with argon prior to the filling. Thereafter the ampoules were
flame sealed.
The candidate CRM was stored at room temperature, i.e. 15 ˚C to 30 ˚C, and shielded
from light. A part of the candidate CRM was used for this comparison as the test
material.
3.2 Homogeneity and Stability Studies
The homogeneity of the material was investigated by analyzing 10 bottles randomly
selected from the lot of 350 bottles. The test portions were analyzed using ICP-MS. Each
sample was analyzed at least five times.
ANOVA technique was applied to evaluate the between bottle heterogeneity standard
deviation (sbb) for each element was calculated using the equation (1) given below in
accordance with ISO Guide 35:2006 [1].
The results are shown in Table 2.
(1)
where
sbb is the between bottle homogeneity standard deviation;
MSwithin is the mean square of within bottles variance;
withinamongbb n
MSMSs
−=

Page 5 of 44 CCQM-K123
MSamong is the mean square of between bottles variance;
n is the number of replicates.
Table 2. Results of Homogeneity Study
Analyte Between-bottle homogeneity standard deviation (sbb)
Sodium 0.3 %
Potassium 0.6 %
Magnesium 0.4 %
Calcium 0.3 %
Phosphorus 1.6 %
Sulfur 0.3 %
It can be seen from Table 2 that the values of sbb except P were less than 1 %. The
homogeneity study indicated that there was no significant heterogeneity observed
amount different bottles of test material, and therefore, the homogeneity is good enough
to be used for this comparison.
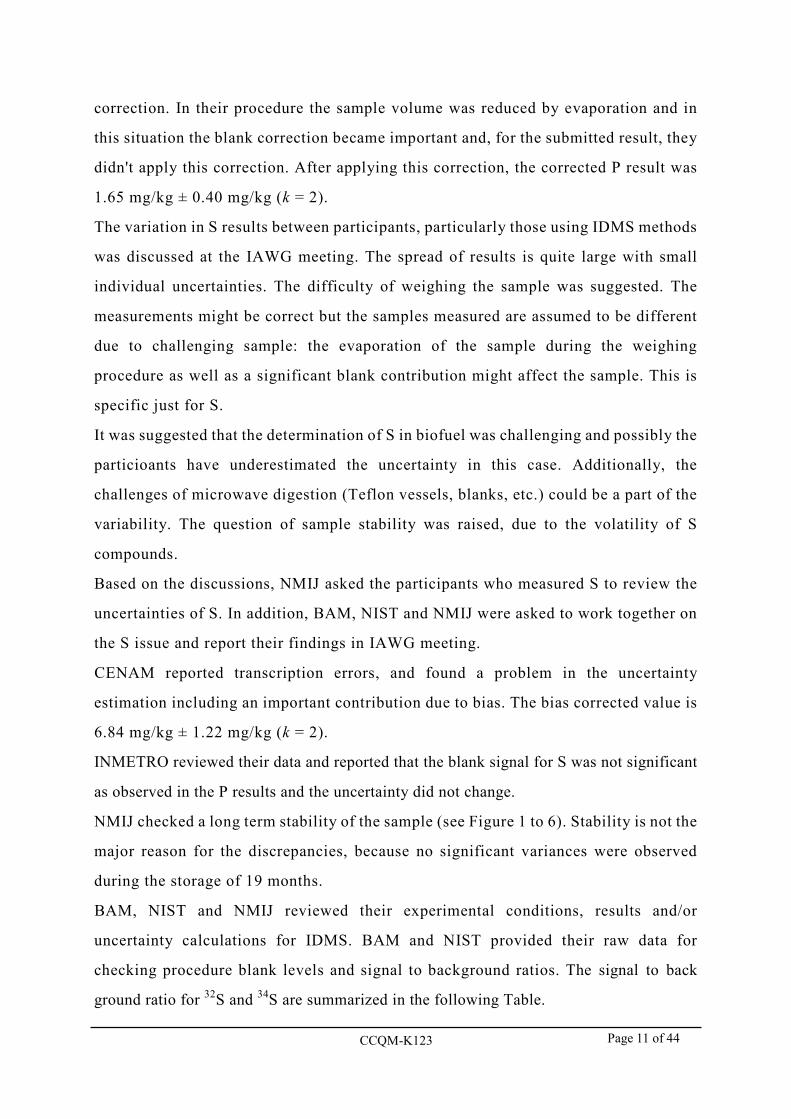
The stability study was carried out covering a period of 19 month. Assessment of the
results were carried out following ISO Guide 35:2006. The stability of the material was
investigated by analyzing one bottle selected from the storing sample bottles by using
standard addition with ICP-MS after decomposed by microwave acid digestion. Each
sample was analyzed at least five times. The results are shown in Figure 1 to 6. Based on
the stability test, significant variation was not found for the concentration of all
measurands. The trend-analysis technique proposed by ISO Guide 35:2006 was applied
to assess the stability of the test material. ANOVA technique was applied to evaluate, the
slope for each measurand was not significant. This material was assessed stable
throughout this comparison.
Page 6 of 44 CCQM-K123
Figure 1. Stability study of sodium Figure 2. Stability study of potassium
Figure 3. Stability study of magnesium Figure 4. Stability study of calcium
Figure 5. Stability study of phosphorus Figure 6. Stability study of sulfur
3.3 Instructions to Participants
Each participant received two ampoules containing approximately 15 mL of the BDF
sample. The sample after receiving had to be kept at the laboratory temperature (15 °C to
25 °C). Participants could use any analytical methods of measurement deemed
appropriate, and was requested to perform at least four independent measurements in
order to determine the mass fraction of each measurand and to use standards with
Rel
ativ
e m
ass
fract
ion
0.90
0.95
1.00
1.05
1.10
Storage period (month)0 8 19
0.90
0.95
1.00
1.05
1.10
Storage period (month)0 8 19
Rel
ativ
e m
ass
fract
ion
0.90
0.95
1.00
1.05
1.10
Storage period (month)0 8 19
Rel
ativ
e m
ass
fract
ion
0.90
0.95
1.00
1.05
1.10
Storage period (month)0 8 19
Rel
ativ
e m
ass
fract
ion
0.90
0.95
1.00
1.05
1.10
Storage period (month)0 8 19
Rel
ativ
e m
ass
fract
ion
0.90
0.95
1.00
1.05
1.10
Storage period (month)0 8 19
Rel
ativ
e m
ass
fract
ion

Page 7 of 44 CCQM-K123
metrological traceability for calibrations of analytical instruments.
To report the measurement results, the participants were requested to submit the mean
value of four or more independent measurement data accompanying with the
corresponding measurement uncertainty. The participants were requested to submit their
results along with information on the sample preparation, analytical method, calculation
of results, uncertainty estimation with a full measurement uncertainty budget and sources
and standards used for calibration.
4. Methods of Measurement
The majority of the participants used measurement techniques such as ICP-MS, isotope
dilution ICP-MS and ICP-OES. The method summary is shown in Table 3.
Table 3. Summary of Analytical Techniques Applied by the Participants
Institute Analyte Sample treatment Analytical method
Instrumental technique
INTI Na, K, Mg, Ca None Std. addition ICP-OES
NMIA Mg, P Microwave acid digestion
(4 mL of HNO3 and 3 mL of H2O2)
Mg: IDMS (24Mg/26Mg and 25Mg/26Mg) P: Std. addition
ICP-SF-MS
INMETRO Mg, P, S Acid digestion with high
pressure asher (5 mL of HNO3)
External calibration ICP-OES
BAM S
Acid digestion with high pressure asher (5 ml of HNO3
and 1 mL of H2O2) Analyte-matrix separation
(Ion exchange chromatography with 1mL
AG 1X8 resin filled in Eichrom columns)
IDMS (32S/34S) MC-ICP-MS
GLHK K, Mg Microwave acid digestion
(5 mL of HNO3 and 1 mL of H2O2)
Std. addition K: HR-ICP-MS Mg: ICP-OES
NMIJ Na, K, Mg, Ca, P, S
Microwave acid digestion (3 mL of HNO3 and 2 mL of
HClO4)
Na, P: Std. addition K, Mg, Ca, S: IDMS (41K/39K, 25Mg/24Mg,
44Ca40Ca, 34S/32S)
ICP-MS
KEBS K, Mg Microwave acid digestion External calibration Microwave Plasma-AES

Page 8 of 44 CCQM-K123
Institute Analyte Sample treatment Analytical method
Instrumental technique
CENAM S None External calibration XRF
NIMT K, Mg Microwave acid digestion
(4 mL of HNO3 and 1 ml of H2O2)
IDMS ICP-MS
UME Na, K, Mg, Ca, P, S
Microwave acid digestion (3 mL of deionized H2O and 5 mL of H2O2 for S, 5 mL of
HNO3 for other analytes)
External calibration (Matrix matched) HR-ICP-MS
NIST S Microwave acid digestion (3 mL of HNO3+2.5 mL of H2O2+2.5 mL of DI water)
IDMS (32S/34S) ICP-SF-MS
5. Results and Discussion
5.1 General
All results which were reported by 11 NMIs/DIs were listed in Table 4 to 9 in ascending
order.
Table 4. Reported Results of Sodium
Institute Reported mass fraction (mg/kg)
Reported std. uncertainty (mg/kg)
Reported expanded uncertainty (mg/kg)
Coverage factor, k
NMIJ 1.29 0.06 0.11 2
UME 1.293 0.045 0.091 2
INTI 5.3 0.4 0.7 2
Table 5. Reported Results of Calcium
Institute Reported mass fraction (mg/kg)
Reported std. uncertainty (mg/kg)
Reported expanded uncertainty (mg/kg)
Coverage factor, k
UME 0.867 0.050 0.100 2
INTI 1.0 0.1 0.2 2
NMIJ 1.01 0.03 0.07 2
Table 6. Reported Results of Potassium
Institute Reported mass fraction (mg/kg)
Reported std. uncertainty (mg/kg)
Reported expanded uncertainty (mg/kg)
Coverage factor, k
NMIJ 0.70 0.02 0.03 2

Page 9 of 44 CCQM-K123
INTI 0.7 0.2 0.5 2
GLHK 0.715 0.035 0.070 2
UME 0.722 0.035 0.070 2
NIMT 0.794 0.019 0.037 2
KEBS 6.69 0.16 0.32 2
Table 7. Reported Results of Magnesium
Institute Reported mass fraction (mg/kg)
Reported std. uncertainty (mg/kg)
Reported expanded uncertainty (mg/kg)
Coverage factor, k
NIMA 0.774 0.024 0.050 2.07
UME 0.782 0.029 0.058 2
GLHK 0.821 0.040 0.080 2
NMIJ 0.84 0.04 0.04 2
INMETRO 0.842 0.0082 0.018 2.2
NIMT 0.866 0.016 0.032 2
INTI 0.9 0.1 0.3 2
KEBS 2.78 0.15 0.31 2
Table 8. Reported Results of Phosphorus
Institute Reported mass fraction (mg/kg)
Reported std. uncertainty (mg/kg)
Reported expanded uncertainty (mg/kg)
Coverage factor, k
NMIJ 1.99 0.05 0.11 2
UME 2.060 0.036 0.071 2
NMIA 2.19 0.11 0.22 2.03
INMETRO 4.51 0.14 0.31 2.26
Table 9. Reported Results of Sulfur
Institute Reported mass fraction (mg/kg)
Reported std. uncertainty (mg/kg)
Reported expanded uncertainty (mg/kg)
Coverage factor, k

Page 10 of 44 CCQM-K123
CENAM 5.85 0.23 0.55 2.36
NMIJ 6.7 0.2 0.5 2
NIST 7.043 0.065 0.137 2.12
BAM 7.394 0.046 0.10 2
INMETRO 7.84 0.112 0.39 2.31
UME 7.93 0.34 0.68 2
The results of K, Mg and Ca show a good agreement between the participants except for
the results of KEBS. Large discrepancies are observed for Na, P and S. The submitted
results from KEBS for K and Mg, from INTI for Na, and from INMETRO for P were
considered as suspected outlying results. KEBS asked to withdraw from the study. The
material was quite challenging and a number of questions were raised at the IAWG
meeting. KEBS, INTI and INMETRO agreed their outlying results should be excluded
for the KCRV estimation. INTI and INMETRO tried to carry out corrective actions
such as technical review and/or additional study for finding the reasons of their
outlying results. The results and some comments made by these institutes are as
follows:
INTI: INTI reported an additional experimental data, which was obtained with the
same experimental conditions and analyst, but it was done on another day. The data are
shown in the following Table.
Sodium,
Mass fraction (mg/kg)
Standard uncertainty
(mg/kg)
Expanded uncertainty
(mg/kg) Coverage factor, k
First set of results (Submitted results) 5.3 0.4 0.7 2
Second set of results 1.8 0.4 0.8 2
INTI submitted the first set of results because when they measured the second set of
results they have not obtained 3 replicates. The two set of results are quite different, but
INTI could not find any reason. It is assumed that the direct introduction of the BDF
sample without the introduction of oxygen brings a sensitivity change by the adherence
of the soot as one possibility.
INMETRO: INMETRO reported that they found a technical problem regarding a blank
Page 11 of 44 CCQM-K123
correction. In their procedure the sample volume was reduced by evaporation and in
this situation the blank correction became important and, for the submitted result, they
didn't apply this correction. After applying this correction, the corrected P result was
1.65 mg/kg ± 0.40 mg/kg (k = 2).
The variation in S results between participants, particularly those using IDMS methods
was discussed at the IAWG meeting. The spread of results is quite large with small
individual uncertainties. The difficulty of weighing the sample was suggested. The
measurements might be correct but the samples measured are assumed to be different
due to challenging sample: the evaporation of the sample during the weighing
procedure as well as a significant blank contribution might affect the sample. This is
specific just for S.
It was suggested that the determination of S in biofuel was challenging and possibly the
particioants have underestimated the uncertainty in this case. Additionally, the
challenges of microwave digestion (Teflon vessels, blanks, etc.) could be a part of the
variability. The question of sample stability was raised, due to the volatility of S
compounds.
Based on the discussions, NMIJ asked the participants who measured S to review the
uncertainties of S. In addition, BAM, NIST and NMIJ were asked to work together on
the S issue and report their findings in IAWG meeting.
CENAM reported transcription errors, and found a problem in the uncertainty
estimation including an important contribution due to bias. The bias corrected value is
6.84 mg/kg ± 1.22 mg/kg (k = 2).
INMETRO reviewed their data and reported that the blank signal for S was not significant
as observed in the P results and the uncertainty did not change.
NMIJ checked a long term stability of the sample (see Figure 1 to 6). Stability is not the
major reason for the discrepancies, because no significant variances were observed
during the storage of 19 months.
BAM, NIST and NMIJ reviewed their experimental conditions, results and/or
uncertainty calculations for IDMS. BAM and NIST provided their raw data for
checking procedure blank levels and signal to background ratios. The signal to back
ground ratio for 32S and 34S are summarized in the following Table.

Page 12 of 44 CCQM-K123
Signal intensity NMIJ BAM NIST
Isotope 32S 34S 32S 34S 32S 34S
Back ground intensity 1191 460 0.0399 0.0030 21159 978
Procedure blank intensity 1741 9457 0.1768 13.4953 12183 3418
Sample intensity 85879 99776 3.1811 10.1170 74980 56764
Sample/Procedure blank 49.3 17.8 6.2
Relative U of the result (%) (k=2) 2.1 1.4 2.7
NIST re-evaluated the uncertainty reflecting S/B. BAM theoretically discussed the
uncertainty contribution introduced by evaporation of the sample during the weighing
process. As an increase of the weighing uncertainty by a factor for 10 would only lead
to an increase in the combined uncertainty of the results from 0.046 mg/kg to 0.07
mg/kg, the uncertainty calculation was not modified. NMIJ improved S/B, reducing
and controlling a procedure blank and memory effects in the sample introduction
device and the plasma torch, and re-analyzed the sample. A digestion blank was
reduced to approximately a one-fifth by improving the washing procedure for digestion
vessels to multiple washing by HNO3 with microwave irradiation. In addition, an
instrumental blank was reduced by optimizing the washing procedure of instrument for
washing with nitric acid and ethanol before sample measurement.
Based on those additional evaluation and investigation, revised results are summarized
in Table 10.
Table 10. Revised Results of Sulfur
Institute Sulfur,
Mass fraction (mg/kg)
Standard uncertainty
(mg/kg)
Expanded uncertainty
(mg/kg) Coverage factor, k
CENAM 6.84 0.61 1.22 2 NMIJ 7.24 0.08 0.15 2 NIST 7.043 0.0946 0.189 2
BAM* 7.394 0.046 0.10 2 INMETRO* 7.84 0.112 0.39 2.31
UME* 7.93 0.34 0.68 2

Page 13 of 44 CCQM-K123
* There is no change in the results of BAM, INMETRO and UME.
The variances between the revised results became smaller than the original one. The
procedure blank (and hence signal-to-noise ratio) was thought to be the main causes of
the original discrepancies. A plot of the revised final results for S with expanded
uncertainty is given in Figure 7. The revised results were overlapping between IDMS
measurements of S content at the k = 2 level. It is not possible to calculate a KCRV with
values being modified after submission. It was concluded that this KC does not support
S measurements.
Figure 7. CCQM K123: Modified Results and Measurement Uncertainties for Sulfur; unit = mg/kg. (The error bars represent the expanded uncertainties for the individual participant’s results.)
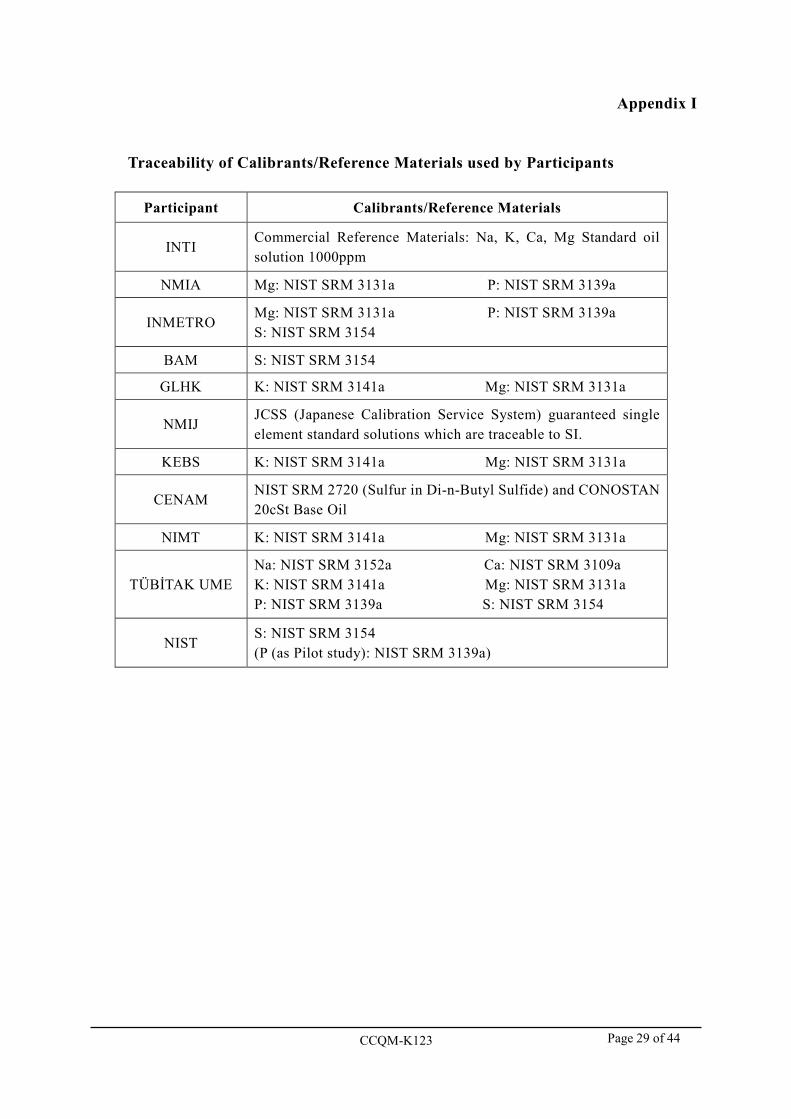
5.2 Traceability of Calibrants used by Participants
Participants were required to provide the information about the traceability of the
reference materials/calibrants they used in this comparison. This information is
summarized in Appendix I.
5.5
6.0
6.5
7.0
7.5
8.0
8.5
9.0
Mas
s fra
ctio
n (m
g/kg
)
UM
E
INM
ETR
O
BA
M
NM
IJ
NIS
T
CE
NA
M

Page 14 of 44 CCQM-K123
5.3 Calculation of the Reference Mass Fraction Value and Associated Uncertainties
In this report, the calculated consensus values and their respective dispersions estimate
using two different location estimators, arithmetic mean and median, were summarized in
Table 11 to 15.
MADE = median absolute deviation (MAD) ×1.483
Table 11. Results of the Calculated Consensus Values and the Respective Dispersion for Sodium (excluding the result of INTI); mg/kg
Measurand Arithmetic mean
Standard deviation Median MADE
Sodium 1.292 0.002 1.292 0.002
Table 12. Results of the Calculated Consensus Values and the Respective Dispersion for Calcium; mg/kg
Measurand Arithmetic mean
Standard deviation Median MADE
Calcium 0.959 0.080 1.000 0.015
Table 13. Results of the Calculated Consensus Values and the Respective Dispersion for Potassium (excluding the result of KEBS); mg/kg
Measurand Arithmetic mean
Standard deviation Median MADE
Potassium 0.726 0.039 0.715 0.022
Table 14. Results of the Calculated Consensus Values and the Respective Dispersion for Magnesium (excluding the result of KEBS); mg/kg
Measurand Arithmetic mean
Standard deviation Median MADE
Magnesium 0.832 0.045 0.840 0.039
Table 15. Results of the Calculated Consensus Values and the Respective Dispersion for

Page 15 of 44 CCQM-K123
Phosphorus (excluding the result of INMETRO); mg/kg
Measurand Arithmetic mean
Standard deviation Median MADE
Phosphorus 2.080 0.101 2.060 0.104
As shown in Table 11 to 15, the significant difference is not found between the
consensus values of the arithmetic mean and the median was observed. NMIJ proposed
that the arithmetic mean for Na, Ca, K and P, and the median for Mg are reasonable as
the KCRV for CCQM-K123, those KCRVs were approved at the IAWG meeting held
November 17-19, 2015.
According to the CCQM Guidance Note [2], the u(KCRV) with the arithmetic mean
and median approach can be calculated using equation (2) and (3) respectively, and the
KCRU can then be calculated by multiplying u(KCRV) by two. The KCRV and KCRU
were shown in Table 16 to 20. (2) (3) where
s(x) is standard deviation of qualified results
m is number of qualified participants
Table 16. The Calculated KCRV and KCRU using the Mean Approach for Sodium
Measurand KCRV
(mg/kg) u(KCRV) (mg/kg)
KCRU (mg/kg)
KCRU (%)
Sodium 1.292 0.001 0.003 0.2 %
Table 17. The Calculated KCRV and KCRU using the Mean Approach for Calcium
Measurand KCRV
(mg/kg) u(KCRV) (mg/kg)
KCRU (mg/kg)
KCRU (%)
mπu
2 MAD(KCRV) E ×=
)((KCRV)mxsu =

Page 16 of 44 CCQM-K123
Calcium 0.959 0.046 0.092 9.6 %
Table 18. The Calculated KCRV and KCRU using the Mean Approach for Potassium
Measurand KCRV
(mg/kg) u(KCRV) (mg/kg)
KCRU (mg/kg)
KCRU (%)
Potassium 0.726 0.017 0.035 4.8 %
Table 19. The Calculated KCRV and KCRU using the Median Approach for Magnesium
Measurand KCRV
(mg/kg) u(KCRV) (mg/kg)
KCRU (mg/kg)
KCRU (%)
Magnesium 0.840 0.018 0.037 4.4 %
Table 20. The Calculated KCRV and KCRU using the Mean Approach for Phosphorus
Measurand KCRV
(mg/kg) u(KCRV) (mg/kg)
KCRU (mg/kg)
KCRU (%)
Phosphorus 2.080 0.059 0.117 5.6 %
For a more convenient review, a graphical presentation of the KCRV, u(KCRV) and the
participants’ results for CCQM K123 is given in Figure 8 to 12.
The error bars represent the combined standard uncertainties for the individual
participant’s results. The horizontal solid red line represents the KCRV, and the red
dashed lines represent KCRV ± u(KCRV). (*the results were not included in the
calculation of the KCRVs)

Page 17 of 44 CCQM-K123
Figure 8. CCQM K123: Participants’ Results and Measurement Uncertainties for Sodium; unit = mg/kg
Figure 9. CCQM K123: Participants’ Results and Measurement Uncertainties for Calcium; unit = mg/kg
1.22
1.24
1.26
1.28
1.30
1.32
1.34
1.36
Mas
s fra
ctio
n (m
g/kg
)
UM
E
INTI
NM
IJ
0.7
0.8
0.9
1.0
1.1
1.2
Mas
s fra
ctio
n (m
g/kg
)
UM
E
INTI
NM
IJ
*

Page 18 of 44 CCQM-K123
Figure 10. CCQM K123: Participants’ Results and Measurement
Uncertainties for Potassium; unit = mg/kg
Figure 11. CCQM K123: Participants’ Results and Measurement Uncertainties for Magnesium; unit = mg/kg
0.65
0.70
0.75
0.80
0.85
UM
E
KE
BS
NIM
T
INTI
GLH
K
NM
IJ
Mas
s fra
ctio
n (m
g/kg
)
0.74
0.78
0.82
0.86
0.90
0.94
Mas
s fra
ctio
n (m
g/kg
)
GLH
K
NM
IJ
UM
E
KE
BS
NIM
T
NM
IA
INM
ETR
O
INTI
*
*
*

Page 19 of 44 CCQM-K123
Figure 12. CCQM K123: Participants’ Results and Measurement Uncertainties for Phosphorus; unit = mg/kg
5.4 Equivalence Statements
The degree of equivalence and its uncertainty of a reported result by a participant
compared to the KCRV were calculated using equations (4) to (5) as follows:
Di = (xi – xR) (4)
Ui2 = (k2ui
2+22uR2) (5)
where Di is the degree of equivalence (DoE) between the result xi and the KCRV xR,
and Ui is the expanded uncertainty (k = 2; declared ones of some participants were not
used.) of Di calculated by both the combined standard uncertainty ui of xi and the
standard uncertainty uR of xR.
The equivalence statements for CCQM K123 based on the calculated KCRV are listed in
Table 21 to 25, and the graphical presentation is given in Figure 13 to 17. Those DoEs
were approved at the IAWG meeting held November 17-19, 2015.
Table 21. Equivalence Statements of sodium for CCQM K123
1.9
2.0
2.1
2.2
2.3
2.4
Mas
s fra
ctio
n (m
g/kg
)
NM
IJ
UM
E
NM
IA
INM
ETR
O*

Page 20 of 44 CCQM-K123
Institute Reported value, xi, mg/kg
Reported std. uncertainty, u(xi),
mg/kg Di Ui
NMIJ 1.29 0.06 -0.002 0.120
UME 1.293 0.045 0.001 0.090
INTI* 5.3 0.4 4.009 0.800
*The result from INTI was not included in the calculations of the KCRV/DoE.
Table 22. Equivalence Statements of calcium for CCQM K123
Institute Reported value, xi, mg/kg
Reported std. uncertainty, u(xi),
mg/kg Di Ui
UME 0.867 0.050 -0.092 0.136
INTI 1.0 0.1 0.041 0.220
NMIJ 1.01 0.03 0.051 0.110
Table 23. Equivalence Statements of potassium for CCQM K123
Institute Reported value, xi, mg/kg
Reported std. uncertainty, u(xi),
mg/kg Di Ui
NMIJ 0.70 0.02 -0.026 0.053
INTI 0.7 0.2 -0.026 0.402
GLHK 0.715 0.035 -0.011 0.078
UME 0.722 0.035 -0.004 0.078
NIMT 0.794 0.019 0.068 0.052
KEBS* 6.69 0.16 5.961 0.320
*The result from KEBS was not included in the calculations of the KCRV/DoE.
Table 24. Equivalence Statements of magnesium for CCQM K123
Institute Reported value, xi, mg/kg
Reported std. uncertainty, u(xi),
mg/kg Di Ui
NMIA 0.774 0.024 -0.066 0.061

Page 21 of 44 CCQM-K123
UME 0.782 0.029 -0.058 0.069
GLHK 0.821 0.040 -0.019 0.088
NMIJ 0.84 0.04 0.000 0.088
INMETRO 0.842 0.0082 0.002 0.040
NIMT 0.866 0.016 0.026 0.049
INTI 0.9 0.1 0.060 0.203
KEBS* 2.78 0.15 1.936 0.309
*The result from KEBS was not included in the calculations of the KCRV/DoE.
Table 25. Equivalence Statements of phosphorus for CCQM K123
Institute Reported value, xi, mg/kg
Reported std. uncertainty, u(xi),
mg/kg Di Ui
NMIJ 1.99 0.05 -0.090 0.154
UME 2.060 0.036 -0.020 0.138
NMIA 2.19 0.11 0.110 0.249
INMETRO* 4.51 0.14 2.430 0.304
*The result from INMETRO was not included in the calculations of the KCRV/DoE.
Figure 13. Equivalence Statements of sodium for CCQM K123
-0.2
-0.1
0.0
0.1
0.2
0.3
0.4
Di=
(xi-
x R) /
(m
g/kg
)
UM
E
INTI
NM
IJ

Page 22 of 44 CCQM-K123
Figure 14. Equivalence Statements of calcium for CCQM K123
Figure 15. Equivalence Statements of potassium for CCQM K123
-0.3
-0.2
-0.1
0.0
0.1
0.2
0.3
Di=
(xi-
x R) /
(µg
/kg)
UM
E
INTI
NM
IJ
Di=
(xi-
x R) /
(m
g/kg
)
UM
E
KE
BS
NIM
T
INTI
GLH
K
NM
IJ
-0.4
-0.3
-0.2
-0.1
0.0
0.1
0.2
0.3
0.4

Page 23 of 44 CCQM-K123
Figure 16. Equivalence Statements of magnesium for CCQM K123
Figure 17. Equivalence Statements of phosphorus for CCQM K123
-0.2
-0.1
0.0
0.1
0.2
Di=
(xi-
x R) /
(m
g/kg
)
GLH
K
NM
IJ
UM
E
KE
BS
NIM
T
NM
IA
INM
ETR
O
INTI
-0.4
-0.3
-0.2
-0.1
0.0
0.1
0.2
0.3
0.4
Di=
(xi-
x R) /
(µg
/kg)
NM
IJ
UM
E
NM
IA
INM
ETR
O

Page 24 of 44 CCQM-K123
In terms of S, it is not possible to calculate a KCRV with values being modified after
submission. However, it is useful for the participant of this KC that the equivalence
statements of S are described for the purpose of reference, because the revised results
were overlapping between IDMS measurements at the k = 2 level (see Table 10 and
Figure 7). The degree of equivalence and its uncertainty of a revised result by a
participant compared to the reference value (mean) were calculated. And its results are
listed in Table 26 and 27, and the graphical presentation is given in Figure 18.
Table 26. The Calculated Reference Value and its Expanded Uncertainty (k=2) using the Mean Approach for Sulfur (revised results (see Table 10) were used for calculation)
Measurand
Arithmetic Mean (mg/kg) (as reference value: RV)
u(RV) (mg/kg)
Expanded uncertainty
(mg/kg)
Expanded uncertainty
(%)
Sulfur 7.381 0.177 0.354 4.8 %
Table 27. Equivalence Statements of Sulfur
Institute Reported or
modified value, xi, mg/kg
Reported or modified std. uncertainty,
u(xi), mg/kg Di Ui
CENAM 6.84 0.61 -0.541 1.270
NIST 7.24 0.08 -0.338 0.401
NMIJ 7.043 0.0946 -0.141 0.388
BAM 7.394 0.046 0.013 0.366
INMETRO 7.84 0.112 0.459 0.419
UME 7.93 0.34 0.549 0.767

Page 25 of 44 CCQM-K123
Figure 18. Equivalence Statements of sulfur for the purpose of reference (revised results (see Table 10) were used)
-2.0
-1.5
-1.0
-0.5
0.0
0.5
1.0
1.5
2.0
Di=
(xi-
x R) /
(m
g/kg
)
BA
M
UM
E
INM
ETR
O
NIS
T
NM
IJ
CE
NA
M

Page 26 of 44 CCQM-K123
6. Demonstration of Core Capabilities
As agreed by the CCQM IAWG meetings, a system of Core Capabilities (CC) for
inorganic analysis will be employed to improve the efficiency and effectiveness of key
comparisons to support CMC claims. With the use of this system, new CMC claims can
be supported by describing CC that are required to provide the claimed measurement
service and by referencing CC that were successfully demonstrated by participation in
relevant key/supplementary comparisons. In this connection, all participants submitted
their Inorganic CC Tables to the coordinator for compilation, and they are summarized
four Summary Tables in the Appendix II.
It is expected that sodium, calcium, potassium, magnesium and phosphorus at mass
fractions greater than approximately 0.1 mg/kg, 0.1 mg/kg, 0.05 mg/kg, 0.05 mg/kg and
0.1 mg/kg respectively in biodiesel fuel and similar matrices (fuels and oils etc.) can be
determined by each participant using the same technique(s) employed for this key
comparison to achieve similar uncertainties mentioned in the present report.
7. Conclusions
The KCRVs and DoEs were approved for Na, Ca, K, Mg and P (except S) at the IAWG
meeting held at Teddington, UK in 2015.
Results were submitted by 11 NMIs and DIs. The participants used different
measurement methods, though most of them used inductively coupled plasma-mass
spectrometry (ICP-MS), isotope dilution technique with ICP-MS and inductively coupled
plasma-optical emission spectrometry (ICP-OES) with microwave acid digestion.
The results of K, Mg and Ca shows good agreement except them of KEBS. Large
discrepancies are observed for Na, P and S. The submitted results from KEBS for K and
Mg, from INTI for Na, and from INMETRO for P were considered as suspected outlying
results, they agreed their outlying results should be excluded for the KCRV estimation.
The material was quite challenging and a number of questions were raised at the IAWG
meeting. Concerning S, the variation in S results between participants, particularly those
using IDMS methods was discussed at the IAWG meeting. BAM, NIST and NMIJ
reviewed their experimental conditions, results and/or uncertainty calculations for IDMS.

Page 27 of 44 CCQM-K123
According to the additional evaluation and investigation, the variances between the
revised results became smaller than the original one. The revised results were
overlapping between IDMS measurements of S content at the k = 2 level. The procedure
blank (and hence signal-to-noise ratio) was thought to be the main causes of the original
discrepancies. It was concluded that this KC does not support S measurements.
Accounting for relative expanded uncertainty, comparability of measurement results for
each of Na, Ca, K, Mg and P was successfully demonstrated by the participating NMIs or
DIs. Furthermore, the results of this key comparison can be utilized along with the IAWG
core capability approach.

Page 28 of 44 CCQM-K123
Acknowledgement
We would like to express the most sincere gratitude for the effort and supports from the
contact persons and/or analysts of the participating NMIs/DIs.
Institute Contact person and/or analysts INTI Mabel Puelles, Mónica Borinsky, Nadia Hatamleh
NMIA John Murby, Jeffrey Merrick, Ian White, David Saxby
INMETRO Rodrigo Caciano de Sena, Marcelo Dominguez de Almeida
BAM Jochen Vogl, Pranee Phukphatthanachai, Dorit Becker, Maren Koenig
GLHK Wai-hong FUNG, Ho-pan YAU
NMIJ Yanbei Zhu, Kazumi Inagaki
KEBS TOM ODUOR OKUMU, JACQUELINE NJERI KANG'IRI, TABITHA OWITI ORWA
CENAM José Antonio Salas Téllez, Edith Zapata Campos, Esther Castro Galván
NIMT Nattikarn Kaewkhomdee, Sutthinun Taebunpakul, Usana Thiengmanee, Charun Yafa
TÜBİTAK UME Nilgün TOKMAN, Murat TUNÇ, Süleyman Z. CAN
NIST Stephen Long, Steven Christopher
We would like to thank Dr. Mike Sargent for providing guidance throughout the course of
this study.
References
1. International Standards Organization, ISO Guide 35: Reference materials – General
and statistical principles for certification, Geneva, Switzerland, 2006.
2. CCQM Guidance Note: Estimation of a consensus KCRV and associated Degrees of
Equivalence, Version 10, 2013.
Page 29 of 44 CCQM-K123
Appendix I
Traceability of Calibrants/Reference Materials used by Participants
Participant Calibrants/Reference Materials
INTI Commercial Reference Materials: Na, K, Ca, Mg Standard oil solution 1000ppm
NMIA Mg: NIST SRM 3131a P: NIST SRM 3139a
INMETRO Mg: NIST SRM 3131a P: NIST SRM 3139a S: NIST SRM 3154
BAM S: NIST SRM 3154
GLHK K: NIST SRM 3141a Mg: NIST SRM 3131a
NMIJ JCSS (Japanese Calibration Service System) guaranteed single element standard solutions which are traceable to SI.
KEBS K: NIST SRM 3141a Mg: NIST SRM 3131a
CENAM NIST SRM 2720 (Sulfur in Di-n-Butyl Sulfide) and CONOSTAN 20cSt Base Oil
NIMT K: NIST SRM 3141a Mg: NIST SRM 3131a
TÜBİTAK UME Na: NIST SRM 3152a Ca: NIST SRM 3109a K: NIST SRM 3141a Mg: NIST SRM 3131a P: NIST SRM 3139a S: NIST SRM 3154
NIST S: NIST SRM 3154 (P (as Pilot study): NIST SRM 3139a)

Page 30 of 44 CCQM-K123
Appendix II
Inorganic Core Capabilities Summary Table
CCQM Study: K123 Trace Elements in Biodiesel Fuel Institute(s): NMIA, BAM, NMIJ, NIMT, NIST Method: ID-ICP-MS Analyte(s): K, Mg, Ca, S Capabilities/Challenges Not tested Tested Specific challenges encountered Contamination control and correction All techniques and procedures employed to reduce potential contamination of samples as well as blank correction procedures. The level of difficulty is greatest for analytes that are environmentally ubiquitous and also present at very low concentrations in the sample.
NMIJ (K, Mg, Ca) NIMT (K, Mg)
NMIA (Mg) BAM (S) NMIJ (S) NIST (S)
Ubiquitous element requires contamination control (NMIA) S blank levels are relatively high in all reagents; special care has to be taken to achieve sufficiently low procedure blanks (BAM) Contamination from the digestion vessels. (NMIJ) Used appropriate blank for calibration standards and unspiked procedural blank to correct for 32S and 34S background counts for different sample types; six IDMS blanks processed to establish blank correction for the K123 and control sample aliquots (NIST)
Digestion/dissolution of organic matrices All techniques and procedures used to bring a sample that is primarily organic in nature into solution suitable for liquid sample introduction to the ICP.
NIMT (K, Mg) NMIA (Mg) BAM (S) NMIJ (K, Mg, Ca, S) NIST (S)
Decomposition of organic sample matrix (NMIA) It is necessary to use the maximum digestible mass of fuel (0.25 g) in order to increase the analyte mass to be used for measurements (BAM) Acid digestion applied. (NMIJ) Closed vessel microwave digestion using nitric acid/peroxide cocktail; slow 35W/min ramp to minimize pressure spikes in vessels (NIST)
Digestion/dissolution of inorganic matrices All techniques and procedures used to bring a sample that is primarily inorganic in nature into solution suitable for liquid sample introduction to the ICP.
All
Volatile element containment All techniques and procedures used to prevent the loss of potentially volatile analyte elements during sample treatment and storage.
NMIA (Mg) NMIJ (K, Mg, Ca) NIMT (K, Mg)
BAM (S) NMIJ (S) NIST (S)
Addition of Na to the final solutions to prevent loss of S in the desolvation system (BAM) Closed vessel microwave digestion; use of control of similar matrix (SRM 2773) to verify recovery of S (NIST)
Pre-concentration Techniques and procedures used to increase the
All

Page 31 of 44 CCQM-K123
Capabilities/Challenges Not tested Tested Specific challenges encountered concentration of the analyte introduced to the ICP. Includes evaporation, ion-exchange, extraction, precipitation procedures, but not vapor generation procedures.
Vapor generation Techniques such as hydride generation and cold vapor generation used to remove the analyte from the sample as a gas for introduction into the ICP.
All
Matrix separation Techniques and procedures used to isolate the analyte(s) from the sample matrix to avoid or reduce interferences caused by the matrix. Includes ion-exchange, extraction, precipitation procedures, but not vapor generation procedures. Techniques and procedures used to isolate the analyte(s) from the sample matrix to avoid or reduce interferences caused by the matrix. Includes ion-exchange, extraction, precipitation procedures, but not vapor generation procedures.
NMIA (Mg) NMIJ (K, Mg, Ca, S) NIMT (K, Mg) NIST (S)
BAM (S) Separation procedure need to be optimized in order to reduce the blank contribution (BAM)
Spike equilibration with sample The mixing and equilibration of the enriched isotopic spike with the sample.
NMIJ (K, Mg, Ca, S) NIMT (K, Mg)
NMIA (Mg) BAM (S) NIST (S)
No challenge (BAM) Essential for accurate IDMS and needed to mix well (NIMT) Loss of spike is minimized using closed vessel digestion and slow 35 W/min ramp rate to digest oil samples (avoidance of pressure spikes, which could lead to loss of sample) (NIST)
Signal detection The detection and recording of the analyte isotope signals. The degree of difficulty increases for analytes present at low concentrations, of low isotopic abundance, or that are poorly ionized.
NMIJ (K, Mg, Ca, S) NIST (S)
NMIA (Mg) BAM (S) NIMT (K, Mg)
No challenge (BAM) sample was diluted to determine Mg and K. (NIMT)
Memory effect Any techniques used to avoid, remove or reduce the carry-over of analyte between consecutively measured standards and/or samples.
NMIJ (K, Mg, Ca) NIMT (K, Mg)
NMIA (Mg) BAM (S) NMIJ (S) NIST (S)
Longer washout times (NMIA) No challenge (BAM) Blanks interspersed periodically between blocks of samples; count rates monitored for repeatedly run blanks indicated no cross contamination. Blanks interspersed between each abundance measurement run for SRM 2773, K123, SRM 3154 and 34S spike (NIST)
Correction or removal of isobaric/polyatomic interferences Any techniques used to remove, reduce, or mathematically correct for interferences caused by mass overlap of analyte isotopes with isobaric or polyatomic species. Includes
All O- and N-based interferences require high mass resolution and the application of desolvation systems to reduce the interferences (BAM) S: ICP-QMS/QMS with ORC was applied and 32S+ was measure as 32S16O+

Page 32 of 44 CCQM-K123
Capabilities/Challenges Not tested Tested Specific challenges encountered collision cell techniques, high resolution mass spectrometry, or chemical separations. The relative concentrations and sensitivities of the analyte isotopes and the interfering species will affect the degree of difficulty.
Ca, and K, cool plasma and H2/O2 reaction was applied to get rid of the spectral interferences from argon ions (NMIJ) Use NH3 as dynamic reaction gas to remove interference. (NIMT) Medium resolution ICP-MS with a resolution > 4500 at m/z 115 (In) > 5000 at m/z 59 (Co) tested using 1 ppb tune solution. This resolution is adequate to resolve all polyatomic and isobaric interferences at sulfur m/z 32, 33, 34 (NIST)
Detector deadtime correction Measurement of, and correction for, ion detector deadtime. Importance increases in situations where high ion count rates are encountered.
BAM (S) NMIJ (K, Mg, Ca, S) NIMT (K, Mg)
NMIA (Mg) NIST (S)
10 nS; minimal effect due to low count rates; uncertainty due to deadtime correction modeled for 10 +/- 1 nS using typical count rates encountered for analyzed samples (NIST)
Mass bias/fractionation control and correction Techniques used to determine, monitor, and correct for mass bias/fractionation.
All Matching for double IDMS (NMIA) No challenge (BAM) Use standard solution to monitor mass bias (NIMT) SRM 3154 measured at beginning and end of experiment to establish a mass bias correction factor using an absolute 32/34 ratio of 22.5667, and a repeat measures spike calibration solution used to track mass bias drift throughout the experiment; "Absolute" S ratios for 3154 From Key comparison K35 or ref 10 therein. Mann, J. L. and Kelly, W. R. (2005) Measurement of Sulfur Isotopic Composition by Multi-Detector Thermal Ionization Mass Spectrometry (MD-TIMS) Using a 33S-36S Double Spike, Rapid Commun. Mass Spectrom. 19, 3429-3441 (NIST)
Spike calibration Techniques used to determine the analyte concentration in the enriched isotopic spike solution.
All Double IDMS (NMIA) No challenge (BAM) Double ID-ICP-MS was applied (NMIJ) Reverse IDMS to calibrate the isotopic spike (NIMT) Reverse IDMS: Four back-spike calibration blends using SRM 3154 and 34S spike (NIST)

Page 33 of 44 CCQM-K123
Inorganic Core Capabilities Summary Table
CCQM Study: K123 Trace Elements in Biodiesel Fuel Institute(s): NMIA, GLHK, NMIJ, TÜBİTAK UME Method: ICP-MS (without Isotope Dilution) Analyte(s): Na, K, Mg, Ca, P, S
Capabilities/Challenges Not tested Tested Specific challenges encountered Contamination control and correction All techniques and procedures employed to reduce potential contamination of samples as well as blank correction procedures. The level of difficulty is greatest for analytes that are environmentally ubiquitous and also present at very low concentrations in the sample.
All Ubiquitous element requires contamination control. (NMIA) Na, contamination from the ICP torch. P, leak from the digestion vessel. (NMIJ) Special cleaning procedures were applied for cleaning the labware for elements of Na, Ca, K and Mg. (UME)
Digestion/dissolution of organic matrices All techniques and procedures used to bring a sample that is primarily organic in nature into solution suitable for liquid sample introduction to the ICP.
All Decomposition of organic sample matrix (NMIA) A microwave program was applied. 0.2 g of sample was digested with 5 mL of HNO3. (UME)
Digestion/dissolution of inorganic matrices All techniques and procedures used to bring a sample that is primarily inorganic in nature into solution suitable for liquid sample introduction to the ICP.
NMIA (P) NMIJ (Na, P) UME (Na, K, Mg, Ca, P, S)
GLHK (K)
Volatile element containment All techniques and procedures used to prevent the loss of potentially volatile analyte elements during sample treatment and storage.
NMIA (P) GLHK (K) NMIJ (Na, P) UME (Na, K, Mg, Ca, P)
UME (S) Quartz vessels were employed during the microwave digestion to prevent the loss of analyte through the PTFE vessels. (UME)
Pre-concentration Techniques and procedures used to increase the concentration of the analyte introduced to the ICP. Includes evaporation, ion-exchange, extraction, precipitation procedures, but not vapor generation procedures.
All
Vapor generation Techniques such as hydride generation and cold vapor generation used to remove the analyte from the sample as a gas for introduction into the ICP.
All
Matrix separation Techniques and procedures used to isolate the analyte(s) from the sample matrix to avoid or reduce interferences caused by the matrix. Includes ion-exchange, extraction, precipitation procedures, but not vapor generation
All

Page 34 of 44 CCQM-K123
Capabilities/Challenges Not tested Tested Specific challenges encountered procedures. Techniques and procedures used to isolate the analyte(s) from the sample matrix to avoid or reduce interferences caused by the matrix. Includes ion-exchange, extraction, precipitation procedures, but not vapor generation procedures. Calibration of analyte concentration The preparation of calibration standards and the strategy for instrument calibration. Includes external calibration and standard additions procedures.
All Gravimetric Standard Addition Standard addition applied to get rid of the matrix effects. (NMIJ) Matrix matched calibration standards were prepared. (UME)
Signal detection The detection and recording of the analyte isotope signals. The degree of difficulty increases for analytes present at low concentrations, of low isotopic abundance, or that are poorly ionized.
UME (Na, K, Mg, Ca, P, S)
NMIA (P) GLHK (K) NMIJ (Na, P)
P has high first ionization energy and hence low ICPMS sensitivity (NMIA)
Memory effect Any techniques used to avoid, remove or reduce the carry-over of analyte between consecutively measured standards and/or samples.
NMIJ (Na, P) UME (Na, K, Mg, Ca, P, S)
NMIA (P) GLHK (K)
Longer washout times (NMIA)
Correction or removal of isobaric/polyatomic interferences Any techniques used to remove, reduce, or mathematically correct for interferences caused by mass overlap of analyte isotopes with isobaric or polyatomic species. Includes collision cell techniques, high resolution mass spectrometry, or chemical separations. The relative concentrations and sensitivities of the analyte isotopes and the interfering species will affect the degree of difficulty.
NMIJ (Na) NMIA (P) GLHK (K) NMIJ (P) UME (Na, K, Mg, Ca, P, S)
Plasma based polyatomic interferences (NO+, NOH+) (NMIA) ICP-QMS/QMS with ORC was applied and 31P+ was measure as 31P16O+ (NMIJ) All measurements were performed medium resolution mode of HR-ICPMS instrument. The spectra were checked for any trace of isobaric interferences. (UME)
Correction or removal of matrix-induced signal suppression or enhancement Chemical or instrumental procedures used to avoid or correct for matrix-induced signal suppression or enhancement.
GLHK (K) NMIA (P) NMIJ (Na, P) UME (Na, K, Mg, Ca, P, S)
Standard addition methodology used (NMIA) Standard addition (NMIJ) Matrix matched calibration standards were prepared. Use of internal standard helps to prevent possible effects resulting from matrix-induced signal suppression. (UME)
Detector deadtime correction Measurement of, and correction for, ion detector deadtime. Importance increases in situations where high ion count rates are encountered.
NMIJ (Na, P) UME (Na, K, Mg, Ca, P, S)
NMIA (P) GLHK (K)
Mass bias/fractionation control and correction Techniques used to determine, monitor, and correct for mass bias/fractionation.
All

Page 35 of 44 CCQM-K123
Inorganic Core Capabilities Summary Table
CCQM Study: K123 Trace Elements in Biodiesel Fuel Institute(s): INTI, INMETRO, GLHK, Method: ICP-OES Analyte(s): Na, K, Mg, Ca, P, S
Capabilities/Challenges Not tested Tested Specific challenges encountered Contamination control and correction All techniques and procedures employed to reduce potential contamination of samples as well as blank correction procedures. The level of difficulty is greatest for analytes that are environmentally ubiquitous and also present at very low concentrations in the sample.
INTI (Na, K, Mg, Ca)
INMETRO (Mg, P, S) GLHK (Mg)
Mg: special care was taken to avoid contamination. All samples and controls were digested with high purity nitric acid. Blanks below limit of quantification. (INMETRO)
Digestion/dissolution of organic matrices All techniques and procedures used to bring a sample that is primarily organic in nature into solution suitable for liquid sample introduction to the ICP.
All We tried to match the viscosity between the points of the curve and sample using kerosene as diluent (INTI) The sample was digested using high pressure asher. This procedure allowed increasing the amount of sample used. (INMETRO)
Digestion/dissolution of inorganic matrices All techniques and procedures used to bring a sample that is primarily inorganic in nature into solution suitable for liquid sample introduction to the ICP.
INTI (Na, K, Mg, Ca)
INMETRO (Mg, P, S) GLHK (Mg)
After the digestion the samples were evaporated for reducing the amount of acid. At the final, it was observed a white solid that was soluble in dilute acid. (INMETRO)
Volatile element containment All techniques and procedures used to prevent the loss of potentially volatile analyte elements during sample treatment and storage.
All
Pre-concentration Techniques and procedures used to increase the concentration of the analyte introduced to the ICP. Includes evaporation, ion-exchange, extraction, precipitation procedures, but not vapor generation procedures.
All
Vapor generation Techniques such as hydride generation and cold vapor generation used to remove the analyte from the sample as a gas for introduction into the ICP.
All
Matrix separation Techniques and procedures used to isolate the analyte(s) from the sample matrix to avoid or reduce
All

Page 36 of 44 CCQM-K123
Capabilities/Challenges Not tested Tested Specific challenges encountered interferences caused by the matrix. Includes ion-exchange, extraction, precipitation procedures, but not vapor generation procedures. Techniques and procedures used to isolate the analyte(s) from the sample matrix to avoid or reduce interferences caused by the matrix. Includes ion-exchange, extraction, precipitation procedures, but not vapor generation procedures. Calibration of analyte concentration The preparation of calibration standards and the strategy for instrument calibration. Includes external calibration and standard additions procedures.
All All parameters involved in the measurement method of standard addition were optimized (INTI) Gravimetric Standard Addition (GLHK)
Signal detection The detection and recording of the analyte signals. The degree of difficulty increases for analytes present at low concentrations, or that are have weak emission lines..
All We chose the wavelengths more intense and less interfered. In addition we measured in axial mode because of the increased measurement sensitivity (INTI) Mg: special attention due to the low concentration. S and P: special attention due to low analytical signal. High efforts to improve the recovery tests. (INMETRO)
Memory effect Any techniques used to avoid, remove or reduce the carry-over of analyte between consecutively measured standards and/or samples.
INMETRO (Mg, P, S)
INTI (Na, K, Mg, Ca) GLHK (Mg)
To reduce memory effect it was evaluated the required washing time between measurements (INTI)
Complex spectral backgrounds Any techniques used to remove, reduce, or mathematically correct for interferences caused by the overlap of analyte emission lines with atomic, ionic, or molecular emission from matrix components. The relative concentrations and sensitivities of the analyte and the interfering species will affect the degree of difficulty. Samples containing high concentration matrix components with large numbers of emission lines or molecular bands may increase the measurement challenge.
All
Correction or removal of matrix-induced signal suppression or enhancement Chemical or instrumental procedures used to avoid or correct for matrix-induced signal suppression or enhancement. High concentrations of acids, dissolved solids, or easily ionized elements will increase the degree of difficulty.
GLHK (Mg) INTI (Na, K, Mg, Ca) INMETRO (Mg, P, S)
The correction of the sample matrix was performed using the standard addition method (INTI) To reduce the matrix effect, the methods were optimized and robust conditions were used. (INMETRO)

Page 37 of 44 CCQM-K123
Inorganic Core Capabilities Summary Table
CCQM Study: K123 Trace Elements in Biodiesel Fuel Institute(s): CENAM Method: XRF Analyte(s): S
Capabilities/Challenges Not tested Tested Specific challenges encountered Sample preparation Procedures used to prepare samples for measurement; compressed powder samples, vitrification of samples, reconstitution, determination of the dry mass basis; procedures to minimize sample loss during preparation; procedures to minimize contamination with the elements of interest.
X The difference in the matrix could be the responsible for the bias obtained of the certificated value of the control used during the measurement. We made dilutions of the sample and the control (SRM 2773 with animal matrix) with mineral oil (same used at the calibration curve) in order to match the matrix and get better results. The results for the control were better because they show the decreased in bias. But for the measurement by XRF was necessary to use 3.5 g of sample, so we don´t have much sample to make more dilutions because we had to get at least 6 measurements. However with the only measurement that we made with the diluted sample, the fraction mass of sulfur were not so different than the results with the samples no diluted.
Standards preparation The preparation of calibration standards and the strategy for instrument calibration. Includes external calibration, standard additions procedures or reconstitution. This comprises the procedures used to prepare the element standards or other comparators. (e.g., low difficulty for use of pure elements or compounds; higher difficulty for procedures involving dissolution or vitrification.)
X Other possible cause of the bias of the value of the control material could be the big dilution of the di-n- butyl sulfide (SRM 2720) from 291.1 mg/g to 10 mg/kg in order to prepare a calibration curve in a low range (2 mg/kg -10 mg/kg). However the method validation of the sulfur measurements in fossil fuels by XRF that have been performed at CENAM have determined that the dilution of until 1 mg/kg for the calibration curve, was not influent to get values of sulfur in around 8 mg/kg (Pilot Study CCQM P26.1) in fossil fuels.
Contamination control and correction All techniques and procedures employed to reduce potential contamination of samples as well as blank correction procedures. The level of difficulty is greatest for analytes that are environmentally ubiquitous and
X Blank measurements during measurement sequence demonstrated that if there was the possible environmental contamination, this could be at levels less than 1 mg/kg and for XRF measurements, it was not of influence.

Page 38 of 44 CCQM-K123
Capabilities/Challenges Not tested Tested Specific challenges encountered also present at very low concentrations in the sample. Monitoring of concentration changes Techniques and procedures used to increase or to decrease the concentration of the analyte introduced prior to measurement with XRF. Includes evaporation, extraction, precipitation procedures, or diluting the sample material in wax for sample preparation.
X As it was mentioned before, in order to match the matrix between sample and calibration curve, it was made a dilution of the sample but the improvement that we saw were minimal. In the other hand, all the measurements were made at the same instantly of open the container in order to avoid changes in the relation of sulfur and the matrix. Additionally, in the method validation, previous experiments made demonstrated that matrix based oil could keep the sulfur much better and the evaporation was minimal.
Measurement setup Special setup associated with the specific methods of measurements (quantitative measurement, fundamental parameter based analysis, reconstitution analysis or standard addition) for XRF. (setting of: type of collector, spectral line, crystal, collimator, filter, mV, mA, peak areas, background, measurement time)
X We use like sample support a film of 3.6 µm of gauge in order to increase the signal of sulfur to the detector. The measurements were made using 30 kV, 60 mA, Analyzing Crystal of Ge (Germanium), collimator of 550 µm, Flow detector, 72 seconds for the measurement peak, in order to measure the spectral line Kα of sulfur at angular position of 110.6870 grades 2θ.
Data evaluation Procedures used to check intensities, background and peak areas. (e.g., high difficulty for small peak areas on complex backgrounds or determination of areas for multiple unresolved peaks.)
X Use of certified reference materials as control and verification.

Page 39 of 44 CCQM-K123
Appendix III
CCQM-K123 & P157 Key comparison & Pilot study on “Trace elements in biodiesel fuel”
Call for participants and technical protocol
(revised, May 2, 2014) Introduction Interest in biofuels and their utilization increase all over the world and their market has been expanding. Asian countries and economic are actively promoting the introduction of biofuels; especially, Southeast Asian countries are actively promoting to introduce biodiesel fuel (BDF) as Fatty Acid Methyl Ester (FAME). However, the low-quality biofuels raise serious concerns regarding the effect on engine performance caused by fuel impurities and the oxidation. Therefore, quality control of biofuels in the actual market is very important. A Key Comparison (KC) had been carried out for Cu in bioethanol fuel (CCQM-K100). However, no study for the measurement of elements in BDF has been undertaken. Though regulations for quality control of BDF are varying from region to region, some elements in BDF are regulated in most of standards. Therefore, establishment of metrological traceability and international comparability by performing a KC is important. NMIJ has started a project related to BDF in collaboration with NIST and development of a BDF CRM for analysis of water, methanol, and some elements. NMIJ & NIST proposed a CCQM KC (and a parallel pilot study) of trace elements using the candidate BDF CRM as comparison material at the Inorganic Analysis Working Group (IAWG) meeting held on November 5-6, 2013.. At the CCQM meeting following the IAWG meeting, the proposal was agreed as CCQM-K123 and CCQM-P157. The measurands were chosen from regulated elements in most of standards. This study will investigate the core capabilities of participants to measure the content of tested elements in BDF. Each participant could use the results of this study as evidence not only for their CMC claims for elements in BDF but also their related CMC claims for elements in similar matrices (fuels and oils) and/or others through a Core Capability Table. Sample The comparison material is a BDF (FAME) candidate CRM. Target metals (Na, K, Mg, Ca), P and S were added as fatty acid salts, phospholipid, and dibutyl sulfide, respectively. The sample was sealed in ampoules by 15 mL each. The measurands to be determined are the mass fractions of Na, Ca, P, S, K, and Mg. Those nominal values are 0.5 mg/kg to 10 mg/kg for all measurands. Each participant will receive two ampoules containing approximately 15 mL of the BDF.

Page 40 of 44 CCQM-K123
Participants are required to confirm the receipt of the sample, and send the return receipt to NMIJ (Takayoshi Kuroiwa) by e-mail. If there is any damage, NMIJ will send others samples. A receipt form will be distributed to participants. The homogeneity of the material was investigated by analyzing 10 bottles selected from the lot of 350 bottles. The data were treated with ANOVA. The relative standard uncertainties due to between-bottle homogeneity for Na, Ca, P, S, K, and Mg were found to be 0.3 %, 0.3 %, 1.6 %, 0.7 %, 0.6 %, and 0.4 %, respectively. The sample after receiving should be kept at the laboratory temperature (15 °C to 25 °C). Methods of Measurement Each participant can use any suitable method(s) of measurement. NMIs or officially designated institutes are welcome to participate in this comparison using primary methods of measurement. Four measurements for each measurand are to be carried out by each participant. The calibrations should be carried out by using standards with metrological traceability. Each reference value will be probably a median of the submitted data from NMIs and officially designated institutes, though it will be decided after discussion in an IAWG meeting. If any participant submitted individual results by multiple methods, their best result (i.e., with the smallest uncertainty) will be chosen to calculate the reference value. Report of results and core capability assessment The result should be reported as the mass fraction of each measurand to NMIJ (Takayoshi Kuroiwa), accompanied by a full uncertainty budget. Any participant that chooses to use multiple methods can decide only one composite result (e.g., an average value from different methods) or individual results from different methods as the reporting value(s) for each measurand. Reporting the details of the procedure (including details of sample treatment/digestion etc.), the calibration standard and the traceability link, and the instrument(s) used is required. A reporting form will be distributed to participants. Furthermore, all participants in CCQM-K123 are required to complete a Core Capability Table for the measurement technique which they use. Please choose and download a suitable Core Capability Table from the IAWG website and the filled-out table should be submitted together with the measurement result; if there is no suitable table, please make a suitable one depending on the measurement method. Time schedule Deadline of registration of participation: May 23, 2014 Dispatch of the samples: June, 2014 Deadline for receiving results: September 19, 2014 First discussion on results: Autumn IAWG meeting, 2014 Participants Participation is open to all interested NMIs or officially designated institutes that can perform the determination. An NMI or an officially designated institute is

Page 41 of 44 CCQM-K123
recommended to participate in the key comparison rather than in the pilot study as far as possible. Under the rule of CCQM, an NMI or an officially designated institute may nominate other institutes or laboratories to participate in the pilot study. Please inform NMIJ (Takayoshi Kuroiwa) of the contact person, the shipping address, and so on using the attached registration form. Registration Please register no later than May 23, 2014 using attached form. Coordinating laboratories The CCQM-K123 & P157 are coordinated by NMIJ (Takayoshi Kuroiwa, Akiharu Hioki and Yanbei Zhu) and NIST. Contact persons Dr. Takayoshi KUROIWA National Metrology Institute of Japan (NMIJ) AIST Tsukuba Central 3-9, 1-1-1, Umezono, Tsukuba, Ibaraki, 305-8563, JAPAN E-mail: [email protected] Phone & Fax: +81-29-861-6889 Dr. Yanbei ZHU E-mail: [email protected]

Page 42 of 44 CCQM-K123
Registration form
CCQM-K123 and P157
Trace elements in biodiesel fuel (Coordinated by NMIJ and NIST)
If you would like to participate, please fill in the Table below.
Element Participation in CCQM-K123 or P157 (Please fill in K or P)
Na Ca P S K
Mg Name of contact person (including title): Institute: Acronym of Institute (if available):
Address (for shipping): Country:
E-mail: Phone: Fax: Date: Signature (if possible):
Please complete this registration form and return it by e-mail no later than 23 May 2014 to:
Dr. Takayoshi KUROIWA
National Metrology Institute of Japan (NMIJ) E-mail: [email protected]
Phone & Fax: +81-29-861-6889

Page 43 of 44 CCQM-K123

Page 44 of 44 CCQM-K123

Page 45 of 44 CCQM-K123