Embed Size (px)
Citation preview

© 2015 IBM Corporation
Trace-based JIT Compilation Hiroshi Inoue, IBM Research - Tokyo
IBM Research - Tokyo
1

© 2015 IBM Corporation
IBM Research - Tokyo
Trace JIT vs. Method JIT
2
https://twitter.com/yukihiro_matz/status/533775624486133762

© 2015 IBM Corporation
IBM Research - Tokyo
3
Background: Trace-based Compilation
Using a Trace, a hot path identified at runtime, as a basic unit
of compilation
method f method entry
return
if (x != 0)
rarely executed
while (!end)
do something
frequently executed

© 2015 IBM Corporation
IBM Research - Tokyo
4
Background: Trace-based Compilation
Using a Trace, a hot path identified at runtime, as a basic unit
of compilation
method f method entry
a hot path return
if (x != 0)
frequently executed
while (!end)
trace exit
trace exit (side exit)
trace entry trace A
include only a hot path
if (x != 0)
rarely executed
while (!end)
do something
frequently executed
Trace selection:
how to form good
compilation scope

© 2015 IBM Corporation
IBM Research - Tokyo
A Brief History of Trace-based Compilation (1)
Trace-based compilation was first introduced by binary
translators and optimizers
–because method structures are not available in binaries
–e.g. Dynamo (PLDI’00), BOA/DAISY (MICRO’99 etc.)
Dynamo demonstrated optimization potentials
–average 10% speedup over binaries compiled at –O level
–improvements came mostly from better code layout and
simple folding
Trace-based compilation is still commonly used in binary
instrumentation tools, translators today
–e.g. DynamoRIO, Strata, Intel Pin
5

© 2015 IBM Corporation
IBM Research - Tokyo
A Brief History of Trace-based Compilation (2)
Recently, trace-based compilation has gained popularity in dynamic scripting languages
–because it can potentially provide more opportunities for type specialization
–e.g. TraceMonkey (PLDI’08), PyPy (ICOOOLPS’09), LuaJIT, SPUR (OOPSLA’10)
TraceMonkey (used in Firefox 3.5 - 10) is the first trace-JIT for JavaScript
–demonstrated 2x to 20x speedups on loop-intensive scripts
PyPy is the first Python trace-JIT
–use trace compilation for aggressive specialization of generic operations/data
6
© 2015 IBM Corporation
IBM Research - Tokyo
A Brief History of Trace-based Compilation (3)
HotpathVM (VEE’06), YETI (VEE’07), Maxpath (PPPJ’10),
HotSpot-based trace-JIT (PPPJ’11), Dalvik JIT of Android
2.2+ are trace-JITs targeting Java and variants
HotpathVM emphasizes its efficiency in resource constrained
systems where full-blown JIT compilation is not practical
YETI showed that the trace-based compilation eased the
development of a JIT compiler by allowing incremental
implementation of JIT compiler
HotSpot-based trace-JIT showed performance improvement
over (method-based) HotSpot client compiler (closer to
region-based compilation approach)
7

© 2015 IBM Corporation
IBM Research - Tokyo
8
Outline
Back ground
Overview of our trace-JIT
Trace Selection and Performance
Summary

© 2015 IBM Corporation
IBM Research - Tokyo
Our Trace-based Java JIT
Problem statement
– How to optimize large-scale Java applications with deep (>100) call chains and a flat execution profile?
Why trace compilation?
– Tracing may create larger compilation scopes than conventional inlining, especially across method boundaries
– Tracing may provide context-sensitive profiling information
Our approach
– Develop a trace-JIT based on existing method-based Java JIT
2-year effort by 3 members
– Hiroshi Inoue, Hiroshige Hayashizaki (IBM Research – Tokyo)
– Peng Wu (IBM Research – Watson)
9

© 2015 IBM Corporation
IBM Research - Tokyo
Motivating Example
A trace can span multiple methods
– Free from method boundaries
– In large server workloads, there are deep (>100) layers of methods
10
method 1 Web
Container
ok?
search for a handler
error!
print log?
method 2 JavaServer
Pages
ok?
search for a bean
error!
print log?
method 3 Enterprise
JavaBeans
ok?
create an SQL
error!
print log?
method 4 JDBC
Driver
ok?
send the SQL to DB
error!
print log?

© 2015 IBM Corporation
IBM Research - Tokyo
Our Questions
1. Can trace-JIT break method boundaries more effectively?
2. Can trace-JIT produce better codes?
3. Can trace-JIT compile more efficiently (i.e., compile time & code size)?
4. Can a Java trace-JIT beat a Java method-JIT?
11

© 2015 IBM Corporation
IBM Research - Tokyo
12
Trace Selection vs. Method Inlining
ASSUMPTION: when a call graph is too big to be fully inlined into
the root node
Method inlining forms
hierarchical regions
invocation
method with loop
method w/o loop
Trace selection forms contiguous regions
– blue, brown, green

© 2015 IBM Corporation
IBM Research - Tokyo
13
Baseline Method-JIT Components
interpreter
IR generator optimizers
code generator
compiled method dispatcher
garbage collector
code cache
class libraries
Java VM
compiled code Method-JIT
compilation request for frequently executed methods

© 2015 IBM Corporation
IBM Research - Tokyo
14
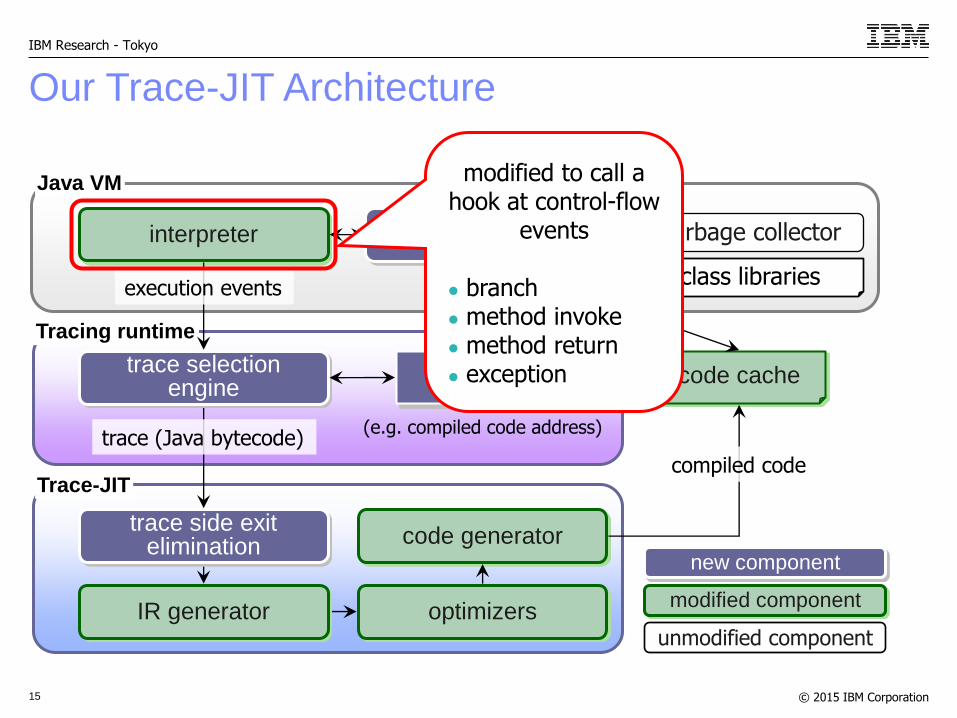
Our Trace-JIT Architecture
Tracing runtime
interpreter
trace (Java bytecode)
trace selection engine
IR generator optimizers
code generator
trace dispatcher garbage collector
code cache
class libraries
hash map
(e.g. compiled code address)
Java VM
Trace-JIT
modified component
unmodified component
new component
execution events
compiled code
trace side exit elimination
© 2015 IBM Corporation
IBM Research - Tokyo
15
Our Trace-JIT Architecture
Tracing runtime
interpreter
trace (Java bytecode)
trace selection engine
IR generator optimizers
code generator
trace dispatcher garbage collector
code cache
class libraries
hash map
(e.g. compiled code address)
Java VM
Trace-JIT
modified component
unmodified component
new component
execution events
compiled code
trace side exit elimination
modified to call a hook at control-flow
events
branch method invoke method return exception

© 2015 IBM Corporation
IBM Research - Tokyo
16
Our Trace-JIT Architecture
Tracing runtime
interpreter
trace (Java bytecode)
trace selection engine
IR generator optimizers
code generator
trace dispatcher garbage collector
code cache
class libraries
hash map
(e.g. compiled code address)
Java VM
Trace-JIT
modified component
unmodified component
new component
execution events
compiled code
trace side exit elimination
A
B
exit
exit
linear trace
A
B
exit
cyclic trace
stub stub
identify two types of hot paths
© 2015 IBM Corporation
IBM Research - Tokyo
17
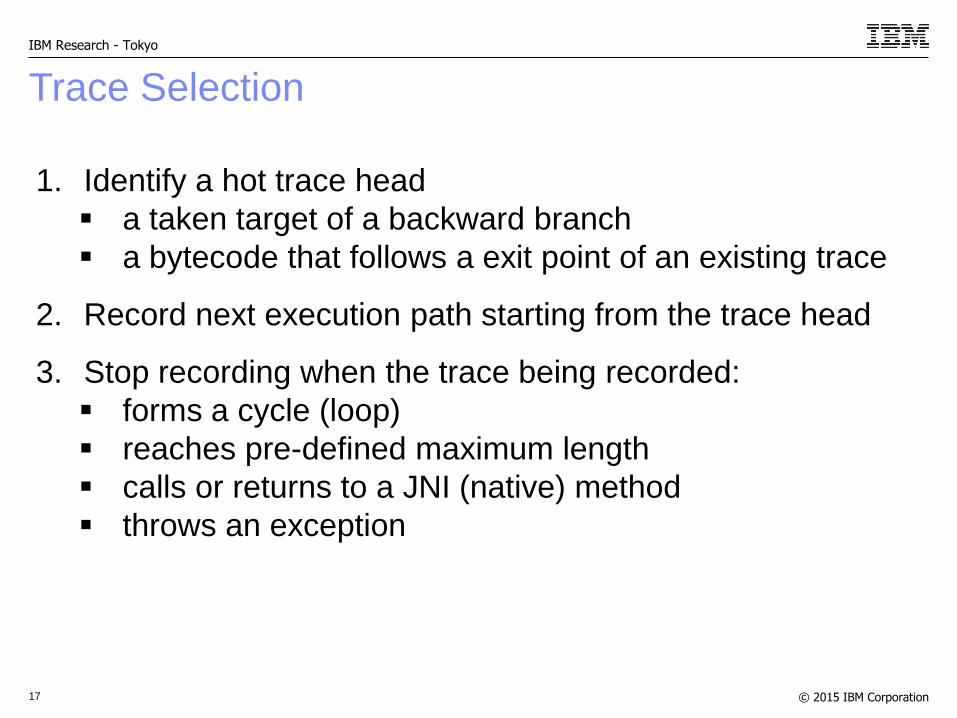
Trace Selection
1. Identify a hot trace head
a taken target of a backward branch
a bytecode that follows a exit point of an existing trace
2. Record next execution path starting from the trace head
3. Stop recording when the trace being recorded:
forms a cycle (loop)
reaches pre-defined maximum length
calls or returns to a JNI (native) method
throws an exception

© 2015 IBM Corporation
IBM Research - Tokyo
18
Our Trace-JIT Architecture
Tracing runtime
interpreter
trace (Java bytecode)
trace selection engine
IR generator optimizers
code generator
trace dispatcher garbage collector
code cache
class libraries
Java VM
modified component
unmodified component
new component
execution events
compiled code Trace-JIT
trace side exit elimination
hash map
(e.g. compiled code address)
Apply simple one-pass value propagation to exploit simple
topologies of traces
It removes potential side exits to reduce IR tree size and
compilation time

© 2015 IBM Corporation
IBM Research - Tokyo
19
0.0
0.2
0.4
0.6
0.8
1.0
1.2
avro
raba
tik
eclip
se fop h2
jyth
on
luin
dex
luse
arch
pmd
sunf
low
tom
cat
trade
bean
s
xalan
geom
ean
rela
tive p
erf
orm
ance o
ver
meth
od-J
IT .
method-based JIT
our trace-based JIT
Peak Performance (DaCapo-9.12)
hig
her
is fast
er
Trace-JIT was almost comparable to the method-JIT on average 21% slower to 19% faster

© 2015 IBM Corporation
IBM Research - Tokyo
20
Outline
Back ground
Overview of our trace-JIT
Trace Selection and Performance
Summary
© 2015 IBM Corporation
IBM Research - Tokyo
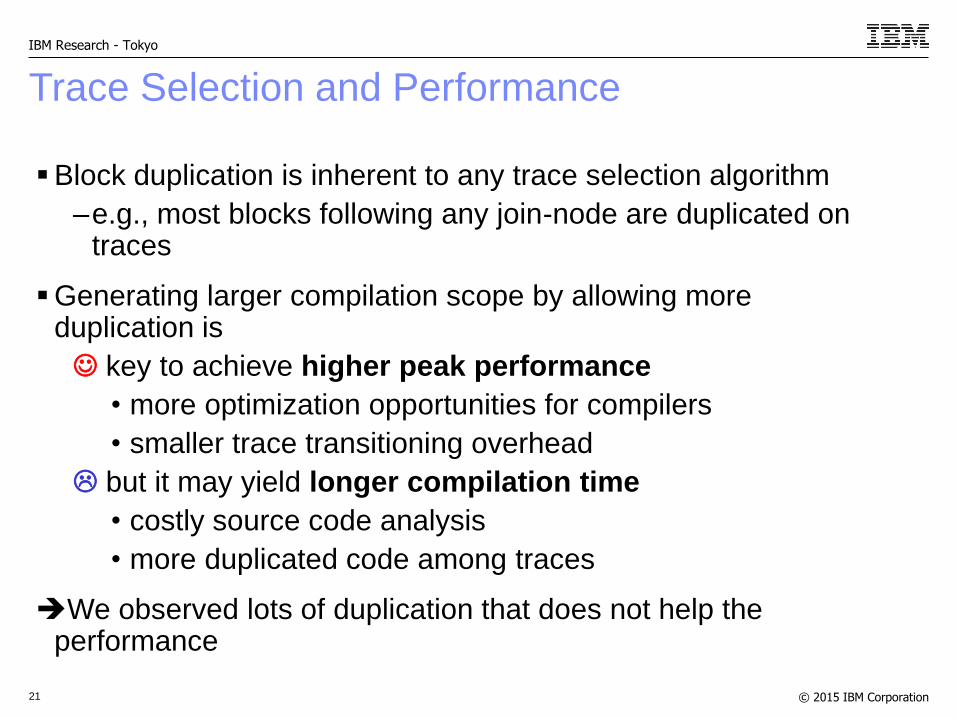
Trace Selection and Performance
Block duplication is inherent to any trace selection algorithm
–e.g., most blocks following any join-node are duplicated on traces
Generating larger compilation scope by allowing more duplication is
key to achieve higher peak performance
• more optimization opportunities for compilers
• smaller trace transitioning overhead
but it may yield longer compilation time
• costly source code analysis
• more duplicated code among traces
We observed lots of duplication that does not help the performance
21

© 2015 IBM Corporation
IBM Research - Tokyo
22
Understanding the Causes (I): Short-Lived Traces
0%10%
20%30%
40%50%60%
70%80%
90%100%
DayT
rader
avro
ra
batik
eclip
se
fop
h2
jyth
on
luin
dex
lusearc
h
pm
d
sunflo
w
tom
cat
tradebeans
xala
n
geom
ean
% traces selected by baseline algorithm with <500 execution frequency
On average, 40%
traces of DaCapo 9-12
are short lived
trace A
trace B
1. Trace A is formed before trace B, but node B dominates node A
2. Node A is part of trace B
• Trace A is formed first • Trace B is formed later • Afterwards, A is no longer entered
SYMPTON
ROOT CAUSE
1
2

© 2015 IBM Corporation
IBM Research - Tokyo
Compiled code size reduced by 70%
23
0.0
0.1
0.2
0.3
0.4
0.5
0.6
0.7
0.8
0.9
1.0
DayT
rader
avro
ra
batik
eclip
se
fop
h2
jyth
on
luin
dex
lusearc
h
pm
d
sunflow
tom
cat
tradebeans
xala
n
geom
ean
Re
lative
JIT
ted
Co
de
Siz
e .
baseline +exact-bb +head-opt +clear-counter +struct-trunk +prof +prof w/ trunk
short
er
is b
ett
er
DaCapo 9.12 DayTrader 2.0
running on
WebSphere 7

© 2015 IBM Corporation
IBM Research - Tokyo
24
0.0
0.1
0.2
0.3
0.4
0.5
0.6
0.7
0.8
0.9
1.0
DayT
rader
avro
ra
batik
eclip
se
fop
h2
jyth
on
luin
dex
lusearc
h
pm
d
sunflow
tom
cat
tradebeans
xala
n
geom
ean
Re
lative
Sta
rtu
p T
ime
baseline +exact-bb +head-opt +clear-counter +struct-trunk +prof +prof w/ trunk
short
er
is b
ett
er
Startup time reduced by 45%

© 2015 IBM Corporation
IBM Research - Tokyo
Peak performance was also improved in DayTrader!
25
hig
her
is fast
er
0.0
0.10.2
0.30.4
0.50.6
0.70.8
0.91.0
1.11.2
DayT
rader
avro
ra
batik
eclip
se
fop
h2
jyth
on
luin
dex
lusearc
h
pm
d
sunflow
tom
cat
tradebeans
xala
n
geom
ean
Re
lative
Pe
ak P
erf
orm
an
ce
baseline +exact-bb +head-opt +clear-counter +struct-trunk +prof +prof w/ trunk

© 2015 IBM Corporation
IBM Research - Tokyo
Trace Selection and Performance for Large-scale Applications
Generating larger compilation scope by allowing more duplications
is key to achieve higher peak performance
• more optimization opportunities for compilers
• smaller trace transitioning overhead
but it may hurt startup performance
• longer compilation time
• more duplicated code among traces
also it may hurt the peak performance for large applications
• Larger application tend to cause more instruction cache
misses
• ~20% of CPU cycles were wasted by I-cache misses in
DayTrader
26

© 2015 IBM Corporation
IBM Research - Tokyo
27
Generating longer trace also does not necessarily work: Supporting a loop in a trace
A
B
exit
linear trace
A
B
cyclic trace
exit
B
C
A
D
exit
extended-form trace fewer trace transition
L1 I$ miss: -10% potentially more optimization opportunity
but, no improvement observed more code duplication among traces
total code size: +20% L3 Instruction miss: +6%
Performance: -1% in DayTrader
+1% on average of DaCapo-9.12 (up to +2.5%)

© 2015 IBM Corporation
IBM Research - Tokyo
28
Outline
Back ground
Overview of our trace-JIT
Trace Selection and Performance
A large-scale Java application with trace-JIT
Summary

© 2015 IBM Corporation
IBM Research - Tokyo
Questions and Our Answers
1. Can trace-JIT break method boundaries more effectively?
–Workload dependent, e.g., trace JIT produces 2X larger scope than method-JIT for Jython, but 9% smaller scope for DayTrader
–But simply enlarge the compilation scope does not help performance
2. Can trace-JIT produce better codes?
–Retrofitting method-JIT optimizers for trace-JIT does not yield significant better codes beyond the benefit of larger scope
–But opportunities may exist in new trace-specific optimizations
–How to generate trace exit code is an interesting challenge unique to trace-JIT
3. Can trace-JIT compile more efficiently (i.e., compile time & code size)?
–Yes. The simple topology of linear and cyclic traces can be compiled with much more efficiently
4. Can a Java trace-JIT beat a Java method-JIT?
–It is not easy to beat a mature method-JIT. We feel that a specific type of workloads, such as Jython, respond better to trace-JIT than method-JIT 29

© 2015 IBM Corporation
IBM Research - Tokyo
How about for other languages?
TraceMonkey (JavaScript)
– http://hacks.mozilla.org/2010/03/improving-javascript-performance-
with-jagermonkey/
– “That the approach that we’ve taken with tracing tends to interact
poorly with certain styles of code.”
– “That when we’re able to “stay on trace” (more on this later)
TraceMonkey wins against every other engine.”
Pyston (Python)
– https://tech.dropbox.com/2014/04/introducing-pyston-an-upcoming-jit-
based-python-implementation/
– “Whether or not the same performance advantage holds for Python is
an open question, but since the two approaches are fundamentally
incompatible, the only way to start answering the question is to build a
new method-at-a-time JIT.”
30

© 2015 IBM Corporation
IBM Research - Tokyo
Lessons Learned
Trace selection algorithm has a big impact on performance and code size
– more flexible than the method inlining and hence is an interesting tool
to evaluate the effect of code duplication
What did not work for us
– extending trace-scope by allowing non-linear structures (e.g., trace
grouping, trace tree) does not yield any performance improvement for
DayTrader
Possible future steps
– opportunities may exist in new trace-specific optimizations
• e.g., allocation removal [Bolz ’10], aggressive redundancy
elimination
– improving profile accuracy
• profile accuracy is more important in trace-JIT than method-JIT
31
© 2015 IBM Corporation
IBM Research - Tokyo
32
Our Publication on trace-JIT
Hiroshi Inoue, Hiroshige Hayashizaki, Peng Wu, and Toshio Nakatani, "A Trace-
based Java JIT Compiler Retrofitted from a Method-based Compiler", CGO 2011
– Focus on trace-optimization aspect of the JIT, discussed the scope mismatch problem
Hiroshige Hayashizaki, Peng Wu, Hiroshi Inoue, Mauricio Serrano and Toshio
Nakatani, "Improving the Performance of Trace-based Systems by False Loop
Filtering", ASPLOS 2011
– Focus on trace selection algorithm, fragmentation of traces due to false loop problems
Peng Wu, Hiroshige Hayashizaki, Hiroshi Inoue, and Toshio Nakatani, "Reducing
Trace Selection Footprint for Large-scale Java Applications with no Performance
Loss", OOPSLA 2011
– Focus on trace selection algorithm, the code duplication problem
Hiroshi Inoue, Hiroshige Hayashizaki, Peng Wu, and Toshio Nakatani, "Adaptive
Multi-Level Compilation in a Trace-based Java JIT Compiler", OOPSLA 2012
– Focus on adaptive compilation of trace-JIT