Embed Size (px)
Citation preview

National Cancer Institute CARCINOGENESIS Technical Report Series No. 71 1978
BIOASSAY OF L-TRYPTOPHAN FOR POSSIBLE CARCINOGENICITY
CAS No. 73-22-3
NCI-CG-TR-71
U.S. DEPARTMENT OF HEALTH, EDUCATION, AND WELFARE Public Health Service National Institutes of Health


BIOASSAY OF
L-TRYPTOPHAN
FOR POSSIBLE CARCINOGENICITY
Carcinogenesis Testing Program Division of Cancer Cause and Prevention
National Cancer Institute National Institutes of Health
Bethesda, Maryland 20014
U.S. DEPARTMENT OF HEALTH, EDUCATION, AND WELFARE Public Health Service
National Institutes of Health
DHEW Publication No. (NIH) 78-1321


BIOASSAY OF L-TRYPTOPHAN
FOR POSSIBLE CARCINOGENICITY
Carcinogenesis Testing Program Division of Cancer Cause and Prevention
National Cancer Institute National Institutes of Health
FOREWORD; This report presents the results of the bioassay of L-tryptophan conducted for the Carcinogenesis Testing Program, Division of Cancer Cause and Prevention, National Cancer Institute (NCI), National Institutes of Health, Bethesda, Maryland. This is one of a series of experiments designed to determine whether selected chemicals have the capacity to produce cancer in animals. Negative results, in which the test animals do not have a greater incidence of cancer than control animals, do not necessarily mean that the test chemical is not a carcinogen, inasmuch as the .experiments are conducted under a limited set of circumstances. Positive results demonstrate that the test chemical is carcinogenic for animals under the conditions of the test and indicate that exposure to the chemical is a potential risk to man. The actual determination of the risk to man from animal carcinogens requires a wider analysis.
CONTRIBUTORS; The bioassay of L-tryptophan was conducted by Southern Research Institute, Birmingham, Alabama, initially under direct contract to NCI and currently under a subcontract to Tracer Jitco, Inc., prime contractor for the NCI Carcinogenesis Testing Program.
The experimental design and doses were determined by Drs. D. P. Griswold^, J. D. Prejean^, E. K. Weisburger^, and J. H. Weisburger^»3. Ms. J. Belzer* and Mr. I. Brown^ were responsible for the care and feeding of the laboratory animals. Data management and retrieval were performed by Ms. C. A. Dominick . Histopathologic examinations were performed by Drs. S. D. Kosanke* and J. C. Peckham^-, and the diagnoses included in this report represent their interpretation.
iii

Animal pathology tables and survival tables were compiled at EG&G Mason Research Institute . The statistical analyses were performed by Dr. J. R. Joiner-*, using methods selected for the bioassay program by Dr. J. J. Gart . Chemicals used in this bioassay were analyzed under the direction of Dr. E. Murrill^, and the analytical results were reviewed by Dr. C. W. Jameson^. The structural formula was supplied by NCI2.
This report was prepared at Tracor Jitco-> under the direction of NCI. Those responsible for the report at Tracor Jitco were Dr. Marshall Steinberg, Director of the Bioassay Program; Dr. L. A. Campbell, Deputy Director for Science; Drs. J. F. Robens and C. H. Williams, toxicologists; Dr. G. L. Miller, Ms. L. A. Waitz, and Mr. W. D. Reichardt, bioscience writers; and Dr. E. W. Gunberg, technical editor, assisted by Ms. Y. E. Presley.
The statistical analysis was reviewed by members of the Mathematical Statistics and Applied Mathematics Section of NCI": Dr. John J. Gart, Mr. Jun-mo Nam, Dr. Hugh M. Pettigrew, and Dr. Robert E. Tarone.
The following other scientists at NCI2 were responsible for evaluating the bioassay experiment, interpreting the results, and reporting the findings: Dr. Kenneth C. Chu, Dr. Cipriano Cueto, Jr., Dr. J. Fielding Douglas, Dr. Dawn G. Goodman, Dr. Richard A. Griesemer, Dr. Harry A. Milman, Dr. Thomas W. Orme, Dr. Robert A. Squire", and Dr. Jerrold M. Ward.
•'•Southern Research Institute, 2000 Ninth Avenue South, Birmingham, Alabama.
2Carcinogenesis Testing Program, Division of Cancer Cause and Prevention, National Cancer Institute, National Institutes of Health, Bethesda, Maryland.
oJNow with the Naylor Dana Institute for Disease Prevention, American Health Foundation, Hammond House Road, Valhalla, New York.
iv

^EG&G Mason Research Institute, 1530 East Jefferson Street, Rockville, Maryland.
5Tracor Jitco, Inc., 1776 East Jefferson Street, Rockville, Maryland.
"Mathematical Statistics and Applied Mathematics Section, Biometry Branch, Field Studies and Statistics, Division of Cancer Cause and Prevention, National Cancer Institute, National Institutes of Health, Bethesda, Maryland.
^Midwest Research Institute, 425 Volker Boulevard, Kansas City, Missouri.
^Now with the Division of Comparative Medicine, Johns Hopkins University, School of Medicine, Traylor Building, Baltimore, Maryland.
V


SUMMARY
A bioassay of the amino acid L-tryptophan for possible carcinogenicity was conducted by administering the test chemical in feed to Fischer 344 rats and B6C3F1 mice.
Groups of 35 rats and 35 mice of each sex were administered L-tryptophan at one of two doses, either 25,000 or 50,000 ppm, 5 days per week for 78 weeks, and then observed for 26 or 27 weeks. Matched controls consisted of groups of 15 rats or 15 mice of each sex. All surviving rats and mice were killed at 104 or 105 weeks.
L-Tryptophan had little toxic effect on the rats; mean body weight loss was minimal and survival of dosed groups of both sexes was high. In the mice, mean body weights of dosed animals were lower than those of controls throughout most of the bioassay, particularly in the females. Sufficient numbers of rats were at risk to termination of the study for development of late-appearing tumors, and sufficient numbers of mice were at risk beyond 52 weeks of the study for development of tumors.
No neoplasms occurred in a statistically significant incidence among dosed rats when compared with controls.
In both male and female mice, neoplasms of the hematopoietic system occurred at higher incidences in the low-dose groups than in the matched-control groups (males: controls 0/12, low-dose 9/34, high-dose 2/33; females: controls 2/13, low-dose 6/33, high-dose 1/35). These incidences, however, are not statistically significant, using the Bonferroni correction, and therefore, no tumors are considered to be related to the administration of the test chemical.
It is concluded that under the conditions of this bioassay, L-tryptophan was not carcinogenic for Fischer 344 rats or B6C3F1 mice.
vii


TABLE OF CONTENTS
Page
I. Introduction 1
II. Materials and Methods 3
A. Chemical 3 B. Dietary Preparation 4 C. Animals 4 D. Animal Maintenance 5 E. Subchronic Studies 7 F. Designs of Chronic Studies 8 G. Clinical and Pathologic Examinations 8 H. Data Recording and Statistical Analyses... 12
III. Results -Rats 17
A. Body Weights and Clinical Signs (Rats) 17 B. Survival (Rats) 17 C. Pathology (Rats) 20 D. Statistical Analyses of Results (Rats) 21
IV. Results - Mice 23
A. Body Weights and Clinical Signs (Mice) 23 B. Survival (Mice) 23 C. Pathology (Mice) 26 D. Statistical Analyses of Results (Mice) 30
V. Discussion 33
VI. Bibliography 35
APPENDIXES
Appendix A Summary of the Incidence of Neoplasms in Rats Fed L-Tryptophan in the Diet 39
Table Al Summary of the Incidence of Neoplasms in Male Rats Fed L-Tryptophan in the Diet 41
Table A2 Summary of the Incidence of Neoplasms in Female Rats Fed L-Tryptophan in the Diet 45
ix
Page
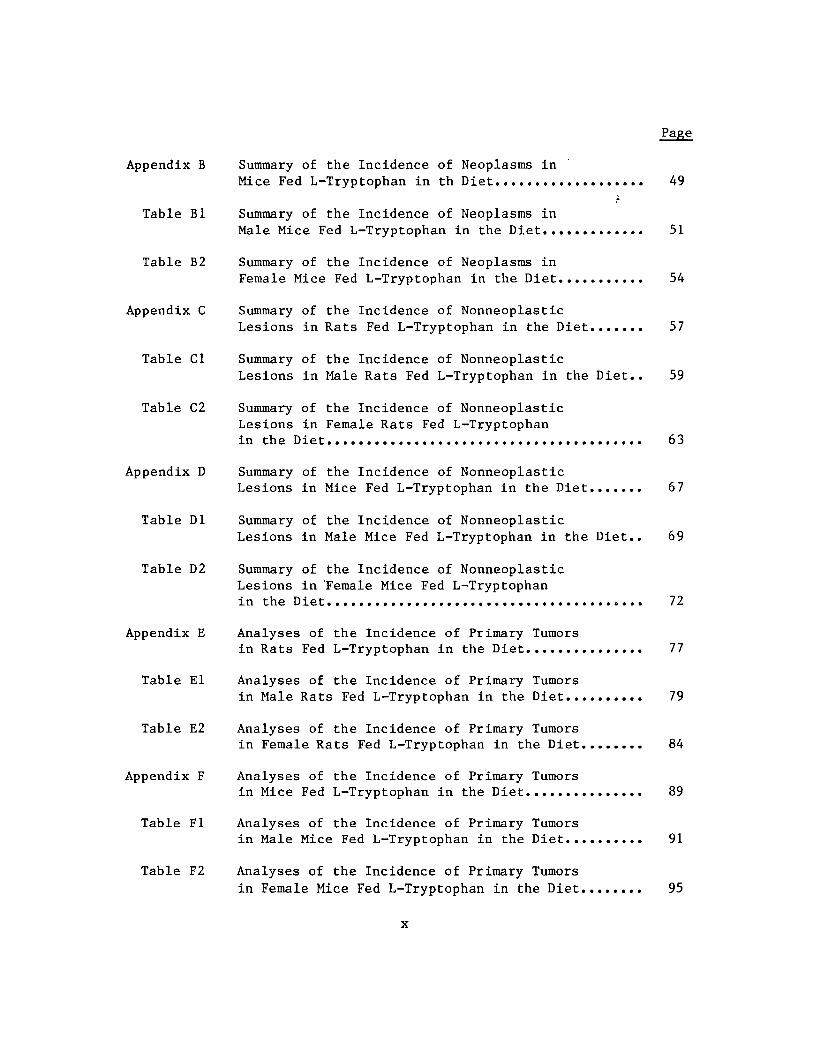
Appendix B
Table Bl
Summary of the Incidence of Neoplasms in Mice Fed L-Tryptophan in th Diet
Summary of the Incidence of Neoplasms in Male Mice Fed L-Tryptophan in the Diet
/
49
51
Table B2 Summary of the Incidence of Neoplasms in Female Mice Fed L-Tryptophan in the Diet 54
Appendix C Summary of the Incidence of Nonneoplastic Lesions in Rats Fed L-Tryptophan in the Diet 57
Table Cl Summary of the Incidence of Nonneoplastic Lesions in Male Rats Fed L-Tryptophan in the Diet.. 59
Table C2 Summary of the Incidence of Nonneoplastic Lesions in Female Rats Fed L-Tryptophan in the Diet 63
Appendix D Summary of the Incidence of Nonneoplastic Lesions in Mice Fed L-Tryptophan in the Diet 67
Table Dl Summary of the Incidence of Nonneoplastic Lesions in Male Mice Fed L-Tryptophan in the Diet.. 69
Table D2 Summary of the Incidence of Nonneoplastic Lesions in Female Mice Fed L-Tryptophan in the Diet 72
Appendix E Analyses of the Incidence of Primary Tumors in Rats Fed L-Tryptophan in the Diet 77
Table El Analyses of the Incidence of Primary Tumors in Male Rats Fed L-Tryptophan in the Diet 79
Table E2 Analyses of the Incidence of Primary Tumors in Female Rats Fed L-Tryptophan in the Diet 84
Appendix F Analyses of the Incidence of Primary Tumors in Mice Fed L-Tryptophan in the Diet 89
Table Fl Analyses of the Incidence of Primary Tumors in Male Mice Fed L-Tryptophan in the Diet 91
Table F2 Analyses of the Incidence of Primary Tumors in Female Mice Fed L-Tryptophan in the Diet........ 95
x

Page
TABLES
Table 1 Design of L-Tryptophan Chronic Feeding Studies in Rats 9
Table 2 Design of L-Tryptophan Chronic Feeding Studies in Mice 10
FIGURES
Figure 1 Growth Curves for Rats Fed L-Tryptophan in the Diet 18
Figure 2 Survival Curves for Rats Fed L-Tryptophan in the Diet 19
Figure 3 Growth Curves for Mice Fed L-Tryptophan in the Diet 24
Figure 4 Survival Curves for Mice Fed L-Tryptophan in the Diet 25
xi


I. INTRODUCTION
L-Tryptophan (CAS 73-22-3; NCI C01729) is an essential amino acid
for humans, and a precursor of the neurohormones serotonin
(5-hydroxytryptamine) and melatonin (N-acetyl-5-methoxytrypt
amine), and the B vitamin nicotinic acid (Orten and Neuhaus,
1975). It is found in small concentrations in casein, and in
many foods (Stecher, 1968; Food and Agriculture Organization,
1970).
In the 1950's, there were two reports that the dietary
administration of DL-tryptophan to rats modified the carcinogenic
effects of 2-acetylaminofluorene. The combined administration of
these compounds resulted in the production of bladder tumors
which were not found in animals dosed with 2-acetylaminofluorene
alone (Dunning et al., 1950; Boyland et al., 1954). In
subsequent studies in which the tryptophan metabolites indole,
indican, or 3-hydroxyanthranilic acid were administered by
subcutaneous injection to mice, malignant tumors of the reticulo
endothelial system, and leukemia were observed, but there was no
evidence of bladder tumors (Ehrhart and Stich, 1957, and 1958;
Ehrhart et al., 1959). Tryptophan metabolites were also tested
in mice by bladder implantation techniques, and among those that
were positive were o-aminophenol derivatives such as 3-hydro
xykynurenine, 3-hydroxyanthranilic acid, and 2-amino-3-hydro
1

xyacetophenone (Allen et al., 1957; Bryan et al., 1964), although
L-tryptophan itself was negative (Boyland et al., 1964).
Finally, DL-tryptophan induced bladder hyperplasia but no cancer
in dogs when fed in high doses for 1 year (Radomski et al., 1969,
1970, and 1977) which led these authors to the conclusion that
tryptophan metabolites may act as co-carcinogens.
L-tryptophan was selected for study in the Carcinogenesis Testing
Program because the evidence available at the time of selection
suggested that tryptophan or a metabolite was involved in the
etiology of bladder cancer.
2

II. MATERIALS AND METHODS
A. Chemical
L-TRYPTOPHAN
L-Tryptophan (L-a-amino-/J-indolepropionic acid) was obtained in a
single batch (Lot No. C-8-30-72) for the chronic studies from
Carroll Products, Wood River Junction, Rhode Island. The
identity and purity of this batch was confirmed in analyses at
Midwest Research Institute. No impurities were found by thin-
layer chromatography. The melting point was 275-284°C
(literature: 278°C, Dictionary of Organic Compounds, 1965).
Elemental analyses (C, H, N) were consistent with C^H^2N2^2» the
molecular formula of tryptophan. Nuclear magnetic resonance,
infrared, and ultraviolet spectra were in agreement with the
structure and matched the spectra given in the literature.
The chemical was stored in the original container at 5°C.
3

B. Dietary Preparation
Test diets were prepared every 2 weeks by mixing a known amount
of sifted L-tryptophan with a small amount of Wayne® Lab Blox
animal meal (Allied Mills, Inc., Chicago, 111.) in a portable
mixer, then adding this mixture to the required amount of animal
meal and mixing in a twin-shell blender for 10 minutes. Tests of
the concentration or stability of the chemical in feed were not
performed.
The prepared diets were stored at room temperature in sealed
plastic containers.
C. Animals
For the subchronic studies, male Sprague-Dawley rats were
obtained from Charles River Breeding Laboratories, Inc.,
Wilmington, Massachusetts, and male Swiss mice were obtained from
Purina Laboratories, St. Louis, Missouri. All animals were 30
days of age on arrival at the laboratory. They were quarantined
for 7 days and then placed on study.
For the chronic studies, Fischer 344 rats and B6C3F1 mice were
obtained from Charles River Laboratories under a contract with
the Division of Cancer Treatment, National Cancer Institute. On
arrival at the laboratory, male and female rats were 30 days of
4

age, male mice 31 days of age, and female mice 38 days of age.
All animals were quarantined for 12 days. Animals with no
visible signs of disease were assigned to control or dosed groups
and earmarked for individual identification.
D. Animal Maintenance
All animals were housed in temperature- and humidity-controlled
rooms. The temperature range was 20-24°C, and the relative
humidity was 40-60%. The room air was changed 15 times per hour
and passed through both intake and exhaust fiberglass roughing
filters. In addition to natural light, illumination was provided
by fluorescent light for 9 hours per day. Food and water were
supplied daily and were available ad libitum.
All animals were housed five per cage in solid-bottom stainless
steel cages (Hahn Roofing and Sheet Metal Co., Birmingham, Ala.).
The rat cages were provided with Iso-Dri® hardwood chip bedding
(Carworth, Edison, N.J.), and cage tops were covered with
disposable filter bonnets; mouse cages were provided with
Sterolit® clay bedding (Englehard Mineral and Chemical Co., New
York, N.Y.) and cage tops were covered with filter bonnets
beginning at week 86. Bedding was replaced once per week; cages,
water bottles, and feeders were sanitized at 82°C once per week;
and racks were cleaned once per week.

The rats and mice were housed in separate rooms. Control animals
were housed with respective dosed animals. Animals administered
L-tryptophan were maintained in the same rooms as animals of the
same species being dosed with the following chemicals:
»
RATS
Feed Studies
4-acetyl-N-((cyclohexylamino)carbonyl)benzenesulfonamide (acetohexamide) (CAS 968-81-0)
anthranilic acid (CAS 118-92-3) l-butyl-3-(p-tolylsulfonyl)urea (tolbutamide) (CAS 64-77-7) 4-chloro-N-((propylamino)carbonyl)benzenesulfonamide
(chlorpropamide) (CAS 94-20-2) 5-(4-chlorophenyl)-6-ethyl-2,4-pyrimidinediamine
(pyrimethamine) (CAS 58-14-0) 2,6-diamino-3-(phenylazo)pyridine hydrochloride (phenazopyridine hydrochloride) (CAS 136-40-3)
N-9H-fluoren-2-ylacetamide (CAS 53-96-3) N-(p-toluenesulfonyl)-N'-hexamethyleniminourea
(tolazamide) (CAS 1156-19-0) 1-phenethylbiguanide hydrochloride (phenformin) (CAS 114-86-3) pyrazinecarboxamide (pyrazinamide) (CAS 98-96-4) 4,4'-sulfonyldianiline (dapsone) (CAS 80-08-0) 4,4'-thiodianiline (CAS 139-65-1) ethionamide (CAS 536-33-4)
MICE
Feed Studies
4-acetyl-N-((cyclohexylamino)carbonyl)benzenesulfonamide (acetohexamide) (CAS 968-81-0)
anthranilic'acid (CAS 118-92-3) l-butyl-3-(p-tolylsulfonyl)urea (tolbutamide) (CAS 64-77-7) 4-chloro-N-((propylamino)carbonyl)benzenesulfonamide
(chlorpropamide) (CAS 94-20-2) 5-(4-chlorophenyl)-6-ethyl-2,4-pyrimidinediamine
(pyrimethamine) (CAS 58-14-0) 2,6-diamino-3-(phenylazo)pyridine hydrochloride (phenazopyridine hydrochloride) (CAS 136-40-3)
N-9H-fluoren-2-ylacetamide (CAS 53-96-3)

N-(p-toluenesulfonyl)-N'-hexamethyleniminourea (tolazamide) (CAS 1156-19-0)
1-phenethylbiguanide hydrochloride (phenformin) (CAS 114-86-3) pyrazinecarboxamide (pyrazinamide) (CAS 98-96-4) 4,4'-sulfonyldianiline (dapsone) (CAS 80-08-0) 4,4'-thiodianiline (CAS 139-65-1) ethionamide (CAS 536-33-4)
Gavage Studies
cholesterol (p-(bis(2-chloroethyl)amino)phenyl)acetate (phenesterin) (CAS 3546-10-9)
estradiol bis((p-(bis(2-chloroethyl)amino)phenyl)acetate) (estradiol mustard) (CAS 22966-79-6)
Intraperitoneal Injection Studies
4'-(9-acridinylamino)methansulfon-m-aniside monohydrochloride (MAAM) (NSC 141549)
acronycine (CAS 7008-42-6) 5-azacytidine (CAS 320-67-2) beta-2'-deoxy-6-thioguanosine monohydrate (beta-TGdR)
(CAS 789-61-7) 1,4-butanediol dimethanesulfonate (busulfan) (CAS 55-98-1) emetine dihydrochloride tetrahydrate (CAS 316-42-7) 3,3'-iminobis-l-propanol dimethanesulfonate (ester) hydrochloride [1PD] (CAS 3458-22-8)
(+;)-4,4'-(l-methyl-l,2-ethanediyl)bis-2,6-piperazinedione (ICRF-159) (CAS 21416-87-5)
N,3-bis(2-chloroethyl)tetrahydro-2H-l,3,2-oxazaphosphorin-2amine-2-oxide (isophosphamide) (CAS 3778-73-2)
N-(2-thloroethyl)-N-(l-methyl-2-phenoxyethyl)benzylamine hydrochloride (phenoxybenzamine hydrochloride) (CAS 63-92-3)
N-(l-methylethyl)-4-((2-methylhydrazino)methyl)benzamide monohydrochloride (procarbazine) (CAS 366-70-1)
tris(l-aziridinyl)phosphine sulfide (thio-TEPA) (CAS 52-24-4) 2,4,6-tris(dimethylamino)-s-triazine (CAS 645-05-6)
E. Subchronic Studies
Subchronic feeding studies were conducted to estimate the maximum
tolerated doses of L-tryptophan, on the basis of which two

different concentrations (hereinafter referred to as "low doses"
and "high doses") were determined for administration in the
chronic studies. In the subchronic studies, the chemical was
administered in feed at concentrations of 1,000, 5,000, 10,000,
25,000, or 50,000 ppm to both male Sprague-Dawley rats and male
Swiss mice. Dosed animals received the test diets 7 days per
week for 45 days and then were observed for an additional 45
days. Five animals of each species were dosed at each
concentration, and 19 rats and 20 mice were used as untreated
controls.
There were no deaths at any dose among either the rats or the
mice, and final body weights of the dosed animals were within 15%
of the controls. The low and high doses for the chronic studies
using rats or mice were set at 25,000 and 50,000 ppm to avoid
exceeding the limit of 5% of the test compound in feed.
F. Designs of Chronic Studies
The designs of the chronic studies are shown in tables 1 and 2.
G. Clinical and Pathologic Examinations
All animals were observed twice daily for signs of toxicity, and
animals that were moribund were killed and necropsied. Rats and
mice were weighed individually every 2 weeks through week 86, and

Table 1. Design of L-Tryptophan Chronic Feeding Studies in Rats
Sex and Initial L-Tryptophan Time on Study Test No. of in Dietb Dosed Observed Group Animals3 (ppm) (weeks) (weeks)
Male
Ma tched-Control 15 0 105
Low-Dose 35 25,000 78 26-27
High-Dose 35 50,000 78 26
Female
Ma tched-Control 15 0 105
Low-Dose 35 25,000 78 26-27
High-Dose 35 50,000 78 26-27
aAll animals were 42 days of age when placed on study.
^The dosed animals were fed test diets 5 days per week and control diets 2 days per week.
9
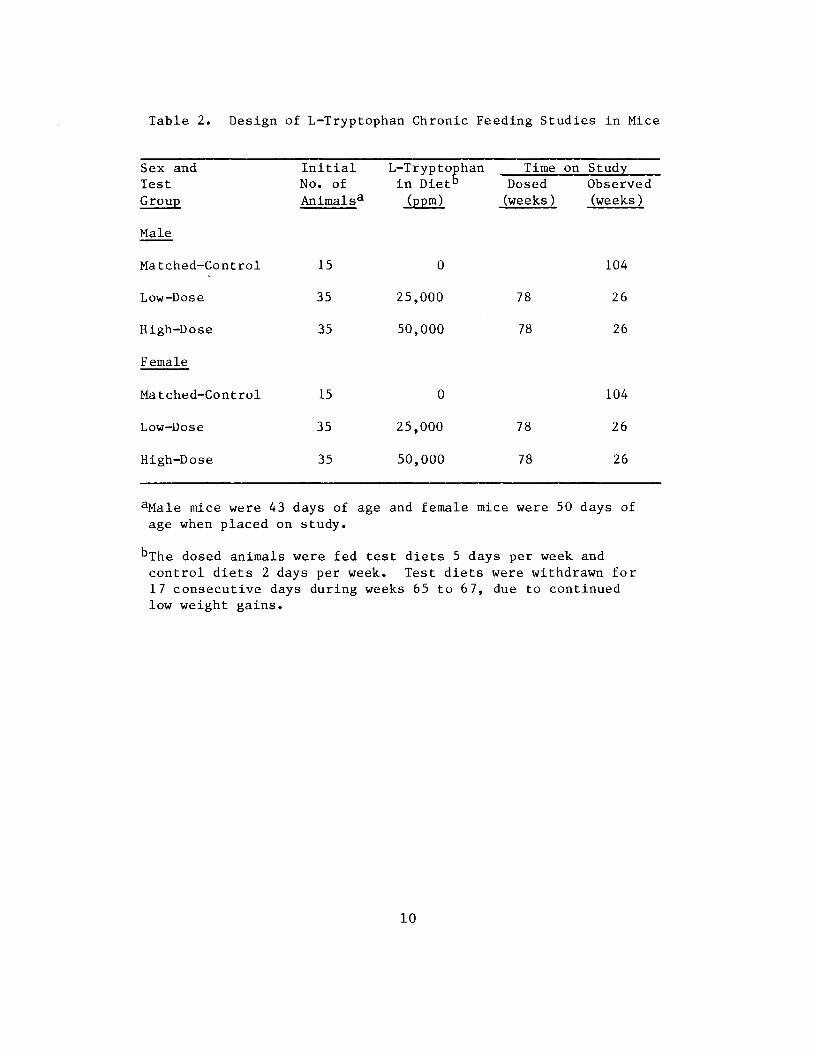
Table 2. Design of L-Tryptophan Chronic Feeding Studies in Mice
Sex and Test Group
Male
Matched-Control
Low-Dose 35 25,000 78 26
26
Female
Matched-Control
26
26
High-Dose 35 50,000 78
Low-Dose 35 25,000 78
High-Dose 35 50,000 78
Initial No. of Animalsa
15
15
L-Tryptophan in Dietb
(ppm)
0
0
Time on Study Dosed Observed (weeks ) (weeks )
104
104
aMale mice were 43 days of age and female mice were 50 days of age when placed on study.
10

once every month for the remainder of the study. Palpation for
masses was carried out at each weighing.
The pathologic evaluation consisted of gross and microscopic
examination of major tissues, major organs, and all gross lesions
from killed animals and from animals found dead. The following
tissues were examined microscopically: skin, muscle, lungs and
bronchi, trachea, bone marrow, spleen, lymph nodes, thymus,
heart, salivary gland, liver, gallbladder and bile duct (mice),
pancreas, esophagus, stomach, small intestine, large intestine,
kidney, urinary bladder, pituitary, adrenal, thyroid, parathy
roid, mammary gland, prostate or uterus, testis or ovary, brain,
and sensory organs. Peripheral blood smears were prepared from
each animal whenever possible. Occasionally, additional tissues
were also examined microscopically. The different tissues were
preserved in 10% buffered formalin, embedded in paraffin, section
ed, and stained with hematoxylin and eosin. Special staining
techniques were utilized when indicated for more definitive
diagnosis.
A few tissues from some animals were not examined, particularly
from those animals that died early. Also, some animals were
missing, cannibalized, or judged to be in such an advanced state
of autolysis as to preclude histopathologic evaluation. Thus,
the number of animals from which particular organs or tissues
11

were examined microscopically varies, and does not necessarily
represent the number of animals that were placed on study in each
group.
H. Data Recording and Statistical Analyses
Pertinent data on this experiment have been recorded in an auto
matic data processing system, the Carcinogenesis Bioassay Data
System (Linhart et al., 1974). The data elements include descrip
tive information on the chemicals, animals, experimental design,
clinical observations, survival, body weight, and individual
pathologic results, as recommended by the International Union
Against Cancer (Berenblum, 1969). Data tables were generated for
verification of data transcription and for statistical review.
These data were analyzed using the statistical techniques
described in this section. Those analyses of the experimental
results that bear on the possibility of carcinogenicity are
discussed in the statistical narrative sections.
Probabilities of survival were estimated by the product-limit
procedure of Kaplan and Meier (1958) and are presented in this
report in the form of graphs. Animals were statistically
censored as of the time that they died of other than natural
causes or were found to be missing; animals dying from natural
causes were not statistically censored. Statistical analyses for
12

a possible dose-related effect on survival used the method of Cox
(1972) for testing two groups for equality and Tarone's (1975)
extensions of Cox's methods for testing for a dose-related trend.
One-tailed P values have been reported for all tests except the
departure from linearity test, which is only reported when its
two-tailed P value is less than 0.05.
The incidence of neoplastic or nonneoplastic lesions has been
given as the ratio of the number of animals bearing such lesions
at a specific anatomic site (numerator) to the number of animals
in which that site is examined (denominator). In most instances,
the denominators included only those animals for which that site
was examined histologically. However, when macroscopic examin
ation was required to detect lesions prior to histologic sampling
(e.g., skin or mammary tumors), or when lesions could have
appeared at multiple sites (e.g., lymphomas), the denominators
consist of the numbers of animals necropsied.
The purpose of the statistical analyses of tumor incidence is to
determine whether animals receiving the test chemical developed a
significantly higher proportion of tumors than did the control
animals. As a part of these analyses, the one-tailed Fisher
exact test (Cox, 1970) was used to compare the tumor incidence of
a control group with that of a group of dosed animals at each
dose level. When results for a number of dosed groups (k) are
13

compared simultaneously with those for a control group, a
correction to ensure an overall significance level of 0.05 may be
made. The Bonferroni inequality (Miller, 1966) requires that the
P value for any comparison be less than or equal to 0.05/k. In
cases where this correction was used, it is discussed in the
narrative section. It is not, however, presented in the tables,
where the Fisher exact P values are shown.
The Cochran-Armitage test for linear trend in proportions, with
continuity correction (Armitage, 1971), was also used. Under the
assumption of a linear trend, this test determines if the slope
of the dose-response curve is different from zero at the one-
tailed 0.05 level of significance. Unless otherwise noted, the
direction of the significant trend is a positive dose relation
ship. This method also provides a two-tailed test of departure
from linear trend.
A time-adjusted analysis was applied when numerous early deaths
resulted from causes that were not associated with the formation
of tumors. In this analysis, deaths that occurred before the
first tumor was observed were excluded by basing the statistical
tests on animals that survived at least 52 weeks, unless a tumor
was found at the anatomic site of interest before week 52. When
such an early tumor was found, comparisons were based exclusively
on animals that survived at least as long as the animal in which
14

the first tumor was found. Once this reduced set of data was
obtained, the standard procedures for analyses of the incidence
of tumors (Fisher exact tests, Cochran-Armitage tests, etc.) were
followed.
When appropriate, life-table methods were used to analyze the
incidence of tumors. Curves of the proportions surviving without
an observed tumor were computed as in Saffiotti et al. (1972).
The week during which an animal died naturally or was sacrificed
was entered as the time point of tumor observation. Cox's
methods of comparing these curves were used for two groups;
Tarone's extension to testing for linear trend was used for three
groups. The statistical tests for the incidence of tumors which
used life-table methods were one-tailed and, unless otherwise
noted, in the direction of a positive dose relationship.
Significant departures from linearity (P < 0.05, two-tailed test)
were also noted.
The approximate 95 percent confidence interval for the relative
risk of each dosed group compared with its control was calculated
from the exact interval on the odds ratio (Gart, 1971). The
relative risk is defined as pt/pc where pt is the true binomial
probability of the incidence of a specific type of tumor in a
dosed group of animals and pc is the true probability of the
spontaneous incidence of the same type of tumor in a control
15

group. The hypothesis of equality between the true proportion of
a specific tumor in a dosed group and the proportion in a. control
group corresponds to a relative risk of unity. Values in excess
of unity represent the condition of a larger proportion in the
dosed group than in the control.
The lower and upper limits of the confidence interval of the
relative risk have been included in the tables of statistical
analyses. The interpretation of the limits is that in approxi
mately 95% of a large number of identical experiments, the true
ratio of the risk in a dosed group of animals to that in a
control group would be within the interval calculated from the
experiment. When the lower limit of the confidence interval is
greater than one, it can be inferred that a statistically
significant result (P < 0.025 one-tailed test when the control
incidence is not zero, P < 0.050 when the control incidence is
zero) has occurred. When the lower limit is less than unity, but
the upper limit is greater than unity, the lower limit indicates
the absence of a significant result while the upper limit
indicates that there is a theoretical possibility of the
induction of tumors by the test chemical, which could not be
detected under the conditions of this test.
16

III. RESULTS - RATS
A. Body Weights and Clinical Signs (Rats)
Mean body weights of the low- and high-dose male rats were lower
than those of the male matched controls, while body weights of
the female rats were similar to those of the female matched
controls. Fluctuation in the growth curve may be due to
mortality; as the size of a group diminishes, the mean body
weight may be subject to wide variation. No other chemical-
related signs of toxicity in the dosed animals were recorded
(figure 1).
To control respiratory disease, rats received oxytetracycline in
the drinking water at 0.6 mg/ml during weeks 39 to 43 and at 0.3
mg/ml during weeks 43 to 44.
B. Survival (Rats)
The Kaplan and Meier curves estimating the probabilities of
survival for male and female rats fed L-tryptophan in the diet at
the doses of this bioassay, togethe-r with those of the matched
controls, are shown in figure 2.
In each sex, the Tarone test result for positive dose-related
trend in mortality is not significant. In male rats, 28/35 (80%)
of the high-dose group, 27/35 (77%) of the low-dose group, and
17

I I-o
QOm
UJ
5
-IX
Hi 250
g
Q O 200m
Figure 1. Growth Curves for Rats Fed L-Tryptophan in the Diet
18

Figure 2. Survival Curves for Rats Fed L-Tryptophan in the Diet
19

8/15 (53%) of the matched controls lived to the end of the study.
In females, 31/35 (89%) of the high-dose group, 26/35 (74%) of
the low-dose group, and 11/15 (73%) of the matched controls lived
to the end of the study. Sufficient numbers of rats of each sex
were at risk for the development of late-appearing tumors.
C. Pathology (Rats)
Histopathologic findings on neoplasms in rats are summarized in
Appendix A, tables Al and A2; findings on nonneoplastic lesions
are summarized in Appendix C, tables Cl and C2.
A variety of neoplasms occurred in both the matched-control and
dosed groups. Some types of neoplasms occurred only in rats of
dosed groups, or with a greater frequency in dosed groups when
compared with controls. Fibromas of the subcutaneous tissue
occurred in 4/34 low-dose and 3/34 high-dose male rats, but in
0/15 controls. These lesions, however, are not uncommon in this
strain of rat independent of any treatment.
In addition to the neoplastic lesions, a number of degenerative,
proliferative,. and inflammatory changes were also encountered in
animals of the control and dosed groups. These nonneoplastic
lesions are commonly seen in aged rats.
In the judgment of the pathologists, L-tryptophan was not carcino
20

genie when fed to Fischer 344 rats under the conditions of this
bioassay.
D. Statistical Analyses of Results (Rats)
Tables El and E2 in Appendix E contain the statistical analyses
of the incidences of those primary tumors that were observed in
at least two animals in one group and with an incidence of at
least 5% in one or more than one group.
In each sex, the results of the Cochran-Armitage test for posi
tive dose-related trend and of the Fisher exact test for direct
comparison of incidences between the matched-control group and
each of the dosed groups in the positive direction are not
significant.
In male rats, the Cochran-Armitage test results indicate a linear
trend in the negative direction in the incidences of leukemia
(P = 0.014), C—cell adenomas or carcinomas of the thyroid (P =
0.004), and interstitial-cell tumors of the testis (P = 0.016).
The probability level of the Fisher exact test of the incidence
of C-cell adenomas or carcinomas of the thyroid in male rats is
0.007, reflecting the higher incidence in the control group
(5/14, 36%) than in the high-dose group (1/32, 3%). These
significant results in the negative direction cannot be explained
by differential survival. In female rats, the Cochran-Armitage
21

test results of the incidence of fibroadenomas in the mammary
gland also indicate a significant trend (P = 0.027) in the
negative direction.
In each of the 95% confidence intervals of relative risk, shown
in the tables, the value of one or less than one is included,
indicating the absence of positive significant results. It
should also be noted that most of the intervals have upper limits
greater than one, indicating the theoretical possibility of the
induction of tumors by L-tryptophan, which could not be detected
under the conditions of this test.
22

IV. RESULTS - MICE
A. Body Weights and Clinical Signs (Mice)
Mean body weights of both low- and high-dose mice of each sex
were lower than those of the matched controls, becoming
increasingly lower from week 20 through week 78 of administration
of the chemical (figure 3). The body weights of the dosed groups
approached those of the controls after L-tryptophan feeding was
discontinued, especially in the males. Fluctuation in the growth
curve may be due to mortality; as the size of a group diminishes,
the mean body weight may be subject to wide variation. There
were no other clinical signs of chemical-related toxicity.
To control respiratory disease, mice received oxytetracycline in
the drinking water at 0.6 mg/ml during week 66 and at 0.3 mg/ml
during week 67. Propylene glycol was vaporized in the mouse room
during weeks 66 to 76 to decrease the transmission of micro
organisms that may have caused the respiratory disease.
B. Survival (Mice)
The Kaplan and Meier curves estimating the probabilities of
survival for male and female mice fed L-tryptophan in the diet at
the doses of this bioassay, together with those of the matched
controls, are shown in figure 4.
23

Figure 3. Growth Curves for Mice Fed L-Tryptophan in the Diet
24

Figure 4. Survival Curves for Mice Fed L-Trytophan in the Diet
25

In each sex, the Tarone test result for positive dose-related
trend in mortality is not significant. In male mice, 21/33 (64%)
of the high-dose group, 12/35 (34%) of the low-dose group, and
3/15 (20%) of the matched controls were alive at the last week
(104) of the study. In females, 13/35 (37%) of the high-dose
group, 22/35 (63%) of the low-dose group, and 2/15 (13%) of the
matched-control group lived to the end of the study. More than
50% of the mice in each group of either sex studied lived beyond
week 75 on study, providing sufficient numbers of animals at risk
for the development of late-appearing tumors.
C. Pathology (Mice)
Histopathologic findings on neoplasms in mice are summarized in
Appendix B, tables Bl and B2; findings on nonneoplastic lesions
are summarized in Appendix D, tables Dl and D2.
With the exception of the lymphatic tumors and a few hemato
poietic tumors, the neoplasms listed in Appendix B appeared with
approximately equal frequency in control and dosed mice or
appeared in insignificant numbers.- These lesions are not
uncommon in the B6C3F1 strain of mouse independent of any
treatment.
The incidence of hematopoietic neoplasms was higher in the dosed
than in the matched-control groups, with the highest incidence in
26

the low-dose groups. The incidences
follows:
MALES
Number of Mice Necropsied
Brain: Malignant lymphoma, histiocytic type
Multiple organs, lymphoreticular: Malignant lymphoma, histiocytic or mixed type
Spleen: Malignant lymphoma, lymphocytic type
Mandibular lymph node: Malignant lymphoma, lymphocytic type
Mesenteric lymph node: Malignant lymphoma, lymphocytic or histiocytic type
Liver: Malignant lymphoma, histiocytic type
Total incidence of mice with tumors (%)
of these
Matched Control
(12)
0
0
0
0
0
2
0/12(0)
lesions
Low Dose
(34)
4
1
0
1
2
!_
9/34(26)
were as
High Dose
(33)
0
1
1
0
0
0
2/33(6)
27

Matched Low High Control Dose Dose
FEMALES
Number of Mice Necropsied (13) (33) (35)
Brain: Malignant lymphoma, histiocytic type 0 0 1
Multiple organs, lymphoreticular and hematopoietic: Malignant lymphoma, lymphocytic or histiocytic type 0 5 0 lymphocytic leukemia 0 1 0
Mesenteric lymph node: Malignant lymphoma, histiocytic type 1 0 0
Payer's patches: Malignant lymphoma, histiocytic type _1 _0 j)
Total incidence of mice with tumors (%) 2/13(15) 6/33(18) 1/35(3)
Malignant lymphomas consisted of three cell types. (1) The
lymphocytic type was comprised of cells having a small, darkly
basophilic to large, lightly basophilic vesicular nucleus and a
rim of eosinophilic cytoplasm. (2) The histiocytic type was
comprised of cells with a large, open-faced vesicular nucleus and
a distinct eosinophilic nucleolus. (3) The mixed type was a
combination of the lymphocytic and histiocytic types of cells.
The malignant lymphomas were observed to be either generalized,
involving several organs, or solitary, involving only one organ.
The generalized lymphomas always involved the spleen, liver, and
one or more lymph nodes. The solitary lymphomas involved the
28

spleen, liver, mandibular lymph nodes, mesenteric lymph nodes,
Peyer's patches or brain. The brain lesions usually involved the
meninges and choroid plexuses with variable degrees of
perivascular cuffing.
Neoplastic cells having a small, darkly basophilic nucleus and
minimal cytoplasm were the predominant type of cell in
lymphocytic leukemia. The lymphocytic infiltration within the
liver was diffuse when compared with the more solid arrangement
of the cells during lymphoma. A large area of hemorrhage within
the brain was another feature of the leukemia.
A mast-cell sarcoma involving the wall of the stomach, liver, and
mesentery was observed in a low-dose female. The neoplastic mast
cells had a large, basophilic nucleus and an abundant cytoplasm
engorged with basophilic granules.
In addition to the neoplastic lesions, a number of degenerative,
proliferative, and inflammatory changes were also encountered in
animals of the control and dosed groups (Appendix D). These
nonneoplastic lesions are commonly seen in aged mice; however,
the suppurative lesions involving the trachea and lungs were
associated with early deaths. The decreased life spans,
especially prominent in the low-dose males, high-dose females,
29

and both control groups, may have resulted in a reduced incidence
of tumors in several of these groups.
The incidence of lymphoreticular and other neoplasms of the
hematopoietic system was higher in both male and female low-dose
groups of mice fed L-tryptophan than in either the matched-
control or high-dose mice of either sex.
In the judgment of the pathologists, L-tryptophan may be
associated with the increased incidence of lymphoreticular
neoplasms in low-dose male and female B6C3F1 mice under the
conditions of this bioassay.
D. Statistical Analyses of Results (Mice)
Tables Fl and F2 in Appendix F contain the statistical analyses
of the incidences of those primary tumors that were observed in
at least two animals in one group and with an incidence of at
least 5% in one or more than one group.
In male mice, when the incidence of lymphomas in the low-dose
group is compared with that in the control group, there is a
higher proportion in the low-dose group of male mice (P = 0.048),
but this probability level is above that of 0.025 required for
significance using the Bonferroni inequality for multiple
comparisons. The incidences of this tumor in the high-dose group
30

of male mice and in both dosed groups of female mice are not
statistically significant when the Fisher exact test is applied.
In each sex, the results of the Cochran-Armitage test for
positive dose-related trend and of the Fisher exact test for
direct comparison of the incidence in the matched-control group
with the incidences in each of the dosed groups are not
significant for any of the tumors.
In each of the 95% confidence intervals of relative risk, except
for the occurrence of lymphoma in low-dose male mice, the value
of one is included; this indicates the absence of significant
positive results. It should also be noted that each of the
intervals has an upper limit greater than one, indicating the
theoretical possibility of the induction of tumors by
L-tryptophan, which could not be detected under the conditions of
this test.
31


V. DISCUSSION
There was little evidence that the administration of L-tryptophan
was toxic to rats. Differences in mean body weight among dosed
and control groups were minimal, and survival of the dosed groups
of both sexes was high. Sufficient numbers of rats were at risk
for development of late-appearing tumors.
In the mice, however, the administration of L-tryptophan resulted
in lowered mean body weights throughout most of the study,
particularly in the females. Survival rates were lower in
low-dose males, high-dose females, and corresponding matched
controls than in high-dose males and low-dose females. More than
50% of the mice in each group lived to week 52 or longer; thus,
sufficient numbers of mice were at risk for development of tumors
appearing up to that time.
No neoplasms occurred in a statistically significant incidence
among the dosed rats when compared with the control rats.
In both male and female mice, neoplasms of the hematopoietic
systems (all sites) occurred at higher incidences in the low-dose
groups than in the matched-control groups (males: controls 0/12,
low-dose 9/34, high-dose 2/33; females: controls 2/13, low-dose
6/33, high-dose 1/35); the incidence in females was not
significant, and in males the probability of P = 0.048 was not
33

significant using the Bonferroni correction. Because of the lack
of statistical significance and because of the known variability
of the incidence of these tumors in B6C3F1 mice, they are not
considered to be related to administration of the chemical.
In previous studies, malignant reticuloendothelial tumors and
leukemia were reported in mice administered various metabolites
of tryptophan by oral or subcutaneous routes (Ehrhart and Stich,
1957 and 1958; Ehrhart et al., 1959; Rauschenbach et al., 1963;
Rauschenbach et al. , 1966). In addition, numerous studies have
been conducted to determine the effect of tryptophan on the
carcinogenicity of other compounds. Dunning et al. (1950) and
Kawachi et al. (1968) found that tryptophan increased or extended
the carcinogenicity of known carcinogens, while Okajima et al.
(1971), Oyasu et al. (1972), and Evarts and Brown (1977)
demonstrated that tryptophan decreased the incidence of liver
tumors induced by known carcinogens.
It is concluded that under the conditions of this bioassay,
L-tryptophan was not carcinogenic for Fischer 344 rats or B6C3F1
mice.
34

VI. BIBLIOGRAPHY
Allen, M. J., Boyland, E., Dukes, C. E., Horning, E. S., and Watson, J. G., Cancer of the urinary bladder induced in mice with metabolites of aromatic amines and trytophan. Brit. J. Cancer 11;212-228, 1957.
Armitage, P. , Statistical Methods in Medical Research, John Wiley & Sons, Inc., New York, 1971, pp. 362-365.
Berenblum, I., ed., Carcinogenicity Testing: A Report of £he Panel on Carcinogenicity of the Cancer Research Commission of the UICC, Vol. _2, International Union Against Cancer, Geneva, 1969.
Boyland, E. , Harris, J. , and Horning, E. S., The induction of carcinoma of the bladder in rats with acetamidofluorene. Brit. J. Cancer 8:647-654. 1954.
Bryan, G. T., Brown, R. R., and Price, J. M., Mouse bladder Carcinogenicity of certain tryptophan metabolites and other aromatic nitrogen compounds suspended in cholesterol. Cancer Res. 24:596-602, 1964.
Cox, D. R., Regression models and life tables. J. R. Statist. Soc. B 34 (2):187-220, 1972.
Cox. D. R. , Analysis of Binary Data, Methuen & Co., Ltd., London, 1970, pp. 48-52.
Dictionary of Organic Compounds, Vol. 5, Oxford University Press, New York, 1965, p. 3211.
Dunning, W. F., Curtis, M. R. , and Maun, M. E. , The effect of added dietary tryptophane on the occurrence of 2-acetylaminofluorene-induced liver and bladder cancer in rats. Cancer Res. 10(7):454-459, 1950.
Ehrhart, H. , Georgii, A., and Stanislawksi, K. Ueber die leukamogene Wirkung von 3-Hydroxy-anthranilsaure bei RFH-Mausen. Klinische Wochenschrift 37(20);1054-1059, 1959.
Ehrhart, H. and Stich, W., Leukamieerzeugung bei Mausen durch Injektion wassriger Indicanlosung. Klinische Wochenschrift 36(22):1056-1061, 1958.
35

Ehrhart, H. and Stich, W., Die Indol-Leukatnie bei der weissen Maus. Klinische Wochenschrift 35(10);504-511. 1957.
Evarts, R. P. and Brown, C. A., Effect of L-tryptophan on diethylnitrosamine and 3'-methyl-4-N-dimethylaminoazobenzene hepatocarcinogenesis. Fd. Cosmet. Toxicol. 15;431-435, 1977.
Food and Agriculture Organization of the United Nations, Amino-Acid Content of Foods and Biological Data on Proteins, No. 24, Food and Agriculture Organization, Rome, 1970.
Gart J. . J. The comparison of proportions: a review of significance tests, confidence limits and adjustments for stratification. Rev. Int. Stat. Inst. 39 (2):148-169, 1971.
Kaplan, E. L. and Meier, P., Nonparametric estimation from incomplete observations. J. Am. Statist. Assoc. 53;457-481, 1958.
Kawachi, T., Hirata, Y. , and Sugimura, T., Enhancement of N-nitrosodiethylamine hepatocarcinogenesis by L-tryptophan in rats. GANN 59:523-525, 1968.
Linhart, M. S., Cooper, J. A., Martin, R. L., Page, N. P., and Peters, J. A., Carcinogenesis bioassay data system. Comp. and Biomed. Res. 7:230-248, 1974.
Miller, R. G«, Jr., Simultaneous Statistical Inference, McGraw-Hill Book Co., New York, 1966, pp. 6-10.
Okajima, E., Hiramatsu, T., Motomiya, Y., Iriya, K., Ijuin, M., and Ito, N., Effect of DL-tryptophan on tumorigenesis in the urinary bladder and liver of rats treated with N-nitrosodibutylamine. GANN 62:163-169, 1971.
Or ten, J. M. and Neuhaus, 0. W., Basic principles of biochemistry. Human Biochemistry, The C. V. Mosby Co., St. Louis, 1975, pp. 332-336.
Oyasu, R., Kitajima, T., Hopp, M., and Sumie, H. , Enhancement of urinary bladder tumorigenesis in hamsters by coadministration of 2-acetylaminofluorene and indole. Cancer Res. 2̂: 2027-2033, 1972.
36

Radomski, J. L. , Radomski, T. , and MacDonald, W. E., Cocarcinogenic interaction between D,L-tryptophan and 4-aminobiphenyl or 2-naphthylamine in dogs. J. Natl. Cancer Inst. 58(6);1831-1834. 1977.
Radomski, J. L. , Deichmann, W. B., and Brill, E. , Tryptophan as a co-carcinogen in bladder cancer. Proc. Am. Assoc. Cancer Res. 10:71, 1969.
Radomski, J. L. , Deichmann, W. B., and Brill, E. , Transitional cell hyperplasia in the bladders of dogs fed trytophan. Proc. Am. Assoc. Cancer Res. 11;65, 1970.
Rauschenbach, M. 0., Zharova, E. I., Ivanova, W. D., Kuznezova, L. E. , Miasitcheva, N. W., and Sergeev, A. V., The investigation of the mechanisms of leucomogenic action of the tryptophan metabolites. Ninth International Cancer Congress, Abstracts, Cancer Institute, Tokyo, 1966, p. 194.
Rauschenbach, M. 0., Jarova, E. I., and Protasova, T. C., Blastomogenic properties of certain metabolites of tryptophane. Acta-Unio Internationalis Contra Canerum :̂ 660-662, 1963.
Saffiotti, U. , Montesano, R., Sellakumar, A. R., Cefis, F., and Kaufman, D. G., Respiratory tract carcinogenesis in hamsters induced by different numbers of administrations of benzo (a) pyrene and ferric oxide. Cancer Res. 32;1073-1081, 1972.
Stecher, P. G. , ed., The Merck Index, 8th ed., Merck & Co., Inc. Rahway, N. J., 1968, pp. 216 and 1086.
Tarone, R. E., Tests for trend in life table analysis. Biometrika 62 (3):679-682, 1975.
37


APPENDIX A
SUMMARY OF THE INCIDENCE OF NEOPLASMS IN
RATS FED L-TRYPTOPHAN IN THE DIET
39


TABLE A1.
SUMMARY OF THE INCIDENCE OF NEOPLASMS IN MALE RATS FED L-TRYPTOPHAN IN THE DIET
MATCHED LOW DOSE HIGH DOSE CONTROL
ANIMALS INITIALLY IN STUDY 15 35 35 ANIMALS NECROPSIED 15 3U 34 ANIMALS EXAMINED HISTOPATHOL06ICALLY 15 3« 34
INTEGUMENTARY SYSTEM
*SKIN (15) <3t) (34) SQUAHOUS CELL PAPILLOHA 1 (3«) SQUAMOUS CELI CARCINOMA 1 (7%)
*SUBCUT TISSDE FIBROMA LI POMA NEUROFIBROSARCONA
(15) (34) 4 (12«) 1 (3%)
(34) 3 1 1
(9X) (3%) (3%)
RESPIRATORY SYSTEM
tLUNG (15) (34) (34) ALVTOLAR/BRONCHIOLAR ADENOMA 1 (7%) ALVEOLAR/BRONCHIOLAR CARCINOMA 1 (3%) 1 (3*) NEUROFIPROSARCOMA, MET^STATIC 1 (3%)
HEMATOPOIETIC SYSTEM
*NULTIPLE ORGANS (15) (34) (34) LEUKEMIA, NOS 1 (3X) ONDIFFERENTIATED LEUKEMIA U (21%) 2 (6X) LYMPHOCYTIC LEUKEMIA 1 (3*)
tMANDIBULAR L. NODE (2) (4) (9)NEUROFIBROSARCOMA, METASTATIC 1 (11*)
CIRCULATORY SYSTEM
fMYOCARDIUM (15) (34) (34) FIBROMA . __ L.I7J1 _
I NUHBER OF ANIMALS WITH TISSUE EXAMINED MICROSCOPICALLY * NUMBER OF ANIMALS NECROPSIFD
41

TABLE A1. MALE RATS: NEOPLASMS (CONTINUED)
MATCHED LOW DOSE CONTROL
DIGESTIVE SYSTEH
iCOLON (15) (34) ** A D E N O H A T O U S POLYP, NOS
MOCINOUS ADENOCARCINOHA
U R I N A R Y SYSTEH
N O N E
E N D O C R I N E SYSTEM
#PITUITARY (11) (30) C H R O H O P H O B E A D E N O M A 1 (9%) 2 (7X) C R A N I O P H A R Y N G I O M A 1 (3X)
# A D R E N A L (15) (34) P H E O C H R O M O C Y T O M A 1 ( 3 X ) G A N G L I O N E U R O M A
# T H Y R O I D (1«) (33) F 3 L L I C U L A R - C E L L C A R C I N O M A 2 (6«) C-CELL A D E N O M A 4 (29%) 2 (6%) C-CELL C A R C I N O M A 1 ( 7 % ) U (12«) M U C I N O U S A D E N O C A R C I N O M A 1 (3«)
t P A N C R E A T I C ISLETS (15) (33) ISLET-CELL A D E N O M A 2 (6%) ISLET-CELL C A R C I N O M A
R E P R O D U C T I V E S Y S T E M
* M A M M A R Y G L A N D (15) ( 3 U ) F I B R O A D E N O H A 2 (13X)
#TESTIS (15) (34) I N T E R S T I T I A L - C E L L T U M O R 13 (87%) 31 (91%)
N E R V O U S S Y S T E M
N O N E
t NUMBER OF ANIMALS WITH TISSUE EXAMINED MICROSCOPICALLY * NUMBER OF ANIMALS NECROPSIED
HIGH DOSE
(34) 1 ( 3 % ) 1 (3%)
(30) 5 ( 1 7 % )
(34)
1 ( 3 % )
(32)
1 (3%)
(34)
1 ( 3 % )
(34)
(33) 21 ( 6 4 % )
42
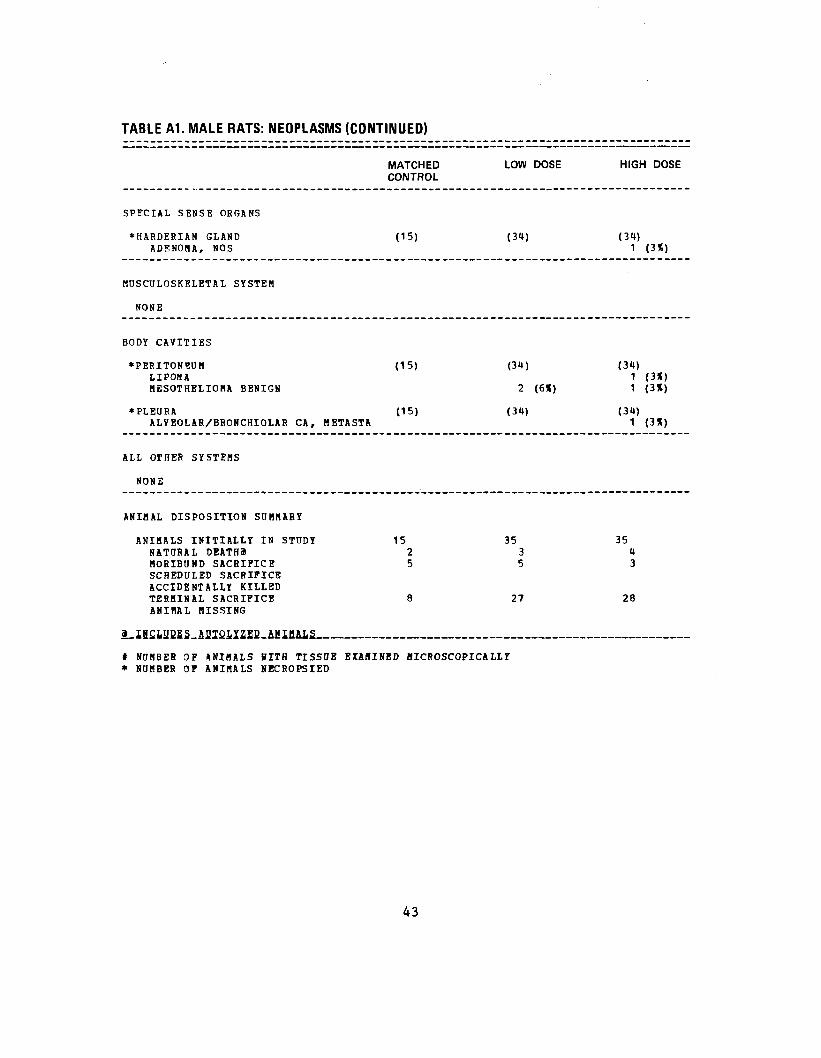
TABLE A1. MALE RATS: NEOPLASMS (CONTINUED)
HIGH DOSE
(34) 1 (3*)
(34) 1 (3«) 1 (3%)
(34) 1 (3X)
35 4 3
28
SPECIAL S E N S E O R G A N S
+ H A R D E R I A N G L A N D A D E N O H A , N O S
M O S C U L O S K E L E T A L SYSTEM
N O N E
BODY C A V I T I E S
* P E R I T O N S U N LIPOBA BESOTHELIOBA B E N I G N
* P L E U R A A L V E O L A R / B R O N C H I O L A R CA, HETASTA
ALL OTHER SYSTEMS
N O N E
A N I M A L DISPOSITION S U M M A R Y
ANIMALS INITIALLY INN A T U R A L DEATHS M O R I B U N D SACRIFICE SCHEDULED SACRIFICE A C C I D E N T A L L Y KILLED T E R M I N A L SACRIFICE A N I M A L MISSING
STUDY
MATCHED LOW DOSE CONTROL
(15) (34)
(15) (34)
2 (6*)
(15) (34)
15 35 2 3 5 5
8 27
9_iaCfc2DES_ADTOiY2ID_MIHM.S
t N U M B E R OF ANIMALS HITH TISSUE EXAMINED BICROSCOPICALLY * N U M B E R OF A N I M A L S NECROPSIED
43

TABLE A1. MALE RATS: NEOPLASMS (CONTINUED)
l\HATCHED LOW DOSE HIGH DOSE (JONTROL
TUMOR SUMMARY
TOTAL ANIMALS WITH PRIMARY TDHORS* 1i» 32 29 TOTAL PRIMARY TUMORS 28 58 U1
TOTAL ANIMALS WITH BENIGN TUHORS 14 32 26 TOTAL BENIGN TUMORS 22 46 36
TOTAL ANIMALS WITH MALIGNANT TUMORS U 10 5 TOTAL MALIGNANT TUMORS 6 11 5
TOTAL ANIMALS WITH SECONDARY TUMORS 1 2 TOTAL SECONDARY TUMORS 3
_ TOTAL ANIMALS WITH TUMORS UNCERTAIN BENIGN OR MALIGNANT 1
TOTAL UNCERTAIN TUHORS 1
-PRIMARY OR HETASTATIC
TOTAL UNCERTAIN TUHORS
TOTAL ANIMALS WITH TUHORS UNCERTAIN
* PRIHARY TOHORS: ALL TOBOBS EXCEPT SECONDARY TtJHORS * S E C O N D A R Y TOHORS: HETASTATIC TnHORS 3R TOHORS I N V A S I V E INTO AN ADJACENT ORGAN
44

TABLE A2.
SUMMARY OF THE INCIDENCE OF NEOPLASMS IN FEMALE RATS FED L-TRYPTOPHAN IN THE DIET
ANIMALS INITIALLY IN STODY ANIMALS NECROPSIED ANIBALS EXAMINED HISTOPATHOLOGICALLY
INTEGUBENTARY SYSTEM
*SOBCOT TISSUE LIPOMA
RESPIRATORY SYSTEM
CLUNG ADENOCARCINOBA, NOS, METASTATIC ALVEOLAR/BBONCHIOLAR ADENOMA
HEMATOPOIETIC SYSTEM
*MULTIPLE ORGANS UNDIPFERENTIATED LEUKEMIA
fBEDIASTINAL L.NODE ADENOCARCINOMA, NOS, BETASTATIC
CIRCULATORY SYSTEB
NONE
DIGESTIVE SYSTEM
NONE
URINARY SYSTEB
NONE
MATCHED LOW DOSE HIGH DOSE CONTROL
15 35 35 14 35 3U 1U 35 3U
(1l») (35) (3U) 1 (3%)
(1"0 (35) 1 (3X)
(3U)
1 (7%)
(1K) (35) (3U) 1 (If,)
(3) (5) (2) 1 (20%)
# NUMBER OF ANIMALS WITH TISSUE EXAMINED MICROSCOPICALLY * NUMBER OF ANIMALS NECROPSIFD
45

TABLE A2. FEMALE RATS: NEOPLASMS (CONTINUED)
HIGH DOSE
(32) 9 (28*) 2 (6%)
(3t) 1 ( 3X)
1 (3%)
(33)
1 (3«)
(3«)2 (6«) 1 ( 3 X ) 2 ( 6 % )
(33) 1 (3S)
3 ( 9 X )
(34)
ENDOCRINE SYSTEM
I P I T U I T A R YC H R O H O P H O B E A D E N O M AC H R O M O P H O B E C A R C I N O M A
# A D R E N A LC O R T I C A L A D E N O M A P H E O C H R O M O C Y T O M APHEOCHROMOCYTOMA, M A L I G N A N T
# T H Y B O I DFOLLICOLAR-CELL CARCINOMA C-CELL A D E N O M A
REPRODUCTIVE SYSTEM
* M A H M A R Y G L A N DA D E N O M A , N O S A D E N O C A R C I N O M A , NOS F I B R O f t D E N O M A
*UTERUSA D E H O C A R C I N O M A , N O S S A R C O M A . N O S E N D O M E T R I A L S T R O M A L POLYP
N E R V O U S S Y S T E M
N O N E
SPECIAL S E N S E O R G A N S
N O N E
M D S C U L O S K E L E T A L S Y S T E M
N O N E
BODY C A V I T I E S
* P E R I T O N S U MA D E N O C A R C I N O M A . , ' NOS. METASTATIC
MATCHED LOW DOSE CONTROL
(12) (27) 1* (33X) 12 (HH%)
1 («) (1H) (35)
1 (7X)
( 1 < » ) (32) 1 (3X)
1 (7X) 2 (6%)
( 1 U ) (35)
4 (29%) 7 (20%)
(13) (35) 1 (3%) 1 (3X)
3 (23%) 3 (•)%)
( 1 < 4 ) (35) 1 J3X) .
* NUMBER OF ANIMALS WITH TISSUE EXAMINED MICROSCOPICALLY * NUMBER OF ANIMALS NECROPSIED
46

TABLE A2. FEMALE RATS: NEOPLASMS (CONTINUED)
p/IATCHED (CONTROL
ALL OTHER SYSTEMS
NONE
ANIMAL DISPOSITION SDMMARY
ANIMRLS INITIALLY IN STUDY NATURAL DEATHS MORIBUND SACRIFICE SCHEDULED SACRIFICE ACCIDENTALLY KILLED TERMINAL SACRIFICE ANIMAL MISSING
3 INCLUDES AUTOLYZED ANIMALS
TUMOR SUMMARY
TOTAL ANIMALS WITH PRIMARY TUMORS* TOTAL PRIMARY TUMORS
TOTAL ANIMALS WITH BENIGN TUMORS TOTAL BENIGN TUMORS
TOTAL ANIMALS WITH MALIGNANT TUMORS TOTAL MALIGNANT TUMORS
TOTAL ANIMALS WITH SECONDARY TUMORS TOTAL SECONDARY TUMORS
TOTAL ANIMALS WITH TUMORS UNCERTAIN BENIGN OR MALIGNANT
TOTAL UNCERTAIN TUMORS
TOTAL ANIMALS WITH TUMORS UNCERTAIN PRIMARY OR METASTATIC
TOTAL UNCERTAIN TUMORS
15 3 1
11
11 15
11 1U
1 1
*
_
_
LOW DOSE HIGH DOSE
35 35 2 1 7 3
26 31
2H 19 29 23
21 15 25 18
U 5 H 5
1 3
* PRIMARY TUMORS: ALL TUMORS EXCEPT SECONDARY TOMORS * SECONDARY TDMORS: MBTASTATIC TOBORS OR TOMORS INVASIVE INTO AN ADJACENT ORGAN
47

APPENDIX B
SUMMARY OF THE INCIDENCE OF NEOPLASMS IN
MICE FED L-TRYPTOPHAN IN THE DIET
49


TABLE B1.
SUMMARY OF THE INCIDENCE OF NEOPLASMS IN MALE MICE FED L-TRYPTOPHAN IN THE DIET
MATCHED LOW DOSE HIGH DOSE CONTROL
ANIHALS INITIALLY IN STUDY 15 35 335 A N I M A L S N E C B O P S I E D 12 3H 33 ANIHALS E X A H I N E D HISTOPATHOLOGICALLY 12 3i» 33
I N T E G U M E N T A R Y SYSTEM
*SOBCUT TISSUE (12) (3<») (33) FIBROSARCOMA 1 (3*) 1 (3*)
R E S P I R A T O R Y SYSTEM
*LUNG (12) (33) (32) ALVEOLAR/BRONCHIOLAR ADENOMA 3 (9%) 2 (6*) A L V B O L A R / B R O N C H I O L A H C A R C I N O M A 1 (3X)
HEMATOPOIETIC SYSTEM
*BRAIN (11) (32) (32) M A L I G . L Y H P H O N A , HISTIOCYTIC TYPE i» (13«)
*MULTIPLE O R G A N S (12) (34) (33) M A L I 3 . L Y M P H O M A , HISTIOCYTIC TYPE i 1 (3X) M A L I G N A N T L Y M P H O M A , M I X E D TYPE 1 (3*)
ISPLEEN (11) (32) (32) M A L I G . L Y M P H O M A , LYBPHOCYTIC TYPE 1 (3«)
t M A N D I B O L A R L. NODE CO (HO (3) M A L I G . L Y H P H O M A , LYMPHOCYTIC TYPE 1 (7«)
#MESENTBHIC L. NODE (») (10) (3) BALIG. L Y M P H O M A , LYMPHOCYTIC TYPE 1 (7X) BALIS. L Y H P H O H A , HISTIOCYTIC TYPE 1 (7*)
*LIVER (12) (3«) (33) M A L I G . L Y H P H O M A , HISTIOCYTIC TYPE 1 (3*)
CIRCULATORY SYSTEM
NONE
t RUBBER OF ANIMALS KITH TISSUE EXABINED MICROSCOPICALLY * NOBBER OF AMIHALS NECROPSIED
» 35 MilHALS 8BRE IMITIALLY IN THE STUDY, EOT TWO AIHALS WEBB FOUND TO BE
FEMALES IN A HALE GROUP.
51

TABLE B1. MALE MICE: NEOPLASMS (CONTINUED)
DIGESTIVE SYSTEM
fLIVER HEPATOCELLDLAR ADENOMA HEPATOCEILOLAR CARCINOMA
DRINARY SYSTEM
NONE
ENDOCRINE SYSTEM
tTHYROID FOLLICULAR-CELL ADENOMA
REPRODUCTIVE SYSTEM
NONE
NERVOUS SYSTEM
*TRIGEMINAL GANGLION NEURILEMOMA, MALIGNANT
SPECIAL SENSE ORGANS
NONE
MUSCULOSKELETAl SYSTEM
NONE
BODY CAVITIES
NONE
ALL OTHER SYSTEMS
NONE
MATCHED LOW DOSE HIGH DOSE CONTROL
(12) (31) (33) 1 (8X) 4 (12%) 5 (15X)
1 (3*) 2 (6%)
(11) (31) (28) 1 (3«)
(12) (3<») (33) 2 (6%)
# NUMBER OF ANIMALS WITH TISSUE EXAMINED MICROSCOPICALLY * NUMBER OF ANIMALS NECROPSIED
52

TABLE B1. MALE MICE: NEOPLASMS (CONTINUED)
"
ANIMAL DISPOSITION SUMMARY
ANIMALS INITIALLY IN STUDY NATURAL DEATH9 MORIBUND SACRIFICE SCHEDULED SACRIFICE ACCIDENTALLY KILLED TERMINAL SACRIFICE ANIMAL MISSING ANIMAL DELITED (WRONG SEX)
3 INCLUDES AUTOLYZED ANIMALS
TUMOR SUMMARY
TOTAL ANIMALS WITH PRIMARY TUMORS* TOTAL PRIMARY TUMORS
TOTAL ANIMALS WITH BENIGN TUMORS TOTAL BENIGN TUMORS
TOTAL ANIMALS WITH MALIGNANT TUMORS TOTAL MALIGNANT TUMORS
TOTAL ANIMALS WITH SECONDARY TUMORS TOTAL SECONDARY TUMORS
TOTAL ANIMALS WITH TUMORS UNCERTAIN BENIGN OR MALIGNANT
TOTAL UNCERTAIN TUMORS
TOTAL ANIMALS WITH TUMORS UNCERTAIN PRIMARY OR METASTATIC
TOTAL UNCERTAIN TUMORS
MATCHED LOW DOSE HIGH DOSE CONTROL
15 35 35 5 9 8 5 13 5
2 1 3 12 20
2
1 15 12 1 22 12
1 7 7 1 8 7
12 5 1U 5
*
_
_
* PRIMARY TUMORS: ALL TUMORS EXCEPT SECONDARY TUMORS t SECONDARY TUMORS: BETASTATIC TUMORS 3R TUMORS INVASIVE INTO AN ADJACENT ORGAN
53

TABLE B2.
SUMMARY OF THE INCIDENCE OF NEOPLASMS IN FEMALE MICE FED L-TRYPTOPHAN IN THE DIET
rHATCHED LOW DOSE HIGH DOSE (CONTROL
A N I M A L S I N I T I A L L Y IN STUDY 15 35 35 A N I M A L S NECROPSIED 13 33 35 A N I M A L S E X A M I N E D HISTOPATHOLOGICALLY 13 33 35
I N T E G U M E N T A R Y SYSTEM
*SUBCUT TISSUE (13) (33) (35) SARCOMA, NOS 1 (3X)
RESPIBATORY SYSTEM
t L U N G (13) (32) (35) A L V E O L A R / B R O N C H I O L A H A D E N O M A 1 (8X) 1 (3%)
H E M A T O P O I E T I C SYSTEM
tBRAIN (12) (33) (35) M A L I G . L Y M P H O M A , HISTIOCYTIC TYPE 1 (3X)
*MDLTIPLE O R G A N S (13) (33) (35) M A L I G . L Y M P H O M A , LYMPHOCYTIC TYPE 1 (3X) M A L I 3 . L Y M P H O M A , HISTIOCYTIC TYPE 4 (12X) MAST-CELL SARCOMA 1 (3X) LYHPHOCYTIC L E U K E M I A 1 (3X)
tBESENTERIC L. NODE (<») (17) (15) M A L I G . L Y M P H O M A , HISTIOCYTIC TYPE 1 (25X)
IPEYERS P A T C H (13) (33) (35) H A L I G . L Y M P H O M A , HISTIOCYTIC TYPE 1 <8X)
CIRCULATORY SYSTEM
NONE
DIGESTIVE SYSTEM
f L I V E R (13) (32) (35) HfPATQCELLOLAR UDEHOHA ._ __1_I34L ._ __«
* NDMBER OF ANIHALS HITH TISSUE EXAMINED MICROSCOPICALLY * NUMBER OF ANIMALS NECROPSIED
54

TABLE B2. FEMALE MICE: NEOPLASMS (CONTINUED)
MATCHED LOW DOSE HIGH DOSE CONTROL
HEPATOCELLULAR CARCINOBA 1 (3%)
U R I N A R Y SYSTEM
N O N E
E N D O C R I N E S Y S T E M
t P I T U I T A R Y (5) (22) (28) C H R O M O P H O B E A D E N O M A 1 (20*) 1 (5%)
R E P R O D U C T I V E S Y S T E M
# U T E R U S (13) (32) (3U) ENDONETRIAL STROBAL POLYP 1 (3%)
NERVOUS SYSTEM
* T R I G E B I N A L G A N G L I O N (13) (33) (35) N E U R I L E M O M A , M A L I G N A N T 1 (3*)
SPECIAL SENSE ORGANS
N O N E
M O S C U L O S K E L E T A L SYSTEM
N O N E
BODY C A V I T I E S
*PERITONEUM (13) (33) (35) S A R C O M A , NOS 1 (3*)
ALL OTHEH SYSTEMS
NQS?
I NDHBER OF ANIMALS WITH TISSUE EXAMINED HICROSCOPICALLT * NUMBER OF ANIMALS NECROPSIED
55

TABLE B2. FEMALE MICE: NEOPLASMS (CONTINUED)
ANIMAL DISPOSITION SOBHARY
ANIMALS INITIALLY IN STODY NATURAL DEATHS MORIBUND SACRIFICE SCHEDULED SACRIFICE ACCIDENTALLY KILLED TERMINAL SACRIFICE ANIMAL MISSING
3 INCLUDES AUTOLYZED ANIMALS
TUMOR SUMMARY
MIATCHED CONTROL
15 3
10
2
TOTAL ANIMALS WITH PRIMARY TUMORS* TOTAL PRIMARY TUMORS
3 H
TOTAL ANIMALS WITH BENIGN TUMORS TOTAL BENIGN T'JMORS
2 2
TOTAL ANIMALS WITH MALIGNANT TUMORS TOTAL MALIGNANT TUMORS
2 2
TOTAL ANIMALS WITH SECONDARY TUMORS TOTAL SECONDARY TUMORS
#
TOTAL ANIMALS WITH TUMORS UNCERTAIN BENIGN OR MALIGNANT TOTAL UNCERTAIN TUMORS
-
TOTAL ANIMALS WITH TUMORS UNCERTAIN PRIMARY OR METASTATIC
_
TOTAL UNCERTAIN TUMORS
* PRIMARY TUMORS: ALL TUHORS EXCEPT SECONDARY TUMORS
LOW DOSE HIGH DOSE
35 7 6
35 6
16
22 13
11 13
3 3
3 10
3 3
1 1
2 2
* SECONDARY TUMORS: METASTATIC TDMOR3 OR TUMORS INVASIVE INTO AN ADJACENT ORGAN
56
APPENDIX C
SUMMARY OF THE INCIDENCE OF NONNEOPLASTIC LESIONS
IN RATS FED L-TRYPTOPHAN IN THE DIET
57


TABLE C1.
SUMMARY OF THE INCIDENCE OF NONNEOPLASTIC LESIONS IN MALE RATS FED L-TRYPTOPHAN IN THE DIET
MATCHED LOW DOSE HIGH DOSE 0ONTROL
ANIMALS INITIALLY IN STUDY 15 35 35 ANIHALS NECROPSIED 15 34 34 (.ANIMALS EXAMINED HISTOPATHOLOGICALLY 15 34 34
INTEGUHENTARY SYSTEH
*SKIN (15) (34) (34) EPIDERMAL INCLUSION CYST 1 (7*) 1 (3%) 2 (6%) INFLAMMATION, FOCAL 1 (3X) INFLAMMATION, NECROTIZING 1 (3%)
*SUBCUT TISSUE (15) (3<») (34) HEMORRHAGE 1 (3*) HEMORRHAGIC CYST 1 (3X) HEMORRHAGE, CHRONIC 1 (3%)
RESPIRATORY SYSTEM
*TRACHEA INFLAMMATION, SUPPURATIVE
(I'M5 (36%)
(33) 8 (24«)
(34) 8 (24%)•
PLASMA-CELL INFILTRATE 1 (3%)
#LUNGPNEUMONIA INTERSTITIAL CHRONIC
(15) (34) 1 (3%)
(34)
BBONCHOPNEUMONIA CHRONIC SUPPURA HYPERPLASIA, ALVEOLAR EPITHELIUM
1 (7%) 1 (3*) 1 (3X)
METAPLASIA, SQUAMOUS 1 (3%)
tLUNG/ALVEOLI EMPHYSEMA, NOS
(15) (34) 1 (3%)
(34)
H*MATOPOIETIC SYSTEM
#BONE MARROW (15) (34) (31) ATROPHY, NOS 2 (13*) 7 (21X) 11 (35%)
*SPLEEN (15) (34) (34) -HYPERPLASIAi LYMPHOID_ .__ __!-J3*j.__
t NUMBER OF ANIMALS WITH TISSUE EXAMINED MICROSCOPICALLY * NUMBER OF ANIMALS NECROPSIED
59

TABLE C1. MALE RATS: NONNEOPLASTIC LESIONS (CONTINUED)
HIGH DOSE
(9)
(9)
(31)
(3t) 1 ( 3 % ) 1 ( 3 % )
(31)
(31)
(31) 1 (3%) 1 (3%)
(31)
(31)31 (91%)
(32) 1 1IS)__
H B M A T O P O I E S I S
# M A N D I B U L A R L. NODE H Y P E R P L A S I A , P L A S M A CELL
# M E S E N T E R I C L. NODE H Y P E R P L A S I A , L Y B P H O I D
C I R C U L A T O R Y S Y S T E M
# H Y O C A R D I O H CALCIFICATION, DYSTROPHIC
DIGESTIVE S Y S T E M
f L I V E R I N F L A M M A T I O N , N E C R O T I Z I N G H Y P E R P L A S I A , N O D U L A R H E M A T 3 P O I E S I S
# L I V E R / C E N T R I L O B U L A R N E C R O S I S , C O A G O L A T I V E
# P A N C R E A S A T R O P H Y , NOS
t P A N C R E A T I C A C I N U S A T R O P H Y , NOS A T R O P H Y , FOCAL
*PEYERS P A T C H H Y P E R P L A S I A ,
U R I N A B Y SYSTEM
I K I D N E Y I N F L A M M A T I O N ,
ENDOCRINE SYSTEM
tTHYHOID
L Y M P H O I D
C H R O N I C
-HIElRPLASIAi.C^ELL
MATCHED CONTROL
2 (13%)
(2)
(2 )
(15) 1 (7%)
(15)
1 (7%) 2 (13%)
(15) 1 (7%)
(15)
(15)
(15)
(15) 11 (93%)
(11*) .
LOW DOSE
2 (6%)
(1)1 (25%)
W 1 (25%)
( 3 U )
(34)
2 (6%) 1 (3%)
(3H)
(33) 1 (3%)
(33) 2 (6%)
(3«) 1 (3%)
( 3 U ) 30 (88%)
(33) 2_16JL
I NDHBER OF ANIMALS WITH TISSUE EXAMINED MICROSCOPICALLY * NUMBER OF ANIMALS NECROPSIED
60

TABLE C1. MALE RATS: NONNEOPLASTIC LESIONS (CONTINUED)
HIGH DOSE
(34) 1 (3%)
(34)
(34) 1 (3X) 2 (6X>
(33) 2 (6X)
(34)
(34)
(34) 1 (3X)
(34) 1 (3X)
(34)
REPRODUCTIVE SYSTEM
*NAM(JARY GLAND CYST, NOS
*PREPUTIAL GLAND INFLAMMATION, CHRONIC SUPPDRATIV HYPERKERATCSIS
*PROSTATE INFLAMMATION, SOPPORATIVE INFLAMMATION, CHRONIC SOPPUHATIV
tTESTIS ATROPHY, NOS
NERVOUS SYSTEM
tBRAIN HEMORRHAGE MALACIA
SPECIAL SENSE ORGANS
*EYE PUS
* EYE/CORNEA INFLAMMATION, CHRONIC
*EYE/CRYSTALLINE LENS HINEFALIZATION
HUSCTJLOSKELETAL SYSTEM
NONE
BODY CAVITIES
*PERITONEUH NECROSIS. FAT
MATCHED CONTROL
(15)
(15)
(15)
(15)
(15) 3 (20*) 1 (7%)
(15) 1 (7*)
(15)
(15)
(15)
LOW DOSE
(34) 1 (3%)
(34) 1 (3X) 1 (3*)
(33) 1 (3X)
(34)
(34)
(34)
(34)
(34) 1 (3X)
(34) 1_13X)
t SOMBER OF ANIMALS WITH TISSOE EXAMINED MICROSCOPICALLY * NUMBER OF ANIMALS NECHOPSIED
61

TABLE C1. MALE RATS: NONNEOPLASTIC LESIONS (CONTINUED)
MATCHED CONTROL
LOW DOSE HIGH DOSE
ALL OTHER
N O N E
SYSTEMS
SPECIAL H O P P H O L O G T S U H H A R Y
A U T O L Y S I S / N O N E C R O P S Y " 1
* NUHBER OF ANIMALS WITH TISSUE EXAMINED MICROSCOPICALLY * NUMBER OF ANIMALS NECROPSIED
1
62
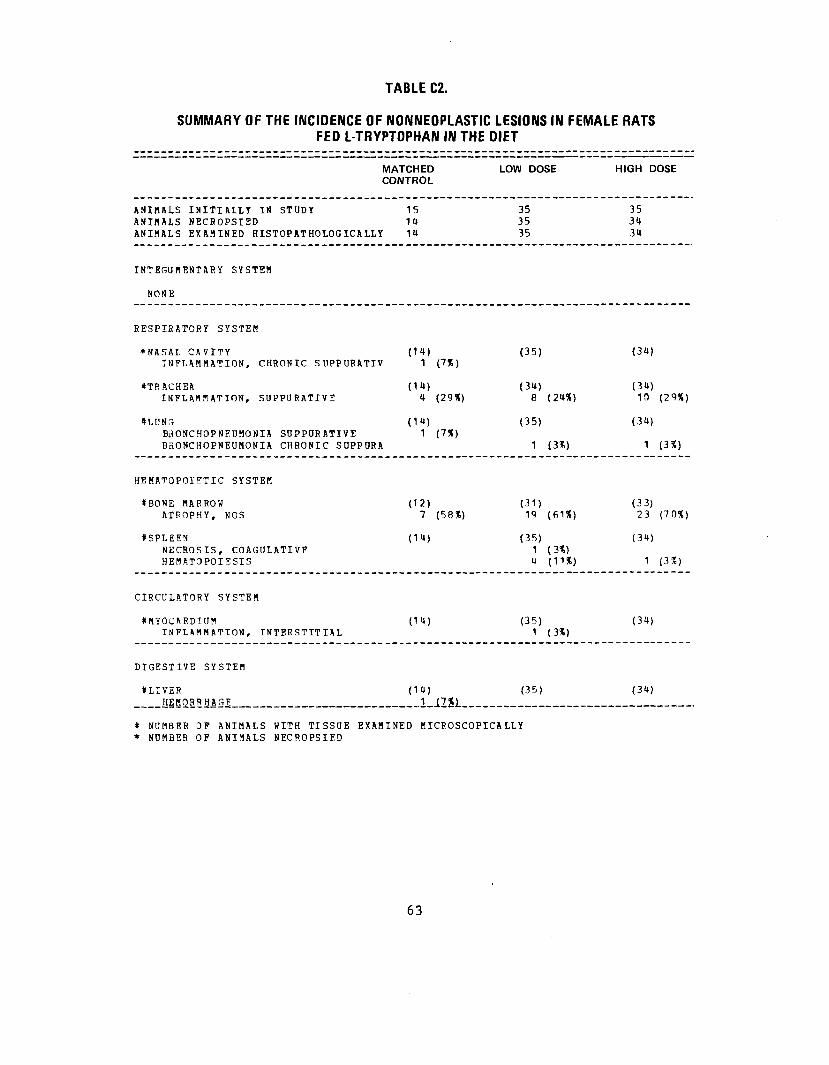
TABLE C2.
SUMMARY OF THE INCIDENCE OF NONNEOPLASTIC LESIONS IN FEMALE RATS FED L-TRYPTOPHAN IN THE DIET
MATCHED LOW DOSE HIGH DOSE 1CONTROL
ANIMALS INITIALLY IN STUDY 15 35 35 ANIMALS NECROPSIED 1ft 35 3ft ANIMALS EXAMINED HISTOPATHOLOGICALLY 1ft 35 3ft
INTEGUMENTARY SYSTEM
NONE
RESPIRATORY SYSTEM
*NASAL CAVITY (1ft) (35) (3ft) INFLAMMATION, CHRONIC SUPPURATIV 1 (1%)
tTRACHEA (1ft) (3ft) (3ft) INFLAMMATION, SOPPURATIVE ft (29%) 8 (2ft*) 10 (29%)
tLUNG (1ft) (35) (3ft) B30NCHOPNEOMONIA SUPPORATIVE 1 (7%) BRONCHOPNEUMONIA CHRONIC SDPPORA 1 (3%) 1 (3%)
HEHATOPOIBTIC SYSTEM
tBONE MARROW (12) (31) (33) ATROPHY, NOS 7 (58%) 19 (61%) 23 (70%)
ISPLEEN (1ft) (35) (34) NECROSIS, COAGULATIVF 1 (3%) HEMAT3POIESIS ft (11%) 1 (3%)
CIHCDLATORY SYSTEM
#MYOCARDIUM (1ft) (35) (3ft) INFLAMMATION, INTERSTITIAL 1 (3%)
DIGESTIVE SYSTEM
#LIVBR (1ft) (35) (3ft) HEMORRHAGE . 1 1Z*±._
t NUMBER OP ANIMALS WITH TISSUE EXAMINED MICBOSCOPICALLY * NUMBER OF ANIMALS NECROPSIED
63

TABLE C2. FEMALE RATS: NONNEOPLASTIC LESIONS (CONTINUED)
MATCHED LOW DOSE CONTROL
CYTOPLASMIC VACUOLI ZATION 1 (3%) FOCAL CEILULAR CHANGE HYPERPLASIA, NODULAR HEMATOPOIESIS 1 (3%)
#PANCREATIC ACINUS (It) (35) ATROPHY, NOS 1 (3%) ATROPHY, FOCAL
URINABY SYSTEM
#KIDNEY (1«) (35) MINERALIZATION 1 (3«) PYELONEPHRITIS SOPPURATIVE 1 (3%) INFLAMMATION, CHRONIC 10 (71%) 19 (5U«) NECROSIS, MEDOLLARY 1 (3X)
ENDOCRINE SYSTEM
NONE
REPRODUCTIVE SYSTEM
*MAMSARY GLANE CYST, NOS
(1i») 6 (43%)
(35) 1 (3*)
fOTEKUS DECIDUAL ALTERATION, NOS
(13) (35)
ICERVIX UTERI CYST, NOS
(13) 1 (8*)
(35)
tUTEROS/ENDOMETRIUM INFLAHHATION, StJPPORATIVE HYPERPLASIA, CYSTIC
(13) 3 (23%) 1 (8%)
(35) 7 (20X) « (11*)
#OVARY/OVIDUCT INFLAMMATION, SOPPORATIVE
(13) (35)
tOVARY CYST, NOS
(13) 9 (69*)
(32) 10 (HU%)
INFLAMMiTIONi.SOPPORATIVE
* NUHBER OF ANIMALS WITH TISSUE EXAMINED MICROSCOPICALLY * NUMBER OF ANIMALS NECROPSIED
HIGH DOSE
1 (3X) 1 (3%)
(31) 1 (3X) 1 (3%)
(3t)
24 (71%)
(3t) 1 (3%)
(33) 1 (3%)
(33)
(33) 1 (12%) 3 (9%)
(33) 1 (3%)
(33) 11 (33%) _1 -QS1_.
64

TABLE C2. FEMALE RATS: NONNEOPLASTIC LESIONS (CONTINUED)
MATCHED CONTROL
I N F L A M M A T I O N , C H R O N I C S U P P O R A T I V
N E R V O U S S Y S T E M
* S P I N A L C O R D (14) D E G E N E R A T I O N , N O S
SPECIAL S E N S E O R G A N S
*EYE (14) A T R O P H Y , NOS
* E Y E / C R Y S T A L L I N E LENS (1 l» ) M I N E R A L I Z A T I O N
MOSCOLOSKELETA1 SYSTEM
NONE
BODY CAVITIES
^ A B D O M I N A L C A V I T Y (14) STEATITIS
ALL OTHER S Y S T E M S
N O N E
SPECIAL MORPHOLOGY S U M M A R Y
NO LESION REPORTED 1 AOTOLYSIS/NO UECHOPSY 1
LOW DOSE HIGH DOSE
2 (6X)
(35) (30) 1 ( 3%)
(35) (31) 2 (6*)
(35) (34) 2 (6*)
(35) (34) 1 OX)
1
f NtJHBEF OF A N I M A L S W I T H TISSOE E X A H I N E D HICROSCOPICALLT * H U H B E R OF A N I H A L S HECBOPSIED
65


APPENDIX D
SUMMARY OF THE INCIDENCE OF NONNEOPLASTIC LESIONS
IN MICE FED L-TRYPTOPHAN IN THE DIET
67


TABLE D1.
SUMMARY OF THE INCIDENCE OF NONNEOPLASTIC LESIONS IN MALE MICE
FED L-TRYPTOPHAN IN THE DIET
ANIMALS INITIALLY IN STUDY ANIMALS NECROPSIED ANIMALS EXAMINED HISTOPATHOLOGICALLY
INTEGUMENTARY SYSTEM
*SKIN INFLAMMATION, CHRONIC
*SUBCOT TISSUE HEMORRHAGE
RESPIRATORY SYSTEM
fTRACHEA INFLAMMATION, SUPPURATIVE
*LUNG/BRONCHUS HYPERPLASIA, LYMPHOID
*LUNG BHONCHOPNEUMONIA SUPPUHATIVE BRONCHOPNEUNONIA CHRONIC SUPPURA HYPERPLASIA, ALVEOLAE EPITHELIUM HYPERPLASIA, PLASMA CELL
HEMATOPOIETIC SYSTEM
#BONE BARROW ATROPHY, NOS
#SPLE1=!N HEMATOPOIESTS
tMANDIBULAR L. NODE HYPERPLASIA, LYMPHOID
KNESENTERIC L. NODE HYPERPLAS!£t_LYMPHOID
MATCHED LOW DOSE HIGH DOSE CONTROL
15 35 a35 12 3U 33 12 34 33
(12) (34) (33) 1 (8«)
(12) (34) (33) 1 (3*)
(12) 2 (17%)
(3U) 5 (15%)
(33) 1 (3*)
(12) (33) (32) 1 <3X)
(12) 3 (25%)
(33)9 (27%)
(32) 4 (13%) 1 (3%)
1 (8%) 1 (3%) 2 (6%) 1 (3*) 1 (3«)
(12) 1 (8%)
(3«) 2 (6*)
(33)
(11) (32) 1 (3«)
(32) 1 (3X)
CO (14) 1 (7*)
(3)
(4) (1») i_im
(3)
t NUMBER OF ANIMALS WITH TISSUE EXAMINED MICROSCOPICALLY * NUMBER OF ANIMALS NF.CROPSIED
a 35 ANIMALS WERE INITIALLY IN THE STUDY, BUT TWO AIBALS WERE FOUND TO BE FEMALES IN A MALE GROUP.
69

TABLE 01. MALE MICE: NONNEOPLASTIC LESIONS (CONTINUED)
MATCHED LOW DOSE CONTROL
HEMATOPOIESIS 1 (7X)
CIRCULATORY SYSTEM
#MYOCARDIUM (12) (32) INFLAMMATION, INTERSTITIAL 1 (8X) 1 (3X) INFLAMMATION, SUPPURATIVE 1 (3X) INFLAMMATION, CHRONIC SUPPORATIV FIBROSIS, DIFFUSE 1 (8X) NECROSIS, DIFFUSE
DIGESTIVE SYSTEM
*LIVER (12) <3«) THROMBOSIS, NOS 1 (3X) INFLAMMATION, NECROTIZING 1 (8X) INFLAMMATION, CHRONIC 1 (8X) FIBROSIS 1 (8%) NECROSIS, COAGULATIVE 2 (17%) CYTOPLASMIC VACOOLIZ ATION 1 (3%) HYPERPLASIA, NODULAR 2 (17%) 1 (3X) ANGIECTASIS 1 (3%) HYPERPLASIA, RETICULUM CELL 1 (315) HfiMATOPOIESIS 1 (3X)
*LIVER/CENTRILOBULAR (12) <3<») NECROSIS, COAGULATIVE 1 (315)
tPANCFEAS (12) (3i») INFLAMMATION, NECROTIZING 1 (3*)
URINARY SYSTEM
*KIDNEY CYST, NOS INFLAMMATION, CHRONIC FIBROSIS, FOCAL CALCIFICATION, FOCAL ATROPHY, NOS ATROPHY, FCCAL
(12) 1 (8%) 1 (8%)
1 (8%)
(34)
1 (3X) 1 (3X) 1 (3%)
ENDOCBINE SYSTEM
NONE
t NUMBER OF ANIMALS HITH TISSUE EXAMINED BICROSCOPICALIY * NUMBER OF ANIMALS NECROPSIED
HIGH DOSE
(32)
3 (9%) 2 (6X)
2 (6%)
(33)
3 (9%) 2 (6%) 1 (3%)
(33)
(32)
(32)
70

TABLE D1. MALE MICE: NONNEOPLASTIC LESIONS (CONTINUED)
R E P R O D U C T I V E S Y S T E M
* S E N I N A L V E S I C L E C Y S T , NOS
N E R V O U S S Y S T E M
N O N E
SPECIAL SENSE ORGANS
N O N E
M U S C U L O S K E L E T A l SYSTEM
NONE
BODY C A V I T I E S
* P E R I T O N E U M I N F L A M M A T I O N , C H R O N I C NECROSIS, FAT
ALL OTHER SYSTEMS
N O N E
SPECIAL M O R P H O L O G Y S U M M A R Y
NO LESION REPORTED N O N E C R O P S Y P E R F O R M E D AUTO/NECROPSY/HISTO PERF AUTOLYSIS/NO NECROPSY
MATCHED LOW DOSE HIGH DOSE CONTROL
(12) (34) (33) 1 ( 8 X )
(12) ( 3 U ) (33) 1 (3«) 2 (6S)
2 8 10 2 1
1 1 1
t NUMBER OF ANIHALS WITH TISSUE EXAMINED BICROSCOPICALLY * NUHBER OF ANIBALS NECROPSIED
71

TABLE 02.
SUMMARY OF THE INCIDENCE OF NONNEOPLASTIC LESIONS IN FEMALE MICE FED L-TRYPTOPHAN IN THE DIET
MATCHED LOW DOSE HIGH DOSE CONTROL
ANIMALS INITIALLY IN STUDY 15 35 35 ANIMALS NECROPSIED 13 33 35 ANIHALS EXAMINED HISTOPATHOLOGICALL' I 13 33 35
INTEGUMENTARY SYSTEM
NONE
RESPIRATORY SYSTEM
*NASAL TURBINATE INFLAMMATION, CHRONIC SOPPURATI' V
(13) 1 (8X)
(33) (35)
tTRACHEA INFLAMMATION, SOPPURATIVE
(13) 1 (8X)
(33) 3 (9«)
(35) 4 (11X)
ILUNG/BRONCHUS INFLAMMATION, SOPPURATIVE
(13) 1 (8%)
(32) (35)
ILUNG BRONCaOPNEDHONIA SOPPORATIVE PNEONONIA INTERSTITIAL CHRONIC BHONCHOPNEUMONIA CHRONIC SUPPUR, HBMOSIDEROSIS HYPERPLASIA, ALVEOLAR EPITHELIDI HYPERPLASIA, PLASMA CELL HYPERPLASIA, LYMPHOID
H
!i
(13) 2
8
(15%)
(62%)
(32) 5
111
(16*)
(3*) (3X) (3«)
(35) 1<»111
31
(HOX) (3X) (3X) (3*)
(9X) (3X)
HEMATOPOIETIC SYSTEM
IBONE HARROW (12) (31) (35) ATROPHY, NOS 2 (6X)
ISPLEEN (13) (32) (35) INFLAMMATION, CHROHIC FOCAL 1 (3X) ANGIECTASIS 2 (6X) HIP.£BEIASI*t iai£gi,oa CELL 2_JiSl
t NUMBER OF ANIHALS WITH TISSDE EXAMINED MICROSCOPICALLY * NUMBER OF ANIMALS NECROPSIED
72

TABLE 02. FEMALE MICE: NONNEOPLASTIC LESIONS (CONTINUED)
HIGI HDOSE
7 (20%)
(15) 1 (7%)
(15)
2 (13%)
(15)
(35)
(35)
(35) 1 <3X) 1 (3%) 2 (6X)
(35)
(35)
HEMATOPOIESIS
tMANDIBULAR L. NODE HYPERPLASIA, PLASMA CELL HYPERPLASIA, RETICULUM CELL HYPERPLASIA, LYMPHOID
*MEDIASTINAL L.NODE THROHBOSIS, NOS INFLAMMATION, NECROTIZING HYPERPLASIA, PLASHA CELL HYPERPLASIA, RETICOLOM CELL
JHESENTERIC L. NODE THROMBOSIS, NOS CONGESTION, NOS INFLAMMATION, NECROTIZING ATROPHY, NOS
#THYMUS HYPERPLASIA, LYMPHOID
CIRCULATORY SYSTEM
tMYOCARDIUM MINERALIZATION
DIGESTIVE SYSTEM
#LIVER THROMBOSIS, NOS INFLAMMATION, SUPPURATIVE ANGIECTASIS
#PANCREAS CYST, NOS
*RECTUM PROLAPSE ULCER, NOS
UBINARY SYSTEM
NONE _
MATCHED CONTROL
1 (8%)
(<»)
(«)
(")
(13)
(13) 1 (8%)
(13)
(13)
(13)
LOW DOSE
3 (9%)
O7)
1 (6X) 1 (6%)
(17) 1 (6%) 1 (6X)
1 (6%)
(17) 2 (12%) 1 (6%) 2 (12X) 1 (6X)
(31) 1 (3X)
(32)
(32)
(33) 1 (3X)
(33) 1 (3X) 1 (3X)
f NUMBER OF ANIMALS WITH TISSUE EXAMINED MICROSCOPICALLY * NUMBER OF ANIMALS NECROPSIED
73

TABLE D2. FEMALE MICE: NONNEOPLASTIC LESIONS (CONTINUED)
ENDOCRINE SYSTfM
((THYROID CYSTIC FOLLICLES
REPRODUCTIVE SYSTEM
*UTEH US/EN DO KETRIUI"! INFLAMMATION, SUPPURATIVF INFLAMMATION, CHRONIC INFLAMMATION, CHRONIC SUPPUHATIV HYPERPLASIA, CYSTIC
f OVARY/OVIDUCT INFLAMMATION, CHRONIC
#OVARY CYST, NOS INFLAMMATION, SUPPURATIVE INFLAMMATION, CHRONIC SUPPORATIV
NERVOUS SYSTEM
tBRAIN HEMORRHAGE
SPECIAL SENSE ORGANS
*MIDDLE EAR INFLAMMATION, SUPPURATIVE INFLAMMATION, CHRONIC SUPPURATIV
MUSCULOSKELETAL SYSTEM
NONE
BODY CAVITIES
NONE
MATCHED CONTROL
(13) 1 (8%)
(13) 2 (15%)
11 (85%)
(13)
(13)
(12)
(13) 1 (8%) 1 (8X)
LOW DOSE
(30)
(32) 2 (63)
3 (9%) 2U (7̂ %)
(32)
(32) 5 (16%)
2 (6X)
(33) 1 (3%)
(33)
HIGH DOSE
(31) 1 (3*)
(34) 2 (f.%) 1 (15)
19 (56%)
(31*) 1 (3%)
(3U) 5 (15%) 1 (3%) 2 (6%)
(35)
(35)
I t N U M B E R O F A N I M A L S W I T H TISSUE E X A M I N E D M I C R O S C O P I C A L L Y * N U M B E R O F A N I M A L S N E C R O P S I E D
74

TABLE 02. FEMALE MICE: NONNEOPLASTIC LESIONS (CONTINUED)
MATCHED LOW DOSE HIGH DOSE CONTROL
ALL OTHER SYSTEMS
*HOLTIPLE ORGANS HYPERPLASIA, PLASMA CELL HYPERPLASIA, LYHPHOID
(13) (33) 1 (3%) 2 (6X)
(35)
SPECIAL MORPHOLOGY SUMMARY
NO LESION REPORTED NO NECROPSY PERFORMED AUTOLYSIS/NO NECROPSY
1 1
2 1 1
U
# NUMBER OF ANIMALS WITH TISSUE EXAMINED MICROSCOPICALLY * NUMBER OF ANIMALS NECPOPSIED
75


APPENDIX E
ANALYSES OF THE INCIDENCE OF PRIMARY TUMORS
IN RATS FED L-TRYPTOPHAN IN THE DIET
77


Table El. Analyses of the Incidence of Primary Tumors in Male Rats Fed L-Tryptophan in the Diet3
Topography: Morphology
Subcutaneous Tissue: Fibroma^
P Valuesc»d
Relative Riskf
Lower Limit Upper Limit
Weeks to First Observed Tumor
Hematopoietic System: Leukemia*5
P Valuesc»d
Relative Riskf
Lower Limit Upper Limit
Weeks to First Observed Tumor
Matched Control
0/15 (0)
N.S.
—
4/15 (27)
P = 0.014(N)
82
Low Dose
4/34 (12)
N.S.
Infinite 0.437 Infinite
105
3/34 (9)
N.S.
0.331 0.058 1.754
95
High Dose
3/34 (9)
N.S.
Infinite 0.281 Infinite
78
1/34 (3)
P = 0.026(N)
0.110 0.002 1.013
84

Table El. Analyses of the Incidence of Primary Tumors in Male Rats
(continued)
Topography: Morphology
Pituitary: Chromophobe Adenoma*3
P Valuesc>d
Relative Riskf
Lower Limit Upper Limit
Weeks to First Observed Tumor
Thyroid: Follicular-cell Carcinoma*3
P Valuesc»d
Relative Riskf
Lower Limit Upper Limit
Weeks to First Observed Tumor
Fed L-Tryptophan in the Dieta
Matched Low High Control Dose Dose
1/11 (9) 2/30 (7) 5/30 (17)
N.S. N.S. N.S.
0.733 1.833 0.045 0.250
41.816 83.411
101 105 96
0/14 (0) 2/33 (6) 0/32 (0)
N.S. N.S. N.S. __
Infinite 0.134
— Infinite —
105 — —

Table El. Analyses of the Incidence of Primary Tumors in Male Rats Fed L-Tryptophan in the Diet3
(continued)
Topography: Morphology Matched Control
Low Dose
Thyroid: C-cell Carcinoma*5 1/14 (7) 4/33 (12)
P Valuesc>d N.S. N.S.
Relative Riskf
Lower Limit Upper Limit
1.697 0.195 80.844
Weeks to First Observed Tumor 91 100
Thyroid: C-cell Adenoma or Carcinoma*5 5/14 (36) 6/33 (18)
P Values0>d P = 0.004(N) N.S.
Relative Riskf
Lower Limit Upper Limit
0.509 0.167 1.823
Weeks to First Observed Tumor 91 100
High Dose
0/32 (0)
N.S.
0.000 0.000 8.096
—
1/32 (3)
P = 0.007(N)
0.088 0.002 0.697
104

__
Table El. Analyses
(continued)
Topography: Morphology
Pancreatic Islets: Islet-cell Adenoma"
P Values0>d
Relative Riskf
Lower Limit Upper Limit
Weeks to First Observed Tumor
Pancreatic Islets: Islet-cell Adenoma or Carcinoma^
P Valuesc'd
Relative Riskf
Lower Limit Upper Limit
Weeks to First Observed Tumor
Fed L-Tryptophan in
Matched Control
0/15 (0)
N.S.
—
0/15 (0)
N.S.
—
of the Incidence of Primary Tumors in the Diet3
Low Dose
2/33 (6)
N.S.
Infinite 0.142 Infinite
105
2/33 (6>
N.S.
Infinite 0.142 Infinite
105
Male Rats
High Dose
0/34 (0)
N.S.
— —
—
1/34 (3)
N.S.
Infinite 0.025 Infinite
104

Table El. Analyses of the Incidence of Primary Tumors in Male Rats Fed L-Tryptophan in the Diet3
(continued) Matched Low High
Topography; Morphology Control Dose Dose
Testis: Interstitial-cell Tumorb 13/15 (87) 31/34 (91) 21/33 (64)
P Values0 »d P = 0.016(N) N.S. N.S.
Relative Risk^ 1.052 0.734 Lower Limit 0.878 0.595 Upper Limit 1.352 1.145
Weeks to First Observed Tumor 82 91 100
aDosed groups received 25,000 or 50,000 ppm.
^Number of tumor-bearing animals/number of animals examined at site (percent).
GBeneath the incidence of tumors in the control group is the probability level for the Cochran-Armitage test when P < 0.05; otherwise, not significant (N.S.) is indicated. Beneath the incidence of tumors in a dosed group is the probability level for the Fisher exact test for the comparison of that dosed group with the matched-control group when P < 0.05; otherwise, not significant (N.S.) is indicated.
"A negative trend (N) indicates a lower incidence in a dosed group than in the control group.
eThe probability level for departure from linear trend is given when P < 0.05 for any comparison.
^The 95% confidence interval of the relative risk between each dosed group and the control group.

Table E2. Analyses of the Incidence of Primary Tumors in Female Rats Fed L-Tryptophan in the Diet3
Matched Low High Topography: Morphology Control Dose Dose
Pituitary: Chromophobe Adenoma" 4/12 (33) 12/27 (44) 9/32 (28)
P Valuesc»d N.S. N.S. N.S.
Relative Riskf 1.333 0.844 Lower Limit 0.543 0.313 Upper Limit 4.670 3.218
Weeks to First Observed Tumor 103 75 92
Pituitary: Chromophobe Carcinoma*5 0/12 (0) 1/27 (4) 2/32 (6)
P Valuesc»d N.S. N.S. N.S.
Relative Risk^ Infinite Infinite Lower Limit 0.025 0.120 Upper Limit Infinite Infinite
Weeks to First Observed Tumor 86 104 —

__
Table E2. Analyses of the Incidence of Primary Tumors in Female Rats Fed L-Tryptophan in the Diet3
(continued)
Topography: Morphology
Pituitary: Chromophobe Adenoma or Carcinoma^
P Values0>d
Relative Riskf
Lower Limit Upper Limit
Weeks to First Observed Tumor
Thyroid: Follicular-cell Carcinoma*3
P Values0»d
Relative Riskf
Lower Limit Upper Limit
Weeks to First Observed Tumor
Matched Control
4/12 (33)
N.S.
103
0/14 (0)
N.S.
—
Low Dose
13/27 (48)
N.S.
1.444 0.601 4.964
75
1/32 (3)
N.S.
Infinite 0.025 Infinite
105
High Dose
11/32 (34)
N.S.
1.031 0.408 3.779
0/33 (0)
N.S.
— —
—
92

__
Table E2. Analyses of the Incidence of Primary Tumors in Female Rats Fed L—Tryptophan in the Diet3
(continued) Matched Low High
Topography: Morphology Control Dose Dose
Thyroid: C-cell Adenomab 1/14 (7) 2/32 (6) 1/33 (3)
P Values0 »d N.S. N.S. N.S.
Relative Riskf 0.875 0.424 Lower Limit 0.051 0.006 Upper Limit 49.995 32.328
Weeks to First Observed Tumor 105 105 104
Mammary Gland: Adenoma, NOS (not otherwise specified)*3 0/14 (0) 0/35 (0) 2/34 (6)
P Values0 »d N.S. N.S. N.S.
Relative Risk^ Infinite Lower Limit 0.130
— Upper Limit Infinite
—
Weeks to First Observed Tumor 104 — —

Table E2. Analyses of the Incidence of Primary Tumors in Female Rats Fed L-Tryptophan in the Dieta
(continued) Matched Low High
Topography: Morphology Control Dose Dose
Mammary Gland: Fibroadenomab 4/14 (29) 7/35 (20) 2/34 (6)
P Values0 »d P = 0.027(N) N.S. N.S.
Relative Riskf 0.700 0.206 Lower Limit 0.224 0.022 Upper Limit 2.873 1.289
Weeks to First Observed Tumor 96 91 92
Mammary Gland: Adenoma or Fibroadenoma" 4/14 (29) 7/35 (20) 4/34 (12)
P Values0 »d N.S. N.S. N.S.
Relative Riskf 0.700 0.412 Lower Limit 0.224 0.094 Upper Limit 2.886 1.957
Weeks to First Observed Tumor 92 — —

Table E2. Analyses of the Incidence of Primary Tumors in Female Rats Fed L-Tryptophan in the Diet3
(continued) Matched Low High
Topography; Morphology Control Dose Dose
Uterus: Endometrial Stromal Polypb 3/13 (23) 3/35 (9) 3/33 (9)
P Values0 »d N.S. N.S. N.S.
Relative Risk^ 0.371 0.394 Lower Limit 0.060 0.064 Upper Limit 2.516 2.664
Weeks to First Observed Tumor 105 105 104 00 00
aDosed groups received 25,000 or 50,000 ppm.
"Number of tumor-bearing animals/number of animals examined at site (percent).
GBeneath the incidence of tumors in the control group is the probability level for the Cochran-Armitage test when P < 0.05; otherwise, not significant (N.S.) is indicated. Beneath the incidence of tumors in a dosed group is the probability level for the Fisher exact test for the comparison of that dosed group with the matched-control group when P < 0.05; otherwise, not significant (N.S.) is indicated.
^A negative trend (N) indicates a lower incidence in a dosed group than in the control group.
eThe probability level for departure from linear trend is given when P < 0.05 for any comparison.
^The 95% confidence interval of the relative risk between each dosed group and the control group.

APPENDIX F
ANALYSES OF THE INCIDENCE OF PRIMARY TUMORS
IN MICE FED L-TRYPTOPHAN IN THE DIET
89


__
Table Fl. Analyses of the Incidence of Primary Tumors in Male Mice Fed L-Tryptophan in the Diet3
Matched Low High Topography: Morphology Control Dose Dose
Lung: Alveolar /Bronchiolar Adenoma^ 0/12 (0) 3/33 (9) 2/32 (6)
P Values0 »d N.S. N.S. N.S.
Relative Riskf Infinite Infinite Lower Limit 0.237 0.120 Upper Limit Infinite Infinite
Weeks to First Observed Tumor 74 102
Lung: Alveolar/Bronchiolar Adenoma or Carcinoma*3 0/12 (0) 4/33 (12) 2/32 (6)
P Values0 »d N.S. N.S. N.S.
Relative Risk^ Infinite Infinite Lower Limit 0.367 0.120 Upper Limit Infinite Infinite
Weeks to First Observed Tumor 74 102 —

__
Table Fl. Analyses of the Incidence of Primary Tumors in Male Mice Fed L-Tryptophan in the Diet3
(continued) Matched Low High
Topography: Morphology Control Dose Dose
Hematopoietic System: Lymphoma^ 0/12 (0) 9/34 (26) 2/33 (6)
P Valuesc»d N.S. P = 0.048 N.S.
Departure from Linear Trend6 P = 0.005
Relative Riskf Infinite Infinite Lower Limit 1.016 0.117 Upper Limit Infinite Infinite
Weeks to First Observed Tumor 62 —
Trigeminal Ganglion: Malignant Neurilenoma" 0/12 (0) 2/34 (6) 0/33 (0)
P Values0 »d N.S. N.S. N.S.
Relative Riskf Infinite Lower Limit 0.113 — Upper Limit Infinite
—
Weeks to First Observed Tumor 67 ——
67

Table Fl. Analyses of the Incidence of Primary Tumors in Male Mice Fed L-Tryptophan in the Diet3
(continued)
Topography: Morphology
Liver: Hepatocellular Adenoma^
P Valuesc»d
Relative Riskf
Lower Limit Upper Limit
Weeks to First Observed Tumor
Liver: Hepatocellular Carcinoma^5
P Values0 »d
Relative Riskf
Lower Limit Upper Limit
Weeks to First Observed Tumor
Matched Control
1/12 (8)
N.S.
104
0/12 (0)
N.S.
—
Low Dose
4/34 (12)
N.S.
1.412 0.165
67.331
94
1/34 (3)
N.S.
Infinite 0.020 Infinite
100
High Dose
5/33 (15)
N.S.
1.818 0.143 83.089
102
2/33 (6)
N.S.
Infinite 0.117 Infinite
104

Table Fl. Analyses of the Incidence of Primary Tumors in Male Mice Fed L-Tryptophan in the Dieta
(continued) Matched Low High
Topography; Morphology Control Dose Dose
Liver: Hepatocellular Adenoma or Carcinoma** 1/12 (8) 5/34 (15) 7/33 (21)
P Values0 »d N.S. N.S. N.S.
Relative Riskf 1.765 2.545 Lower Limit 0.236 0.396 Upper Limit 80.745 110.503
Weeks to First Observed Tumor 104 94 102
aDosed groups received 25,000 or 50,000 ppm.
^Number of tumor-bearing animals/number of animals examined at site (percent).
cBeneath the incidence of tumors in the control group is the probability level for the Cochran-Armitage test when P < 0.05; otherwise, not significant (N.S.) is indicated. Beneath the incidence of tumors in a dosed group is the probability level for the Fisher exact test for the comparison of that dosed group with the matched-control group when P < 0.05; otherwise, not significant (N.S.) is indicated.
^A negative trend (N) indicates a lower incidence in a dosed group than in the control group.
eThe probability level for departure from linear trend is given when P < 0.05 for any comparison.
^The 95% confidence interval of the relative risk between each dosed group and the control group.

Table F2. Analyses of the Incidence of Primary Tumors in Female Mice Fed L-Tryptophan in the Diet3
Matched Low High Topography: Morphology Control Dose Dose
Hematopoietic System: Lymphoma or Leukemia" 2/13 (15) 6/33 (18) 1/35 (3)
P Valuesc»d N.S. N.S. N.S.
Relative Riskf 1.182 0.186 Lower Limit 0.256 0.003 Upper Limit 11.065 3.348
Weeks to First Observed Tumor 92 67 61
aDosed groups received 25,000 or 50,000 ppm.
^Number of tumor-bearing animals/number of animals examined at site (percent).
cBeneath the incidence of tumors in the control group is the probability level for the Cochran-Armitage test when P < 0.05; otherwise, not significant (N.S.) is indicated. Beneath the incidence of tumors in a dosed group is the probability level for the Fisher exact test for the comparison of that dosed group with the matched-control group when P < 0.05; otherwise, not significant (N.S.) is indicated.
A negative trend (N) indicates a lower incidence in a dosed group than in the control group.
eThe probability level for departure from linear trend is given when P < 0.05 for any comparison.
^The 95% confidence interval of the relative risk between each dosed group and the control group.


Review of the Bioassay of L-Tryptophan for Carcinogenicity by the Data Evaluation/Risk Assessment Subgroup of the Clearinghouse on Environmental Carcinogens
March 7, 1978
The Clearinghouse on Environmental Carcinogens was established in May, 1976, in compliance with DREW Committee Regulations and the Provisions of the Federal Advisory Committee Act. The purpose of the Clearinghouse is to advise the Director of the National Cancer Institute (NCI) on its bioassay program to identify and to evaluate chemical carcinogens in the environment to which humans may be exposed. The members of the Clearinghouse have been drawn from academia, industry, organized labor, public interest groups, State health officials, and quasi-public health and research organizations. Members have been selected on the basis of their experience in carcinogenesis or related fields and, collectively, provide expertise in chemistry, biochemistry, biostatistics, toxicology, pathology, and epidemiology. Representatives of various Governmental agencies participate as ad hoc members. The Data Evaluation/Risk Assessment Subgroup of the Clearinghouse is charged with the responsibility of providing a peer review of reports prepared on NCI-sponsored bioassays of chemicals studied for carcinogenicity. It is in this context that the below critique is given on the bioassay of L-Tryptophan for carcinogenicity.
The primary reviewer agreed with the conclusion in the report that, under the conditions of test, L-Tryptophan was not carcinogenic in rats or mice. After a brief description of the experimental design and conditions of test, he said that the study was adequate to support this conclusion.
As the secondary reviewer, Dr. Kuschner noted that others have reported tumors in mice administered L-Tryptophan. He questioned the use of rodents as an appropriate species for studying the carcinogenicity of L-Tryptophan and suggested that the dog would be a more relevant experimental model.
A motion was made that the report on the bioassay of L-Tryptophan be accepted as written. The motion was seconded and approved unanimously.
Members present were:
Gerald N. Wogan (Chairman), Massachusetts Institute of Technology g?
Arnold Brown, Mayo Clinic E. Cuyler Hammond, American Cancer Society Joseph Highland, Environmental Defense Fund Henry Pitot, University of Wisconsin Medical Center George Roush, Jr., Monsanto Company Michael Shimkin, University of California at San Diego
Subsequent to this review, changes may have been made in the bioassay report either as a result of the review or other reasons. Thus, certain comments and criticisms reflected in the review may no longer be appropriate.
98


DHEW Publication No. (NIH) 78-1321