Embed Size (px)
Citation preview

DOCTORA L T H E S I SDOCTORA L T H E S I S
Luleå University of TechnologyDepartment of Business Administration and Social Sciences
Division of Quality and Environmental Management
:|: -|: - -- ⁄ --
:
TQM-Based Self-Assessment in Educational Organizations
Help or Hindrance?
Magnus Svensson
Doctoral Thesis no. 12
Division of Quality & Environmental Management
TQM-Based Self-Assessment in
Educational Organizations
Help or Hindrance?
Magnus Svensson
Luleå University of Technology Department of Business Administration & Social Science
Division of Quality & Environmental Management


Acknowledgements This thesis has been carried out at the Division of Quality & Environmental Management at Luleå University of Technology. During the work on this thesis I have received gene-rous support from a large number of people, who have contributed to the completion of the work. First of all, I would like to thank my supervisor Professor Bengt Klefsjö for his sup-port and comments during the years when the research was performed, especially the help during the last part of the writing of the thesis. This assist has been of inestimable value.
I am also very grateful for all the advices I have received from the three persons that during different periods of my research studies have had the role of assistant supervisors, namely in chronological order, Professor Håkan Wiklund, Associate Professor Pia Sandvik Wiklund, and Assistant Professor Bjarne Bergquist.
I would also like to thank my colleagues at the division, who have helped me to imp-rove the contents of this thesis during discussions and a number of seminars. In particu-lar, I would like to thank Henrik Eriksson, Maria Fredriksson, Rickard Garvare, Anna-Karin Kvist, and Peter Söderholm. Thanks to Mats Lindell at the Department of Human Work Sciences for help, discussions and co-operation, as well. Furthermore, I am grateful to the other members in the research group that evaluated the pilot project about Advanced Vocational Education, which is one project connected to the research presented in this thesis. Thanks for all discussions. I would also like to thank all the people from the educational organisations, which participated in any of the three self-assessment projects that are described in this thesis. These educational organizations can be found in the following three groups. Firstly, those who were involved in Advanced Vocational Education during the years 1998 and 1999. Secondly, the self-assessment users, who were active within the Adult Education Initiati-ve. Thirdly, the four units within the Upper Secondary School in Luleå Municipality. I gratefully acknowledge the financial support from The National Agency of Advan-ced Vocational Education (‘Kommittén för kvalificerad yrkesutbildning’), The SwedishAssociation of Local Authorities (‘Svenska Kommunförbundet’), The Adult EducationInitiative Delegation (‘Kunskapslyftskommittén’), The National Agency for Education (‘Skolverket’), and Luleå Municipality. Finally, I would like to thank my parents, Agnar and Kerstin Svensson, for their sup-port and encouragement during my studies.
Luleå September 2004
Magnus Svensson

AbstractThe interest in Total Quality Management, TQM, has increased rapidly in both the private sec-tor and the public sector in many countries. In this thesis TQM refers to a management system consisting of core values, methodologies and tools, which support each other in order increase customer satisfaction with less use of resources. Since TQM was developed connected to priva-te manufacturers, the transfer to and usage within service organizations as well as in the public sector have been questioned. Since a large part of the organizations in the public sector are edu-cational organizations, combined with the increased interest in quality work among them, it is interesting to study these organizations usage of TQM. The aim with the research is to explore the appropriateness, usefulness and experienced be-nefit of using the TQM concept, with its values, methodologies and tools, in educational organi-zations in order to support organizational learning and quality improvements. Three projects about TQM-based self-assessment in educational organizations have been studied. The organizations were active within the Swedish school system at different levels. In the first two projects educational organizations that gave programmes in the Advanced Vocational Education (‘Kvalificerad yrkesutbildning’) or education within the Adult Education Initiative (‘Kunskapslyftet’) participated. In the third project, four units at an upper secondary school in Luleå Municipality were involved. Empirical data was gathered by questionnaires, interviews and personal communication during the accomplishment of the projects. In order to discuss the fin-dings, different theoretical material has been used as well. In parallel to the research, tools for TQM-based self-assessment in educational organizations have been developed. A TQM-based tool called ‘Läroverket AVE-version’ was developed for use in the AVE-project, and based upon the experiences from that project, a new version of the tool was developed for use in the AEI-project. Finally, a tool called ‘Lärostegen’ was developed to the third project. The results from the three projects indicate that TQM-based self-assessment might be a fruitful way to stimulate quality improvements in the school system, but there are also different hindrance observed. The conclusions may be divided into three parts. Firstly, the values within TQM seems to be useful in the school environment, but the value ‘customer focus’ has partly been a hindrance, since the word ‘customer’ is connected to ‘buyer’ in many peoples’ view. Secondly, the methodology self-assessment seems to be reasonable to use within educational organizations, but there have been hindrances because the work have taken too much time. Another thing connected to self-assessment work that has been found is the great importance of the first phase within it: the need of planning and what have to be considered have been exploi-ted. Thirdly, the experiences about usage of the tools ‘Läroverket’ in two versions and ‘Läroste-gen’ are partly connected to the mentioned results about the values and methodologies; it is un-certain whether the word ‘customer’ should be used and there is a clear need of less comprehen-sive tools, at least if a lot of people should participate in the work. Other results connected to this research are the development of the tools ‘Läroverket’ and ‘Lärostegen’. Two other results that are connected to the phases within the methodology self-assessment: a proposal to components of the first phase, the planning phase, and a proposed structure for the last phase, the improvement planning phase.


Sammanfattning Intresset för det som på svenska brukar kallas offensiv kvalitetsutveckling och på engelska Total Quality Management (TQM), har ökat inom offentlig sektor i många länder. I denna avhandling definieras TQM som ett ledningssystem, vilket omfattar värderingar, arbetssätt och verktyg. Dessa tre delar skall stödja varandra i syfte att öka kundtillfredsställelse och minska förbruk-ningen av resurser. Eftersom TQM utvecklades i samverkan med privat varutillverkande industri kan överföringen därifrån och användningen av det inom tjänsteorganisationer i allmänhet och offentliga organisationer i synnerhet ifrågasättas. Eftersom en stor del av den offentliga sektorn i Sverige är utbildningsorganisationer och intresset för kvalitetsarbete bland dessa har ökat är det intressant att studera användningen av TQM bland dem. Syftet med den forskning som beskrivs i avhandlingen är att undersöka lämpligheten, an-vändbarheten och upplevda fördelar av att användning av TQM med dess värderingar, arbetssätt och verktyg inom utbildningsorganisationer för att stödja förbättringsarbete och organisatoriskt lärande. Tre projekt kring självutvärdering inom utbildningsorganisationer har studerats. De deltagan-de organisationerna var alla verksamma inom det svenska utbildningssystemet. I de två första projekten deltog såväl offentliga som privata utbildningsorganisationer. Dessa två projekt omfat-tar organisationer som anordnade Kvalificerad yrkesutbildning, KY samt utbildning inom Kun-skapslyftet. I det tredje projektet, som kallas ‘USS’ i avhandlingen deltog fyra enheter vid en gym-nasieskola. Empiriska data från dessa projekt samlades in via enkäter, intervjuer samt via person-lig kommunikation. För att diskutera och reflektera kring erfarenheterna från projekten har även teoretiskt material använts. Parallellt med forskningen har utveckling av ett TQM-baserat verktyg för självutvärdering inom utbildningsorganisationer genomförts. Ett sådant verktyg, kallat ‘Läroverket KY-version’ togs fram för att användas i det första projektet. Utifrån erfarenheter från detta utvecklades en ny version av verktyget för användning i det andra projektet. Erfarenheter från båda dessa projekt användes därefter till utveckling av verktyget ’Lärostegen’, som användes i det tredje projektet.
Resultaten från de tre projekten påvisar att TQM-baserad självutvärdering kan vara använd-bar för att stimulera kvalitetsförbättring inom utbildningssystemet, men hinder mot detta har observerats. Slutsatserna kan delas in i tre delar. För det första, beträffande värderingarna inom TQM förefaller de användbara, men användningen av ordet kund har varit ett hinder för flera deltagare, då detta ord är förknippat med köpare. För det andra, arbetssättet självutvärdering tycks vara användbart men hinder som funnits är framförallt att arbetet tagit för mycket tid. En annan sak som är knuten till arbete med självutvärdering är den stora betydelsen av att genomfö-ra dess första fas, ’planeringsfasen’, mycket väl och ingående. För det tredje, erfarenheterna från användning av verktyget ‘Läroverket’ i två olika versioner och ‘Lärostegen’ är delvis knutna till vad som redan sagts kring värderingarna och arbetssätten, det vill säga problem vid användning av ordet kund och verktygens omfattning som leder till behovet av att en hel del tid avsätts. Andra resultat kopplad till forskningen är själva utvecklingen av verktygen, där dessa i sig är en form av resultat. Ytterligare resultat är kopplade till två faser i arbetssättet: ett förslag till vad som bör ingå i planeringsfasen samt ett förslag till en struktur för genomförande av handlingsplane-ringsfasen.


Table of contents PART I –PLATFORM FOR THE RESEARCH
1 Introduction 1
1.1 Background 11.1.1 The Application of Quality Management 31.1.2 Use of Self-Assessment 41.1.3 The Interest of TQM in the Educational Sector 61.1.4 Criticism of TQM and its Use 7
1.2 Research Problems 81.3 Aim and Research Questions 91.4 Limitations 91.5 Structure of the Thesis 9
2 Theoretical Frame 12
2.1 The Quality Concept 122.1.1 Quality Definitions 122.1.2 Choice of Quality Definition 13
2.2 Total Quality Management 142.2.1 The Evolution of TQM 142.2.2 Different Definitions of TQM 162.2.3 The TQM System – the Triad of TQM 182.2.4 The Core Values of Total Quality Management 192.2.5 The Author’s Interpretation of TQM 262.2.6 Self-Assessment as a Methodology within TQM 282.2.7 The Author’s View of Self-Assessment 312.2.8 Different Tools for Self-Assessment 35
2.3 TQM and Self-Assessment in the Educational Sector 422.4 Self-Assessment and Organizational Learning 442.5 The Swedish School System 47
3 Research Strategy and Methodology 50
3.1 Introduction of the Research 503.1.1 The Author’s Background 50
3.2 Research Methodologies 513.2.1 Descriptive, Exploratory and Explanatory Research 513.2.2 Induction, Deduction and Abduction 523.2.3 Quantitative and Qualitative Research 543.2.4 Action Research 54
3.3 Case Study Designs 563.4 Research Design 58
3.4.1 An Overview 583.4.2 The Three Case Studies 593.4.3 The Research Strategy as a Learning Process 61

3.5 Validity and Reliability 623.5.1 Validity 623.5.2 Reliability 64
PART II – EXPERIENCES FROM THREE PROJECTS
4 The AVE-project 67
4.1 Description of the Overall AVE-project 674.1.1 Background to AVE 674.1.2 The AVE-evaluation 704.1.3 Epilogue to the AVE Pilot Project 72
4.2 The use of Self-assessment in AVE 724.2.1 Establishing Self-assessment among the AVE-organizations 744.2.2 Time Schedule for Self-assessment in AVE- organizations 744.2.3 Training in TQM and Self-assessment 744.2.4 Some Comments 77
4.3 The tool ‘Läroverket AVE-version’ 784.3.1 The Background of ‘Läroverket AVE-version’ 784.3.2 The Structure of ‘Läroverket AVE-version’ 79
4.4 Research Design of the AVE-project 884.4.1 Design of the AVE-evaluation 884.4.2 Design of Evaluation of the Overall AVE-evaluation 91
4.5 Expressions of Meetings with Persons from AVE-organizations 93
4.6 Results from the Questionnaire 944.6.1 Results of the use of ‘Läroverket AVE-version’ 954.6.2 Facts about the use of ‘Läroverket AVE-version’ 100
4.7 Results from the Evaluation from the Overall AVE-evaluation 1064.7.1 Findings from the Evaluation from the Overall AVE-evaluation 1064.7.2 Reliability and Validity 108
5 The AEI-project 109
5.1 Background of the AEI 109
5.2 Use of Self-assessment in AEI 1105.2.1 Background 1105.2.2 Accomplishment of Self-Assessment in AEI 1115.2.3 Training in TQM and Self-Assessment 112
5.3 The Tool ‘Läroverket 1999’ 1135.3.1 The Different Parts of ‘Läroverket 1999’ 114
5.4 Research Design of the AEI-project 1185.5 Results from the AEI-questionnaire 119
5.5.1 Impressions of Meetings with Persons from AEI-Organizations 123 123
6 The USS-project 124
6.1 Background to the USS-project 124
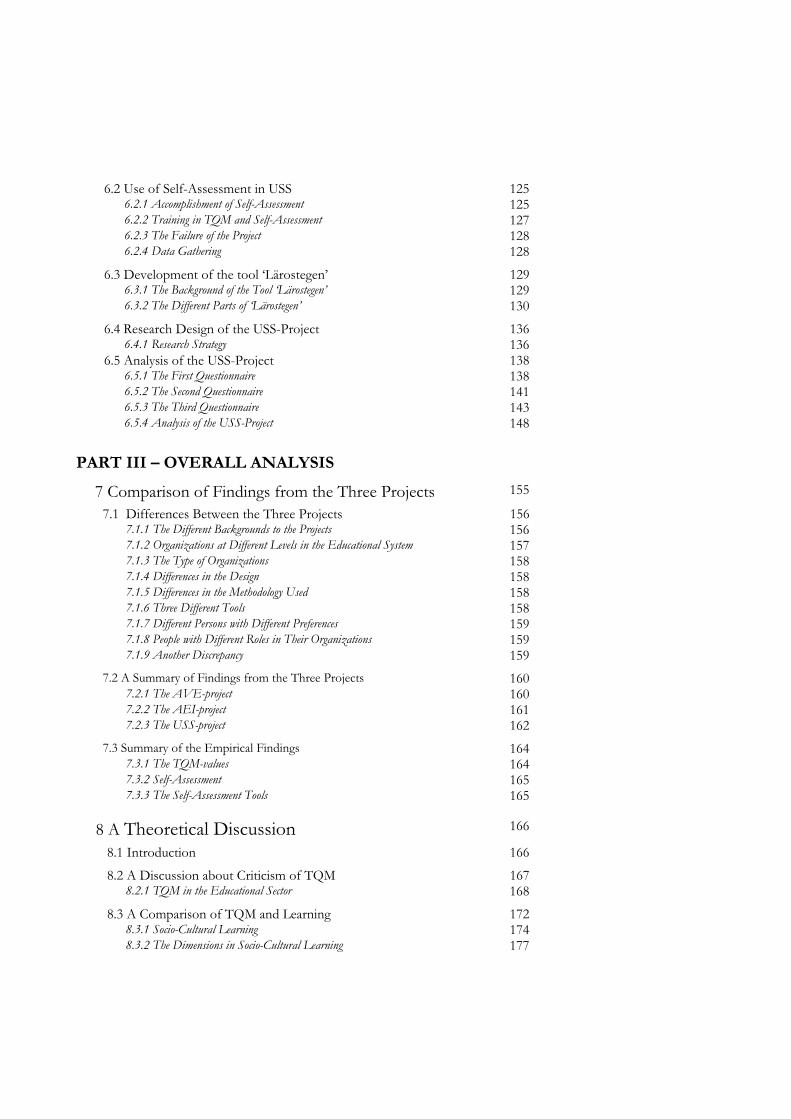
6.2 Use of Self-Assessment in USS 1256.2.1 Accomplishment of Self-Assessment 1256.2.2 Training in TQM and Self-Assessment 1276.2.3 The Failure of the Project 1286.2.4 Data Gathering 128
6.3 Development of the tool ‘Lärostegen’ 1296.3.1 The Background of the Tool ‘Lärostegen’ 1296.3.2 The Different Parts of ‘Lärostegen’ 130
6.4 Research Design of the USS-Project 1366.4.1 Research Strategy 136
6.5 Analysis of the USS-Project 1386.5.1 The First Questionnaire 1386.5.2 The Second Questionnaire 1416.5.3 The Third Questionnaire 1436.5.4 Analysis of the USS-Project 148
PART III – OVERALL ANALYSIS
7 Comparison of Findings from the Three Projects 155
7.1 Differences Between the Three Projects 1567.1.1 The Different Backgrounds to the Projects 1567.1.2 Organizations at Different Levels in the Educational System 1577.1.3 The Type of Organizations 1587.1.4 Differences in the Design 1587.1.5 Differences in the Methodology Used 1587.1.6 Three Different Tools 1587.1.7 Different Persons with Different Preferences 1597.1.8 People with Different Roles in Their Organizations 1597.1.9 Another Discrepancy 159
7.2 A Summary of Findings from the Three Projects 1607.2.1 The AVE-project 1607.2.2 The AEI-project 1617.2.3 The USS-project 162
7.3 Summary of the Empirical Findings 1647.3.1 The TQM-values 1647.3.2 Self-Assessment 1657.3.3 The Self-Assessment Tools 165
8 A Theoretical Discussion 166
8.1 Introduction 166
8.2 A Discussion about Criticism of TQM 1678.2.1 TQM in the Educational Sector 168
8.3 A Comparison of TQM and Learning 1728.3.1 Socio-Cultural Learning 1748.3.2 The Dimensions in Socio-Cultural Learning 177

8.3.3 Socio-Cultural Learning and TQM 1788.4 A Further Theoretical Discussion 183
8.4.1 The Influence of School Code 1838.4.2 Leadership and Teachers Attitudes 184
9 Comparison of Empirical Findings and Theory 187
9.1 Background 187
9.2 Different Interpretations of TQM-values 1889.2.1 Misunderstandings 1889.2.2 Interpretations 189
PART IV – THE BOTTOM LINE
10 Conclusions and Discussion 193
10.1 The Three Research Questions 19310.1.1 The TQM-values 19310.1.2 Methodologies 19610.1.3 Tools 199
10.2 General Conclusions 20010.3 Some recommendations 20310.4 Discussion of the Used Research Methodology 206
10.4.1 Validity 20710.4.2 Reliability 20810.4.3 Generalizations 208
10.5 Further research 20910.5.1 Research Connected to the ‘TQM-Triad’ 20910.5.2 Research Connected to the Projects 21010.5.3 Some Other Ideas 210
REFERENCES 211
APPENDICES
QAVE1 Questionnaire no. 1 within the AVE-project
QAVE2 Questionnaire no. 2 within the AVE-project
QAEIa Questionnaire (a) within the AEI-project
QAEIb Questionnaire (b) within the AEI-project
SPh4 Proposed structure for phase 4: ’plan for improvements’
MSLS Main structure behind the tool ’Lärostegen’
LS The tool ’Lärostegen’
QUSS1 Questionnaire no. 1 within the USS-project
QUSS2 Questionnaire no. 2 within the USS-project
IUSS Interview guide within the USS-project
QUSS3 Questionnaire no. 3 within the USS-project

Part I
Platform for the Research


1
Chapter 1
Introductionn this chapter the research is introduced and outlined. Firstly, the background for the research is presented. Thereafter research problems and the chosen research questions are outlined. Finally, the structure of the thesis is described.
1.1 Background
During the twentieth century, a lot of management philosophies and theories have been developed, often aimed to support organizations in the private sector. Gradually, some of these have been adopted by organizations also in the public sector.
One example of this phenomenon is the concept of Total Quality Management (TQM), which, according to Bergman & Klefsjö (2003) can be described as “a constant endeavour to fulfil, and preferable exceed, customer needs and expectations at the lowest cost by continuous improvement work, to which all involved are committed, focusing on the process in the organizations”. Practical application of TQM implies, among other things1, usage of different suitable methodologies and tools to support the TQM culture.
One of these methodologies is organizational self-assessment supported by a suitable TQM-based tool. Self-assessment means roughly that the members of the organization creates a picture of today’s way of working and from that identifies strengths to be proud of, but primarily improvement possibilities and issues for the improvement work that should follow; EFQM (1996).
The interest in such means has increased during the last decade, not the least in the public sector, where educational organizations constitute one large group; see, for instance, Burkhalter (1996).
In this thesis the use and benefit of TQM in the educational sector is in focus. In particular TQM-based self-assessment on organizational level in educational organizations is discussed.
1 As described in Chapter 2.
I

2
1.1.1 The Application of Quality Management
During the last decades, quality work has been emphasized by many orga-nizations and different concepts related to quality improvements have been developed. One such concept, Total Quality Management (TQM), was established in the 1980s mainly to support privately owned goods producing companies. According to Hellsten & Klefsjö (2000), TQM can be defined as “a continuously evolving management system consisting of values, methodologies2 and tools, the aim of which is to increase external and internal customer satisfaction with a reduced amount of resources”.
Originally, TQM was mainly used in manufacturing companies, but the TQM-concept then started to be used in the service sector. When applied to the ser-vice sector, special theories on quality in services was developed; see, for instance, Grönroos (1990), Gummesson (1991), Arnerup & Edvardsson (1992), and Normann (1992, 2001).
The use of quality management issues in the public sector is more recent, and the interest of working with quality from a TQM perspective within this sector has grown during the last decade; see, for instance, Rombach (1990), Lagrosen (1997) and Zbaracki (1998). The public sector is, in accordance to Tarschys (1978), here interpreted as the part of the society that commonly is called either governmental or municipals.
This use of TQM in the public sector is sometimes considered as part of the New Public Management (Hood, 1995), which is a generic term for a lot of change initiatives, or, as Christensen & Laegrid (2001) states: “… the concept is loose and multifaceted and offers a kind of ‘shopping basket’ of different elements for reform of public administration.” Some research has, during the last years, focused on the meeting between the ideas from New Public Management and organizational practice within the Swedish public sector, not the least within the health care sector, but also the educational sector; see, for example, Skålén (2002) and Quist (2003).
An example of, and perhaps even an explanation of, the increased interest of quality management in the public sector is the escalating quality requirements from different authorities. Since 1987 a new administrative law is in force in the Swedish public sector, which calls for counteracting of inconveniences and improving accessibility among authorities. Furthermore, the Commission on Advanced Vocational Education3 requires in the directions for educational
2 In their paper they used the word ‘technique’, but they have changed the terminology after that. 3 AVE is a form of post-secondary education with a close cooperation between enterprises and course providers. The Advanced Vocational Education (AVE) will be studied later on in this thesis; see Chapter 4.

3
organizations working with such education, that these organizations use quali-ty assurance and some form of quality evaluation. The National Council for Quality and Development (‘Statens kvalitets- och kompetensråd’) was estab-lished in 1999 by the Swedish Government as a support for quality improve-ments within Swedish governmental authorities.
Today, there are even examples of local societies, which have used values, methodologies and tools from TQM to improve the societal service or to change a negative development with a decreasing number of inhabitants. Some examples are Toqua Village in the state New York, where the mayor started a thorough TQM programme “to make Toqua the best village in which to live and work” (Hagedorn-Rasmussen, 2002), Pensacola in Florida in which people was brought together from different sectors to create a ‘Quality Community’ (Osborne & Gaeber, 1992), and Åseda in the south of Sweden in which people have tried to work systematically with values, methodologies and tools from TQM to break a negative tendency with a decreasing number of inhabitants (Helling et al., 1998; Jonsson, 2004). For a discussion about the use, experiences and benefit of TQM for local societies’ development, see Fredriksson (2004).
Many national and international quality awards have been established to support systematic work with quality improvements. Among these are the Malcom Baldrige National Quality Award (NIST, 2004), The European Quality Award (EFQM, 2004), and the Swedish Quality Award (SIQ, 2004)4.Some of these awards have a particular focus on the public sector. Examples of this is, in Sweden, the Quality Award for Swedish Health & Medical Service (‘Kvalitetsutmärkelsen Svensk Hälso & Sjukvård’), and the Swedish School Award (‘Kvalitetsutmärkelsen Svensk Skola’), both based on similar criteria as the Swedish Quality Award, which was founded in 1992 by SIQ, The Swedish Institute for Quality.
1.1.2 Use of Self-assessment
When an organization is initiating or intensifying a systematic quality work based upon TQM, one important question is where to start and how. One of the core values of TQM, as discussed in Chapter 2, is ‘continuous improvements’, but here the question is what should be tackled first.
4 It could be noted here that during 2001 Älta School outside Stockholm got the Swedish Quality Award, St Mary’s College in Northern Ireland got the European Quality Award, and Chugach School District in Anchorage in Alaska, Pearl River School District in New York, and University of Wisconsin-Stout all got the Malcolm Baldrige National Quality Award – in all cases in comparison with traditional private manufacturing and service companies. A description of the three Malcolm Baldrige recipients can be found in Daniels (2002).

4
In order to find the areas that are important for improvements and to create a culture based on TQM values, self-assessment has become an established me-thodology. Dahlgaard et al. (1998) say that today it is “generally accepted that a TQM process starts with a self-evaluation5…” and according to Zink (1997) “self-assessment is a powerful management tool6”.
The interest in self-assessment has increased rapidly during the 1990s. This can be illustrated by the amount of literature and articles, which have been published; see, for instance, Porter & Tanner (1995), Zink (1997), Hellsten (1997a) and Conti (1997). According to Hellsten (1997a), the interest in self-assessment started mostly among large organizations. Studies of self-assessment practices show that it is not much used by smaller organizations; Klefsjö (2003), Sturkenboom et al. (2001).
In order to obtain benefits, in the form of improvements, the self-assessment work has to be followed by improvement work, as illustrated in Figure 1.1. In some cases, the improvement work is described as a part of the self-assessment work; see EFQM (1996). However, in this thesis, self-assessment is considered as a first step and improvement work a second. This is further described in Section 2.2.6.
Self-assessment
work
Improvement work:
changes in order
to get improvements
Areas possible for
improvements
• End of self-assessment work/• Start of improvement work
• Stop / new turn
Facts about thework in an organisationand the results from this
Gained resultsof changes:
• Start
- improvements
-no improvements
Figure 1.1 The self-assessment work should be followed by an improvement work. This figure is a simplification of Figure 2.10.
This implies that all activities that build-up these two parts of the working chain have to be carried out in a manner that also enables the work in the fol-lowing stages. To be able to efficiently pass through all the chain, it is necessa-ry to handle the possible obstacles that might appear. As a consequence, there is a need to get knowledge of conceivable obstacles to make it possible to accomplish the whole chain.
Self-assessment can, according to Hellsten & Sandvik-Wiklund (1999), in a way be compared with the term ‘learning organization’ and the main purpose in educational organizations might be said to attain learning among their
5 In this thesis the term ‘self-assessment’ is preferred instead of ‘self-evaluation’. 6 In this thesis self-assessment is considered as a methodology and not as a tool; see the discussion in Chapter 2.

5
students or pupils. In combination with a general increased interest in learning, Ellström (2002) points out a concordance among researchers, decision-makers and practitioners within different fields about the weight of learning in working life. He also states that economic research shows the importance of learning in order to obtain growth, innovations, and competitiveness, with reference to Edquist (1997), Lundvall (1995) and Maskell et al. (1998). Connected to this, the need of organizational learning and reflection in educational organizations have been discussed by Alexandersson (1994).
1.1.3 The Interest of TQM in the Educational Sector
One large part of the public sector in several countries is the educational sec-tor. In Sweden, for instance, the main part of the educational sector consists of public organizations. Giertz (2002) states that during 1970 to 1997 the number of employees in the educational sector has increased from about 4.9 to 7.2 percent of the total employment in Sweden. According to Giertz (2002), the increase of education and learning in the society will continue, but not necessarily in the form of teaching.
Furthermore, the concept of learning has, according to Säljö (2000), reached an important position in our society, which is connected to economic growth and social development. Among politicians and business executives, for in-stance, high-educated people are seen as an important prerequisite to obtain increased prosperity and reach a higher level of quality of life; see Säljö (2000). For instance, the latest presidents of United States have launched arguments saying that USA shall become a “learning society”; Säljö (2000).
There were some studies made concerning use of TQM in educational organi-zations already before the research in this thesis started. For instance, Lagro-sen (1997) describes quality work within four schools in the municipality of Älta7, that have used the criteria of the Swedish Quality Award in order to accomplish a self-assessment. According to Lagrosen (1997), there are great advantages of using TQM in the Swedish Compulsory School. A similar statement is also made by Lundquist (1997), based upon a study of quality work at some university departments in Sweden. Lundquist states that: “a TQM perspective seems consistent with common and desirable objects in teaching and learning in general”. Furthermore, according to Lundquist (1997), the use of the criteria for the Swedish Quality Award seemed to be useful at university level. Therefore, there are indications that TQM-based self-assessment is useful in educational organizations. This statement might be strengthened by the con-nection between self-assessment and organizational learning.
7 Älta is situated north of Stockholm.

6
Since that time several more studies have been published; see, for instance, Ruben et al. (2000) and Grant et al. (2004), regarding the criteria for the Malcolm Baldrige Natioanl Quality Award, and Saraiva et al. (2003) and Hildes et al. (2004), regarding the EFQM Excellence Model.
1.1.4 Critisism of TQM and Its Use
In spite of the great interest in quality improvement work and TQM, the use of these concepts has been questioned by several debaters; see, for instance, Jackson (1995), van der Wiele et al. (2000) and Boaden (1996). Van der Wiele et al. (2000) even discuss if “TQM is a fad, fashion or fit”.
Some people mean that many organizations fail to implement TQM in a successful way; see Cao et al. (2000), Nwabueze (2001) and Foley (2004). However, Shin et al. (1998) argue that the TQM framework and key principles should not be blamed for the failure of TQM. They state that the reason, which has created scepticism about the effectiveness of TQM instead can be found in the lack of understanding what TQM really means for each unique organization and how to implement TQM successfully.
Criticism has also been presented about the transfer of some quality concepts from the private sector to the public sector. For instance, Erlingsdóttir (1999) criticises work with quality in the Swedish public health sector. Although her research mainly comprises the use of quality assurance and ISO 9000, the results might indicate an uncertainty regarding the benefit of using TQM concepts in the public sector. General criticism about quality work in the public sector can also be found in, for instance, Rombach & Olsson (1998).
Criticism about use of TQM within educational organizations has also been expressed. Kohn (1993) discusses the use of TQM in schools, and he ques-tions the use of TQM in the classrooms. He describes this as educators trying to transplant a model, methods and metaphors included, stemming from the business world into classrooms. Classrooms are not comparable to companies, Kohn says. On the other hand, Schmoker & Wilson (1993) argues against Kohn, so the use of TQM has been debated and positive as well as negative arguments have been expressed. Criticism about use of TQM in educational organizations will be discussed further in Section 2.3 and Chapter 8.
Summarizing the discussion, there are at least three factors, indicating importance of research related to TQM in the educational sector. Firstly, the educational sector has expanded, and will continue to expand. Secondly, the use of TQM has already reached educational organizations. Thirdly, there is a

7
picture of both positive and negative experiences and views about the use of TQM among educational organizations.
1.2 Research Problems
Based on what is said above, several research problems can be identified related to the application of values, methodologies and tools from TQM in the educational sector. Some of these are summarized as follows.
Firstly, although Lagrosen (1997) and Lundquist (1997) indicate that it is possi-ble to transfer the TQM concept on a comprehensive level from the private sector to the public sector, and to educational organizations in particular, there seems to exist some hesitations about this transfer. Connected to this, it might be questioned whether it is possible and suitable to bring the values that are a base for TQM and the corresponding TQM culture in the private sector to the environment in educational organizations. This cultural issue is also linked to the hesitation presented by Kohn (1993) mentioned above.
Secondly, even if the TQM concept might be useful in educational organi-zations, it might be questioned if the results of the self-assessment methodology are valuable enough to the organization to motivate such activities and the necessary resources. In other words, the suitability and effec-tiveness of self-assessment in educational organizations might be questioned.
Thirdly, with the just said in mind, it can be questioned whether the tools within the TQM-field, originally developed and used by manufacturing companies, can be directly transferred to educational organizations or if an adaptation to the context of these organizations is necessary. Although Lundquist (1997) states that it is possible to use the same TQM-based assessment tools in the educational sector, Lagrosen (1997) have brought out some ambiguities. In that perspective it might be discussed if it is of benefit to adjust the self-assessment tool to better fit educational organizations. Here it is also conceivable to mention the need for less comprehensive self-assessment tools that Hellsten (1997a) discusses.

8
1.3 Aim and Research Questions
Based upon the research problems described above, the aim of the research in this thesis has been stipulated as follows:
• To study the appropriateness, usefulness and experienced benefit of using the TQM concept, with its values, methodologies and tools, in educational organizations in order to support organizational learning and quality improvements.
The aim of the thesis is specified in the following three research questions:
1. How well is a culture, based on the TQM values, in harmony with the existing culture in the educational sector?
2. How suitable is TQM-based self-assessment as a methodology within the educational sector to support quality improvements?
3. How should a tool for TQM-based self-assessment be designed to support self-assessment in the educational sector?
1.4 Limitations
The research is limited to discuss the first part of the chain described in Figure 1.1, the self-assessment work. The improvement work, which should follow the self-assessment procedure in order to achieve improvements are beyond the scope of this study, mainly due to the stipulated time frames.
The research is, mainly for practical and cultural reasons, limited to Swedish educational organizations.
1.5 Structure of the Thesis
In order to explain how the different chapters in the thesis are connected to each other, a graphic structure is presented in Figure 1.2. The thesis consists of altogether ten chapters and eleven appendices.
The twelve chapters are divided into four parts, each one consisting of three chapters. The four parts describe the scientific platform, the experiences from three projects, an overall analysis including some theoretical development, and, finally, what here is called the bottom line with conclusions and further research.

9
The scientific platform includes an introduction with the funnel of background-problems-research questions. The second part describes the three projects that are studied. In this part the data that have been gathered are analysed individually for each one of the projects. In the third part the experiences from the three projects are first compared. Then different aspects of the main theory TQM are discussed, and a comparison of the empirical findings to the theoretical discussion follows. The forth section contains conclusion, discussions and ideas for further research.
The thesis is partly based on the following five papers, although they are not appended to the thesis:
Paper 1 Svensson, M. & Klefsjö, B. (2000). Experiences from creating a quality culture for continuous improvements in Swedish school sector by using self-assessments. Total Quality Management, vol 11, no 4,5&6, 800-807.
Paper 2 Lindell, M. & Svensson, M. (2002). Among demons and angels. Quality in Higher Education, vol 8, no 2, 127-136.
Paper 3 Svensson, M. & Lindell, M. (2004). Total quality management and socio-cultural learning within educational organizations – ideological friends or foes. Preliminary title. Submitted for publication.
Paper 4 Bergquist, B., Fredriksson, M. & Svensson, M. (2004). TQM –Terrific Quality Marvel or Tragic Quality Malpractice. Accepted for publication in The TQM Magazine.
Paper 5 Svensson, M. & Klefsjö, B. (2004a). Self-Assessment in the educational sector – Experiences from a Swedish upper secondary school project. Preliminary title. Submitted for publication.
Eleven appendices have been attached to the thesis. These are as follows:
• Questionnaire no. 1 within the AVE-project QAVE1
• Questionnaire no. 2 within the AVE-project QAVE2
• Questionnaire (a) within the AEI-project QAEIa
• Questionnaire (b) within the AEI-project QAEIb
• Structure proposed for phase 4: ‘plan for improvements’ Sph4
• Base structure behind the tool ‘Lärostegen’ MSLS
• The tool ‘Lärostegen’ LS
• Questionnaire no. 1 within the USS-project QUSS1
• Questionnaire no. 2 within the USS-project QUSS2
• Interview guide within the USS-project IUSS
• Questionnaire no. 3 within the USS-project QUSS3

10
QAEIbQAEIb
LSLS
IUSSIUSS
Appendiceswithin this
thesis
1 Introduction
Part I: Platform for the Research
2 Theoretical Frame
3 Research Strategy and Methodology
Part II: Experiences from Three Projects
4 The AVE-Project
5 The AEI-Project
6 The USS-Project
Part III: Overall Analysis
Part IV: The Bottom Line
7 Comparison of Findings from the Three Projects
8 A Theoretical Discussion
9 Comparison of Empirical Findings and Theory
10 Conclusions and Discussion
The parts of this thesis
P1P1
P2P2
P3P3
P4P4
P5P5
Papersconnected
to this thesis
QAVE1
QAVE2
QUSS1
QUSS3
QAEIaQAEIa
Plan
MSLSMSLS
QUSS2
SPh4SPh4
Study
Act
Do
Figure 1.2 The figure shows the structure of this thesis. The thesis is divided into four different parts that are numbered I to IV, and a number of appendices. Each part is in turn divided into three chapters. The four parts can be compared to the four steps in the improvement cycle, which is described in Chapter 2. In this figure this is shown by the four boxes ‘plan’, ‘do’, ‘study’, and ‘act’. The arrows in the figure shows at one side the connections between the papers, on which the thesis partly is based, and the chapters, and on the other side connections between the different appendices and chapters.

11
Chapter 2
Theoretical Frame
n this chapter the theoretical frame of reference is outlined. Firstly, the quali-ty concept of today is described. Secondly, a main theme in this work, the
concept of Total Quality Management (TQM), is discussed. Thirdly, the two components methodologies and tools of TQM are described, in particular the methodology of self-assessment and the tools created by different quality award criteria. Finally, the concept of “learning organization”, which is closely connec-ted to TQM, is touched upon.
2.1 The Quality Concept
The main theoretical field that is used in this thesis is the concept called Total Quality Management (TQM). Within this field the word quality is central. Therefore this chapter starts with a brief discussion of the quality concept, before the theoretical description of TQM is presented.
2.1.1 Quality Definitions
There is not just one definition of the quality concept, a fact that has been emphasised by, for instance, Garvin (1984, 1988). Several different definitions and perspectives have been founded over time. Garvin (1984, 1998) has classi-fied some of them into five different approaches:
• Transcendent - quality is synonymous with ‘innate excellence’, absolute and universally recognizable, timeless and enduring, an un-analysable property, which can be learned to be recognised through experience
• Product-based - quality reflects differences in the quantity of some ingredient or attribute possessed by a product
I

12
• User-based - the products that best satisfy customers’ preferences and different wants and needs are those with the highest quality
• Manufacturing-based
- focus is on the supply side; quality is primarily con-cerned with engineering and manufacturing practices and fulfilling tolerances
• Value-based - quality is about costs and price, a product with high quality provides performance or conformance at an acceptable price or cost
Garvin (1984, 1988) also points out disadvantages with each one of these approaches. He claims that organizations using just one of the approaches might have quality problems. He recommends organizations to use multiple perspectives on quality and actively shift between different approaches. For example, the user-based approach can be used initially to identify important characteristics. Thereafter, a product-based approach can be used to translate the desired characteristics into parts and specifications. Finally, a manu-facturing-based approach might be used to ensure that the production provi-des products that match the specifications.
According to Gummesson (1991), the study by Garvin does not adequately account for the service area. On the other hand, Gummesson (1991) says that the five approaches by Garvin show that quality is a complex and indistinct concept and that the user-based approach is the one that is often used within the service management area. One example of this is Edvardsson et al. (1994), who, with reference to an unpublished paper by Edvardsson from 1988, say: “Quality is a matter of finding out what creates value for the customer and achieving it. …”.This statement is followed by a general definition of service quality as: “…theservice must correspond to the customers’ expectations and satisfy their needs and demands”. Also Buzzell & Gale (1987) have a similar definition and say that “…quality is whatever the customers say it is, and the quality of a particular product or service is whatever the customer perceives it to be”. According to Grönroos (1990), the view by Buzzell & Gale (1987) is in conformance with models in the literature on services marketing.
2.1.2 Choice of Quality Definition
Without explicitly advocating the ISO 8402 (1986) definition of quality: “Quality is the totality of features and characteristics of a product or service that bear on its ability to satisfy stated or implied needs”, Gummesson (1991) mentions this de-finition as the probably most used by that time. He points out that it contains four main conceptions. Firstly, he means that ‘all characteristics” implies a comprehensive view of the product. Secondly, products can be goods as well

13
as services. Thirdly, the definition signifies a customer-oriented approach, and fourthly, ‘stated or implied’ indicates that customers cannot always articulate their needs and that this is something that producers and suppliers have to understand.
Another definition, which is similar to the definition in ISO 8402, is the one by Bergman & Klefsjö (1995): “The quality of a product (article or service) is its ability to satisfy, or preferably exceed, the needs and expectations of the customers”. This defini-tion does not explicitly include “all characteristics” and “stated or implied” However, with “product” is meant the product as a whole, and “needs” refers to all kind of needs, spoken as well as unspoken. Furthermore, the definition by Bergman & Klefsjö (1995) does directly say that a product can be an article as well as a service, and especially, it does not only comprise the needs of the customers, but also their expectations. They also emphasize that “customers” refer to both external and internal customers, which is important within the concept of TQM.
The definition by Bergman & Klefsjö (1995) is used in this thesis. The main reasons for the choice is that it has an external as well as internal perspective, and that it includes customer needs and not only their expectations.
2.2 Total Quality Management
Analogous to the quality concept, there is no single definition of Total Quality Management, TQM; see discussions in, for instance, Boaden (1997), Kennerfalk (1995) and Hellsten (1997a). Therefore, it seems reasonable to start with a description of TQM and its evolution.
2.2.1 The Evolution of TQM
There are at least three different ways to describe the evolution of the quality field that has led to the concept of TQM, namely: ‘The four stage model’, ‘The two schools by Kroslid’, and ‘The continuous process by Park Dahl-gaard’. This indistinct situation regarding TQM and its evolution creates difficulties both for practitioners and theorists, as will be further discussed in Chapter 8.
The Four Stage Model
A common description of the evolution of work with quality and quality imp-rovements towards the concept of TQM is by using four stages, see Garvin (1988), Dale (19989), or Dahlgaard et al. (1998), for instance. These stages are:

14
Quality Inspection, Statistical Quality Control, Quality Assurance, and Total Quality Management; see Figure 2.1.
The first stage was brought to light in about 1910, when Ford Motor Compa-ny started to employ teams of inspectors to test their the T-model cars with the project standard (Dahlgaard et al., 1998). Poor quality products could be found by inspection and then be scrapped, reworked or sold as lower quality products. During the 1920s and 1930s, Statistical Quality Control was develo-ped, mainly by Walter A. Shewhart, and then introduced to manufacturing companies. The main idea was to try to catch problems earlier and control the manufacturing process, instead of just rejecting or repairing afterwards. But still in the mid 1940s, and in many cases much later, quality work by inspection was predominant in many companies (Bergman & Klefsjö, 2003).
The third stage, called Quality Assurance, focuses on pre-production activities. Through the development of suitable organizations, distribution of responsi-bilities and use of quality instructions conditions, are created to avoid failures and mistakes as much as possible. In this way quality systems are created, as, for instance, according to the international series of standard ISO 9000. This stage implies a change from detection to prevention, according to Dahlgaard et al. (1998). The fourth stage, Total Quality Management, involves understan-ding and implementation of quality management principles and concepts in every aspect of business, not only is the own organization, but also customers and suppliers. This is a clear systems approach. The four stages have partly re-placed each other during the evolution, but to some extent previous stages exist in parallel with the following stages; Bergman & Klefsjö (2003).
Figure 2.1 Illustration of the concepts of quality inspection, quality control, quality assurance and total quality management. The figure shows one common description of the evolution of quality work. (From Bergman & Klefsjö 2003).
The Two Schools by Kroslid
Another description of the evolution of the quality movement is discussed by Kroslid (1999). He points out that the four-stage-description cannot adequate-ly explain the evolution. Instead he says that the evolution is better described
Quality Control
Quality Inspection
Total Quality Management
Quality Assurance

15
using of two different ‘schools’: ‘the deterministic school’ and ‘the continuous improvement school’, respectively.
The deterministic school has its starting point in ‘taylorism’ and has thereafter passed the steps ‘standard development’ and ‘zero defect principle’, introduced by Crosby (1979). The continuous improvement school started, according to Kroslid (1999), with thoughts about variation and supervision of variation and has Walter Shewhart and Edwards Deming as prominent names. Another step in this school is the concept of Company-Wide Quality Control, meaning that quality work should involve all pieces and all people of an organization. This view has been emphasized by Feigenbaum (1951) and Juran (1995). However, according to Bergman & Klefsjö (2003), the two schools have come closer to each other in their view of quality during the 1990s.
The Continuous Process by Park Dahlgaard
Park-Dahlgaard (1999) also means that the four stage model mentioned above is “too narrow an approach … and is primarily focused on the technical aspects of the quality movement. When focusing on other aspects such as general management viewpoints, learning aspects, sociological viewpoints and human relation aspects, the classification is no longer appropriate.”
The evolution of TQM, described by Park Dahlgaard (2002), can be seen as a continuous process, as a “fusion of eastern and western ideas”, which gradually has shaped TQM. According to Park Dahlgaard (2002), the result is a theory, characterized by both the rational and logical parts stemming from western theorists, and by the holistic, dynamic and humanistic parts transmitted by Japanese practices.
2.2.2 Different Definitions of TQM
As mentioned above, there is no single definition of TQM. Hellsten & Klefsjö (2000) mean that, in their opinion, several of the published attempts to define TQM appear as fairly vague descriptions. As an illustration of this, Deming said “the trouble with Total Quality Management, the failure of TQM, you can call it, is that there is no such thing. It is a buzzword. I have never used the term, as it carries no meaning.” (Deming, 1994).
Dahlgaard et al. (1998) state that until the point, where the definition becomes a reality, TQM is a vision. The vision is achievable only through long term planning, formulating and implementing annual quality plans. These activities will gradually lead towards the point where the vision will be fulfilled. According to Dahlgaard et al. (1998), the reality of TQM is “a corporate culture

16
characterized by increased customer satisfaction through continuous improvements, in which all employees in the firm actively participate.” According to Oakland (1989), TQM can be seen as “an approach for improving the competitiveness, efficiency, and flexibility of a whole organization”. Dale (1999) means, in accordance to ISO 8402, that “TQM is a management approach of an organization, centred on quality, based on the participation of all its members and aiming at long-term success through customer satisfaction, and benefits to all members of the organization”.
In Sweden the shortening TQM is in use, but also some different translations into Swedish. One frequently used translation is ‘offensiv kvalitetsutveckling’ (introduced by Bergman & Klefsjö, 1995), which might be translated back into English as ‘progressive development of quality’. This translation gives an inter-pretation of the TQM concept. The word “progressive” here means that an organization has to be proactive, change and improve, instead of working in a reactive manner with inspections and repairs. According to Bergman & Klefsjö (1995), the word “development” indicates two things. On one hand, quality improvement work is a continuous process it represents some different kinds of developments. It deals with the development of processes in the organization and the products that are results of the processes, bur it also refers to development of the persons working in the organization; see Figure 2.2.
TQM = Progressive Development of Quality
Progressive Development of Quality
The quality of a product, goods or service, is its abilityto satisfy the needsand expectation of the customers.
Active work charac-terised by:
• Proactivity• Changes• Improvements.
A continuous processof developing:
• Products• Processes• People.
Figure 2.2 The figure shows an explanation of a Swedish translation for TQM: ‘Offensiv kvalitets-utveckling’. Back into English ‘offensiv kvalitetsutveckling’ might be translated to ‘Progres-sive Development of Quality’.
For a more thorough discussion of the TQM concept, see, for instance, Boaden (1997), Dean & Bowen (1994), and Park Dahlgaard et al. (2001).

17
2.2.3 The TQM System - the Triad of TQM
Today, the quality issues have changed to include a corporate emphasis applied to all business functions and employees. Some authors have described TQM as a system; see, for instance, Shiba et al. (1993) and Dean & Bowen (1994).
Values
ImproveContinuously
Focus onCustomers
Base Decisionson Fact
Let Everybodybe Committed
Focus onProcesses
Top ManagementCommitment
Methodologies
Bench-marking
Quality Function
Deployment
EmployeeDevelopment
QualityCircles
ProcessManagement
Supplier
Partnership
Design ofExperimentSelf-
assessment PolicyDeployment
Aim: Increase external and internal customer satisfactionwith a reduced amount of resources
ToolsControlCharts
IshikawaDiagram
TreeDiagram
RelationDiagram
ProcessMaps
Criteria ofMBNQA
FactorialDesign
ISO9000
Total QualityManagement
Figure 2.3 Total Quality Management (TQM) seen as a continuously evolving management system consisting of values, methodologies and tools. The aim is to increase external and internal customer satisfaction with a reduced amount of resources. The methodologies and tools in the figure should be seen as examples and not at all as a complete list. MBNQA means Malcolm Baldrige National Quality Award. After Hellsten & Klefsjö (2000).
One interpretation of TQM, as a management system consisting of core va-lues, methodologies8 and tools, has been presented by Hellsten & Klefsjö (2000). These three components are, according to Hellsten & Klefsjö (2000), interdependent and supporting each other, see Figure 2.3. The core values are the basis for the culture of the organization. Therefore, the basic idea is that we have to start with the core values, and then continuously and consistently choose methodologies, which support these values, and finally choose tools supporting the methodologies. According to Hellsten & Klefsjö (2000), ‘pro-cess management’, for instance, is a methodology supporting the value ‘focus on processes’, and ‘process maps’ and ‘control chart’s are examples of tools to be used within process management. The aim of the TQM system is,
8 In the referred article, Hellsten & Klefsjö (2000) use the term “technique”. Since the article was published, they say that the word methodology is preferred (personal communication).

18
according to Hellsten & Klefsjö (2000), to ‘increase the external and internal customer satisfaction with a reduced amount of resources’; see Figure 2.3.
The way of defining TQM as a management system consisting of values, methodologies and tools is used in the thesis. The main reason for that choice is that the system definition by Hellsten & Klefsjö (2000) gives a structure of all the concepts that are part of TQM. For a more thorough discussion on this system interpretation of TQM, see Hellsten & Klefsjö (2000).
2.2.4 The Core Values of Total Quality Management
The concept of TQM is generally described as based on a number of core values. The concept of ‘core value’ has several interpretations; see Schein (1985). Here the concept of ‘core value’ refers to “guiding principles and/or behaviours that embody how your organization and its people are expected to operate”; see NIST (2003). Furthermore, “values reflect and reinforce the desired culture of the organisation. Values support and guide the decision making of every employee, helping the organisation to accomplish its mission and attain its vision in an appropriate manner”;NIST (2003).
The term ‘core values’ is sometimes also named ‘principles’, ‘dimensions’, ‘elements’ or ‘cornerstones’ in literature. In this thesis the term ‘core values’ is used, since it is a way to emphasise that these statements are basic and should work together to constitute the culture of an organization.
There are several suggestions for core values of TQM presented in literature. Tenner & DeToro (1992) describe a model for a TQM strategy9 leading to continuous improvement. The strategy is, with their terminology, based on three fundamental principles and six supporting elements.
Hellsten (1997a) made a comparison study, including these elements and the core values by Bergman & Klefsjö (1994), Dahlgaard et al. (1994), Oakland (1993) and Shiba et al. (1993). The elements, or core values, in the summary by Hellsten (1997a) are:
• Focus on customers • Management commitment • Everybody’s participation
• Focus on processes • Continuous improvement • Fact-based decisions
Furthermore, Kennerfalk (1995) made a similar study and got similar results. Recently, Sila & Ebrahimpour (2002) summarised, after analysing 347 survey
9 Stoner & Freeman (1989) defines a strategy as “the broad program for defining and achieving an organisation’s objectives; the organisation’s response to its environment over time”.

19
articles published between 1989 and 2000, the most frequently covered TQM factors10 in the literature. Roughly, the factors presented in these investigations are the same and there is also a good agreement with the core values presented by Bergman & Klefsjö (1994) illustrated in Figure 2.4.
Figure 2.4 The core values of Total Quality Management as presented by Bergman & Klefsjö (1994). However, they use the term “cornerstones” instead of core values. The figure is sometimes called “the cornerstone model”.
More about core values related to organizational cultures and TQM are discussed by, for instance, Boaden (1996), Hellsten (1997a), Cameron & Sine (1999) and Sila & Ebrahimpour (2002).
The six core values, which are used in this thesis, are briefly explained below. The description is mainly based on Bergman & Klefsjö (1994, 2003), but to some extent other references have been used as well. In those cases, the other reference is mentioned.
Focus on Customers
One important part of the chosen definition of quality is the focus on custo-mers, external as well as internal customers. External customers are in this context the persons or organizations that are the main reasons for the existence of the organization - those we want to create value to. Quality has to be valued by these customers, and it has to be put in relation to their needs and expectations.
When putting customer focus into practice, it can be described as taking some steps of activities. Firstly, there is a need for understanding the needs and expectations of the customers, for instance by conducting market research. Secondly, customer focus means to work in order to fulfil expectations by systematic development and manufacturing of products with the required pro-
10 With the terminology from Sila & Ebrahimpour (2002).
Improve continuously
Let everybody be committed
Focus on processes
Base decisions on facts
Focus on customers
Committed leadership

20
perties. There is a need to understand the customers and why they have the stated opinions and expectations, but also to understand the latent needs that the customer do not realize herself; see the Kano Model described by Kano (1995). An organization should be the expert on its own products, and if an organization can see beyond the stated opinions and understand the needs of the customers there is an opportunity of providing products that give surprise and delight.
However, the customer focus does not exclusively apply to external customers, such as consumers, buyers and end users, but also to internal customers, all the employees, within the organization itself. In order to efficiently and effectively satisfy the external customers we also have to satisfy our internal customers. The customer perspective is also connected to the next value ‘focus on processes’.
Focus on Processes
Most work in an organization can be looked upon as a process; Bergman & Klefsjö (1994). The aim of a process is to deliver products that satisfy its cus-tomers and this work is supported by an organization consisting of people and their relations, resources and tools. A description of the process concept is important in this thesis. One reason is of course to explain the core value ‘focus on processes’. Another reason is the fact that the process concept will be used later on to describe work with self-assessment.
The published definitions of the process concept differ, but some basic simila-rities can be found. This can be illustrated by the following seven quotations or definitions:
”The logical organization of people, material, energy, tools and procedures designed to produce a specific result.” (Pall, 1987)
“Process: Any activity or group of activities that takes an input, adds value to it, and provides an output to an internal or external customer. Processes use an organization’s resources to provide definitive results.” (Harrington, 1991)
“…a bounded group of interrelated work activities providing output of greater value than the inputs by means of one or more transformations.” (Melan, 1992)
“A process is a network of activities that are repeated in time, whose objective is to create value to external or internal customers” (Bergman & Klefsjö, 2003)
“A process consists of a seris of activities with a precise start and end, which by help from the organization’s resources repeatedly gives value to a measurable object from a supplier to a customer.” (Egnell, 1994)

21
“A chain of activities, which repeatedly produces value for the customers.”(Rentzhog, 1998)
According to Melan (1992), productive processes consist of the three key ele-ments: transformation, feedback control and repeatability. Melan (1992) talks about repeatability, but does not use that term when explaining ‘process’ in his definition. One definition that provides the repeatability nature of a process is the one by Bergman & Klefsjö (2003). But, they do not express the importan-ce of declaring a precise start and end of the process, as Egnell (1994) does. On the other hand Egnell (1994) does not mention the requirement of trying to reduce the resources.
As a summary, the definition used in this thesis is the following combination of the definitions by Bergman & Klefsjö (2003) and Egnell (1994):
“a process is a network of activities, with a precise start and end, that are repeated in time. It transforms certain resources to result that should satisfy its customers.”
When talking about processes, Juran (1989) mentions the three different roles: suppliers, processors, and customers. When this is described in what he calls the “Triprol Diagram” (see Figure 2.5), the similarities with the process views mentioned above can be recognised. But Juran also points out that persons working in a specific process, called process team, have all these three process roles in their work; it is a triple role, as he says. When the process team has contacts with the suppliers to the process, for instance, when receiving various kinds of inputs, the role of the team is as customer. When working in the process, the team is acting as processor. Finally, when the team supplies its products to the customers of the process, the team is acting as supplier. This shows the importance of near connection between the concepts of customers and of processes.
OUR
PROCESS(ES)
Our
Inputs
Our
Outputs/
Products
Our
Suppliers
Our
Customers
Customer Processor Supplier
Our roles
Figure 2.5 The Triprol Diagram. From Juran (1989).

22
Improve Continuously
A third core value is ‘improve continuously’. External demands for quality are continuously increased. Therefore, continuous quality improvement of goods and services is necessary. The PDSA-cycle, sometimes called the improvement cycle, presented by Deming (1993) is today a form of mental model of this improvement work; see Figure 2.6.
D oStudy
PlanAct
Figure 2.6 The improvement cycle as presented by Deming (1993) and often called the Deming cycle. Deming himself called it the Shewhart cycle to honour Shewhart as the originator of the cycle. This cycle shows how improvement work can be accomplished in a systematic way. The work should start with planning of the improvement project, based upon an idea of what should be improved. The next step is to test what has been planned. Thereafter, the results of the test should be studied. Finally, in the act-phase, decisions on what to do, based upon the study, have to be made. (From Deming, 1993.)
Even without external pressure, continuous improvements of quality are well justified from a cost point of view. Today, measured costs due to defects and other non-quality contributions are large. It is not unusual for them to reach 5 to 20 percent of total sales, bad-will not included; Sörqvist (1998). In service companies it might be as high as 30% or more; see, for example, Suminski (1994) and Crosby (1988). In most cases defects also cause other costs. Many products in work and big buffer stocks are needed to compensate for the high rate of disturbances. The corresponding capital costs are usually not registered as costs due to poor quality. Their contributions can, however, amount to a considerable part of the total costs due to low levels of quality.
Here we also want to emphasize that, according to Bergman & Klefsjö (1995): “It is always possible to improve quality and at the same time reduce costs”, and in their system-view of TQM, Hellsten & Klefsjö (2000) mean that the aim of the sys-tem is: “ … to increase external and internal customer satisfaction with a reduced amount of resources”; see Figure 2.3.

23
Base Decisions on Facts
It is important to base decisions on well-founded facts and not on random factors. Factual data of both numerical and verbal character is needed and also to use systematic tools for the structure and analysis of these data; Deming (1986) and Ishikawa (1982). To improve products and process it is also necessary to have knowledge about variation and how to separate random causes of variation from systematic causes; see Deming (1993).
In order to improve in a systematic way, TQM offers much more than the improvement cycle as a mental model. For example, there are different toolboxes presented. One is ‘the seven QC-tools’ and another one ‘the seven management tools’. Most of the QC-tools are intended for structure and analysis of numerical data and were put together by Kaoru Ishikawa; see Ishikawa (1982). Conversely, the seven management tools are mainly intended for work with verbal data. These tool boxes are described by, for instance, Klefsjö et al. (1999), Brassard (1996), Bergman & Klefsjö (1995), and Andersen & Fagerhaug (2000).
Let Everybody be Committed
Edvarsson et al. (1994) state that ”TQM for service depends on and creates a culture in an organization, which involves everybody in quality improvement”, and this is even mo-re valid in services than in manufacturing industry. Kotter (1996) shows that a lot of companies have failed with their improvement work as a consequence of underestimating the importance of employee participation. In order to establish fruitful work with quality improvements it is important to create possibilities for participation and commitment for all employees. Key words here are information, or even better, communication, delegation of responsibilities and authorities, and personal learning in harmony with organizational learning; see Senge (1990) and Bergman & Klefsjö (2003). Recent research also supports that employee commitment is closely related to lower sick leaves; Harnesk et al. (2004).
A study made by Tollgerdt-Andersson in 1993 about people’s creativity and interest in work points out the correlation between their satisfaction with responsibility, attitude, possibility for personal learning, variation, and imme-diate superior on one side and productivity on the other; see Tollgerdt-An-dersson (1997). Interesting discussions about motivation can be found in e.g. Kondo (1991) and Kondo & Park Dahlgaard (1994). Furthermore, it should be noted here that a number of authors have found relations between internal customers’ satisfaction and external customers’ satisfaction; see, for instance, Westlund & Löthgren (2001) and Grønholdt & Martensen (2001).

24
Committed Leadership
Few authors would dispute the importance of management commitment. Joseph Juran said that “to my knowledge, no company has attained world class quality without upper management leadership”; Bergman & Klefsjö (2003). The view of lea-dership by Juran (1995) is that “All managerial activity is directed at either break-through or control”. He says that ‘control’ denotes “an organised sequence of activities by which companies prevent change”. Correspondingly, ‘breakthrough’ means that an organization achieves change. He also emphasises that the word company stands for any organization, private companies as well as state schools for instance
Kotter (1996) is one of many authors, who emphasises the importance mana-gement has for quality improvements and organizational change. Furthermore, Dahlgaard et al. (1998) emphasise the importance of outlining quality goals, quality policies, and quality plans by managers. The quality goals should, for example, give signals to the employees of the importance of satisfying external customers. Dahlgaard et al. (1998) accentuate the significance of using goals and policies that are clear and meaningful to the employees.
However, the managers also have to actively support quality initiatives, by financial and time resources as well as moral support. It is also important the managers serve as a model, for instance by systematically improve their way to manage, and, furthermore, actively participate in the quality activities within the organization; Bergman & Klefsjö (2003).
Tollgerdt-Andersson (1997) says that the duties of managers have changed from a role including checking and controlling to a role where the leaders have to create and communicate common values, delegate responsibility and create possibilities for commitment in the organization. It is a manager’s task to crea-te working conditions that maximize the motivation and willingness of change among employees; see, for instance, Hackman & Oldham (1976) and McKenna & Beech (2002).
System view
Although not included in the model in Figure 2.4 as a core value, the system view, or systems thinking, is an important ingredient of TQM. Systems thinking means to see the overall view and how the various parts are affecting one another. An important part that still is not emphasized sufficiently is the realization that everybody involved can be a winner. This is an example of the attitude that Deming (1993) calls win-win. Deming (1993) in fact uses the school system as one form of systems thinking. The different school levels constitute together an educational system and the parts should co-operate to create an efficient education.
25
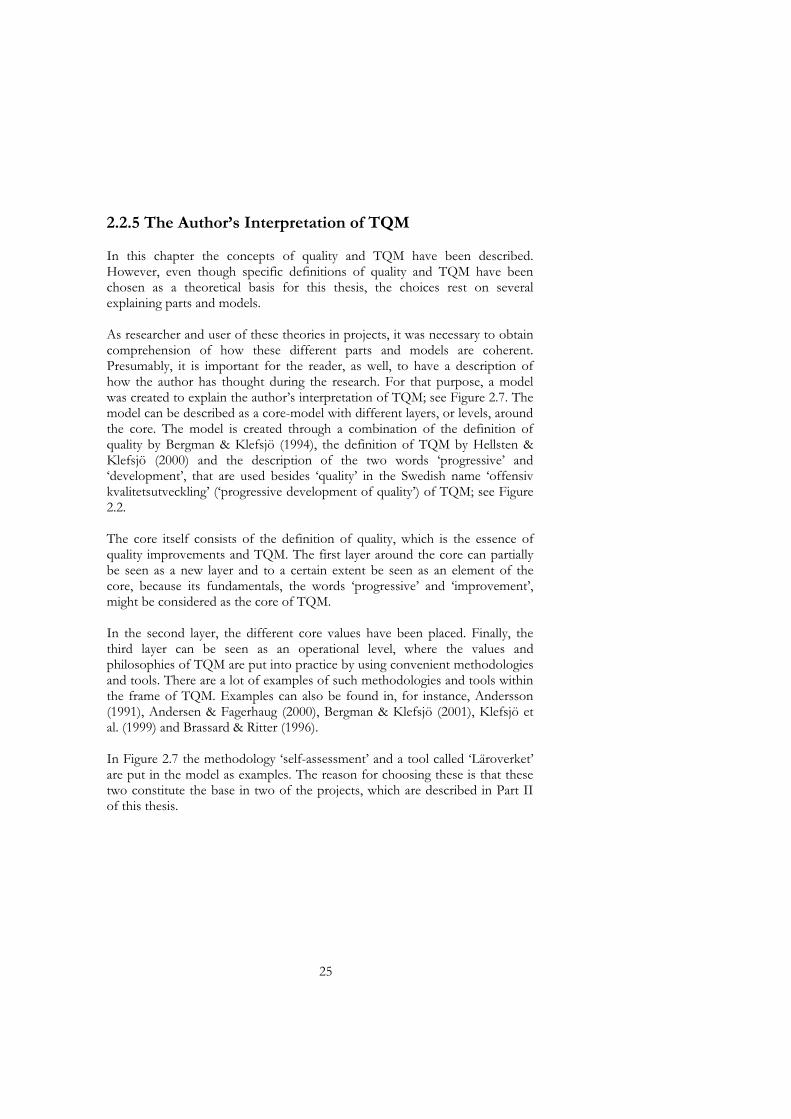
2.2.5 The Author’s Interpretation of TQM
In this chapter the concepts of quality and TQM have been described. However, even though specific definitions of quality and TQM have been chosen as a theoretical basis for this thesis, the choices rest on several explaining parts and models.
As researcher and user of these theories in projects, it was necessary to obtain comprehension of how these different parts and models are coherent. Presumably, it is important for the reader, as well, to have a description of how the author has thought during the research. For that purpose, a model was created to explain the author’s interpretation of TQM; see Figure 2.7. The model can be described as a core-model with different layers, or levels, around the core. The model is created through a combination of the definition of quality by Bergman & Klefsjö (1994), the definition of TQM by Hellsten & Klefsjö (2000) and the description of the two words ‘progressive’ and ‘development’, that are used besides ‘quality’ in the Swedish name ‘offensiv kvalitetsutveckling’ (‘progressive development of quality’) of TQM; see Figure 2.2.
The core itself consists of the definition of quality, which is the essence of quality improvements and TQM. The first layer around the core can partially be seen as a new layer and to a certain extent be seen as an element of the core, because its fundamentals, the words ‘progressive’ and ‘improvement’, might be considered as the core of TQM.
In the second layer, the different core values have been placed. Finally, the third layer can be seen as an operational level, where the values and philosophies of TQM are put into practice by using convenient methodologies and tools. There are a lot of examples of such methodologies and tools within the frame of TQM. Examples can also be found in, for instance, Andersson (1991), Andersen & Fagerhaug (2000), Bergman & Klefsjö (2001), Klefsjö et al. (1999) and Brassard & Ritter (1996).
In Figure 2.7 the methodology ‘self-assessment’ and a tool called ‘Läroverket’ are put in the model as examples. The reason for choosing these is that these two constitute the base in two of the projects, which are described in Part II of this thesis.

26
Let e
very
body
beco
mm
itted
Focuson
processes
Top managementcommitment
Progressive: change, improvement &
pro-activity
Development of:products, processes
& people
Methodologyexample: self-assessment
Toolexample:
Läroverket & Lärostegen
Improve
continuouslyBas
ede
cisi
ons
onfa
cts
Focus oncustomers
..
..
The core: definition of quality
The base for TQM: progressive,quality & development
Values in TQM: the sixcornerstones
The operational level of TQM: methodologies & tools
The quality of aproduct (article or service) is its ability to satisfy the needs and expectations of
the customers
.
Figure 2.7 A core model of TQM, corresponding to the author’s view of TQM. The core model is a combination of the definition of quality by Bergman & Klefsjö (1994, 1995), the explanation of the Swedish name of TQM in Figure 2.2, and the TQM-triad described by Hellsten & Klefsjö (2000).
27
2.2.6 Self-Assessment as a Methodology within TQM
Background
When an organization is initiating or intensifying a systematic quality work based upon TQM, one important question is where and how to start. In order to find the areas that are important for improvements and at the same time support a culture based on TQM values, self-assessment has become an established methodology.
As mentioned in Chapter 1, Dahlgaard et al. (1998) mean that it is “generally accepted that a TQM process starts with a self-evaluation11…”. According to Zink (1997), “self-assessment is a powerful management tool12: it provides direction for continuous improvement initiatives in crucial result areas”. The main reason for accomplishing TQM-based self-assessment is to achieve a platform for decisions regarding the improvement work.
The interest in self-assessment has increased rapidly during the 1990s, which can be illustrated by the amount of published literature and articles; see, for in-stance, Porter & Tanner (1995), Zink (1997), Hellsten (1997a) and Conti (1997). One reason for this is the establishment of a large number of quality awards13. The establishment of different quality awards had two purposes. One was to emphasize the importance of quality improvements and to put good examples in focus as inspiration to others. The other one was to stimulate organizational improvements by participating in the quality award process or, by using a similar procedure without external people involved, which means performing self-assessment. The main difference between the two procedures is that when participating in an award process another organization owns the process; see Eriksson (2003) for a discussion.
However, according to Hellsten (1997a), the interest in self-assessment is mostly among large organizations. Studies of self-assessment practices show that it is not much used by smaller organizations; see Klefsjö (2003), Sturkenboom et al. (2001).
Since one focus in this thesis is on self-assessment as a methodology for quality improvements, there is a need to further discuss the concept of ‘self-assessment’.
11 In this thesis the term self-assessment is preferred instead of self-evaluation. 12 In this thesis self-assessment is considered as a methodology and not as a tool; see discussion in Chapter 3. 13 We will return to quality awards and their criteria in Section 2.2.8.
28
Reasons for Self-Assessment
Porter & Tanner (1996) state that it is hard to carry out changes in organizations without understanding the organization’s history, structure, competition, and main activities. The basic question “where are we now?” can, they say, be answered by accomplishing a self-assessment. According to Zink (1997), the aim must be to achieve ‘areas for improvement’ without losing sight of the ’strengths’ of the organization. According to Hakes (1996), it is clear that the main reason to work with self-assessment is to improve the performance of an organization. To be able to achieve improvements, organizations should transform found strengths into plans, or as Zink (1997) says: “Good intentions stemming from self-assessment should be translated into concrete assessable action plans and improvement targets, all integrated into regular business plans”.According to Hillman (1994), the objective of self-assessment is to identify and act on the areas of the improvement process that “requires additional effort, while recognising and maintaining that which is already doing well”. Wright (1997) has made a similar reasoning but emphasises also the importance of the fact that a self-assessment programme should be followed up by actions on the findings. This is required since self-assessment will not result in improvement on its own.
Hellsten (1997a) claims that internal issues are the most important reason why organizations choose to initiate self-assessment, and refers to studies by van der Wiele et al. (1996) and Finn & Porter (1994). The survey by van der Wiele et al. (1996) includes 117 European organizations that have experience from self-assessment, and they found that the most important reasons for perfor-ming TQM based self-assessment are:
• to find opportunities for improvement • to create focus on a model of TQM based on either the criteria of the
EFQM model or of the Malcolm Baldrige National Quality Award • to direct the improvement process • to provide new motivation for the quality improvement process • to manage the business.
Brown & van der Wiele (1996) show, on the basis of national postal survey of self-assessment in Australia, that the reasons for using self-assessment are mainly to find opportunities for improvements and to direct the improvement process, while the goals for introducing self-assessment are to improve business performance, to drive continuous improvement and to increase quality awareness in all aspects of the business.
It seems logical that internal reasons constitute the most important motivation for accomplishing a self-assessment. Improvements should be more efficiently performed if we ourselves could identify the weaknesses of our organization

29
and if we ourselves could identify what to do and also are allowed to create and participate in the improvement planning.
A couple of studies, discussed by Porter & Tanner (1996), show that the main benefits with self-assessment, found from a number of fairly large organiza-tions which have performed self-assessment, are that:
• it provides an objective identification of current strengths and areas for improvement
• it enables possibilities for comparison between departments, divisions and externally against other organizations in a learning culture
• it provides an analysis of an organization’s overall capability to meet customers’ requirements and expectations
• provide strategic directions for the organization • can bring an organization into a potential award winning position • may be used to measure, compare and rank interdivisional
performance.
The references mentioned mainly describe experiences from the private sector, with a focus on producers of goods, but what about the service sector and the public sector? One form of service is education, and in Sweden public organizations constitute the main part of the sector of education. Some studies have been made referring to quality work in educational organizations. For instance, Lagrosen (1997) has accomplished a study at four schools, which have used the criteria of the Swedish Quality Award14 for their quality work. Lagrosen says that at the time for his study, there was a lack of comprehensive and systematic methodologies for assessing and developing the work with the Swedish Compulsory School. According to Lagrosen (1997), there are great advantages of using TQM in the Swedish compulsory school.
A similar statement is made by Lundquist (1997), based upon a study of qua-lity work in some university departments in Sweden. This is another example of a study that has been made on quality work in educational organizations. Lundquist says that: “a TQM perspective seems consistent with common and desirable objects in teaching and learning in general”. Also, according to Lundquist (1997), the use of criteria for the Swedish Quality Award seemed to be useful.
Some other, more recent, studies with similar comments are Stahr (2001) and Jackson (1999), studying the health care sector, and Ensby & Mahmoodi (1997), Lawrence & McCollough (2004) and Hides et al. (2004), discussing the educational sector.
14 We will return to the Swedish Quality Award in Section 2.2.9.
30
2.2.7 The Author’s View of Self-Assessment
The author has chosen to describe self-assessment based upon earlier existing definitions and descriptions. Before the description of the author’s view is outlined, some other definitions will be presented.
Definitions of Self-Assessment
When comparing definitions of self-assessment, similarities between different descriptions can be recognised. For instance, self-assessment on a general level is often described as an evaluation process against a specified model; see the discussion by Hellsten (1997a). Hillman (1994) defines self-assessment as: “Theprocess of evaluating an organization against a model for continuous improvement, in order to high light what has been achieved and what needs improving.”
One organization that recommends use of self-assessment is the European Foundation for Quality Management, EFQM. One of the missions of this organization is promotion of self-assessment as a key-process for business improvement; see EFQM (1996). EFQM describes their view of self-assess-ment as follows:
“Self-assessment is a comprehensive, systematic and regular review of an organization’s activities and results referenced against a model of business excellence; … “The self-assessment process allows the organization to discern clearly its strengths and areas in which improvements can be made and culminates in planned improvement actions which are monitored for progress.”
This description of self-assessment emphasizes the importance of including both the assessment itself and the following improvement actions in the self-assessment process. In contrast to EFQM (1996) this thesis contends that self-assessment should be looked on as a separate process that has to be followed by an improvement process. This view is also supported by Hellsten (1997a), Klefsjö (1999), and Svensson & Klefsjö (2000), and lies behind the two-pro-cess picture shown in Figure 1.1 and 2.10. The main reason for this separation is that the input to the organisation’s improvement work also may come from other sources.
The Four Phases
There are many possibilities to perform self-assessment. In order to clarify the concept we want to explore a four-phase model discussed by Svensson & Klefsjö (2000). This model was partly developed during the research related to the self-assessment projects, described and discussed in Part II and III of this thesis.

31
During the first of these projects, self-assessment was described as the four phases: Planning, Describing, Evaluating, and Improvement work. However, during the first project, it was found that the term ‘evaluation’ should be avoided here, since it caused confusion; see also Chapter 5. A new description of the four phases of self-assessment using ‘analysis’ instead, was therefore used in the other two research projects. That one is presented in Figure 2.8.
Figure 2.8 Self-assessment seen as four consecutive phases. First the work should be planned, and then a description of how we work today should be created. The third phase describes how the work should be scrutinised and finally an action plan should be created as a foundation for the improvement work. Note that the four phases have a close relation to the four phases of the improvement cycle; see Figure 2.6. A self-assessment procedure can be considered as one cycle on the organizational level. From Svensson & Klefsjö (2000).
The aim of the four phases is to constitute a platform for the improvement work; see the discussion in Svensson & Klefsjö (2000) and Figure 2.9. This can be done in a systematic way by the use of the improvement cycle; see Figure 2.6. Some comments related to the four phases are:
• It is important to begin by seriously planning the self-assessment. Why should we perform self-assessment? When should the work be done? Who should be involved? Which model should be used as a basis for the description?
• In step two a description of the organization should be created, preferably based on criteria from quality awards or other similar TQM-based tools.
• Next, an analysis of the description should be made in order to find strengths and improvement possibilities.
• Based on the results from the analysis a plan for improvements should be created. What should be done? What resources are needed? Who should perform the work? Who is responsible? When should the work be completed?
The questions stated in the first point above, are similar to the four basic ques-tions that Franke-Wikberg & Lundgren (1979) have stated as important when
create a
description
of today's
work
analysis of
the description • what?
• when?
• by whom?
• why?
• how?
• when?
• tool?
PlanningHow do we
work today? AnalysisImprovement
plan
plan for
improvements

32
doing pedagogic evaluations. These four questions are: “what shall be evalua-ted”, “which is the aim of the evaluation and to whom shall it be made?”, “how shall the evaluation be made?”, and “who shall accomplish the evalua-tion?”.
It may be argued that the focus too often is placed on the second and third phases in Figure 2.8. The first phase, and also the fourth and most important phase, are often neglected; see Eriksson (2003). Therefore, the author of this thesis strongly believes that the four-phase model in Figure 2.8 is important. The four phases in the self-assessment process can be considered as one lap around the improvement cycle in Figure 2.6, as illustrated in Figure 2.9.
D oStudy
Plan
• why?• how?• when?• tool?
Get a descrip-tion of the
organisation’sway to work
• what?•• by whom?
Act
when?
Analysis ofthe description
Plan forimprovements
Self-assessment
Figure 2.9 The model for self-assessment used in this thesis. The four phases in self-assessment are here combined with the four phases of the PDSA-cycle “Plan-Do-Study-Act”. From Hellsten & Klefsjö (2000) and Svensson & Klefsjö (2000.)
The platform that the work in the action-planning phase is directed towards might be supplemented by other improvement considerations and result in a second, consecutive improvement process. Here, each improvement project can be seen as one lap in the improvement cycle, as illustrated in Figure 2.10.

33
Act Plan
DoStudy
Phase IIDescribe
Phase IIIAnalyse
Phase IVPlan for improve-
ments
Phase IPlan
Self-assessment Improvement work
Act Plan
DoStudy
Act Plan
DoStudy
Project A Project B
Other inputs for
improvem
ent work
Figure 2.10 Self-assessment and improvement work seen as two interdependent and consecutive processes, each consisting of four phases similar to those in the improvement cycle.
The Process for Self-Assessment
There are several ways in which the different phases of self-assessment, illust-rated in Figure 2.8 and 2.9, can be carried out. For instance, the gathering and structuring of information to create the description and the later analysis can be done in many ways ranging from simple questionnaires through manage-ment workshops to the simulation of a full quality award application. Different approaches are discussed in, for instance, EFQM (1996), Porter & Tanner (1996), Lindström et al. (1999) and Hides et al. (2004).
There are at least five different ways to carry out the self-assessment methodology in detail, namely: ‘the form approach’, ‘the seminar approach’, ‘the award approach’, ‘the matrix approach’, and finally ‘the questionnaire approach’; see Lindström et al. (1999), EFQM (1999) and Klefsjö (1999).
Even though there are differences between these five approaches, it is in all cases possible to describe the self-assessment procedure by the view of self-assessment as comprising of four different phases; see Figure 2.8 and 2.9.
Various factors influence the way in which an organization tackles self-assess-ment. Among these are, for example, the size and resources of the organi-zation, its prevailing culture and the reasons for conducting self-assessment.

34
Among the different things to decide are:
• The selection of an appropriate assessment model• The selection of approach for data collection• The selection of approach for the analysis of the description.
In this thesis a self-assessment procedure similar to the quality award process is used. This means that the tools used to create the description are criteria similar to award criteria, and the data collection mainly consists of answering the questions in these criteria. The evaluation process is based on a consensus one, which means that a group of examiners first individually evaluate the description, and then meet and agree on a joint analysis, with a feedback report as an output result. This feedback report consists of strengths and improvement possibilities found in the description of the organization.
2.2.8 Different Tools for Self-Assessment
Several tools have been developed in order to support self-assessment. The most well-known of these tools are probably the booklets, including assessment model and criteria, used for different quality awards, such as the Malcolm Baldrige National Quality Award (NIST, 2004), the European Qua-lity Award (EFQM, 2004), and the Swedish Quality Award (SIQ, 2004). A dis-cussion of these tools can be found in Porter & Tanner (1996) and Puay et al. (1998).
However, the existing award criteria are often experienced as too complicated, both regarding language and volume, related to the level of awareness and the existing time resources in many organizations, not the least in smaller organizations; see Wilkes & Dale (1998), Eriksson (2003), and Klefsjö (2003). For instance, it was not until 1996 that the Swedish Quality Award was distri-buted to an organization with less than 200 employees (Bergman et al., 1999).
As a consequence, new and simplified tools have been published and establi-shed. One such example, which has a simpler language and a smaller content than most common award criteria, is the Springboard; see Hellsten (1997a, b).
Most of the booklets with award criteria are, according to the author, structured in a similar way, consisting of three main parts:
• A model of the organization and its work • The criteria, which in turn consist of questions, which should be
answered in order to get the description • Assessment dimensions and rules and some form of scale, or points,
for judgement of the organization’s performance.

35
The first one is just a figure, the other two rest upon certain core values, which constitute the base for the tool; see Figure 2.11.
Figure 2.11 The different booklets developed for assessment for quality awards consist of three parts; a mo-del of the organization and its work, the award criteria, which in turn consist of questions which should be answered in order to get the description and assessment dimensions and rules and some form of scale for judgement of the organization. From Svensson (2002).
Below, some different tools used for self-assessment are shortly commented. Firstly, the Criteria for Performance Excellence used in the Malcolm Baldrige National Quality Award is described. Secondly, the EFQM Excellence Model, used in a lot of countries in Europe, and the base for The European Quality Award is presented. Thirdly, the SIQ Model for Performance Excellence model, used also in the Swedish Quality Award is described. Finally, a less comprehensive tool called ‘the Springboard’ is discussed.
Criteria for Performance Excellence
The Malcolm Baldrige National Quality Award was established in the USA by president Ronald Reagan in 1987; see Bergman & Klefsjö (1994). The booklet with model, criteria and assessment dimensions, which is the base for the award is called the Criteria for Performance Excellence. The present assessment model is illustrated in Figure 2.12.
The Criteria for Performance Excellence in Malcolm Baldrige National Quality Award model15 rest on “the eleven core values and concepts”: Visionary leadership, Customer driven, Organizational and personal learning, Valuing employees and partners, Agility, Focus on the future, Focus on results and creating value, Managing for innovation, Systems perspective, Management by fact, and Public responsibility and citizenship; see, for instance, NIST (2004).
The seven criteria in the model, which is illustrated in Figure 2.12, consist in turn of 18 items. The criterion ”Business Results”, which has been given 450
15 The discussion is based on Malcolm Baldrige National Quality Award 2004.
Model of the
organization and
its work
Criteria and
evaluation
questions
Core values
Assessment
dimensions
and rules

36
points of 1000 total, includes results in the form of customer satisfaction, financial results, employee satisfaction and process efficiency. Compared to the older model this is a significant change towards financial and other results. There are two assessment dimensions, Process (focusing on Approach, Deployment, Learning and Integration), and Results; see NIST (2004).
Figure 2.12 The model used in the Criteria for Performance Excellence, the base of the Malcolm Baldrige National Quality Award. The model was changed in 1997. The corresponding assessment criteria are called ”Criteria for Performance Excellence”. From NIST (2004).
The EFQM Excellence Model
In 1992 the European Foundation for Quality Management, EFQM, with support from European Organization for Quality (EOQ) and the Europen commission, established The European Quality Award. That award rests on, what now is called the EFQM Excellence Model.
Key words in the assessment criteria are leadership, quality strategy and impro-vement work for all processes within the company, how the employees’ know-ledge is taken care of and developed, the satisfaction among customers as well as the employees.
A matrix is used to evaluate the description. It is built on the four dimensions ‘Results’, ‘Approach’, ‘Deployment’, and ‘Assessment and Review’, which gives the acronym RADAR. The idea is that an organization should:
7BusinessResults(450 p)
2StrategicPlanning
(85 p)
3Customer andMarket Focus
(85 p)
Organizational Profile:Environment, Relationships, and Challenges
5Human
ResourceFocus(85 p)
6Process
Management(85 p)
4Information och Analys
(85 p)
1Leadership
(120 p)
4Measurement, Analysis and Knowledge Management
(90p)

37
• decide which results should be reached • plan and develop approaches which is needed for this • deploy these approaches systematically • assess, review and improve the approaches and deployments.
For more information; see EFQM (2004).
Leader-
ship
10%
Society
Results 6%
Customer
Results 20%
People
Results 9%
Partnership &
Resurces 9%
People
9%
Policy &
Strategy 8%Processes
14%
Enables
50%
Results
50%
Innovation and Learning
Key
Perfor-
mance
Results
15%
Figure 2.13 The EFQM Excellence Model, established by the European Foundation for Quality Management, and since 1999 the base for The European Quality Award (EQA). Of the assessment points 50% is put on enables and 50% on the results. From EFQM (2004).
The SIQ Model for Performance Excellence
The SIQ Model for Performance Excellence, which is the base for the Swedish Quality Award, is based on 13 core values, which are said to cha-racterize successful organizations, see Figure 2.14.
• Customer orientation• Committed Leadership• Partcipation by Everyone• Competence Development• Long-Range Perspective• Public Responsibility• Process Orientation
• Prevention• Continuous Improvement• Learning by Others• Faster Response• Management by Facts• Partnership
Figure 2.14 The 13 core values, which constitute the base for the SIQ Model for Performance Excellence, which are the base of the Swedish Quality Award. (From SIQ, 200216)
16 The latest version of the SIQ Model translated to English. However the core values are the same also in the version of 2004.

38
The SIQ Model is based on a model consisting of seven criteria; see Figure 2.15. Each one of these is then built on sub-criteria. Altogether, there are, in the version for 2004, 25 sub-criteria on which 1000 points are distributed; see Figure 2.15.
Organization
Leadership(90 points)
Informationoch Analysis(80 points)
StrategicPlanning
(60 points)
Human ResourceDevelopment(150 points)
Management ofProcesses
(160 points)
Results(160 points)
CustomerSatisfaction(300 points)
Figure 2.15 The organisational model in the SIQ Model for Performance Excellence, the base for the Swedish Quality Award. The distribution of the points has changed over the years. The figure shows the situation for the year 2004. (Translated from SIQ, 2004.)
Within each criterion there are questions related to the core values, which should give insight in how the organization’s work is performed today:
• How are we working…? (Approach) • To what extent do we do it? (Deployment) • What results can we show? (Result) • How do we evaluate and improve our approaches and deployments?
(Assessment and Improvement)
For more information; see SIQ (2004).
The Springboard
The Springboard was developed by Hellsten (1997a), mainly to stimulate small organizations to work with self-assessment. The goal was to create a tool based on the six core values in Figure 2.4, but with a simpler language and smaller contents than most existing award criteria booklets. The model is illustrated in Figure 2.16. The Springboard has, with its attractive design and language, partly inspired the development of the self-assessment tools presented in this thesis.

39
Figure 2.16 The Springboard focuses on the four main areas Customer Cooperation, Leadership, Employee Commitment, and Management of Processes. The four assessment dimensions are put in the rectangles. (From Hellsten, 1997c)
The questions in the Springboard focus on four areas of the organization (see Figure 2.16): Customer Cooperation, Leadership, Employee Commitment, and Management of Processes. These areas have been selected considering the underlying principles of the Springboard and important parts of quality mana-gement, as discussed by, for instance, Garvin (1991) and Price & Chen (1993). The relation between the core values and the areas is illustrated in Figure 2.17.
Base decisionson facts
Focus oncustomers
Focus onprocesses
Improvecontinuously
Let everybodybe committed
Managementcommitment
Employeecommitment
Leadership
Customercooperation
Managementof processes
Figure 2.17 The relation between the six core values of TQM in Figure 2.4 and the four areas of the Springboard. (From Hellsten, 1997a)
In all the four areas, the questions in the Springboard are systematically struc-tured around the following four types of questions:
• How are we working (approach)? • To what extent do we do it (deployment)? • What results do the deployment of the approach lead to (results)? • How do we evaluate approaches and deployments and which
improvements have these led to (improvement & evaluation)?

40
Examples of questions from the area ‘Customer Cooperation’ are presented in Figure 2.18.
The four types of questions correspond to the four assessment dimensions ’approach’, ‘deployment’, ‘results’ and ‘evaluation & improvement’ in the Springboard; see the model in Figure 2.16. For many years, the dimension ‘evaluation & improvement’, which is fundamental in the continuous improvement philosophy of Total Quality Management, has only been impli-citly included in the existing award criteria17. Furthermore, the four dimensions in the Springboard correspond to the four parts of the improvement cycle. More details about the Springboard, the structure and the research behind its development can be found in Hellsten (1997a, b).
How do we find out our customers' present needs, demands and expectations?
A How are we working (approach)?
B To what extent do we do it (deployment)?
How do we find out our customers' future needs, demands and expectations?
A How are we working (approach)?
B To what extent do we do it (deployment)?
How do we work to satisfy our customers' needs and demands?
A How are we working (approach)?
B To what extent do we do it (deployment)?
…
What are the results achieved concerning our customers' cooperation
(show preferably as graphs)
2.
10.
11.
3.
4.
Who are our customers or groups of customers?
Show the results from the last few years' measurements connected to our
customers' satisfaction. Compare the results to our own goals (results).
Compare also the results from our business with our competitors'
corresponding values (results).
1.
How do we evaluate our approach and deployment regarding customer
co-operation and which improvements have this lead to
(evaluation & improvement)?
A.
B.
Figure 2.18 Some examples of questions from the Springboard. The selection is from the area “Customer cooperation”, but the structure is the same within all the four areas. (From Hellsten, 1997c.)
Which Model Should Be Used for Self-Assessment?
Although many of the tools used for self-assessment are similar in structure (see Figure 2.11) they differ slightly in some aspects, e.g. the core value base, the number of criteria or areas, the structure of the questions and the 17 The SIQ Model changed to four dimensions in the version from 2003.

41
assessment dimensions and rules. It is important, however, to emphasize, that the similarities between them are strong and the differences are smaller. However, some comments should be made.
One is related to the core values, which is the base for the award criteria. It is, of course, important to measure the right culture with the self-assessment so the choice of tool should partly depend on what values we want to evaluate. Another point is regarding the purpose of the self-assessment. If the main purpose is to compare the results with other organizations that are good examples, standard criteria with an established point system for assessment might be useful, such as those behind the European Quality Award and the Malcolm Baldrige National Quality Award. If the main aim is to find improvements in the own organization, an optional suitable model with no or little focus on points is a better alternative. There are experiences showing that the focus otherwise easily will be on points instead of the identified improvement possibilities. This discussion, and also other related questions, can be found in e.g. Conti (1993, 2001) and Samuelsson & Nilsson (2002).
2.3 TQM and Self-assessment in the
Educational Sector
TQM and Education
As earlier stated, the interest in TQM in the educational sector has increased during the last decade or so. For instance, Burkhalter (1996) reports that 160 universities in the US were actively involved in TQM work. Lozier & Teeter (1996) describe some of these applications. In some cases the TQM work has been successful. One outstanding example of that is University of Wisconsin at Stout18 in the USA, who got the Malcolm Baldrige National Quality Award in 2001, as the first higher educational institute. Arif & Smiley (2004) describe their implementation and suggest a model of operations for colleges and universities based on the experiences.
However, some people are critical to the real result of the TQM work in many cases and mean that the applications often are not related to the universities’ main business but in areas tangential to the primary mission of institutions of higher education.
18 The university has some 8,000 students, 27 undergraduate and 15 graduate degree programs and a staff of about 1,300 people.

42
For instance, Koch & Fisher (1998) discuss the use of TQM in higher education. They state that “...the empirical evidence in favour of TQM in universities is mostly anecdotic and surprisingly sparse. The evidence that does exist relates primarily to administrative tasks...” They also state that “the truth is that higher education institutions have excelled at announcing TQM campaigns, but typically have been incapable of implementing then fully or reaping significant benefits”.
Also Koch (2003) discusses applications of TQM under the title “TQM – why is its impact in higher education so small?”. He means that TQM has had remarkably small impact on colleges and universities. TQM in higher education has focused on non-academic activities, as registration, bill paying and purchasing and ignored the critical issues as faculty tenure, curriculum and tuition. He states that “in the realm of higher education, one can not resist surprise with respect to how little concrete empirical evidence has been generated concerning TQM”. His own answer is that “…TQM simply does not work as advertised”. He says that there are three major classes of reasons for that:
• Failure to focus on the big questions. The focus is on how students register rather than on what they learn or the role of faculty tenure.
• Academic culture is not receptive to TQM. The TQM ideas are not in harmony with the doctrine of academic freedom as its plays out in individual professional classrooms and their professional lives. Faculty members traditionally have had the right to profess their disciplines as they see fit and too seek truth.
• Failure to define the TQM challenge in higher education? It is important to know the customers, whom the organization attempt to serve. The customers of higher education are however much more diverse and not so easily defined as, in the case of Ford Motor Company. Furthermore, the question “what is the purpose of higher education?” is even harder to answer.
Cruickshank (2003) states that “the adoption of TQM practices into universities continues to be slow and controversial among the academic community”. He also means that the academia is many cases do not have the system view of TQM and states: “academic members will need to recognize their institution as a system, and view the institution as a system of interrelated parts”.
Also Srikanthan & Dalrymple (2004) discuss the use of TQM at university level and present a model spelt out in four well-articulated methodologies for the practice. They mean that universities has made great strides in providing educational opportunities that respond to personal growth and employment needs and conclude with a quotation from Tierney (1998) saying: “Given where it stated, this gap is giant step toward customer focus. It is time to take the development to the next stage: caring for people it serves.”

43
TQM and Self-assessment
The use of self-assessment in higher education has been touched upon already in Section 1.1.3.
Some of the studies that have been published within this area are Ruben et al. (2000) and Grant et al. (2004), regarding the criteria for the Malcolm Baldrige National Quality Award, and Saraiva et al. (2003) and Hides et al. (2004), regarding the EFQM Excellence Model.
Lagrosen (1999) and Lundquist (1997) have, for instance, studied the application of the SIQ Model for Performance Excellence, i.e. the criteria of the Swedish Quality Award. Lagrosen (1997) describes quality work within four schools in the municipality of Älta19, that have used the criteria of the Swedish Quality Award in order to accomplish a self-assessment and Lund-quist (1997) made a study of quality work at some university departments in Sweden.
Lagrosen (1999) means that the main benefits of using the SIQ Model in the four schools studied were that a broader and more relevant view of the organization and its stakeholder was obtained, that the employees saw their activities from a new and wider angle, a better communication was obtained at all levels – internal as well external to parents and other stakeholders, an increased participation of the personnel and to certain extent by the parents and pupils as well was obtained, an enhanced co-operation between different departments was got, an improved leadership by the headmasters, and an increased ability to really implement actions.
Related to self-assessment is also the terminology used in different booklets with award criteria. Some authors discuss the concept of ‘customer’, as well as other TQM related terminology, and find it difficult to use in the educational environment. Examples are Wallace (1999), Scrabec (2000) and Bass et al. (1996). However, this discussion will be left to Chapter 8.
2.4 Self-Assessment and Organizational
Learning
Learning Organization
Garvin (1988) suggests the following definition of learning organization:
19 Älta is situated north of Stockholm.

44
“A learning organization is an organization skilled at creating, acquiring, andtransferring knowledge, and at modifying its behaviour to reflect new knowledge andinsights.”
This definition points at the importance of creating and acquiring new know-ledge, but also that this is not enough. The organization also has to apply the new knowledge to its own activities. Here a connection can be found to what has been said about self-assessment. It is not enough to accomplish the four phases of self-assessment. That work has to be followed by changes if learning is to take place and improvements are to be obtained.
According to Docherty (1996), one often-used description of the learning or-ganization is the dividing in three different forms of learning, suggested by Argyris & Schön (1978, 1996). The three forms are called ‘single-loop lear-ning’, ‘double-loop learning’, and ‘deuteron learning’. Single-loop learning refers to a person who learns to perform his or her tasks better by new know-ledge that is brought to the old knowledge. The learning called double-loop learning denotes a deeper reflection, which questions the established truths about how work is done today. The deuteron learning, finally, concerns work aimed at improving the learning itself.
Similar to the description of organizational learning by Argyris & Schön (1978, 1996), Swieringa & Wierdsma (1992) also use the concepts ‘single-loop learning’ and ‘double-loop learning’, when they describe learning processes. However, Swieringa & Wierdsma (1992) use these words with a somewhat different meaning. With organizational learning they mean “the change of organizational behaviour”, an organization can only learn if its individual members learn. At the same time, they say that individual learning is not a sufficient condition for organizational learning. Organizational learning requires that change in behaviour of one individual employee has effect on the behaviour of other employees. Thus, Swieringa & Wierdsma (1992) separate learning into individual and collective learning, where the latter can be structured in the three different levels: ‘single-loop learning’, ‘double-loop learning’, and ‘triple-loop learning’.
Single-loop learning as described by Swieringa & Wierdsma (1992) means changes in behaviour and rules within the existing insights and principles. For single-loop learning “how”-questions are formulated. The learning level in single-loop is obligation and permission, and the result of learning is ‘improvement’.
Double-loop learning means a deeper learning, and requires a higher level of insight. The double-loop is characterised by the ‘why’-questions that are asked. Here, the “why” asks about why the rules are stated and what the rules pre-

45
scribe and permit. The learning level here consists of knowledge and understanding, and the learning result is ‘renewal’.
A discussion of essential principles on which an organization is founded, can be seen as ‘triple-loop learning’. These principles can, for instance, be about which position the organization wishes to adopt in the outside world or which role it aims to fulfil. In this case, “why”-questions are asked as well, but “at the level of collective will and being”. This level of learning can be characterised by ‘courage & will’ and the result is by Swieringa & Wierdsma (1992) called ‘development’.
The two models by Argyris & Schön (1996) and Swieringa & Wierdsma (1992) show different examples of asking questions about activities and foundations in an organization, which might be seen as reflection, see Figure 2.19. Docherty (1996) describes reflection as “critical testing of formed conceptions and made assumptions about the reality”. Here the goals for different activities have to be scrutinised as well. It is of importance that unspoken assumptions will be expressed by reflection.
PrinciplesPrinciples BehaviourBehaviourRulesRulesInsightsInsights
Correction of individual learning
ResultsResults
Single-loop
Double-loop
Triple-loop
Collective learning loops
Figure 2.19 The ideas behind the concepts of single-loop learning, double-loop learning and triple-loop learning as described by Swieringa & Wierdsma (1992).
According to Docherty (1996), learning activities in organizations will be changed from a situation where learning has been just about finding new ways to perform activities, to embrace learning of new mental models and values, too. Docherty (1996) declares that these models will lead to involvement of broad groups of employees, where they get deeper understanding and a comprehensive view of their own organization and about what the customers of the organization appreciate.

46
Self-assessment and Learning organization
There are similarities between the TQM system as a whole and organizational learning. This has been discussed by, for instance, Garvin (1993), who has found clear connections between systematic quality work and work with organizational learning.
Furthermore, there are also similarities between the self-assessment methodology and organizational learning. This has been described by, for instance, Hellsten & Sandvik Wiklund (1999), who say that self-assessment used to support organizational learning has shown promising results.
Balbastre et al. (2003) discusses self-assessment and organizational learning and presents a model that, among other things, explicitly recognizes the importance of group level as a link between individual and organizational learning. This has an immediate application to self-assessment using approach, where groups are involved in data collection as well as data analysis. They argue, by studying three cases of self-assessment applications, that the more mature in TQM the organization is, the higher the single-loop or incremental component of the learning resulting from the self-assessment application. When the maturity is low, self-assessment will tend to foster, to greater extent, the establishment of new management systems and mechanisms, which implies a greater importance of double-loop learning. They also remark that only a decentralized application of self-assessment may take organizational learning possible.
They also emphasize that the award process with team work during the assessment of the document and the consensus meetings in the analysis creates a close connection between self-assessment and organizational learning.
2.5 The Swedish School System
The Swedish education system can be described as consisting of four different levels, completed with adult education. This is illustrated in Figure 2.20. The four main levels are pre-school education, compulsory school, upper secondary school, and, finally, university and other post-upper secondary education. Besides this general description, there are also other types of schools and educations existing, mentioned below. When sometimes talking about the educational sector in this thesis we refer to those levels included in Figure 2.20.

47
University & other post
upper secondary education
University & other post
upper secondary education
Pre-School EducationPre-School Education
Upper Secondary SchoolUpper Secondary School
Compulsory SchoolCompulsory School
Adult
Education
&
Adult
Education
initiative
Adult
Education
&
Adult
Education
initiative
W
o
r
k
i
n
g
l
i
f
e
Figure 2.20 The main levels in the Swedish education system. The information used in this figure is taken from webbsite of The Swedish National Agency for Education (‘Skolverket’) in May 2004.
The Two First Levels
According to the Swedish National Agency for Education (2004), the Swedish public school system is made up of compulsory and non-compulsory schools. The compulsory school includes regular compulsory school, Sami school, special school, and programs for pupils with learning disabilities.
Compulsory school program embraces nine years for all children between the ages of 7–16 years according to the Swedish National Agency for Education (2004b). Upon request of their parents, a child may begin school one year earlier, at the age of 6. Sami children can receive education in Sami Schools that covers grades 1–6. This schooling corresponds to the first 6 years of compulsory school. Special schools offer a 10-year program for the deaf and hearing-impaired pupils.
Non-compulsory schooling includes the preschool class, upper secondary school, upper secondary school for pupils with learning disabilities, municipal adult education, and adult education for adults with learning disabilities.
When speaking about different forms of responsible organizations, the Swedish National Agency for Education (2004) stated that most pupils at the compulsory school level attend a municipal school close to their home, but it is also possible to choose another municipal school or a privately or independently run school. In 2001, about 4% of compulsory school pupils

48
attend independent schools, which are open to everyone. This type of educa-tion is paid by the municipality in which the pupil resides as pupil/per year grant. The education of independent schools must be approved by the National Agency for Education and shall have the same basic objectives as municipal schools, but may have a profile that distinguishes from the municipal school.
The Swedish National Agency for Education (2004a) calls attention to the fact that independent schools above the compulsory school level might either correspond to municipal upper secondary or offer supplementary programs. The former offer upper secondary programs and receive municipal grants. Among the latter, schools with, for example, programmes in fine arts and handicrafts occur. There are also a number of international schools existing in Sweden that receive partial government funding, primarily intended for the children of foreign nationalities, whose stay in Sweden is temporary. Additionally, there are also folk high-schools existing.
University and Other Post-secondary Education
According to the Swedish National Agency for Education (2004), about 38 % of the pupils in 2001 continued to studies at the postsecondary level after their studies at the upper secondary level. Universities and institutions of higher education offer students specific programs or individual courses of study. Most of the Swedish universities and post-secondary institutions are state-run.
In 1996, the Swedish government launched Advanced Educational Education, AVE (‘Kvalificerad Yrkesutbildning, KY’) as a new form of post-secondary education (see www.ky.gov.se) and the education programmes were developed in close co-operation between enterprises and various course providers. The aim of AVE was to meet national requirements for a higher educational level and versatile competence of the workforce. The course providers, the AVE organizations, have during the pilot project been universities, upper secondary schools, municipal adult education and companies, private or public owned.The length of the courses ranged from 40 points up to 120 points, where one point is the equivalent of one-week’s full-time study.
Adult Education
According to the Swedish National Agency for Education (2004), adult education might be provided through municipally run adult education (‘Komvux’), or in adult education for adults with learning disabilities (‘Särvux’).
These forms of adult education in Sweden were established in order to provide education to adults that lack of knowledge at the compulsory or the
49
upper secondary school level. Another form of education within ‘Komvux’ is supplementary education to give vocational training.
In 1997, a five-year programme in adult education and training called The Adult Education Initiative, AEI, (‘Kunskaplyftet’) was initiated by the Swedish government. Primarily, the main target-group was unemployed adults with need to increase their knowledge at upper secondary school level, giving participants’ job-related skills and to increase their employability.

50
Chapter 3
Research Strategy and Methodology
his chapter describes briefly some available research methodologies and the methodology, on a overwhelming level, that has been chosen and used to
accomplish the research about self-assessment in educational organizations. Since the research described in this thesis to a large extent is based on three different self-assessment projects, the methodology on project level is presented in connection to the description of the particular project and can be found within Chapter 4-6.
3.1 Introduction of the Research
The mission of research is to generate new knowledge. As a researcher one gains knowledge during the path of reading, discussing and investigating. The research and how it is conducted, is influenced by the researcher’s epistemological standpoint. The different theoretical paradigms and perspectives of research, which the researcher believes in shapes how the researcher looks at the world and acts in it (Denzin & Lincoln, 1994). However, the choice of research approach is not only dependent on the researcher’s epistemological position, but should also be influenced by the research questions we set out to illuminate (Holme & Solvang, 1991; Yin, 1994).
3.1.1 The Author’s Background
Before the description of the research methodology in this thesis, it is important to describe the background of the author. As Bjereld et al. (1999) state, all research is conducted on the basis of a determined pre-understanding of paradigms and theoretical conceptions about what is important, interesting and relevant. So, to some extent, the pre-understanding of the author of this thesis has certainly influenced the accomplishment of the research, even though different steps have been taken in order to reduce the impact.
T

51
The author has studied TQM within the pre-doctoral studies as a final part of a master education in business administration and thereafter within the doctoral studies, both connected to the Division of Quality & Environmental Management at Luleå University of Technology. More specifically, the author has in this way got experience from self-assessment and use of quality award criteria. Firstly, the Swedish Quality Award criteria were studied within the pre-doctoral studies, and applied on a Swedish manufacturing company. Secondly, the author has evaluated the use of the TQM-based self-assessment tool Springboard among four Swedish organizations, of which one worked within the public sector; see Svensson & Ögren (1997). Thirdly, the author has got education in using the criteria of the Swedish Quality Award, and has also worked as a secretary within a national examination team of that award. Fourthly, early during the research period the author of this thesis participated in the EFQM Summer School, where work with the EFQM Excellence Model was included.
3.2 Research Methodologies
There are many ways to accomplish research, and several contrasting perspec-tives and traditions in the field of research methodology, see, for example, Bell (1993) and Blaxter et al. (1996). The term ‘methodology’20 refers here to the way in which problems are worked up and answers are searched for, according to Taylor & Bogdan (1994). Here we briefly mention a number of scientific choices when choosing research strategy.
3.2.1 Descriptive, Exploratory and Explanatory Research
Dane (1990) claims that the immediate goals of research, namely exploration, description, prediction, explanation and action, provide us with a strategy for figuring out which questions to ask and which answers to seek.
This thesis has a focus on studying how TQM values, methodologies and tools suite the educational sector. In particular the methodology of self-assessment is studied, and the TQM-based tool, which constitute the basis for the self-assessment. The aim can be said to have parts of exploratory, explanatory and descriptive character.
20 In this chapter, the meaning of the term “methodology” is somewhat different from the one presented in Chapter 2.

52
Descriptive Research
According to Dane (1990), descriptive research involves examining a phenomenon to define it more fully or to differentiate it from other phenomena. He further states that descriptive research involves attempts to define or measure a particular phenomenon, usually by attempting to estimate the strength or intensity of a behaviour, or the relationship between two behaviours. Phillips & Pugh (2000) argue that in descriptive research21 one tries to find the limits of previously proposed generalisations.
Explanatory Research
Marshall & Rossman (1999) state that explanatory studies try to explain patterns related to the studied phenomenon and to show relationships between events and the meaning of these events. Yin (1994) notes that in explanatory studies, questions deal with operational links needed to be traced over time.
Exploratory Research
Marshall & Rossman (1999) mean that exploratory studies try to build descriptions of complex circumstances or phenomenon that are unexplored in the literature. Zikmund (2000) states that explorative studies are often performed in order to clarify the nature of vague problems.
3.2.2 Induction, Deduction and Abduction
Empiricism and rationalism are two scientific perspectives often considered in methodological discussions, usually by relating to the principally separate approaches of induction and deduction.
The fundamental idea of induction is the generation of general conclusions from the specific case (Molander, 1998). Induction refers to generation of general conclusions from different phenomena in reality, experienced by use of any of the five senses. Wiedersheim-Paul & Eriksson (1992) present the following definition of induction: “from separate phenomena in reality we derive general statements”. Accordingly, induction starts with studies of reality and ends up in new theory.
Deduction states the explanation of a specific case from a general rule. Deduction starts with theory and ends up in reality, where the theories will be tested. Deduction can be described in the following way: “from theory we form
21 Phillips & Pugh (2000) use the term “testing-out research” for “descriptive research”. However, the meanings of these two terms are similar.

53
hypotheses, which are testable statements about reality. Through logical conclusion we derive the result”, according to Wiedersheim-Paul & Eriksson (1992).
Figure 3.1 shows graphically the view by Wiedersheim-Paul & Eriksson (1992) about inductive and deductive research. Use of these two approaches individually can accordingly be seen as moving half way round in a circle (Wiedersheim-Paul & Eriksson, 1991).
Theory(model)
Hypotheses
Observations
Generalisation
Reality(measuring &interpretation)
Observations
Deductiveprojection
Inductiveprojection
Figur 3.1 The principles of induction and deduction. From Wiedersheim-Paul & Eriksson (1992).
According to Alvesson & Sköldberg (1994), abduction is an approach used in many studies today. With abduction a case is interpreted with a kind of overarching hypothetical pattern. The interpretation is corroborated with new observations. In this way abduction can be interpreted as a combination of induction and deduction. During the process, the empirical application is developed, and the theory adjusted. Abduction departs from empirical facts, just like induction, but does not dismiss a conceptual framework and is closer to deduction. The analysis of the empirical work can very well be combined with literature studies of earlier theories to give understanding (Alvesson & Sköldberg, 1994).
In this thesis an approach is used, which have both inductive and deductive parts, and accordingly similarities to abduction. Based on the author’s pre-knowledge, the self-assessment process used in the first case study is planned as well as the design of the tool used within that process. The results obtained from the process is then used to, together with new theory, revise the process and the tool to the second case study. That idea is then repeated once again, as discussed in Section 3.4.

54
3.2.3 Quantitative and Qualitative Research
Two major categories of research methods are the quantitative and qualitative methods. According to Merriam (1988), information brought by words is qualitative, while information brought by numbers is considered quantitative.
Qualitative research implies an emphasis on the qualities of entities, and on processes and meanings that are not experimentally examined or measured (if measured at all) in terms of quantity, amount, intensity, or frequency. In contrast, quantitative studies emphasise the measurement and analysis of causal relationships between variables, not processes; see Denzin & Lincoln (2000).
During qualitative research, the author is interested in the meaning and understanding of a phenomenon; see e.g. Merriam (1988) and Gummesson (1991). This approach is to some extent in accordance with Taylor & Bogdan (1984), who characterise a good qualitative study as the combination of in-depth understanding of the particular setting investigated with general theoretical insights. Qualitative research means to study things in their natural settings (Denzin & Lincoln, 2000) and is commonly used in human and social sciences, where there is a need of nearness to the subject studied. It is used to understand a particular situation for an individual, group or organization (Holme & Solvang, 1991; Yin, 1994). According to Gummesson (1991), the strength of qualitative methods is their ability to reveal a broad picture, which makes it possible to understand social processes and their context.
In this thesis both qualitative and quantitative elements exist, without arguing that one is better than the other. Data is gathered with interviews, which are analysed with a qualitative approach, and questionnaires, with both qualitative and quantitative elements. This approach is in agreement with Holme & Solvang (1991), who argue that there are many benefits to be gained by combining qualitative and quantitative methods. In specific, a qualitative study can be a follow-up activity of a quantitative study, and a qualitative study can serve as a preparatory study prior to a quantitative study. Allwood (1999) also maintains that the distinction between quantitative and qualitative methods is not appropriate, because research methods in general consist of both qualitative and quantitative elements.
3.2.4 Action Research
Action research, introduced by the social scientist Kurt Lewin in 1946, has at times been claimed to be the only way of producing useful knowledge, but it has also been criticized of being unscientific, Grønhaug & Olson (1999).

55
Action research is seen as a research methodology that aims to contribute both to practical concerns and to scientific knowledge; Rapoport (1970).
Action research could be described as rigorous, empirical, engaging people, and resulting in some practical outcome related to the lives or work of the participants; Stringer (1999). One problem is that it is not always simple to balance the different roles, as member of the project group, as educator in the studied organizations, and as scientist. Gummesson (1985) discusses the consultant as action researcher and states that there are three interested parties to balance between: the project sponsor, the researcher/consultant and the scientific society.
Drawbacks of action research are that it is time consuming and costly, and that there are a number of factors that affect the results, but that cannot be affected by the researcher; Wallén (1996). Using action research in the ordinary work of the employee-researcher could be assumed to be on the condition that the actions proposed can be justified for the host organization in practical terms. This puts pressure on the theory being practical enough, which could limit the opportunities of application or make it too much of problem solving and too little of research.
In spite of the drawbacks there are also advantages, especially with the access that action research provides and which could be an important issue in increasing the credibility of case studies, Gummesson (1995). Action research also creates possibility for a deep understanding of the phenomenon of interest. There is also a continuous reality check for the usability of the theory. The approach to overcome these problems is to assure sufficient time for reflection in the role as researcher and to constantly improve the usability of the proposed theory as an employee. It is a challenge to keep the two roles apart without doing anything ethically wrong while still being loyal to what is knowledge; Wallén (1996).
The author has been involved in different roles in all the three self-assessment projects described in this thesis. He has been part of the project group, been teacher and contributed with education within the studies organizations involved in the projects and, at the same time, the scientist, who has studied the output and the effects from the project.
56
3.3 Case Study Designs
Case study is one way of performing social science research. Other ways are experiments, surveys, histories, and the analysis of archival information. Each strategy has advantages and disadvantages, mainly depending upon three conditions: (a) the type of research question, (b) the control an investigator has over actual behavioural events, and (c) the focus on contemporary as opposed to historical phenomena; see Yin (1994).
A case study can be considered as an intensive and holistic description and an analysis of a restricted phenomenon (Merriam, 1998). A case study methodology is suitable when the aim is to better understand complex social phenomena and is an empirical inquiry that investigates a contemporary phenomenon within its real-life context. The methodology is especially useful when the boundaries between phenomenon and context are not clearly evident (Yin, 1994) and when the focus is on the process rather than the result, on the context rather than specific variables, and on discoveries instead of proving casual connections (Merriam, 1998).
One important application of case study methodology is when we want to explore situations in which the intervention being evaluated has no clear, single set of outcomes. A second application is to describe an intervention and the real-life context in which it occurred. The case study strategy may also be used to explain the casual links in real-life interventions that are too complex for survey or experimental strategies (Yin, 1994). Accordingly, a case study can be used for exploratory, descriptive or explanatory purposes.
There is also methodological criticism against the case study methodology. Yin (1994) states that within the academic community, researchers, who reject case study do so mainly referring to the method’s lack of rigour and the difficulties for scientific generalisation. Another suggested deficit of the case study methodology is that it is considered to be very time consuming and generates massive amount of data, which often is not being used; see Hamel et al. (1993); Simons (1996).
In general, a case study methodology is preferred when the investigator has little control over events, and when the focus is on a contemporary phenomenon within some real-life context. For example, a case study is suitable when studying how or why a programme or methodology has worked or not. Therefore, the case study approach is very useful when studying implementation processes, managerial processes, and organizational changes.

57
Based on the reasoning above, a case study methodology was considered to be the most suitable research strategy answering the research questions in Section 1.3. The strategy chosen is also in accordance with the recommendations made by Yin (1994), who recommends the use of case studies when you want to know ‘how’ or ‘why’ a certain implementation or phenomenon has worked or not, with a focus on managerial aspects.
Single-case versus Multiple-case Designs
A primary distinction when designing case studies is between single-case and multiple-case designs. Both designs can further on be classified as holistic or embedded designs, depending on the defined ‘unit of analysis’ (Yin, 1994).
The single-case approach is suitable when the aim is to study whether a theory’s propositions are in accordance with practice or whether some alternative set of explanations might be more relevant. Other rationales for a single case methodology are when the case represents a rare or unique case, or when the investigator has an opportunity to observe and analyse a phenomenon previously inaccessible to scientific investigation (Yin, 1994).
In a multiple-case study, one goal is to build a general explanation that fits each of the individual cases in the study, even though the cases will vary according to different characteristics. With a multiple-case study, there is better potential for greater explanatory power and better possibilities for generalisations than by using a single-case study. In a way the cases should serve a purpose similar to that of multiple experiments (Miles & Huberman, 1984).
When only one unit of analysis is studied, the case study is considered to be holistic (Yin, 1994). However, the same case study may involve more than one unit of analysis. This occurs when attention also is given to different subunits. The design used will then be called an embedded case study design. However, relevant field contacts depend upon an understanding of what is being studied, where theory building is used to define the case and its unit of analysis (Yin, 1994).
Extensive literature study, followed by an in-depth case study, is an appropriate approach when studying managerial processes since the boundaries between the phenomenon and its context are often not evident (Yin, 1994).
Based on these arguments a case study approach was chosen. In the thesis three multiple-case studies are presented and discussed. They are presented briefly in Section 3.4 and discussed in more details in Chapters 4-6. The unit of analysis is in all cases the ‘TQM-based self-assessment process’. However,

58
there are also subunits included, as the TQM-based tool, which is the basis of the self-assessment procedure, and the TQM values, constituting in the TQM culture, on which the self-assessment also is based.
3.4 Research Design
The research design describes a set of guidelines that connects theoretical paradigms to strategies of inquiry and methods for collecting empirical material; see Denzin & Lincoln (1994). According to Yin (1994), a research design is an action plan for ‘getting from here to there’. Yin (1994) describes research design as the logic that links the data to be collected and the conclusions to be drawn to the initial questions of the study, i.e. an action plan that describes the steps from an initial set of questions to the answers of them.
The research design that is the background for this thesis is built on three multiple-case embedded studies performed sequentially. This means that the research journey can be illustrated as three laps on the PDSA-cyle (‘Plan-Do-Study-Act’); see Figure 3.3. In parallel with the case studies, literature studies have been performed to get new input to the next lap.
3.4.1 An overview
Already from the beginning of the research described in this thesis, it was clear that the usage of TQM in educational organizations was questioned by different people; see Section 2.3. The work within the three projects described in Chapters 4-6, combined with parallel literature studies, have then streng-thened this view to some extent. Therefore, the need to take a step out of the field of TQM and leave the practical usage of TQM, in order to elucidate and discuss different aspects of TQM became apparent during the research journey.
Therefore, in a way, the research in this thesis can be described, as Figure 3.2 shows, as consisting of two steps, first one within the TQM-field, and then another one from outside TQM, with assistance from criticism of TQM and supplementing theory.

59
The TQM field
Criticism of TQMCriticism of TQM
1. Study of the usage of TQM:
described in the Chapters 4, 5, 6 & 7
2. Study of TQM-criticism TQM &
empirical findings:
described in the Chapters 8 & 9
Figure 3.2 The research design described in this thesis can be looked upon as consisting of two different steps. Firstly, TQM-based self-assessment was studied within three different projects, designed as multi-case studies. Secondly, some criticism against TQM is studied, discussed and compared to the project results.
3.4.2 The Three Case Studies
Here the three self-assessment projects are briefly described. More details are presented in Chapter 4-6.
The AVE-project
During the years 1997 to 1999 the author had the opportunity to take part in a comprehensive project with the aim to evaluate the pilot period of Swedish Advanced Vocational Education, AVE (‘Kvalificerad Yrkesutbildning’, KY); see Chapter 4. During this pilot period the AVE-organizations were ordered by the authorities to perform some sort of self-evaluation. This gave an opportunity to let the AVE-organizations assess their own business and at the same time test a TQM-based tool for self-assessment that, to some extent, was directed to such organizations. This study embraced more than 100 edu-cational organizations, of which most were public. This gave an extra-ordinary possibility to explore the usefulness of TQM-based self-assessment based on the experiences from the AVE-organizations.
The AEI-project
The Adult Educational Initiative, AEI, (‘Kunskapslyftet’) was an investment during five years launched by the Swedish government in 199722. During 1999
22 During the period 1997-2002 about 1 million adult people, on part time or full time basis, got financial support to increase their education to an upper secondary school level. The cost of the

60
the Swedish Association of Local Authorities (‘Svenska Kommunförbundet’) was interested to introduce TQM-based self-assessment as a support in the improvement work within the Adult Educational Initiative. To complement the studies of the AVE organizations, a new research assignment, the AEI-project, was initiated, see Chapter 5. This second project was not in the original research plan, but was added along the way, as it was an opportunity to further study self-assessment in an educational environment and to develop the assessment tool used in the AVE-organizations. In contrast to the AVE-project, the AEI-project was not part of any larger research project.
The USS-project
Early in 2001 discussions were held between representatives from the Upper Secondary School in Luleå and Luleå University of Technology about a school development project. This project, described in Chapter 6, was aimed to support quality work within the upper secondary school organization in Luleå municipality. As one part of the project, self-assessment was thought to be a suitable way for the school organization to carry out the development work and stimulate a quality culture. This interest in accomplishing self-assessment by use of a TQM-based tool implied a possibility to gather more experience about self-assessment within educational organizations.
The Self-assessment Process within the Projects
The self-assessment process was in all three cases chosen to be similar as the quality award process, described in Section 2.7. The main reasons for choosing the award process in the different research projects are as follows.
The first self-assessment project, related to the AVE-evaluation, was part of a large national evaluation of the AVE pilot period. To get sufficient information, the assessment process was judged to be fairly comprehensive. The AEI-project can be seen as a follower to the AVE-project with one of the aims to further develop the process and the tool used within the first project. The reason for the choice in the third project, the USS-project, is mainly that at the start of the project it seemed to be a clear desire among the headmasters to perform a fairly comprehensive self-assessment with all the staff involved and give opportunities to compare an learn between the different participating units within the upper secondary school in the municipality.
investment was about 42 billion SEK, of which 19 billion was given as support to communities and the rest was financial support to those following the courses and programmes. (www.svd.se/dynamiskt/inrikes/did_7917337.asp)

61
3.4.3 The Research Strategy as a Learning Process
Kolb (1984) has developed a learning model consisting of the four steps reflective observation, abstract conceptualisation, active experimentation, and concrete experience. Another example of a model for systematic knowledge creation is the PDSA-cycle. The PDSA-cycle was used by Hellsten (1997a) to describe her research, with reference to Shewhart (1939). Shewhart compared the three steps of suggesting a hypothesis, carrying out an experiment, and tes-ting the hypothesis with the three parts specification, production, and inspection within a process, and asserted that these two sets of steps corres-pond to each other. This description by Shewhart is the background to the la-ter PDSA-model presented by Deming (1986, 1994). Deming got the idea from Shewhart and also called the PDSA-model “the Shewhart-cycle”.
Even though this thesis is not using the concept of hermeneutical approach, it might be useful to refer here to the hermeneutical spiral model (Wiedersheim-Paul & Eriksson, 1991). This model might describe both the research performed in this thesis and the development of the self-assessment tool, which is vital in this thesis The hermeneutical spiral can in this thesis be described as three laps with three steps each, where the steps in the first lap are: pre-knowledge, dialogue, and interpretation. The second lap starts with the step new knowledge, which has been gained during the first lap, followed by dialogue and interpretation.
The research activities related to self-assessment, described in this thesis, can be seen as a spiral consisting of studies that give new knowledge, which are used to improve the self-assessment process, the self-assessment tool, and the next research project. The main part of the research in this thesis can be characterised as going through the PDSA-cycle three laps, since three projects have been included, see Figure 3.3.
The author’s pre-knowledge consisted of courses about TQM and TQM-based self-assessment at both undergraduate and post graduate level, as described in Section 3.1.1.

62
Previous
knowledge
The AEI-project
The AVE-project
Further
research
Plan
Plan
Do
Do
Study
Study
Act
Act
Plan
Do
Study
ActThe USS-project
TQM-theory
The research projects Study of methodologies & tools The research strategy
’Läroverket 1999’
’Lärostegen’
’LäroverketAVE-version’
Self-assessment
Self-assessment
Self-assessment
Figure 3.3 The figure illustrates the research on self-assessment described in this thesis can be illustrated as three laps around the PDCA-cycle.
3.5 Validity and Reliability
Four tests are commonly used to establish the quality of empirical social science research. These are: construct validity, internal validity, external validity and reliability. How these issues are treated decides the quality and credibility of the study; see Yin (1994).
3.5.1 Validity
Construct Validity
Dane (1990) argues that construct validity involves determining the extent to which a measure represents the concepts that it should represent and does not represent the concepts that it should not represent. Moreover, construct validity deals with establishing correct operational measurements for the concept being studied, see Yin (1994).
63
In the case of the present thesis, earlier studies on TQM work in general, but in the educational sector in particular, was used as input when deciding how the self-assessment process should be designed and also when designing the tools used in the different projects.
It is important for the researcher with a case study approach to describe the studied phenomena as correctly as possible. That implies that the researcher’s comprehension and interpretation of the studied phenomena should be in accordance with the real phenomenon. According to Merriam (1988), construct validity is increased by the use of multiple sources of information such as questionnaires, interviews, literature reviews and observations used in a complementary way, together making up a so called triangular approach. The author has tried to follow these advices as much as possible. Some actions are described below.
Internal Validity
Internal validity deals with establishing causal relations between factors, see Yin (1994). Herzog (1996) states that internal validity refers to the validity of inferences about cause based on research findings. Internal validity is only a concern for explanatory case studies, where causal relationships between variables are studied. In exploratory and descriptive studies, where the causal relationships are not considered, the internal validity is not applicable (Yin, 1994).
Moreover, the author of this thesis tried to use different ways to collect similar data, and it that way obtain a form of triangulation. For instance, during the AVE-project comments during different meetings were written down, and in the USS-project interviews were added to questionnaires.
During all work with the thesis, the project design, as well as design of questionnaires and the thesis itself was discussed with colleagues of the author, who also commented on different occasions on the work and the research design in order to increase construct validity.
Moreover, as an incentive to construct validity in the study, all the questionnaires and other ways to gather data were reviewed in different ways in order to improve the structure and the questions that were going to be asked, and correct possibilities of misinterpretation and other flaws. Besides internal reviews within the research group and with colleagues at the university external reviews were utilized in several cases. For instance, the questionnaire used in the AVE-project was reviewed by people active within AVE.
Moreover, during the completion of the projects different forms of reference groups were formed, which continuously made comments and helped the

64
author to improve the design of the study. During the AVE-project the research group in the overall AVE-evaluation (see Section 4.1) acted as a reference group and during the AEI-project meetings were held regularly with representatives from the Commission for Adult Education and Training (‘Kunskapslyftskommittén’), the Swedish National Agency for Education (‘Skoverket’) and the Swedish Association of Local Authorities (‘Svenska Kommunförbundet’). Within the USS-project, the managerial group, with headmasters and municipality head of the upper secondary school, acted as a form of reference group.
Moreover, pattern matching was used in the analysis of data, in particular data from the USS-project, in order to try to increase the internal validity; see Yin (1994).
External Validity
External validity refers to the validity of inferences about the generality of the research findings, according to Herzog (1996). The external validity for case studies deals with analytical generalisations. This means that some of the results of the case study are generalised to some broader theory (Yin, 1994).
The analytic generalisation demands that the theory is tested through replications of the findings in other cases, where the theory has stated that the same thing will occur. This logic of replication is the same as for experiments, where the scientist can generalise from one experiment to another (Yin, 1994). This is partly obtained by using multiple-case studies.
In the AVE-project the non-response is fairly low and is not judged to be any problem. The same holds in the AEI-project. In the USS-project, however, there are some problems, which may influence the validity. One is that data from one of the units disappeared in the first questionnaire, probably due to transportation problems. Regarding the last questionnaire in the USS-project there was a balance between getting information as soon as possible and the problem that a vacation law in front of the data gathering process. That, together with a fairly low interest at that time to participate, resulted in a fairly low response rate. The author’s opinion is, in spite of that, the results from the USS-project, which to a large extent is in agreement with indications from the other two projects and literature is judged as generalizable.
3.5.2 Reliability
Bell (1993) states that the reliability of an investigation is satisfying if another researcher can conduct the same research and draw the same conclusions. Or in other words, if the data collection procedures can be repeated with the same
65
result, see Yin (1994). It might be valuable to compare reliability with precision.
The author has also tried to write the thesis in such a way that transparency and inter-subjectivity are achieved. For instance, the different projects and the case studies performed within the projects are described as thorough as possible.
The description over how the data material was gathered and analysed also ensures the reliability in the study. Finally, most of the empirical material, i.e. transcribed interviews and comments and answers from the questionnaires, were compiled in different ways. All interviews are also taped. For the AVE-project, most of the material can be found in SOU (1999), in the AEI-project much material is to found in Fredriksson & Svensson (2000) and for the USS-project we refer to Svensson & Klefsjö (20004).
One precondition for high reliability is that the data collection procedures are described carefully. Therefore, the case studies and the methods used in these studies were described carefully in Chapter 4-6.

66

Part II
Experiences from Three Projects


67
Chapter 4
The AVE-project his chapter describes the setting of the AVE-project and gives a base for the following two chapters. The acronym AVE stands for ‘Advanced Vocational Education’ and the AVE-project stands for self-assessment
work in AVE-organizations. Firstly, the background of the AVE pilot project, including its governmental frames, is described. Secondly, the ‘overall AVE project’, containing evaluation of the AVE pilot project, is briefly presented, and thirdly the use of self-assessment within the AVE-project is presented and examined.
4.1 Description of the Overall AVE-project
4.1.1 Background to AVE
As described in Chapter 3 use of self-assessment in AVE-organizations was chosen as a study object. The shortening AVE means ‘Advanced Vocational Education’ (in Swedish: ‘Kvalificerad Yrkesutbildning’, abbreviated ‘KY’). The use of self-assessment was connected to a large evaluation project comprising a Swedish pilot project with Advanced Vocational Education1.
In 1996, the Swedish government launched AVE as a new form of post-secondary education (see www.ky.gov.se). The education programmes within AVE were developed in close co-operation between the various course providers and different enterprises. The aim of AVE was to meet national requirements for a higher educational level and versatile competence of the workforce. The programme providers, here called the AVE-organizations, have during the pilot project been universities, upper secondary schools, municipal adult education and companies, privately or publicly owned. The length of the programmes ranged from 40 points up to 120 points, where one point is the equivalent of one week’s full-time study. The AVE-programmes were divided into 12 different areas, based upon in which branch the
1 This section is to a large extent based on information from SOU (1999) and www.ky.gov.se.
T
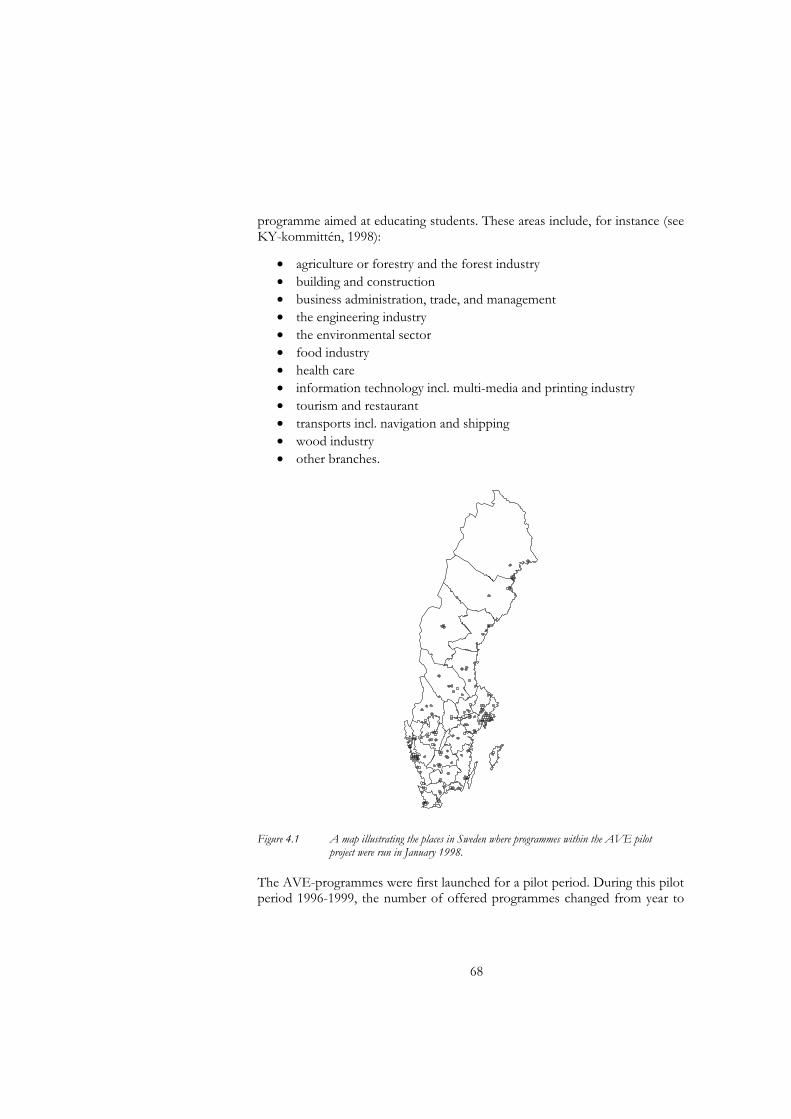
68
programme aimed at educating students. These areas include, for instance (see KY-kommittén, 1998):
• agriculture or forestry and the forest industry • building and construction • business administration, trade, and management • the engineering industry• the environmental sector • food industry • health care• information technology incl. multi-media and printing industry • tourism and restaurant • transports incl. navigation and shipping • wood industry • other branches.
Figure 4.1 A map illustrating the places in Sweden where programmes within the AVE pilot project were run in January 1998.
The AVE-programmes were first launched for a pilot period. During this pilot period 1996-1999, the number of offered programmes changed from year to

69
year since new programmes were granted gradually. At the end of the period the AVE activities comprised about 12,000 students, distributed over more than 200 different forms of education. The different programmes that were run during the pilot period, and their locations in Sweden, are illustrated in Figure 4.1.
The Swedish government appointed the AVE-commission (‘KY-kommittén’) to accomplish the AVE pilot project during the period 1996-1999. In the AVE-commission representatives from some political parties, labour-market organizations, municipalities and higher education institutes were included. To assist the operational work, the commission had a central office in Stockholm. The commission was, during the pilot period, responsible for monitoring and supervising activities, and for ensuring that an independent evaluation of the AVE pilot project was carried out.
The AVE programmes should combine a practical orientation with in-depth theoretical knowledge. Therefore, the students had to spend one third of their study time in active workplace learning and problem solving. An intention with AVE during the pilot period was that the courses should not be organised as a traditional trainee-ship period, but rather revolve around active workplace-based learning and problem solving in an overall educational con-text. During these periods, the students were honing “their analytical abilities, applying comprehensive and system approaches, and assuming responsibility” (translationfrom www.ky.gov.se). In order to make this work properly, advanced super-vision had to be available, and the workplaces themselves had to be organised in a way that facilitated learning. The AVE-commission emphasised interaction between theoretical and practical parts of the education. Active learning at workplaces was important both for course quality and to meet the needs of the employment market and the students. The workplace training required active participation of employers in designing the courses. Therefore, it was a requirement that the majority of the management group of each AVE-programme should consist of representatives from external organizations separate from the organiser.
According to the AVE-commission, the AVE should be post-secondary, in the sense that completed upper secondary education, or equivalent knowledge, was required for eligibility. The content of the courses was taken from upper secondary, supplementary and advanced courses, and courses in higher education. The AVE pilot project was aimed at combining a practical orien-tation with in-depth theoretical knowledge. The subjects that were intended to be emphasised, in addition to the vocational knowledge, were mathematics, natural sciences, computer technology and its uses, economics, society and culture, and, finally, language and communication. Furthermore, it was important for the AVE programmes to correspond to other crucial needs in

70
the employment market of the future, and to develop the students' social and personal skills. This included the students’ ability to speak, read, write and use information, ability to solve problems and think, critically and creatively, and, finally, the ability to negotiate and work in a team. Important factors when granting a programme were:
• the quality and quality assurance of the education• the education should help to break traditional gender-bound patterns
of educational and occupational choices and it should stimulate women's interest in occupations oriented towards the natural sciences and technology
• the education should correspond to needs in the employment market.
4.1.2 The AVE-evaluation
In 1997 a group of researchers at Luleå University of Technology was given the responsibility for carrying through an evaluation of the AVE pilot project. The research group consisted of people from the Division of Quality and Environmental Management2 and the Division of Industrial Work Environment. In the research group three professors, one senior lecturer, three post-graduate students and two research engineers were active during the evaluation work.
A basic idea by the research group was to use an evaluation model that would support improvement work during the AVE pilot period rather than using a traditional objective model based on checking the extent to which the goals were met when the project was finished. An evaluation model supporting improvement work could support organizational improvements and at the same time give the data needed for the external evaluation. This idea became a central part in the planning phase of the group’s AVE-evaluation.
Data Gathering Channels
In order to carry out the AVE-evaluation, the research group chose six different channels for data collection (Figure 4.2).
The principal way to support the improvement work among the AVE-orga-nizations, and at the same time take care of data for the evaluation work, was the use of self-assessment in the different educational organizations. All AVE-organizations were offered to participate in a self-assessment procedure, described below, led by the research group. That self-assessment was based on
2 At that time the name of the division was Division of Quality Technology & Statistics.

71
a particular tool ‘Läroverket-AVE-version’, developed as a part of the work to support preventive work and improvement work, see details in Section 4.3.
Site visits Self-assessments Statistical data
Student-questionnaires Other studiesInterviews
Evaluation of the AVE-pilot project
Figure 4.2 The research group used six different channels for data collection for the AVE-evaluation of the AVE pilot project. From Lindell & Svensson (2002).
The connection between the areas, which should be evaluated by the research group, and the questions in the self-assessment tool ‘Läroverket AVE-version’ that were aimed to gather relevant data is illustrated in Table 4.3 in Section 4.3.
In parallel with the self-assessment procedure, three student-questionnaireswere conducted; see Figure 4.2. The questionnaires were sent to the students at the beginning of their studies, in the middle of their studies, and after they had finished the AVE-programme, respectively. Each of these surveys was based on different sets of questions depending on the educational phase of the students; see Lindell & Svensson (2002), SOU 1999:119, and Johansson et al. (2000) for details and results. The data from the questionnaires was then compared with national educational statistics compiled by Statistics Sweden (‘Statistiska Centralbyrån’).
The research group also made site visits at 25 education providers. During these visits the school management, teachers, students, and persons from the managerial body and representatives of working life, which, according to the ordinance, had to be associated with all education, were interviewed.
Another channel for data collection was telephone interviews with a number of educational co-ordinators and representatives of organizations that had arranged advanced applications of theoretical knowledge at different work-places.

72
4.1.3 Epilogue to the AVE Pilot Project
Based on the experiences gained from different investigations, including the evaluation of the AVE pilot project by the research group, the AVE-commission drafted a proposal for how AVE-programmes could be organised in a permanent state in the future. The Swedish Parliament has then decided that AVE from the year 2002 should be established and included in the regular educational system in Sweden; see Figure 2.21. Background, experiences and results from AVE are discussed in the thesis Lindell (2004).
4.2 The Use of Self-assessment in AVE
Self-assessment was used as one important channel to collect data for the AVE-evaluation and to perform assessment of the organizations’ own work with quality issues. On a general level there might be several reasons for an organization to perform self-assessment, see Section 2.2.6. The most important reasons are perhaps the possibilities to find opportunities for im-provement and to stimulate the establishment of a strong quality culture.
In the AVE case, the AVE-organizations were ordered by the AVE-com-mission to carry out some form of ‘self-evaluation’. However, the choice of procedure for the ‘self-evaluation’ was up to the organizations. Participation in the self-assessment procedure offered by the research group using ‘Läroverket AVE-version’ was one way for the AVE-organizations to fulfil this demand.
4.2.1 Establishing Self-assessment among the AVE-organizations
The research group sent written information about their evaluation commis-sion, and about the possibility to use ‘Läroverket AVE-version’ as a help to fulfil the requirements of the AVE-commission. This information was sent partly as a formal letter, but also as a four-sided information folder.
During the autumn 1997 the AVE-commission gave information about the forthcoming evaluation. Some organizations had by then already started their own ‘self-evaluation’ procedure, or had at least begun planning for it. In the end of November 1997 the AVE-organisers were asked to preliminarily an-nounce if they were interested to participate in the self-assessment offered by the research group using ‘Läroverket AVE-version’ and thereby attend the education about how to use the tool. In early 1998 the AVE-organizations had to make a formal decision about their participation.

73
In November 1997, when the research group informed the organizations about the possibility to participate and use ‘Läroverket AVE-version’, there were 123 different programmes running, some of them by the same organiser. Of these 123 programmes, 98 chose to use ‘Läroverket AVE-version’, see Figure 4.3.
123One overview shouldbe written about each
AVE-programme
One overview shouldbe written about each
AVE-programme
Use of ´’Läroverket
AVE-version’?
Use of ´’Läroverket
AVE-version’?
Evaluation by use of other tool(s) than
’Läroverket’
Evaluation by use of other tool(s) than
’Läroverket’
Should send their detailed description to the research group
Should send their detailed description to the research group
Questionnaire about why ‘Läroverket AVE-version’was not used & what was
done instead
Questionnaire about why ‘Läroverket AVE-version’was not used & what was
done instead
Questionnaire about what have been done
Questionnaire about what have been done
Yes
25
Analysis of the
questionnaire
Analysis of the
questionnaire
Analysis of the
questionnaire
Analysis of the
questionnaire
70
17
24
75
23
No
98 Did they send their detailed
description?
Did they send their detailed
description?
Yes
No
No responseNo response5
No responseNo response6
No responseNo response1
Questionnaire about ‘Läroverket AVE-version’
Analysisof the ques-
tionnaire
Figure 4.3 Illustration of the different stages when using ‘Läroverket AVE-version’ in the AVE-pro-ject. At the time when the AVE-organizations were informed about the possibility to use ‘Läroverket AVE-version’, 123 education programmes were granted. All of them were invited to participate in the self-assessment procedure based on ‘Läroverket AVE-version’. Ofthe programmes, 98 answered that they would use ‘Läroverket AVE-version’, and the other 25 programmes answered that they would use some other form of self-assessment.
To get information on a number of issues also from those organisations that did not chose to use ‘Läroverket AVE-version’ for their self-assessment procedure, it was decided that all AVE-organizations should answer and submit the questions in the ‘Overview’3 according to ‘Läroverket AVE-version’. They should also answer a number of special questions in the questionnaire described in Section 4.6.
The whole research group participated in a meeting in Stockholm in Decem-ber 1997, where the forthcoming AVE-evaluation work was presented to the AVE-organisers. The organiser of that meeting was the Association for AVE-organisers4.
3 The ‘Overview’ is presented in Section 4.3.2 4 This association is an idealistic association for those who organize education programmes within AVE. The association has (August 2004) about 150 organizations over all Sweden. (www.kyforbundet.se)

74
4.2.2 Time Schedule for Self-assessment in AVE-organizations
The time schedule for the self-assessment procedure within the AVE-project is illustrated in Figure 4.4. The figure shows all main activities in the self-assessment work, both the educations offered to the AVE-organisers and the organization’s own work with self-assessment.
1998 1999
Mars April May June July Aug Sept Oct Nov Dec Jan Feb Mars April
T 1 Writing the ”overview”
Writing the detailed description
T 2 Analysis of the
description
Improvement work
Figure 4.4 Time schedule for the work with ‘Läroverket AVE-version’ for the participating AVE-organizations. The activity-charts named ‘T1’ and ‘T2’, respectively, refer to the two training courses offered by the research group, which are briefly described in Section 4.2.4. The other phases are closely related to the phases of the self-assessment process illustrated in Figure 3.9.
4.2.3 Training in TQM and Self-assessment
According to experiences from other research projects related to self-assess-ment at the Division of Quality and Environmental Management at Luleå University of Technology, and research by, for instance, Conti (2001) and Zink (1997), there is a need of training before self-assessment is performed and tools like ‘Läroverket AVE-version’ are used. In order to spread know-ledge about self-assessment in general and how to use ‘Läroverket AVE-version’ a number of training sessions were offered. These sessions were held all over Sweden, from Luleå in the North to Kristianstad in the South; see Figure 4.5.
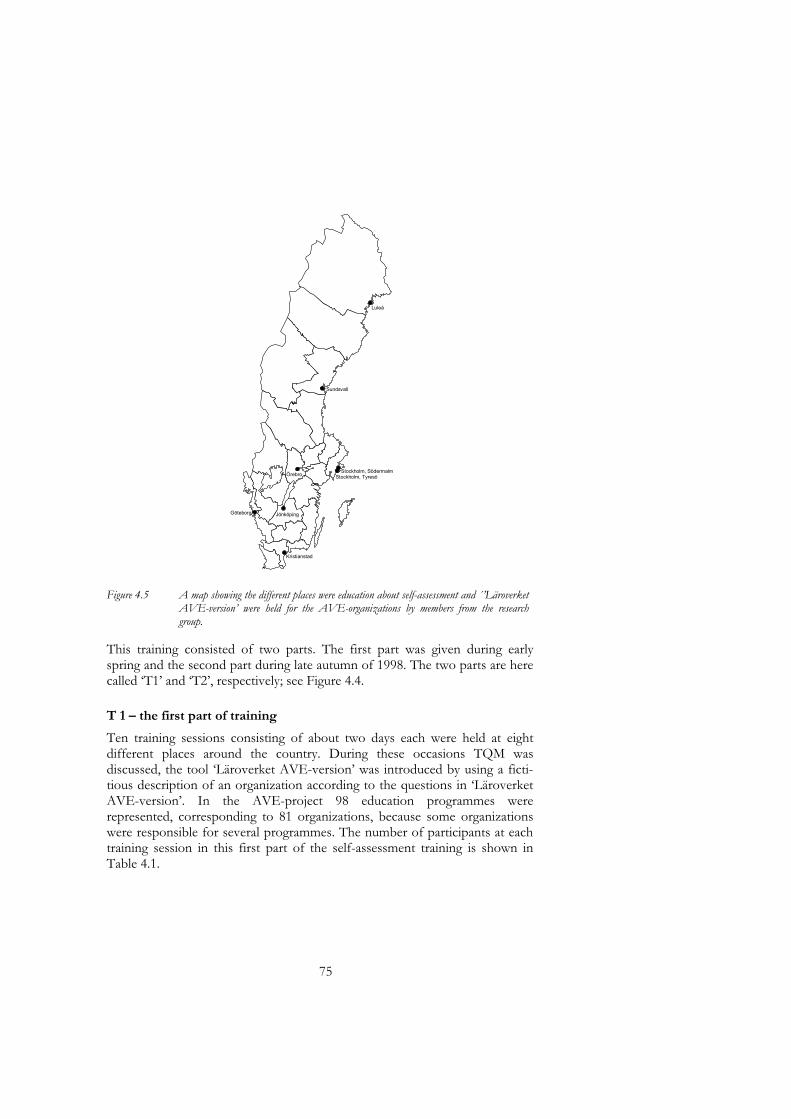
75
Kristianstad
Sundsvall
Luleå
Stockholm, Södermalm
Stockholm, Tyresö
Göteborg
Örebro
Jönköping
Figure 4.5 A map showing the different places were education about self-assessment and ´’Läroverket AVE-version’ were held for the AVE-organizations by members from the research group.
This training consisted of two parts. The first part was given during early spring and the second part during late autumn of 1998. The two parts are here called ‘T1’ and ‘T2’, respectively; see Figure 4.4.
T 1 – the first part of training
Ten training sessions consisting of about two days each were held at eight different places around the country. During these occasions TQM was discussed, the tool ‘Läroverket AVE-version’ was introduced by using a ficti-tious description of an organization according to the questions in ‘Läroverket AVE-version’. In the AVE-project 98 education programmes were represented, corresponding to 81 organizations, because some organizations were responsible for several programmes. The number of participants at each training session in this first part of the self-assessment training is shown in Table 4.1.

76
In particular, the first two phases ‘planning’ and ‘describing’ in the self-assessment methodology as described in Section 2.2.7, were discussed during T 1; see Figure 2.8.
Table 4.1 The number of participants at the different two-day sessions of the first training on self-assessment, called T 1. The focus of this first part of the education was on TQM in general, the tool ‘Läroverket AVE-version’, and how to describe an organization according to thequestions in ‘Läroverket AVE-version’.
Places for the training
sessions T 1 Date in
1998
Number of
participants
Number of
participatingorganizations
Number of
participatingprogrammes
Luleå 2-3 March 5 4 4 Sundsvall 5-6 March 7 4 5 Stockholm, Södermalm 10-11 March 20 15 17 Stockholm, Tyresö 12-13 March 12 8 8 Kristianstad 16-17 March 15 11 19 Stockholm, Tyresö 19-20 March 18 11 14 Örebro 25-26 March 19 9 15 Göteborg 30-31 March 24 15 22 Jönköping 1-2 April 25 14 19 Stockholm, Tyresö 27-28 May 13 9 12 Total 158 85* 124*
* Some of the organizations have been represented at more than one training session. Therefore, the value ”total” does not sum up the values in the columns above. The value “total” shows the total number of participating organizations and the total number of participating programmes respectively.
T 2 – the second part of training
During November and December 1998, eight training sessions comprising one day each were held at six different places in Sweden. At these sessions discussions about the self-assessment phases three and four ‘analysis’ and ‘plan for improvement’ in Figure 2.8 were held.

77
Table 4.2 The number of participants at the one-day training sessions on self-assessment, called ‘T 2’. The issues in focus at this second part of the education were how to analyse the description ofthe organization and how to establish an action plan.
Places for the training sessions T 2
Date in 1998
Number of participants
Number of participating
organizations
Number of participating
programmes
Luleå 12 Nov 4 3 3
Stockholm, Tyresö 17 Nov 15 11 14
Stockholm, Tyresö 18 Nov 11 8 9
Stockholm, Tyresö 25 Nov 11 9 9
Kristianstad 26 Nov 10 6 14
Göteborg 2 Dec 15 8 12
Jönköping 3 Dec 17 11 11
Örebro 4 Dec 7 5 6
Total 90 56 78
* Some of the organizations have been represented at more than one training session. Therefore, ”Total” does not sum up the values in the columns above, the value ”total” shows the total number of participating organizations and the total of participating programmes respectively.
4.2.4 Some Comments
The persons who participated in the self-assessment education did not pay any course fee. All written material, including copies of ‘Läroverket AVE-version’ was free. The expenses for the organizations using ‘Läroverket AVE-version’ for self-assessment consisted, for instance, of salaries, travelling expenses, and lodging.
In order to help the AVE-organizations to accomplish the work with self-assessment, they received some written material, besides ‘Läroverket AVE-version’. This material was partly in the form of a short textbook called ‘Skolblocket’, in Swedish, illustrating the description phase of the self-assessment procedure. A description of a fictitious organization, called ‘Ren-tek’, showing how the questions in ‘Läroverket’ might be answered when working with the description phase, was also distributed.
During the AVE-evaluation project the research group also had a site on Internet, which mainly was used to send information to the AVE-organizations regarding the self-assessment project.

78
4.3 The Tool ‘Läroverket AVE-version’
4.3.1 The Background of ‘Läroverket AVE-version’
To stimulate a culture for continuous improvements and at the same time col-lect data for the research group5, the tool used in the AVE-project was de-veloped to fulfil two different aims. In order to accomplish self-assessment with this dual purpose, and at the same time take care of the fact that the participating organizations in general had little experience of self-assessment, there was a need for a new self-assessment tool.
As a consequence, a tool called ‘Läroverket AVE-version’ was developed. To make it possible to use the name ‘Läroverket’ in other forms of educational organizations than just in the Advanced Vocational Education, the name ‘Lä-roverket AVE-version’ was used.
As described in Chapter 2, there are several tools that might be used for self-assessment. Most of these are booklets with different quality award criteria. As also mentioned in Chapter 2, Lundquist (1997), and others, states that a general tool might be used even in educational organizations.
When comparing different tools for quality awards, or self-assessment, differences can be found in at least two dimensions, namely differences in ge-nerality and differences regarding size of the assessed organizations. The SIQ Model for Business Excellence, for instance, is seen as a general tool applicable for any organizational size. A second example is the tool used in the Swedish School Award, which is a special tool intended for educational organizations based upon the SIQ Model, for any organizational size. A third example is the Springboard, which is described as a general tool, but is deve-loped to facilitate self-assessment among small organizations; see Section 2.4. When describing assessment tools in terms of generality and organizational size, it might be useful to summarize that discussion in a picture, see Figure 4.6.
5 See Chapter 4.

79
Criteria forthe Swedish
QualityAward
Criteria forthe Swedish
SchoolAward
TheSpringboard
LäroverketTools for small organisations
Tools for organisations,irrespective of size
Generaltools
Specialtools
: based on to some extent
: on the analogy with above
LegendThe arrows symbolise:
Figure 4.6 Illustration of how different tools intended for external assessment or self-assessment can be classified according to the organizations’ size and the generality of the tool.
The main idea of ‘Läroverket AVE-version’ was that it should be useful for small educational organizations that might have no or little experience about self-assessment. It should also be based upon the common values from TQM and support learning of quality improvement. At the same time it should be possible to use as a tool for collecting data for the AVE-evaluation.
The Springboard had proven to be successful for self-assessment in small organizations (Hellsten, 1997a). It has also successfully been the basis of the regional quality award ‘Quality in Northern Sweden’, see Nilsson (1999). Therefore, it was convenient to use the Springboard as inspiration for development of ‘Läroverket AVE-version’ when considering the values and the model that describe the tool, and also the principles of using the tool.
4.3.2 The Structure of ‘Läroverket AVE-version’
In order to describe ‘Läroverket AVE-version’, it is suitable to look at its diffe-rent parts in more detail. The parts that are described here are basically an extended version of the characteristics for quality award criteria booklets described in Section 2.2.8. The parts of the ‘Läroverket AVE-version’ are:
• The Value Base • The Individual Questions
• The Overview Description • The ‘Help-notes’
• The Organizational Model • The Evaluation Matrix

80
The Value Base Like most other tools used for TQM-based self-assessment ‘Läroverket AVE-version’ is based upon a number of core values. ‘Läroverket AVE-version’ is based upon the six core values by Bergman & Klefsjö (1994), see Figure 2.4.
One reason for this choice is that these core values, seem to constitute the consensus of TQM-values, according to the theoretical discussion in Section 2.2.4. Another reason is that the criteria of the SIQ Model, which were considered relevant in the educational sector by Lagrosen (1997), are closely related to these core values. This is illustrated in Figure 4.7, where two different statements, made by Lagrosen (1997) and Hellsten (1997a), are put together. A plus or minus sign at a certain criteria in the SIQ Model shows whether Lagrosen (1997) judges that criteria relevant for the school sector or not. The two minus signs, combined with the plus signs, in Figure 4.7 show that Lagrosen judges these two criteria, ‘results’ and ‘customer satisfaction’, in the SIQ Model as less convenient. Hellsten (1997a) has compared the TQM core values to the criteria in the SIQ Model and shown the similarities between them. This can be seen in the middle of Figure 4.7. The statements by Lagrosen (1997) and Hellsten (1997a) are put together in Figure 4.7 with the SIQ criteria as an interface between them.
The relevance for
schools of each of the SIQ-model criteria,
according to Lagrosen (1997)
The criteria of the SIQ-
model for
TQM core value by
Hellsten (1997) and connected to the SIQ-
model criteria according to Hellsten
+ 1 Leadership Management commitment
+ 2 Information & analysis
Fact-based decisions
+ 3 Strategic planning Management commitment
+ 4 Human resource development
Everybody’s participation
+ 5 Management of processes
Focus on processes
+ - 6 Results Fact-based decisions + (-) 7 Customer
satisfaction Focus on customers
Figure 4.7 The different criteria of the SIQ Model for Business Excellence (in the second column) together with conclusions drawn by Lagrosen (1997) about the relevance of that particular criteria for schools (in the first column), and (in the third column) the main TQM core value connected to the criteria according to Hellsten (1997a). A plus or minus sign in the first column indicates whether Lagrosen (1997) judges the criteria relevant or not for the school sector.

81
A third reason for the choice of core values was that the Springboard, as mentioned in Chapter 2, is based upon these values and that tool, including the value base, has proven to be successful in minor organizations; Hellsten (1997a, b).
The Overview Description
In order to create a base for the self-assessment, the organization, which uses ‘Läroverket AVE-version’, has to describe its present state according to the points:
• Background • The design of the given education
• Vision, mission, goals, strategies and quality policy
• The education process
• Customers • The organization and its employees
• Competition and other threats • Economy and other resources
• The goal of the given education • The regulation of the education
The main reason for this construction was to give all people involved in the work a common picture and frame of the organization and gather relevant definitions before starting the assessment.
However, some of the questions, or parts of the questions, that should be answered in the overview, were included to get information for the overall AVE-evaluation.
The Organizational Model
The model in ‘Läroverket AVE-version’ was inspired by the model in the Springboard, described in Section 2.2.8. However, some modifications were made both regarding the graphical shaping and the contents.
The Springboard model contains of two parts. One part is the four areas that illustrate an organization’s activities, and the other part is the assessment di-mensions, according to which the analysis should be made (see Hellsten, 1997b, and Figure 2.16). When looking at the graphical shape of the ‘Lärover-ket AVE-version’ model, see Figure 4.8, and comparing this with the Spring-board model in Figure 2.16, two main differences can be identified.
The four areas placed in the middle of both models have been put in a triangle in the ‘Läroverket AVE-version’ model, and the assessment dimensions placed as a circular part in both models, are four in the Springboard, but five in the ‘Läroverket AVE-version’ model.

82
Employee commitment
Management of processes
Lead
ership
Customercooperation
Approach
Dep
loym
ent
Results
Evalu
ation
Impro
vem
ent
Figure 4.8 The model used for ‘Läroverket AVE-version’. The triangular part shows the areas of an organization’s business that shall be assessed. The circular part describes the five different dimensions that are used for the assessment. In this figure the words in the model have been translated into English from the Swedish model in Svensson (1998).
The Four Areas
To start with the areas in ‘Läroverket AVE-version’, the business is structured according to the same four areas as in the Springboard, namely Customer co-operation, Leadership, Employee commitment, and Management of processes. The difference however, is the way these four areas are presented. In order to let the model illustrate not only which the areas are, but also their meaning in an organization and how they are connected to each other, they have been placed in a triangular part in the ‘Läroverket AVE-version’ model.
Firstly, ‘Customer co-operation’ is put in the middle of the triangle to symbo-lise the importance of focus on customers in the TQM theory. By this position between the three other areas it has contact with all of them. This symbolises the importance of letting the entire organization be permeated by the customer thinking.
Secondly, the TQM theory states the importance of having a ‘committed leadership’ in an organization (see Section 2.2.4), which means that TQM work has to be established among leaders first. Therefore, the area ‘Leadership’ is placed to the left in the triangle, as a first step.
Thirdly, the TQM theory points out that committed leaders are not enough. There is a need to have all employees participating in the work as well. That is the reason to put ‘Employee commitment’ at the top-side of the triangle.

83
‘Employee commitment’ is an important part in TQM, but it has to be sanctioned by the leaders and the employees have to have contacts with the leaders to have it realised. Therefore, there is a contact surface between those two areas.
Fourthly, most activities in an organization could be considered as a process, a flow of materials and different kinds of data. To stimulate a focus on ‘how we work’ instead of ‘what we do’ the value ‘Management of processes’ is put in the bottom of the triangle.
The main reason for using the triangle is that it symbolises an arrowhead of a time-line. The arrowhead shows that time is always running and during the passing, there might be some changes going on in customer preferences and also among the customer needs and expectations. As a result of that, the deliveries to the customers, goods as well as services, might to have to be changed, which affects the customer co-operation. As said, the entire organization has to be built up around the customer focus according to TQM. The entire organization, leaders and other employees, as well as the processes, have therefore to take these changes into consideration or will be affected in some manner.
The Assessment Dimensions
The circular part of the model describes the five dimensions that are used as a base for the individual questions in each of the four areas. One difference bet-ween the Springboard and ‘Läroverket AVE-version’ is the number of dimensions. The Springboard has four dimensions, but ‘Läroverket AVE-version’ has five. In the Springboard the fourth dimension comprises both how an organization evaluates its quality work and which improvements that have been obtained by that. In ‘Läroverket AVE-version’ the fourth dimension only includes how an organization evaluates the quality work and the fifth dimension comprises how the organization is carrying through the improvement work based upon the evaluation and which the obtained improvements are from that work. There were at least two reasons for that separation. One was to emphasize the two phases better, which was considered important due to experiences from other self-assessment projects. Another one was to create a picture parallel to the picture of self-assessment and improvement work; see Figure 2.10.
The Dimension ‘Result’
The result dimension in ‘Läroverket AVE-version’ was formulated to clarify and emphasize the importance of results. This importance, together with

84
personal communication6, resulted in the use of the result dimension in ‘Läro-verket AVE-version’.
In the Springboard the dimension ‘result’ leads to one single question about results in each one of the four included areas. In ‘Läroverket AVE-version’ a sub-question about result is included in every one of the individual questions in the four areas; see Figure 4.9. This means that in ‘Läroverket AVE-version’ the result dimension is connected directly to the dimensions ‘approach’ and ‘deployment’. Area questions, sub-questions and type-questions are discussed below.
The reason for connecting the dimension ‘result’ directly to each one of the questions is that two types of results should be commented.
Usually, results in TQM-based assessment tools deal with results related to all the criteria as, for instance, ‘customer satisfaction’. The connection mentioned in ‘Läroverket AVE-version’ between the three dimensions ‘approach’, ‘deployment’, and ‘result’ instead implies a description of the result from a certain activity that is used to a certain extent. In this case the result contains data describing whether the used activity really gives what it was aimed to give. If the activity is about collecting data about customer satisfaction, the result should show whether the organization receives knowledge about customer satisfaction by using the activity.
However, as another result, the data from the investigation whether customers are satisfied or not, should be important to describe as well. So, for some of the questions in ‘Läroverket AVE-version’ at least two types of results should be described and analysed.
The Dimensions ‘Evaluation’ and ‘Improvement’
In ‘Läroverket AVE-version’ the fourth dimension only includes how an organization evaluates their quality work and the fifth dimension comprises how the organization is carrying through the improvement work based upon the evaluation and what the obtained improvements are from that work.
The reason for putting ‘improvement’ as a special dimension was to emphasise the importance of accomplishing improvement work based upon the evalua-tion described in the fourth dimension. If no improvement work follows from the evaluation, no learning will take place as a consequence of the evaluation
6 Communication about experiences from the use of the Springboard with persons, who at the time were working at the Division of Quality and Environmental Management at Luleå University of Technology.

85
in phase four. By introducing the fifth dimension, the TQM core value ‘conti-nuous improvements’ was aimed to be emphasized more in the model.
Furthermore, the sequence ‘approach’, ‘deployment’, ‘result’, ‘evaluation’ and ‘improvement’ is closely related to organizational learning; Kolb (1984) and Senge (1990). An organization, which starts improvement work without basing it upon any evaluation works unsystematically from a learning point. The separation between the dimensions ‘reflection’ and ‘improvement’ is intended to accentuate the connection to organizational learning.
The Individual Questions
The heart of using ‘Läroverket AVE-version’ is to create a description how the organization works by answering the questions that are put in each one of the four areas. These questions should be answered during the description phase of self-assessment and thereafter analysed; see Figure 2.9. The number of questions as well as the contents were inspired by the Springboard, which was experienced as suitable for small organizations; Hellsten (1997a). However, the questions were also influenced by the overall AVE-evaluation and the need of data for that purpose. Table 4.3 illustrates the connection between the questions included in ‘Läroverket AVE-version’ and the AVE-evaluation.
Table 4.3 The table shows the areas that were to be evaluated by the research group and their connections to the questions in the self-assessment tool ‘Läroverket AVE-version’ that was used for data collection. The questions in ‘Läroverket AVE-version’ are represented alphanumerically with shortenings for an area in ‘Läroverket AVE-version’ and the number of the specific question. The shortenings stand for: O = Overview, C = Customer Co-operation, L = Leadership, E = Employee Commitment, and M = Management of Processes.
Nr Areas in the AVE-evaluation The questions in ‘Läroverket AVE-version’
where the parts are asked Main questions Indirect questions
1 Working life requirements O2, C6, L1 (O3, C1, C2, C4) 2 Equality aspects L7, M6 (O8, C5) 3 Regional policies O1, O6, C6 - 4 The shaping of each educational
programmes O7, L6, M6, M7 -
5 The significance of kind of responsible organization
- All questions
6 Economic state of affairs O9, L5 - 7 Interaction with interested parties E3, M4, M5 (C1, C2, C4, M1) 8 Regulation O10 - 9 Self-evaluation - All questions indirectly 10 Secondary effects - -
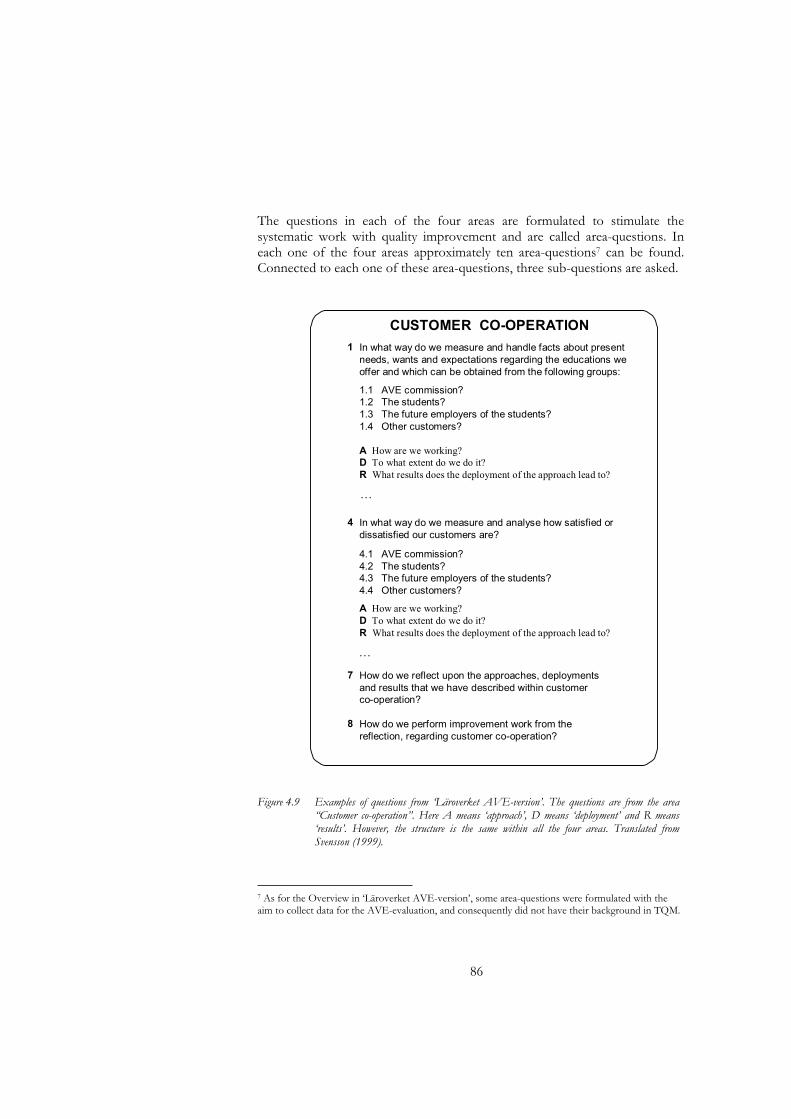
86
The questions in each of the four areas are formulated to stimulate the systematic work with quality improvement and are called area-questions. In each one of the four areas approximately ten area-questions7 can be found. Connected to each one of these area-questions, three sub-questions are asked.
Figure 4.9 Examples of questions from ‘Läroverket AVE-version’. The questions are from the area “Customer co-operation”. Here A means ‘approach’, D means ‘deployment’ and R means ‘results’. However, the structure is the same within all the four areas. Translated from Svensson (1999).
7 As for the Overview in ‘Läroverket AVE-version’, some area-questions were formulated with the aim to collect data for the AVE-evaluation, and consequently did not have their background in TQM.
1
4
7
8
CUSTOMER CO-OPERATION
In what way do we measure and handle facts about present
needs, wants and expectations regarding the educations we
offer and which can be obtained from the following groups:
A How are we working?D To what extent do we do it?R What results does the deployment of the approach lead to?
In what way do we measure and analyse how satisfied or
dissatisfied our customers are?
A How are we working?D To what extent do we do it?R What results does the deployment of the approach lead to?
How do we reflect upon the approaches, deployments
and results that we have described within customer
co-operation?
How do we perform improvement work from the
reflection, regarding customer co-operation?
…
…
1.1 AVE commission?
1.2 The students?
1.3 The future employers of the students?
1.4 Other customers?
4.1 AVE commission?
4.2 The students?
4.3 The future employers of the students?
4.4 Other customers?

87
The sub-questions are of the type:
• How are we working (approach)? • To what extent do we do it (deployment)? • What results do the deployment of the approach lead to (results)?
However, the last two questions in each area are similar to the two last type-questions (evaluation and improvement) and refer to the area as a whole.
• How do we reflect upon our approaches and deployments (evaluation)? • How do we work to improve our approaches and deployments
(improvement)?
Examples of questions from the area ‘Customer Co-operation’ in ‘Läroverket AVE-version’ are presented in Figure 4.9. In this case, the questions number 1 and 4 are examples of area-questions. Each of these contains the three sub-questions, marked A, D and R. The questions also illustrate that, compared to, for instance, the Springboard, ‘Läroverket AVE-version’ is more adapted to educational organizations. Questions 7 and 8 are type-questions.
The Evaluation Matrix
As described in Chapter 2, dimensions and rules for the assessment of the organization’s description, often summarized in an evaluation matrix, usually is one part of a self-assessment tool. In ‘Läroverket AVE-version’ a flap was included, on which it was possible to afterwards add such a matrix. Initially the idea was to later8 include such a matrix, but the final decision was that no matrix should be presented in the tool. This decision was based upon a discussion containing thoughts similar to those by Conti (2001) emphasizing that it is often too much focus on points instead of identifying improvement possibilities; see also Section 2.2.8.
The Explaining Text
In ‘Läroverket AVE-version’ some instructions were included. This text des-cribes the value-base for the tool, how the tool is intended to be used in the four phases of self-assessment, and how the tool is built up from the model in Figure 4.8. A short description of how systematic improvement work can be performed by following the steps in the improvement cycle (see Figure 2.6) was also included.
8 Mainly due to the time frames.

88
The “Help-notes”
In order to help the user of the tool, further descriptions of the five dimen-sions were also placed as “help-notes” on a flap to the cover of ‘Läroverket AVE-version’.
See Svensson (1998) for a complete version of ‘Läroverket AVE-version’ and its different parts.
4.4 Research Design of the AVE-evaluation
This section gives a description of the AVE-evaluation, i.e. the evaluation of the self-assessment project in the AVE-organizations. The description is divided into four phases and constitutes the first lap around the PDSA-model in Figure 2.6.
4.4.1 Design of the AVE-evaluation
The choice of research strategy was influenced by the characteristics of the study objects. Some facts about the AVE organizations that affected the possi-bilities to choose different strategies were:
• The distribution over a large geographical area, from Kalix in northern Sweden to Malmö in southern Sweden.
• The different forms of the organizations in size and types of ownership.
• The supposed difference in knowledge about self-assessment among the people in the organizations.
• The number of organizations that would accomplish self-assessment work.
Based upon these characteristics, a survey with written questions was chosen as the initial method of data collection in the AVE-project9. The purpose with the survey was to collect data that could be analysed in order to do com-parisons and discover patterns. This kind of investigation should be able to answer questions about ‘what’, ‘where’, ‘how’, and ‘when’ things have occurred. Questions regarding ‘why’ and ‘causality’ are more difficult to get answers to.
9 To verify the results and facilitate comparison, similar questionnaires were also used in the AEI-project described in Chapter 5.

89
Plan
During the ‘plan’ phase, the AVE-project was planned and prepared, including literature studies and questionnaire design.
The research questions were transformed into a questionnaire by using a process model, see Figure 4.10. The model was based on what is needed regarding resources and activities to realise self-assessment work. Theory about this is described in Chapter 2.
Information &
decision making
Education about
self-assessment
Previous
know-
ledge
Self-assessment
with ”Läroverket”
Claim of resources for self-
assessment work
Results from self-
assessment with
”Läroverket”
Figure 4.10 The figure illustrates a model of the main parts in self-assessment work. This model was used during the design of the questionnaire in the AVE-project.
The questionnaire is built up in three different parts; see Appendix QAVE1.First a short description of the questionnaire followed by a few background questions. The second part consists of six different semantic differential scales aimed to measure affect; people’s positive and negative feelings toward an atti-tude object, see Henerson et al. (1991) for a discussion of that type of scales.
The used scale consists of a series of adjectives and their antonyms listed on opposite sides of the page with seven positions in a matrix. Above the matrix an attitude object is placed as a heading, see Figure 4.10. The third part of the questionnaire is built up from Figure 4.10 as a base. Different advices about how to make a questionnaire were got from Dahmström (1996) and Rombach (1998).
In order to increase the validity and reduce the risk to include questions, hard to understand, the questionnaire was tested before being sent to the respondents. Firstly, the questionnaire was tested by a number of colleagues with special knowledge about statistics and construction of questionnaires. Secondly, a person at one of the AVE-organizations tested the questionnaire. This person had built up a number of AVE-programmes, but was no longer

90
the contact person10 of the organization. This means that the organization could still be one of the respondents.
“The attitude object”
Adjective 1A θ θ θ θ θ θ θ Adjective 1B
Adjective 2A θ θ θ θ θ θ θ Adjective 2B
Adjective 3A θ θ θ θ θ θ θ Adjective 3B
Adjective 4A θ θ θ θ θ θ θ Adjective 4B
Adjective 5A θ θ θ θ θ θ θ Adjective 5B
Adjective 6A θ θ θ θ θ θ θ Adjective 6B
Adjective 7A θ θ θ θ θ θ θ Adjective 7B
Adjective 8A θ θ θ θ θ θ θ Adjective 8B
Figure 4.11 An example of a semantic differential scale. (Freely from Henerson et al., 1991)
Do
The questionnaire was sent by ordinary mail to the contact persons at each of the AVE-programmes that had chosen do use the self-assessment tool ‘Läroverket AVE-version’. These persons were announced by the National Agency of Advanced Vocational Education as channels between the research group and the AVE-programmes. The questionnaire was sent about half a year after the training sessions about the phases three and four had been held. The organizations had by then reached different levels in the self-assessment process. The questionnaire can be found in Appendix QAVE1.
As a consequence, the contact persons received all information about the self-assessment work as well. Some of the participating AVE-organizations were rather small, and in some cases the organizations consisted of one person only; other personnel resources like teachers were hired when needed from the school where the AVE-programmes were offered.
The contact persons were reminded twice and in some case also telephone calls were used in order to get as high response rate as possible.
Study
During this phase the analysis of the data gathered by the questionnaire was accomplished. This was done using both one-dimensional and two-
10 One person at each AVE-organization was announced as contact person via the National Agency of Advanced Vocational Education and held contact with the research group as well as the Agency.

91
dimensional tables. The first type of tables was used for frequency analysis and the second type for cross-question analysis.Advices about how to manage the study phase were mainly got from Dahm-ström (1996) and Eggeby & Söderberg (1999), and also from the supervisor and colleagues.
Act
In the fourth phase finally, conclusions about the use of self-assessment in educational organization were drawn based upon the previous analysis. These are presented in Section 4.6.
4.4.2 Design of Evaluation of the Overall AVE-evaluation
The overall AVE-evaluation, i.e. the evaluation of the AVE pilot project made by the research group, is an example of the concept of system evaluation in two respects. Firstly, by emphasising multiple channels for input of data, and, secondly, by offering the educational organizations participation in the evaluation process.
Attitude Towards System Evaluation: Model for Analysis
To investigate the attitudes towards the use of system evaluation in the overall AVE-evaluation, a model by Lundin & Söderholm (1995) was used. According to them, the encounter between an evaluator and the activity to be evaluated may be more or less positive. This depends on two components; the expecta-tions the two parts have, and how the part being evaluated experiences the evaluation.
The expectations may either be positive, in the sense that the work of evalua-tion will lead to development potential being demonstrated, or negative, in the sense that an evaluation is seen as a threat to existing activities. In the former case the evaluation will be viewed with confidence, and in the latter with mistrust.
Further, an evaluation may be experienced as backward-pointing, meaning that the evaluators are seen as inspectors looking for any shortcomings, or as forward-pointing, when the evaluation is perceived as a process of renewal.
By combining the confidence-mistrust and backward-forward-pointing dimensions it is possible to construct a four-field matrix that describes the four different types of evaluators, see Figure 4.12.
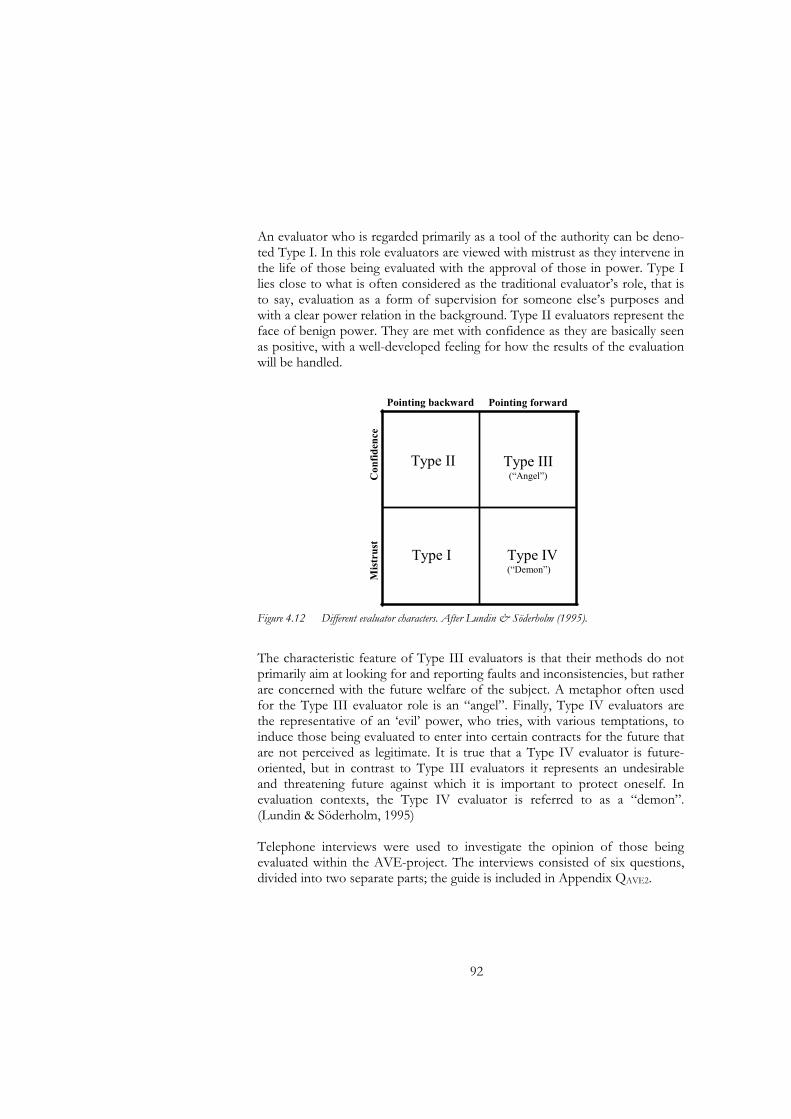
92
An evaluator who is regarded primarily as a tool of the authority can be deno-ted Type I. In this role evaluators are viewed with mistrust as they intervene in the life of those being evaluated with the approval of those in power. Type I lies close to what is often considered as the traditional evaluator’s role, that is to say, evaluation as a form of supervision for someone else’s purposes and with a clear power relation in the background. Type II evaluators represent the face of benign power. They are met with confidence as they are basically seen as positive, with a well-developed feeling for how the results of the evaluation will be handled.
Pointing backward Pointing forward
Con
fid
ence
Mis
tru
st
Type II
Type I Type IV(“Demon”)
Type III(“Angel”)
Figure 4.12 Different evaluator characters. After Lundin & Söderholm (1995).
The characteristic feature of Type III evaluators is that their methods do not primarily aim at looking for and reporting faults and inconsistencies, but rather are concerned with the future welfare of the subject. A metaphor often used for the Type III evaluator role is an “angel”. Finally, Type IV evaluators are the representative of an ‘evil’ power, who tries, with various temptations, to induce those being evaluated to enter into certain contracts for the future that are not perceived as legitimate. It is true that a Type IV evaluator is future-oriented, but in contrast to Type III evaluators it represents an undesirable and threatening future against which it is important to protect oneself. In evaluation contexts, the Type IV evaluator is referred to as a “demon”. (Lundin & Söderholm, 1995)
Telephone interviews were used to investigate the opinion of those being evaluated within the AVE-project. The interviews consisted of six questions, divided into two separate parts; the guide is included in Appendix QAVE2.

93
The evaluation procedure
The individuals, within the 123 educational organizations, who conceptually were most familiar with the work of the evaluation team were chosen. That means those who had participated in the ‘Läroverket AVE-version’ education, administrated student inquiries, and participated in the site visits of the evaluation team. On the basis of these criteria, the selection frame encompas-sed a total of 22 educational organisers. Before the telephone interviews were performed, the selected education organisers had received inquiry forms. Shortly after this, an interviewer, independent of this investigation, telephoned all the respondents and collected their answers.
The first part consisted of four questions with fixed alternatives arranged on a Likert scale (Hellevik, 1984). They were created based of the analysis model by Lundin & Söderholm (19959 and the concept pairs ´confidence/mistrust´ and ´forward-/backward-pointing´ (Figure 4.12). Each pair of concepts was operationalised in two contradictory assertions. Each respondent’s attitude was placed in the four-field matrix shown in Figure 4.12. First, the given alternative responses were graded on the Likert scale with numerical values from 1 to 5. The respondents’ responses, i.e. the numerical values, were then compiled for each of the assertions. Also the mean values for the four concepts were calculated and entered into the box-plot, which were combined with the four-field matrix (Figure 4.22). The second part of the inquiry consisted of two questions with open answers with the purpose to reduce the ambiguity and contradictory answers given in the first part.
In addition, background data on the different educational organizations that can be assumed to bias the answers has been used, as business, ownership form, geographic location and economic financing.
This evaluation is further described in Lindell & Svensson (2002).
4.5 Impressions of Meetings with Persons from AVE-organizations
During the different training sessions T1 and T2 (see Section 4.2.2) when preparing the AVE-organizations for the self-assessment work, a lot of different opinions and comments from the participants during the training ses-sions regarding the self-assessment work and about ‘Läroverket AVE-version’ were received by the author of this thesis.

94
Some of the opinions turned up at almost all sessions and often were emphasised by the representatives, so these opinions seemed to be important to a lot of the organizations and therefore important to investigate, since they probably influenced the possibility to accomplish the self-assessment work.
The opinions presented have, of course, been interpreted by the author and are not exactly the words that were expressed during the training sessions. The opinions might be summarised in the five main categories:
• We do not have enough resources to use ‘Läroverket AVE-version’! • ‘Läroverket AVE-version’ is too extensive! • It is hard to understand how to use ‘Läroverket AVE-version’! • Is self-assessment really a main activity for us – we have newly started
programmes and there has not been enough marketing done about AVE?
• Are there any hidden agendas about the use of ‘Läroverket AVE-version’ – is it really a voluntary choice about the use of it in the long run?
These opinions were to some extent used as a base when the questionnaire described in Section 4.4.1 was constructed.
4.6 Results from the Questionnaire
In this section, different results and experiences from the self-assessment project using ‘Läroverket AVE-version’ are presented and analysed. The data is based on the questionnaire described in Section 4.4.1 and included in Appendix QAVE1.
According to Figure 4.3, representatives for 98 AVE-programmes of the 123 programmes participated in the self-assessment process based on ‘Läroverket AVE-version’. Of these 98 programmes 75 had sent their detailed descriptions to the research group. Of these 75 programmes 70 answered the questionnaire. It is answers from these 70 programmes that have been analysed in this section if not otherwise is stated. However, all questions were not answered by all programmes.
The 25 programmes that did not submit their detailed descriptions received a slightly modified version of the AVE-questionnaire. One difference between the two questionnaires was a question about the reason why the detailed description was not sent to the research group. Of the 17 that answered the modified questionnaire, 14 answered that question. Of these, 11 said that they

95
had not finished their describing work and three answered that they had not even started the work. Of these, 11 answered that they intended to complete the work and eight organizations even had a time schedule for that work
4.6.1 Results from the Use of ‘Läroverket AVE-version’
In this section a number of issues related to the questionnaire are presented and commented upon.
Resources Compared to Benefit
In the questionnaire the organizations were asked about their experiences with the self-assessment work. Figure 4.13 shows how the organizations looked at the resources used compared to the obtained results. The picture illustrates a clear tendency that the work is experienced positively.
5
21
16
3
68
10
0
5
10
15
20
25
Very
useless
Very
useful
Nu
mb
er
of
ed
ucati
on
-pro
gra
mm
es
Figure 4.13 The figure illustrates how the AVE-organizations, using ‘Läroverket AVE-version’, assess the value of the work when they compare the resources used with the results of the work so far. The figure is based on answers from the contact persons at the different AVE-programmes, which have submitted a detailed description.
When the study was performed during spring 1999, the analysis work of the detailed description (phase 3 in Figure 2.9) had been started at 30 of the 70 programmes. Seven of these even said they had finished the work with the analysis. More than 80% of these 70 said that they had found improvement possibilities during the work with creating the description.

96
2
1
2
00
3
0
1
2
3
4
5
6
7
Very
useless
Very
useful
Nu
mb
ero
f ed
uca
tio
n-p
rog
ram
mes
2
Figure 4.14 The figure illustrates how the AVE-programmes that have used ‘Läroverket AVE-version’, but not submitted their detailed descriptions to the research group assess the value of the work when they compare the resources used with the results of the work at that point.
The 14 programmes, which had not submitted their detailed descriptions, were also asked to give their opinion about the resources used compared to the ob-tained results. The answers from those 10, who answered are shown in Figure 4.14.
The results in Figure 4.14 show a similar tendency as in Figure 4.13, but the picture is less positive to the usefulness of the work with ‘Läroverket AVE-version’. One reason for this might be that, as said above, these organizations have not completed their detailed descriptions. On the other hand, it could be expressed the other way around; negative experience about the usefulness might influence the will to finish the description work.
TQM Methodologies Useful?
One research question dealt with whether TQM methodologies are useful in higher education. The AVE-programmes’ view is shown in Table 4.4 separated on the 54 programmes given by public organizations and 16 given by other kind of organizations11, among those that have sent their detailed descriptions to the research group. More than 50% consider TQM methodologies useful and about 20% disagree. It seems to be roughly the same response among respondents from the public organizations as from the other kind of organizations. However, the small number of answers in the group ‘other organizations’ makes it hard to draw clear conclusions.
11 In this group are companies, as Volvo, and Saab, but also, for example, foundations and TBV (‘Tjänstemännens Bildningsförbund’).

97
Table 4.4 The table shows the amount of AVE-programmes, that answered the questionnaire, that were run by public and other kind of organizations, and their view of the usefulness of TQM methodologies in their work.
Not useful Medium Useful
Public organizations 14(26%) 7(13%) 33(61%)
Other kind of organizations 3(19%) 4(25%) 9(56%)
Total 17(24%) 11(16%) 42(69%)
Attitudes in a Semantic Scale
Another way to evaluate the experiences from the self-assessment work and the use of ‘Läroverket AVE-version’, is by attitude questions with a semantic scale (Henerson et al., 1991). Answers to a number of such questions are shown in Figures 4.15 - 4.18. Figure 4.15 shows the overall attitudes about self-assessment by using of ‘Läroverket AVE-version’ at the different AVE-programmes, who have been working with the tool, answered by the contact persons.
Scale 1 2 3 4 5 6 7
Bad 0 7 1 14 17 15 14 Good
Uninteresting 0 4 6 14 10 20 14 Interesting
Confusing 5 11 6 21 18 6 1 Clear
Worthless 0 6 3 10 20 17 12 Valuable
Irrelevant 0 7 2 11 19 19 10 Relevant
Not useful 1 6 10 9 14 21 7 Useful
Superficial 0 1 6 10 15 13 23 Thorough
Inefficient 2 7 14 20 12 10 3 Efficient
Figure 4.15 Summary of how the AVE-programmes perceived the work with self-assessment according to ‘Läroverket AVE-version’.
Figure 4.15 shows that the self-assessment has been perceived positive by most of the AVE-programmes in most parameters. That the assessment is lower concerning ‘confusing-clear’ might be expected as the self-assessment procedure was unfamiliar to many organizations and the thoughts were new to many AVE-organisers. However, it might also indicate that the tool ‘Läroverket AVE-version’ was seen as too complicated or that the training sessions were not carried out in a proper way. These explanations might also have interfered with each other. The latter explanation can also be looked at in the light of what is said in Section 4.5 about the author’s summary of meetings with the persons from the AVE organizations.

98
A little more surprising is perhaps that the mark on ‘efficiency’ is fairly low. This might depend on the fact that some people have seen ‘efficiency’ as result per hour of work and the mark might be low because of the comparably large amount of work. Another reason might be that several of them did not at the time see the effects of the work since they were not ready with the analysis of the detailed description.
The attitudes related to the applicability of the customer concept in educational organizations are illustrated in Figure 4.16. It is interesting to see that the customer concept is experienced positively in most aspects.
Scale 1 2 3 4 5 6 7
Bad 2 2 2 14 6 15 15 Good
Uninteresting 0 3 3 5 12 18 14 Interesting
Confusing 2 8 5 6 5 15 15 Clear
Worthless 1 1 3 16 6 14 14 Valuable
Irrelevant 1 1 4 8 9 17 15 Relevant
Not useful 1 1 9 10 5 14 16 Useful
Superficial 0 1 3 19 7 12 10 Thorough
Inefficient 1 2 2 17 12 12 8 Efficient
Figure 4.16 Summary of how the AVE-programmes perceived the applicability of the customer concept within educational organizations.
Figure 4.17 illustrates the AVE-programmes attitudes towards the four areas that are used as a base in ‘Läroverket AVE-version’.
Scale 1 2 3 4 5 6 7
Bad 1 1 1 12 8 18 14 Good
Uninteresting 0 1 3 11 12 17 11 Interesting
Confusing 4 2 9 11 11 8 10 Clear
Worthless 0 3 6 9 12 13 12 Valuable
Irrelevant 0 1 3 8 19 12 12 Relevant
Not useful 1 8 2 6 15 15 9 Useful
Superficial 0 0 1 6 17 11 19 Thorough
Inefficient 0 6 8 13 11 8 8 Efficient
Figure 4.17 The attitudes among the AVE-organizations towards the use of the four areas in ‘Läroverket AVE-version’
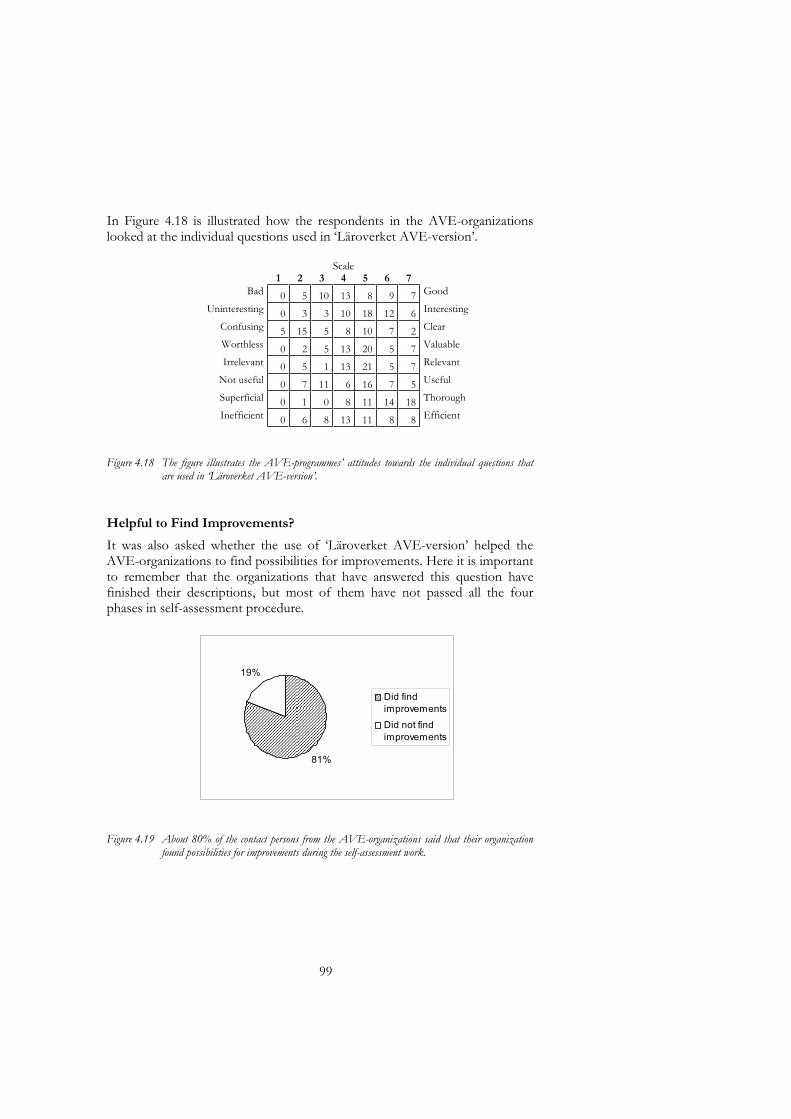
99
In Figure 4.18 is illustrated how the respondents in the AVE-organizations looked at the individual questions used in ‘Läroverket AVE-version’.
Scale 1 2 3 4 5 6 7
Bad 0 5 10 13 8 9 7 Good
Uninteresting 0 3 3 10 18 12 6 Interesting
Confusing 5 15 5 8 10 7 2 Clear
Worthless 0 2 5 13 20 5 7 Valuable
Irrelevant 0 5 1 13 21 5 7 Relevant
Not useful 0 7 11 6 16 7 5 Useful
Superficial 0 1 0 8 11 14 18 Thorough
Inefficient 0 6 8 13 11 8 8 Efficient
Figure 4.18 The figure illustrates the AVE-programmes’ attitudes towards the individual questions that are used in ‘Läroverket AVE-version’.
Helpful to Find Improvements?
It was also asked whether the use of ‘Läroverket AVE-version’ helped the AVE-organizations to find possibilities for improvements. Here it is important to remember that the organizations that have answered this question have finished their descriptions, but most of them have not passed all the four phases in self-assessment procedure.
81%
19%
Did find
improvements
Did not find
improvements
Figure 4.19 About 80% of the contact persons from the AVE-organizations said that their organization found possibilities for improvements during the self-assessment work.

100
Correlation between Usefulness and the Phase Reached?
Another form of result from the use of self-assessment work is which phase the organizations have reached. As shown in Table 4.6, just 10 of the 69 programmes that answered this question had reached the analysis phase. In Table 4.6 the data about how far the organizations have reached have been combined with the data showing the opinion among the respondents about the usefulness of self-assessment.
Table 4.6 This table shows how many AVE-programmes that have reached the third self-assessment phase, the analysis phase. It also shows these data combined with their opinion about usefulness of self-assessment.
Not useful Medium Useful Σ Analysis started 2 0 8 10
Analysis not started 14 11 34 59
Σ 16 11 42 69
Not useful Medium Useful
Analysis started 20% 0% 80%
Analysis not started 24% 19% 58%
As Table 4.6 shows, most of the programmes had not yet started the analysis phase when the respondents answered the questionnaire. It also seems that the respondents, working in programmes that had started the analysis phase, consider the self-assessment more useful. This observation might, however, be uncertain.
4.6.2 Facts about the Use of ‘Läroverket AVE-version’
The questionnaire did not only ask about results from the self-assessment in the AVE-project, but also about different elements that might have influenced the result. These elements are previous knowledge, information & decision making, education about self-assessment, and claim on resources. These elements are shortly discussed below.
Previous Knowledge
One background variable is the knowledge about TQM among the people involved in the AVE-programme, answered by the contact persons in AVE-organizations before they were involved in the AVE-project. The result is shown in Figure 4.20.
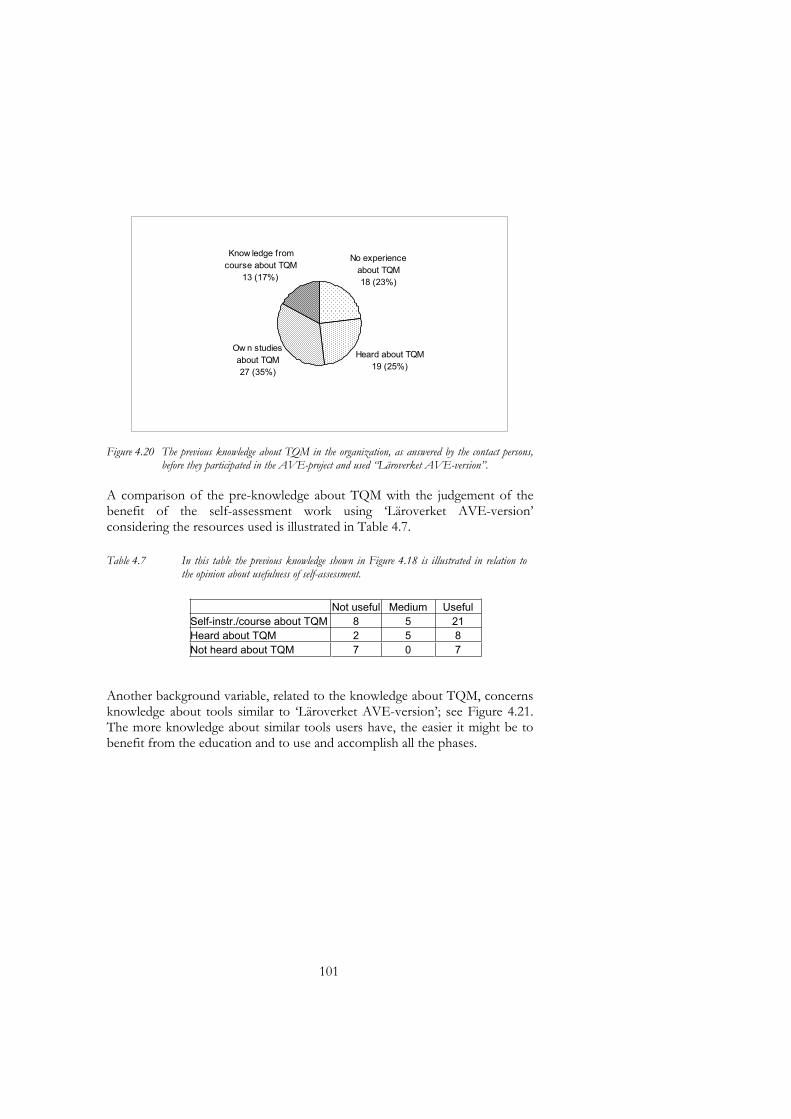
101
Heard about TQM
19 (25%)
No experience
about TQM
18 (23%)
Know ledge from
course about TQM
13 (17%)
Ow n studies
about TQM
27 (35%)
Figure 4.20 The previous knowledge about TQM in the organization, as answered by the contact persons, before they participated in the AVE-project and used “Läroverket AVE-version”.
A comparison of the pre-knowledge about TQM with the judgement of the benefit of the self-assessment work using ‘Läroverket AVE-version’ considering the resources used is illustrated in Table 4.7.
Table 4.7 In this table the previous knowledge shown in Figure 4.18 is illustrated in relation to the opinion about usefulness of self-assessment.
Not useful Medium Useful
Self-instr./course about TQM 8 5 21
Heard about TQM 2 5 8
Not heard about TQM 7 0 7
Another background variable, related to the knowledge about TQM, concerns knowledge about tools similar to ‘Läroverket AVE-version’; see Figure 4.21. The more knowledge about similar tools users have, the easier it might be to benefit from the education and to use and accomplish all the phases.

102
18 (23%)11 (14%)
22 (28%
27 (35%)
Not heard of SQA
nor SSA / No answer
Heard of SQA or
SSA
Self-instructed about
SQA or SSA
Participated in a
course about SQA or
SSA
Figure 4.21 The previous knowledge about TQM-based tools for self-assessment among the contact persons before they participated in the AVE-project and used ‘Läroverket AVE-version’. The shortenings SQA and SSA stand for the Swedish Quality Award and the Swedish School Award, respectively.
In Table 4.8 the data presented in Figure 4.21 have been compared with the opinions about the usefulness of self-assessment.
Table 4.8 In this table, the data shown in Figure 4.18 is illustrated in relation to the opinion about usefulness of self-assessment. The shortenings SQA and SSA stand for the Swedish Quality Award and the Swedish School Award, respectively.
Not useful Medium Useful
Self-inst/course 8 4 21 Heard about SSA/SQA 4 5 18 Not heard 6 3 7
It is obvious that, among the respondents who think self-assessment has been useful, many have heard of, or have participated in, some sort of studies before the use of ‘Läroverket AVE-version’.
Information and Decision Making
All AVE-organizations were ordered by the National Agency of AVE (“KY-kommittén”) to perform some form of ‘self-evaluation’12, but they could decide how themselves. One opportunity for the self-evaluation was to use the tool ‘Läroverket AVE-version’ and participate in the AVE-project. Before the
12 With the terminology from the National Agency of Advanced Vocational Eductation (‘KY-kommittén’); see Section 4.2.

103
organizations could make a decision, they were informed about this opportunity, as described in Section 4.2.
The way this information was given and also what was said by persons visiting the training sessions, has given rise to a question. That question dealt with whether the organizations received information about the opportunity to use ‘Läroverket AVE-version’ at a time when they had still not planned for the self-evaluation, or still could rework existing plans to have the possibility to reserve resources for this purpose. The answers to that question are shown in Figure 4.22.
0
5
10
15
20
25
30
35
40
45
50
Yes No Do not know
Figure 4.22 The diagram illustrates whether the AVE-organizations received information about the opportunity to use ‘Läroverket AVE-version’ at a time when they still had not planned for the self-evaluation, or still could rework existing plans to have the possibility to reserve resources for this purpose. On the vertical axis is the number of answering organizations.
Figure 4.22 shows that a lot of the programmes might have got problems in their planning because they got the information about the possibility to use ‘Läroverket AVE-version’ too late.
In Chapter 2 the importance of identifying the aim of self-assessment for an organization that will start such work is commented. Therefore, it was interesting to study the reason for choosing ‘Läroverket AVE-version’ among the AVE organizations.
Some of the persons that participated in the training sessions about ‘Läro-verket AVE-version’ expressed apprehension if the use of this tool really was a voluntary choice. This made it even more interesting to ask all contact persons about this, and if it was something that have affected their decision. Figure 4.23 shows the mentioned reasons for the decision to participate and use ‘Läroverket AVE-version’. We can notice that several representatives more or less felt forced to use ‘Läroverket AVE-version’.

104
05
10152025303540
Did not know
how to
accomplish
the self-
evaluation
Wanted to do
a more
extensive
self-
evaluation
Use of
"Läroverket"
was found as
a unspoken
demand
Use of
"Läroverket"
was found as
interesting
Do not know
Figure 4.23 The diagram shows the reasons for the choice to use ‘Läroverket AVE-version’. Each respondent could choose one or more alternatives. On the vertical axis is the number of answering organizations.
Training about Self-assessment
To accomplish self-assessment by using tools like ‘Läroverket AVE-version’, it is necessary to know how to use the tool. For that reason education and training was offered; see Section 4.2.3. The participants in the AVE-project were asked whether these training sessions gave enough knowledge to accomplish the work and their answers are shown in Figure 4.24.
0
5
10
15
20
25
30
Yes No Do not know
Figure 4.24 The diagram shows whether the representatives thought the training sessions gave enough knowledge for self-assessment work. On the vertical axis is the number of answering organizations.
According to Figure 4.24 almost 50% of the respondents thought the training sessions gave enough knowledge, but on the other hand about the same number of the respondents had the opposite opinion. This points at a need for some sort of changes about the training sessions. There were very few verbal comments in the questionnaire from those, who were negative, but from other forms of communications (se Section 4.5) it was clear that many people needed more education and training.
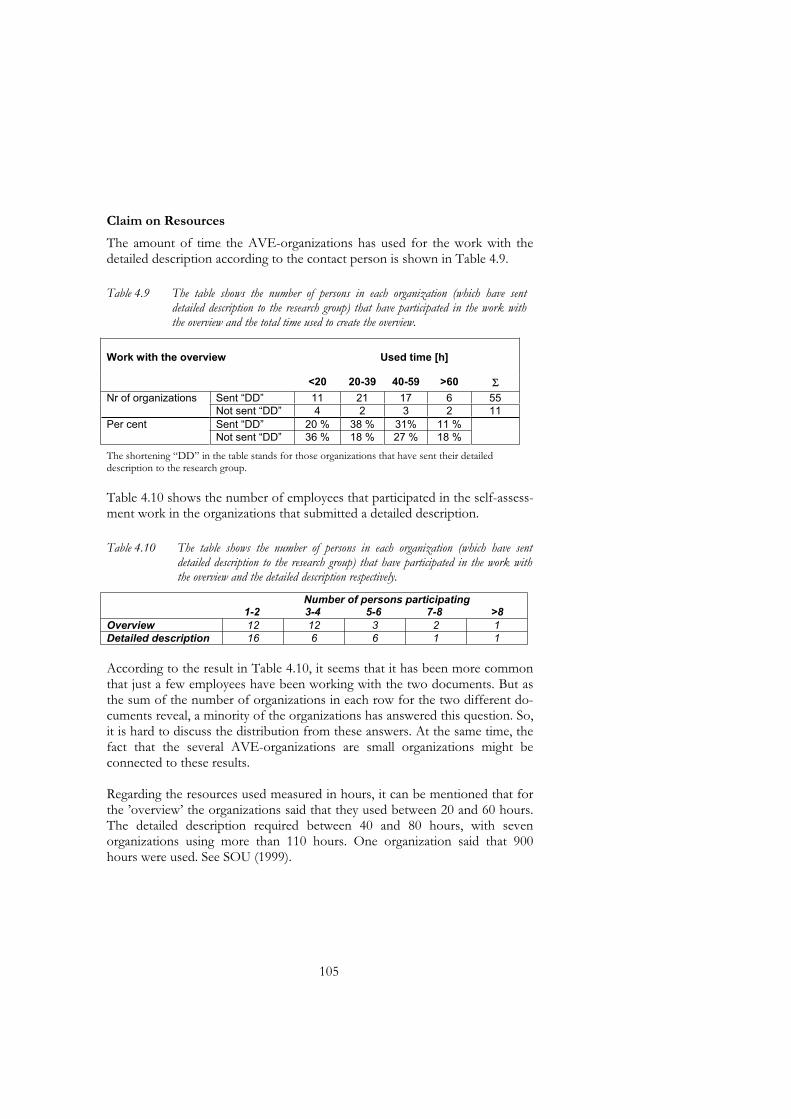
105
Claim on Resources
The amount of time the AVE-organizations has used for the work with the detailed description according to the contact person is shown in Table 4.9.
Table 4.9 The table shows the number of persons in each organization (which have sent detailed description to the research group) that have participated in the work with the overview and the total time used to create the overview.
Work with the overview
Used time [h]
<20 20-39 40-59 >60 Σ Nr of organizations Sent “DD” 11 21 17 6 55
Not sent “DD” 4 2 3 2 11
Per cent Sent “DD” 20 % 38 % 31% 11 %
Not sent “DD” 36 % 18 % 27 % 18 %
The shortening “DD” in the table stands for those organizations that have sent their detailed description to the research group.
Table 4.10 shows the number of employees that participated in the self-assess-ment work in the organizations that submitted a detailed description.
Table 4.10 The table shows the number of persons in each organization (which have sent detailed description to the research group) that have participated in the work with the overview and the detailed description respectively.
Number of persons participating 1-2 3-4 5-6 7-8 >8
Overview 12 12 3 2 1 Detailed description 16 6 6 1 1
According to the result in Table 4.10, it seems that it has been more common that just a few employees have been working with the two documents. But as the sum of the number of organizations in each row for the two different do-cuments reveal, a minority of the organizations has answered this question. So, it is hard to discuss the distribution from these answers. At the same time, the fact that the several AVE-organizations are small organizations might be connected to these results.
Regarding the resources used measured in hours, it can be mentioned that for the ’overview’ the organizations said that they used between 20 and 60 hours. The detailed description required between 40 and 80 hours, with seven organizations using more than 110 hours. One organization said that 900 hours were used. See SOU (1999).

106
4.7 Results from Evaluation of the
Overall AVE-evaluation
During the overall AVE-evaluation the research group had several different contacts with the AVE-organizations. From these the group to some extent received the AVE-organizations’ opinions about the different parts of the overall AVE-evaluation. However, after the overall AVE-evaluation was finished in 1999 and the final report SOU (1999) was published, the AVE-evaluation work itself was evaluated by the group during spring 2000. This evaluation is also described by Lindell & Svensson (2002).
The evaluation of the AVE-evaluation was made by an employee, independent of the research group, at Luleå University of Technology, using telephone interviews; see Appendix QAVE2. The 22 organizations, which had been working with self-assessment using ‘Läroverket AVE-version’ and also got site visits by the research group, participated in this evaluation.
In each one of these organizations the contact person was interviewed. Since the answers to a large extent were connected to their use of ‘Läroverket AVE-version’, it might be interesting to study the results from this evaluation as a part of this thesis too.
The main results from the evaluation of the AVE-evaluation can be presented as in Figure 4.25. During the telephone interviews the respondents had to estimate their opinion about the AVE-evaluation by judging two different va-riables in a scale. The procedure is described more in Section 4.4.2.
4.7.1 Findings from the Evaluation about the Overall AVE-evaluation
Of the educational organizations consulted, all 22 respondents answered the first part of the telephone inquiry; see Section 4.4.2. However, two respondents chose not to answer the second part of the inquiry with fixed alternative responses with Likert scales, which gave a response frequency of 91%.
The investigation shows that 65% of the respondents considered the work of the research team, built on the system-evaluation model, as an instrument to inspire confidence and contribute to renewal.
The overall picture of the results of the study in Figure 4.24 shows that ten of the respondents (50 %) denoted the work of the research team as forward-

107
pointing. Five respondents (25%) considered it backward-pointing. The rest of the respondents were uncertain. Sixteen (80%) had confidence in the evaluation and three (15%) exhibited mistrust. All ten who indicated forward-pointing evaluation also exhibited confidence in the process. 50 % of the sample denoted the research team as Type III (“angels”). No one identified the team as Type IV (“demons”) although two respondents were on the bor-derline in the matrix.
Looking closer at the organizations that express the evaluation of the research team with confidence and as forward-pointing in the matrix, the data does not give any evidence that the organizations have something in common that could explain the concentration. However, a geographical analysis indicates that there is a tendency for organizations near Luleå University of Technology to indicate a greater confidence.
Pointing backward Pointing forward
Con
fid
ence
Mis
tru
st
X
X
X
X
XX
X
X
X
X
X
X
X
XXX
X
X
X
X
Figure 4.25 Overall picture of the respondents’ attitude to the work of the evaluation team. Each cross represents one organization. These attitude data have been summarised in two box-plots, one for each of the pair of concepts. The dotted lines in each box show the median value. The boxes embrace 50% of the answers. The lines outside the boxes show highest and lowest values, and the dot in the end of the dotted line is an outlier. (From Lindell & Svensson, 2002)
On the other hand, looking at the organizations that express mistrust in the matrix, two of the three are private companies. If the organization in Figure 4.25, which lies on the boundary between ‘confidence’ and ‘mistrust’, also is included in mistrust group, the result is that three of the four who lack confidence in the evaluation project are private companies. This is a little bit surprising. Even if the evaluation covers more than the self-assessment
108
process, the self-assessment was a fairly large part of the evaluation and the TQM ideas have come from the private sector to the public one. Therefore it might be expected that organizations in the private sector should be more ‘positive’ than those in the public.
Furthermore, it is also worth to note that three of the five organizations, which say that the evaluation project has not been forward-pointing have chosen not to work with ‘Läroverket AVE-version’. The study indicates that the AVE-organisers are satisfied with the evaluation work by the research group. However, there are some conceivable sources of error that should be mentioned.
4.7.2 Reliability and Validity
The first possible source of error is, of course, the small and selective choice of respondents, and given that the selection constitutes only 16% of the population, the results should be approached with caution. A second possible source of error is that the selected group, which was chosen, had participated in the evaluation team’s site visits. Thus they have good knowledge of the method of working but, in addition, one cannot ignore the likelihood personal contacts and conversations have toned down earlier critical opinions.
Another source of error is connected with the instructions for design of the measuring instrument. The analysis of the interview transcriptions that was done afterwards showed that a number of the respondents had clearly been bent on giving their judgement of ‘Läroverket AVE-version’ and its use, in spite of the study being concerned with their views on the work of the evaluation team as a whole.
However, the study carried out shows that a majority of the respondents perceive the work of the evaluation team as both forward-pointing and confidence-inspiring. In terms of the evaluators’ roles the work has been perceived by most of the respondents as of Type III. There is thus support for the use of models of the systems-evaluation type based on an interactive and learning attitude.

109
Chapter 5
The AEI-project his chapter presents and discusses the second project about self-assessment in educational organizations, the AEI-project, performed in a number of Adult Education Initiative (AEI) organizations. Firstly, the background of the AEI,
including the governmental frames is described. Then, the use of self-assessment in the AEI-project is presented, and, finally, the evaluation work of the project is presented.
5.1 Background of the AEI
The Adult Education Initiative, AEI, (‘Kunskapslyftet’) was a five-year programme in adult education and training initiated by the Swedish government in July 1997. It was primarily aimed for unemployed adults who needed to increase their knowledge at an upper secondary level, giving participants’ job-related skills.
The main target group for this education was unemployed adults with less than three years of upper-secondary school education. The aim was to enable people to acquire improved self-confidence and to increase their emp-loyability. The programme was designed to assist participants in achieving necessary qualifications and competence to study at a higher level, and to lay the foundations for life long learning.
The responsibility to create conditions that can enable these objectives to be reached lies at the municipal authorities, which are imposed to build an infra-structure for learning that corresponds to the needs of the individual and society. To be able to fulfil this task the municipal authorities receive earmarked state funding.
The AEI project went on during 1997-2002 and altogether about 1 million adult people, on part time or full time basis, got financial support to increase their education to an upper secondary school level. The total cost of the investment was about 42 billion SEK, of which 19 billion was given as support to municipalities and the rest was financial support to those following the
T

110
courses and programmes. Of the participants, about 20% were born abroad and about 60% were older than 30 years13.
5.2 Use of self-assessment in AEI
5.2.1 Background
The experiences from the AVE-project combined with the growing interest in self-assessment in private and public organizations were the background for the initiative from the Swedish Association of Local Authorities (‘Svenska Kommunförbundet’) to start a pilot project on self-assessment in AEI-organizations. The AEI-project was then created to realise this idea, with the aim to spread knowledge about self-assessment in AEI-organizations while further examining the use of ‘Läroverket’ in educational organizations. The AEI-project was managed by people from the Division of Quality and Environmental Management together with Mats Söderberg14 from the Swedish Association of Local Authorities, and with financial and moral support from the National Agency for Education (‘Skolverket’) and the Commission for Adult Education and Training (‘Kunskapslyftskommittén’)15.
In contrast to the AVE-project, where the use of self-assessment was an integrated part of the overall AVE-evaluation of the AVE pilot project, the AEI-project comprised self-assessment work only in order to gain possibilities for improvement for each one of the participating organizations.
The AEI-project started in August 1999 and was going on until September 2000. During this period, the participants from the AEI-organizations worked with self-assessment.
A particular tool, called ‘Läroverket 1999’, was developed as a basis for the self-assessment work. ‘Läroverket 1999’ is based on ‘Läroverket AVE-version’. The differences between those two tools are described in Section 5.3.
13 From www.svd.se/dynamiskt/inrikes/did_7917337.asp14 Mats Söderberg was at that time strongly involved in the Swedish School Award (‘Utmärkelsen Svensk Skola’) and very well familiar with the ideas of self-assessment. 15 The reference group consisted of Magnus Svensson and Bengt Klefsjö, Luleå University of Technology, Mats Söderberg, the Swedish Association of Local Authorities, Åsa Sohlman, the Commission for Adult Education and Training, and Dan Fagerlund, the National Agency for Education.

111
The participating organizations were from the public sector as well as from the private sector. They had their activities at different places in the southern part of Sweden16.
5.2.2 Accomplishment of Self-assessment in AEI
During the project, people from the participating organizations met in Stockholm, at the Swedish Association of Local Authorities (“Svenska Kommunförbundet”) or near their main office, for information, education and discussions, for six days on five different occasions. These meetings were held before each one of the four self-assessment phases shown in Figure 2.9. The project plan was based on the model of self-assessment17 and experiences from the AVE-project18. The time schedule for the project is illustrated in Figure 5.1.
1999 2000 Sept Okt Nov Dec Jan Feb Mars April May June July Aug Sept
Planing & decision (Phase 1)
Describing (Phase 2)
Analysis of the description (Phase 3)
Planning of actions (Phase 4)
Improvement work
Figure 5.1 Time schedule for the self-assessment project with ‘Läroverket 1999’ for the participating AEI-organizations. The activity-charts shortened with “S”, “G1”, and “G2” refer to “start up meeting”, “Gathering 1”, and “Gathering 2”, respectively. The two activities called ”T 1”and ”T 2” refer to training sessions regarding how to describe and analyse, respectively, when using ‘Läroverket 1999’.
16 The participating organizations were, for instance, from Järfälla, Växjö, Herrljunga and Kristianstad. 17 See Chapter 2. 18 See Chapter 4.
2/9Start up meeting
24/2Gathering 2
28/10 Gathering 1
30/9 T 1
24 & 25/11 T 2
projectfinished

112
5.2.3 Training in TQM and Self-assessment
Experiences from the AVE-project (see Chapter 4) had shown a need for improvement of the education about self-assessment for participating organizations. Therefore, the amount and structure were changed in this project compared to the AVE-project. The total time spent for educations and discussions were here six days instead of three days. Two new occasions, called ‘gatherings’ below, were used to exchange experience between the organizations and to answer questions and give support from the project team. The material used, for instance the fictive case used in discussions, was also revised and enlarged.
Since the AEI-project was not connected to any other aim than just to support the participating organizations with their quality work and to study their experiences, there was probably not any anxiety about the reasons for doing the assessment work as in the AVE-project.
Start-up Meeting
The first meeting in Stockholm was held to introduce the project and to give the AEI-organizations a base for their decision making about participation in the project. This meeting comprised one day. Besides presentation of facts about the project, the concept of TQM was presented. This was done to give a theoretical frame of knowledge before the self-assessment work would start.
This meeting can be seen as part of the ‘planning’ phase, the first of the four phases of self-assessment in Figure 2.9. After this meeting, the organization had to decide whether it should join the project or not. In the case an organization decided to participate, it had to plan for the work, when the work should be done and by whom.
At this meeting 15 organizations were represented with 33 people all together. Of these, 12 organizations participated in the first training session T1 (see below), but another two or three disappeared later on from the project; Fredriksson & Svensson (2000).
T1 – the first training session
This first training session focused mainly on the second phase of self-assessment, how to describe the organization by answering the questions in ‘Läroverket 1999’. The session included a lecture, group work and discussions during one day. Here more emphasis was put on discussions and exercises than in the AVE-project.

113
Gathering 1
This first gathering was aimed at helping the organizations with their descrip-tions. The intention was to let the participants ask questions about different difficulties they had experienced during their work after the first training ses-sion and to discuss and have support in their work. This type of meetings was not included in the AVE-project.
T2 – the second training session
The second training session consisted of two days while learning about and working with phase 3, how to analyse the description of the work in the own organization made during the previous phase. The training was to some extent a lecture, but mainly the participants had to learn how to analyse by individual work with fictive cases and thereafter by consensus work in groups using the cases in order to get a common view. Also this training session was more comprehensive than during the AVE-project.
Gathering 2
The second gathering was also the final meeting in the AEI-project. Now the participating AEI-organizations were helped with their analysis work. The main purpose was to describe possible ways to continue the quality work by improvement work, and the developed planning schedule19, showing sug-gestions on how to plan the fourth phase, was presented. Connected to this presentation several TQM-tools for handling data were described. The participants also worked in groups using affinity diagrams; see Brassard & Ritter (1994).
Feedback
Besides the training and gathering sessions, the participating organizations had the opportunity to get advice about how to improve the descriptions by sending their descriptions to the author of this thesis during phase 2. These descriptions were obtained by answering the questions in ‘Läroverket 1999’.
5.3 The Tool ‘Läroverket 1999’
When the AEI-project was initiated, it was decided that a modified version of ‘Läroverket AVE-version’ should be used as self-assessment tool. Due to lack of time and financial resources, it was decided that no thorough changes should be made. All text about AVE should, of course, be removed and the
19 See Chapter 8.3.

114
experiences that was gained from the AVE-project should as much as possible be used for improvements in ‘Läroverket 1999’.
5.3.1 The Different Parts of ‘Läroverket 1999’
Here the similarities and differences between ‘Läroverket AVE-version’ and ‘Läroverket 1999’ are described, divided into the different parts of the tool. See Svensson (1999) for a complete version of ‘Läroverket 1999’.
The Value Base
‘Läroverket 1999’ is based on the same values as ‘Läroverket AVE-version’. The reasons are also same.
The Overview
The overview in ‘Läroverket 1999’ was reduced compared to the AVE-version. The main reason was the experiences from the AVE-project saying that ‘Läroverket AVE-version’ was too extensive for small organizations. To some extent the reduction was done by cutting AVE-specific questions.
The Model for ‘Läroverket 1999’
The model for ‘Läroverket 1999’ is to a great extent the same as the model for ‘Läroverket AVE-version’. The triangular part is the same, but some changes have been made in the circular part. The main change is the new name of the fourth dimension, which has been changed from ‘evaluation’ to ‘reflection’ in order to separate the different kinds of evaluations in the self-assessment procedure.
A graphic change of the circular part of the model is that the right part is drawn as four separate curves to symbolise that the questions about ‘approach’, ‘deployment’, and ‘result’ are connected to each one of the individual area-questions. The right part of the circular part is filled white to show that the last two questions in each of the areas are comprehensive and embrace reflection and improvement, respectively, about all the area-questions in the particular area. Another graphical change is that the dimension ‘result’ is put in a smaller ellipse to show that it refers to fixed data and not actions as for the other four dimensions.

115
Dep
loym
ent
Approach
Impro
vem
ent
Reflection
Result
CustomerCo-operation
Employee commitment
Management of processes
Lead
ership
Figure 5.2 The model used for ‘Läroverket 1999’. The model has two main parts. The triangular part shows the areas in an organization’s business that should be assessed and the circular part describes the five different dimensions that are used to do the assessment. In this figure the words in the model are translated into English from the Swedish model in Svensson (1999).
The Four Areas
The four areas in ‘Läroverket 1999’ are the same as in ‘Läroverket AVE-ver-sion’, namely: Customer co-operation, Leadership, Employee commitment, and Management of processes. The structure of the areas in the model of ‘Läroverket 1999’ is kept as well.
The Assessment Dimensions
On a higher level, one change was made about the assessment dimensions. As mentioned, the name of the fourth dimension was changed from ‘evaluation’ to ‘reflection’. In other respects, some minor shifts were made on a more detailed level in the descriptions on how to use the dimensions. That description was put in the ‘Help notes’.
The Dimension ‘Approach’
The first of the five dimensions in ‘Läroverket 1999’ is ‘approach’ and the use is almost the same as in ‘Läroverket AVE-version’. One change is that not only the “what”-question and “how”-question are asked, but also a “why”-question, in order to stimulate reflection of the people using the tool and also

116
to facilitate a comparison to the results described in the dimension ‘result’. The “why”-question asks of the purpose of the approach.
The Dimension ‘Result’
Also in ‘Läroverket 1999’ a sub-question about results is asked in every one of the individual questions in the four areas (see Figure 5.3) and the dimension ‘result’ is connected direct to the dimensions ‘approach’ and ‘deployment’. Sub-questions, individual questions, and area-questions are discussed below in Section 5.4.2.
Result, on a higher level, as output from a number of approaches, for instance whether the customers are satisfied or not, is important to describe as well. For some of the questions in ‘Läroverket 1999’ therefore two types of results should be described and analysed.
The Dimension ‘Reflection’
For similar reasons as in ‘Läroverket AVE-version’, a fifth dimension is used in ‘Läroverket 1999’. Instead of the fourth dimension ‘evaluation & improvement’ in the Springboard (Hellsten, 1997b), the two dimensions ‘reflection’ and ‘improvement’ are used in ‘Läroverket 1999’.
As one of the results from the AVE-project, the name of the fourth dimension was changed, from ‘evaluation’ (‘utvärdering’ in Swedish) to ‘reflection’ (‘reflektion’ in Swedish). The reason for making this change was that the word ‘evaluation’ (‘utvärdering’) was used for several different activities, which made people confused.
The Dimensions’ Connection to Learning
Another perspective on the dimensions is their connection to learning. Generally, there are similarities between dimensions in different self-assess-ment models, the PDSA-cycle, and the learning cycle by Kolb (1984), see, for instance, Hellsten (1997a). When developing the dimensions in ‘Läroverket 1999’, the learning model by Swieringa & Wierdsma (1992) and shown in Chapter 2 was used as a base to some extent. The part of that model called ‘behaviour’ has connections to the two dimensions ‘approach’ and ‘deployment’, with reference to “correction of individual learning” when rules are not followed. However, the dimension ‘approach’ also is connected to the part ‘rules’ in the model by Swieringa & Wierdsma (1992). That is about existence of ‘approaches’ and developing this might be referenced to ‘single-loop learning’. The ‘double-loop learning’ and the ‘triple-loop learning’ might be connected to the two dimensions ‘reflection’ and ‘improvement’, respectively. See ‘Läroverket 1999’, where the dimensions are specified.

117
The Area-questions
Basically, the area-questions that are put in each one of the four areas of ‘Läroverket 1999’ are the same as in ‘Läroverket AVE-version’. But they were reworked in three ways, mainly, in order to make the tool more general for educational organizations.
Firstly, all uses of the name AVE, have been deleted. Secondly, the questions asked in ‘Läroverket AVE-version’ in order to use the tool for gathering data for the research group and not directly based on the values of TQM have been cut. Thirdly, some minor wordings have been changed to clarify the questions.
Examples of questions from the area ‘Customer Co-operation’ in ‘Läroverket 1999’ are presented in Figure 5.3. In this case, the questions number 1 and 4 are examples of area-questions. Each of these contains the three type-questions, marked A, D and R. Questions 9 and 10 are type-questions.
1
4
9
10
CUSTOMER CO-OPERATION
In what way do we get and use facts about present needs,
requirements and wishes regarding the educations we offer
and which can be obtained from the following groups:
A How are we working?D To what extent do we do it?R What results does the deployment of the approach lead to?
In what way do we measure and analyse how satisfied or
dissatisfied our customers are?
A How are we working?D To what extent do we do it?R What results does the deployment of the approach lead to?
How do we reflect up on the approaches, deployments
and results that we have described within customer
co-operation?
How do we perform improvement work from out of the
reflection, regarding customer co-operation?
…
…
Figure 5.3 Examples of questions from ‘Läroverket 1999’. The questions are from the area ‘Customer co-operation’. However, the structure is the same within all the four areas. Translated from Svensson (1999).

118
The ‘Help-notes’
In the light of what has been mentioned about the five dimensions, some improvements were made in the ‘help-notes’, in order to correspond to the changes in the dimensions. Also, some other small changes were made in order to make it easier to understand and use the describing help.
The Evaluation Matrix
In accordance with the discussions about use of evaluation matrix in ‘Läroverket AVE-version’, it was decided that such a matrix should be developed for use if the participated organizations should want to use it, but the pros and cons with such a solution was discussed during the training session about the analysis phase and it was decided not to use such a matrix within the project.
An Improvement Planning Schedule
Before discussions about phase four in self-assessment with the representati-ves from the educational organizations in the AEI-project, it was decided that this phase should benefit from being more structured.
Therefore, a suggestion to improvement planning schedule was developed. The main idea of the schedule is based on the importance of emphasizing “thevital few of the useful many”, with reference to Juran (1995). The six suggested steps were: sorting out, reducing, seeking causes, measurement taking, conse-quence marking, and measurement planning. The schedule can be seen in Ap-pendix SPh4.
The work should be carried out by using different TQM tools, as Pareto diagram, Ishikawa diagram, affinity diagram, tree diagram, and matrix diagram. These tools are often placed in the two toolboxes named ‘The Seven Quality Control Tools’ and ‘The Seven Management Tools’, respectively. These tools and toolboxes are described by, for instance, Bergman & Klefsjö (1994), Brassard & Ritter (1996), and Klefsjö et al. (1999).
5.4 Research Design of the AEI-project
In this section a description of the research design of the AEI-project in four phases is given. This can be seen as the second lap around the PDSA-cycle illustrated in Figure 2.6. The research methodology in this project was similar to that for the AVE-project.

119
Plan
During this phase the research project was planned and prepared. A slightly modified version of the questionnaire that had been used in the AVE-project was also used for the AEI-project. That gave a possibility to compare the impressions from the two projects.
The results from the AEI-project discussed in this thesis are coming from questions that are used in both the AVE-questionnaire and the AEI-questionnaire; see Appendix QAEIa and QAEIb.
Do
The questionnaires were sent by ordinary mail to all the persons in each one of the AEI-organizations20 that participated in the training sessions about self-as-sessment and how to use the tool ‘Läroverket 1999’.
Study
During this phase the analysis of the data gathered by the questionnaire was accomplished. This was done by use of both one-dimensional and two-dimen-sional tables. The first type of tables was used for frequency analysis and the second type for cross-question analysis.
Act
In this phase, conclusions about the use of self-assessment in educational organization were drawn based upon the previous analysis. The conclusions are presented in Section 5.5.
5.5 Results from the AEI-questionnaire
To evaluate the AEI-project, three questionnaires were used. The first one was sent in the beginning of the project before the first meeting, the second one after the fist gather meeting and the third after the second training session T2. In all three cases two reminders have been sent in order to get as many answers as possible. The idea was that it might be feasible to study how the persons using ‘Läroverket 1999’ in the self-assessment process have experienced the work in different ways.As a few organizations did not attend the last meetings, the second gathering, it is not easy to use all the numerical data that was collected. Therefore, just some results from the AEI-project are discussed in this thesis and used for
20 This means that in some cases more than one answer is from the same organization.

120
some comparisons in Chapter 10. More information of the AEI-project can be found in Fredriksson & Svensson (2000).
The first questionnaire asked about background variables, like pre-knowledge. In the second questionnaire, divided into two parts, the AEI-organizations were asked about the experiences with the self-assessment work. The first part was answered by 15 of 17 people and the second one by 14 of the 15 people participating in the meetings. Figure 5.4 shows how people in the AEI-organizations looked at the resources used compared to the results obtained. This questionnaire was answered at a similar time point of the self-assessment procedure as in the AVE-project.
When studying the answers about used resources compared with obtained results (see Figure 5.4), it is obvious that they look upon this work in a positive manner, since more than 70% said that the self-assessment has given benefits. The other four say that the work has neither been good nor of any use. Here it is important to remember that the self-assessment process has just passed phase two at the most.
Evaluationof the work with "Läroverket 1999"
2
6
2
0 0 0
4
0
1
2
3
4
5
6
7
Very
useless
Very
useful
Nu
mb
er
of
pe
rso
ns
Figure 5.4 The figure illustrates how the participating persons from the different AEI-organizations, which have used ‘Läroverket 1999’, assess the value of the work when they compare the used resources with the results of the work.
Figure 5.5 shows that more than 90% of the respondents said that they found improvement possibilities through the self-assessment work within the AEI-project.

121
14
1
Did f ind
improvements
Did not f ind
improvements
Figure 5.5 Almost everybody meant that they found improvement possibilities through the self-assessment work in the AEI-project.
As in the AVE-project a number of attitude questions were included to study the experiences of certain concepts and tools used in the project. Some results are illustrated below.
The summary in Figure 5.6 shows that the self-assessment in the AEI-project has been perceived as positive by most of the participating persons regarding most parameters used in the question. The lower marks concerning “confu-sing-clear” is, in some way, expected as the working procedure was not familiar and the thoughts were new to many persons in the AEI.
Self-assessment by using ‘Läroverket 1999’ is:
Scale: 1 2 3 4 5 6 7 Mean on scale 1-7
Bad - - 2 2 3 5 1 Good 5,1
Uninteresting - - - 2 3 3 4 Interesting 5,8
Confusing 1 2 5 3 1 1 - Clear 3,3
Worthless - - - 4 3 3 3 Valuable 5,4
Irrelevant - 1 2 2 2 4 2 Relevant 4,9
Not useful - - 2 3 4 2 2 Useful 4,9
Superficial - - 1 5 1 3 3 Thorough 5,2
Inefficient - - 3 3 3 3 1 Efficient 4,7
Figure 5.6 Summary of how the AEI-organizations have conceived the work with self-assessment according to ‘Läroverket 1999’.
In Figure 5.7 the attitudes towards the four areas in ‘Lärostegen’ are shown, in Figure 5.8 the attitudes towards individual questions and in Figure 5.9 the attitudes towards the ‘customer concept are illustrated.
Scale

122
1 2 3 4 5 6 7
Bad 0 0 1 1 2 4 6 Good
Uninteresting 0 0 1 1 2 5 6 Interesting
Confusing 0 0 4 1 6 4 0 Clear
Worthless 0 0 1 2 3 6 3 Valuable
Irrelevant 0 0 1 1 5 5 3 Relevant
Not useful 0 0 3 0 5 5 2 Useful
Superficial 0 1 3 2 1 6 2 Thorough
Inefficient 0 0 1 4 5 4 1 Efficient
Figure 5.7 The attitudes towards the four areas used in ‘Läroverket 1999’.
As a summary, the attitudes are positive to the four areas. The four areas are considered ‘good’, interesting’ and ‘valuable’ by most respondents.
Scale 1 2 3 4 5 6 7
Bad 0 1 1 3 4 4 1 Good
Uninteresting 0 0 1 4 0 7 2 Interesting
Confusing 0 4 4 2 3 0 1 Clear
Worthless 0 0 1 5 1 5 2 Valuable
Irrelevant 0 1 2 2 4 4 1 Relevant
Not useful 0 0 2 3 6 3 0 Useful
Superficial 0 1 1 5 1 4 2 Thorough
Inefficient 0 0 4 4 1 5 0 Efficient
Figure 5.8 The attitudes towards the individual questions used in ‘Lärostegen 1999’.
The attitudes towards the individual questions are a little bit more hesitating. They are experienced ‘interesting’, ‘valuable’ and ‘relevant’ , but not that ‘clear’.
Scale 1 2 3 4 5 6 7
Bad 2 3 0 4 1 1 4 Good
Uninteresting 1 1 1 2 2 3 3 Interesting
Confusing 3 2 3 1 0 1 4 Clear
Worthless 1 1 0 6 1 1 4 Valuable
Irrelevant 1 1 2 4 1 0 5 Relevant
Not useful 2 0 1 4 3 1 4 Useful
Superficial 2 3 1 4 0 3 1 Thorough
Inefficient 2 0 2 4 1 2 3 Efficient
Figure 5.9 The attitudes towards the applicability of the ‘customer’ concept within educational organizations.

123
Use of the ‘customer’ concept in educational organizations is, as a short summary, considered ’valuable’ and ‘useful’, but ‘confusing’ and ‘ superficial’.
5.5.1 Impressions of Meetings with Persons from AEI-organizations
The main impression by the author of this thesis is that persons from the AEI-organizations that did participate until the last meeting in general considered self-assessment as useful. But still in this project, the tool ‘Läroverket 1999’ was seen as too extensive, despite the fact that some parts have been reduced as a result of the AVE-project. The questions were experienced as too many, which result in too much work and that the work became too drawn-out, at least for some organizations. This might point towards a need for a self-assessment tool that is even more reduced with reference to the number of questions, for instance. Another thing about ‘Läroverket 1999’, is that some participants felt that some questions were over-lapping.
124
Chapter 6
The USS-project
n this chapter the USS-project is described, i.e. a self-assessment project performed at four different units within the Upper Secondary School in Luleå
municipality. First, the background to the project is described, then the self-assessment project and the tool developed and used in the project, called ‘Lärostegen’. Finally, the research design and the obtained results are discussed.
6.1 Background of the USS-project
Early in 2001 discussions were held between municipality representatives from the Upper Secondary School in Luleå and Luleå University of Technology about a school development project. The project was intended to document and stimulate a change in organization and location of the Upper Secondary School in Luleå as well as stimulate quality improvements. As one part of this project, self-assessment within the Upper Secondary School was planned. The part of the project, which is dealt with here, is the self-assessment project on an organizational level at each one of the four upper secondary school units within Luleå municipality21.
The work within the self-assessment part of the project consists, in turn, of two parts. One is the self-assessment work performed at the different school units. The other one is the research performed related to the self-assessment and the tool used in order to get experiences and opinions about the values, methodologies and tools used.
21 The other part of the project dealing with the documentation of the organizational change of the Upper Secondary School is performed by people at the Division of Industrial Work Environment and is not commented upon in this thesis.
I

125
6. 2 Use of Self-assessment in USS
6.2.1 Accomplishment of Self-assessment
The planning of the project started with two meetings between the municipali-ty head of the upper secondary school in Luleå and two persons representing Luleå University of Technology22. Discussions during these meetings led to proposal and financing of a five-years long project that should include two separate occasions of self-assessment (two laps in Figure 2.9) with improve-ment work between. Each one of the four upper secondary school units should carry through self-assessment within their own organization and the descriptions should be exchanged between the units during the analysis phase, partly in order to learn from each other.
The idea that TQM-based self-assessment should be accomplished at each one of the four upper secondary school units as part of the school development project in Luleå municipality was created by the municipality head of upper secondary school together with the representatives from Luleå University of Technology. The self-assessment project and its time plan was then discussed and rooted in the managerial group. The impression of the author of this thesis is that the group was fairly enthusiastic and looked forward to the start. The headmasters also declared that it was important to include all the staff, and possibly also pupils, in the self-assessment work.
The details of the first lap are illustrated in Figure 6.1. This proposal was then discussed further with the group of ten headmasters at the four upper secondary school units. The new tool ‘Lärostegen’, which should be used in the project (see Section 6.3), was also presented and discussed.
During the autumn 2002 the self-assessment project was launched by the mu-nicipality head of the upper secondary school as a part of the work with qua-lity issues.
The municipality head of the upper secondary schools and the ten headmas-ters23 at the four units constituted the managerial group that decided to carry out the self-assessment project. A number of meetings were held with the representatives from Luleå University of Technology.
22 The different organizational levels in the school system are illustrated in Figure 6.14, which will be commented upon in the analysis later on. 23 At each one of the four upper secondary school units two or three headmasters were working.
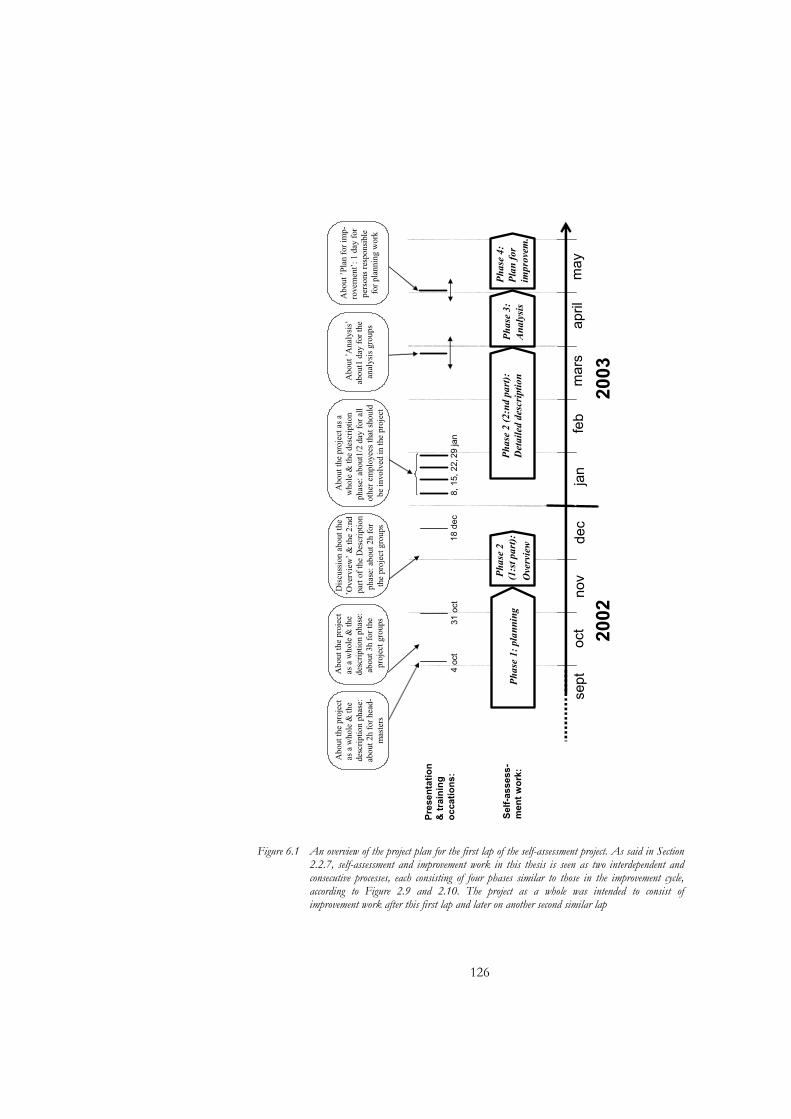
126
Pre
sen
tati
on
&
tra
inin
go
cca
tio
ns
:
20
03
sept
oct
nov
dec
jan
feb
mars
april
ma
y
20
02
Abo
utth
e pr
ojec
tas
a w
hole
& th
e de
scri
ptio
nph
ase:
abou
t2h
for
hea
d-m
aste
rs
Abo
utth
e pr
ojec
tas
a w
hole
& th
e de
scri
ptio
nph
ase:
abou
t1/2
day
for
all
othe
rem
ploy
ees
that
sho
uld
be in
volv
edin
the
proj
ect
Abo
ut’A
naly
sis’
abou
t1 d
ayfo
r th
e an
alys
isgr
oups
Abo
ut’P
lan
for
imp-
rove
men
t’:
1 da
yfo
r pe
rson
s re
spon
sibl
efo
r pl
anni
ngw
ork
Abo
utth
e pr
ojec
tas
a w
hole
& th
e de
scri
ptio
nph
ase:
abou
t3h
for
the
proj
ect
grou
ps
Self
-asse
ss-
men
t w
ork
:P
ha
se1
: p
lan
nin
gP
ha
se2
(2
:nd
pa
rt):
Det
ail
edd
escr
ipti
on
Ph
ase
3:
An
aly
sis
Ph
ase
2
(1:s
t p
art
):
Ove
rvie
w
4 o
ct
31 o
ct
8,
15,
22,2
9 jan
Dis
cuss
ion
abou
tthe
’O
verv
iew
’ &
the
2:nd
part
of
the
Des
crip
tion
phas
e: a
bout
2h f
or
the
proj
ect
grou
ps
18 d
ec
Ph
ase
4:
Pla
n f
or
impro
vem
.
Figure 6.1 An overview of the project plan for the first lap of the self-assessment project. As said in Section 2.2.7, self-assessment and improvement work in this thesis is seen as two interdependent and consecutive processes, each consisting of four phases similar to those in the improvement cycle, according to Figure 2.9 and 2.10. The project as a whole was intended to consist of improvement work after this first lap and later on another second similar lap
127
The university representatives emphasized several times during the discussions that the USS units were ‘owners’ of their project and that the project was aimed to be help for quality improvements and cultural changes within the units. The university representatives should give support and also study the experiences and results from the self-assessment project. It was, for instance, emphasised that the units were free to choose the structure and size of the project group at the unit and that they themselves at the unit should decide who should be involved in the activities in the different phases.
To support the work with self-assessment at the four units, a number of plan-ning meetings were held with representatives from Luleå University of Technology, some of these included some form of education related to TQM and self-assessment given by the representatives from the university. These meetings could be summarized as:
• Discussions and planning with the municipality head of the upper secondary school.
• Discussion with representatives from the municipality to coordinate the self-assessment project with another project related to implementing balanced scorecards24.
• Meetings to discuss and plan education with and to the municipality head and the headmasters at the units.
• Participation at some of the days devoted to the work with self-assessment at the different units.
6.2.2 Training in TQM and Self-assessment
To support the work with self-assessment at the four upper secondary school units a number of educations have been held by the author if this thesis and Professor Bengt Klefsjö, who jointly have been the representatives from the university. These educations, except for the meetings held with the headmasters mentioned in Section 6.1, could be summarized as (see Figure 6.1):
• Education about half a day about TQM, self-assessment and the project to the project groups at the four units. Also some of the headmasters participated. This education was performed to all the project groups at the same time.
24 Balanced scorecard is a way to control the organization by focusing on several perspectives (and not only on financial terms); see Kaplan & Norton (1996). Often the four perspectives are customers, business processes, learning and growth, and financial perspectives. We will return to the balance scorecard project in the discussion part of the paper.

128
• Education for about half a day to all the staff at each one of the four units about TQM, self-assessment and the project. This was done at each one of the four units separately.
• Education for about half a day about the analysis phase. This education was performed at the different units.
The education dealing with the fourth phase, ‘plan for improvements’ (see Figure 6.1), was not performed before the interruption of the project. It is also worth mentioning here that the education within this project was not as comprehensive as within the AEI-project. One reason for that was that the headmasters meant, during the planning discussions, that sufficient resources were not available. Furthermore, the planned training on a fictive case for the project group during the education in October was deleted during the seminar due to lack of time.
In the period when the descriptions were created at the four units, two of the units asked for and got a visit by the author of this thesis. That visit lasted for a couple of hours during which questions were answered.
6.2.3 The Failure of the Project
During May 2003 the ‘description phase’ and the ‘analysis phase’ should have been finished (see Figure 6.1). At this point, the self-assessment activities decreased at the units, which now had reached different levels in the project. During the autumn 2003, there was uncertainty whether the self-assessment project should continue or not. As a result of this, a meeting was held with the ten headmasters, representatives from the school authority on municipality level and Luleå University of Technology.
The situation was discussed. All headmasters expressed that a majority of the staff at the school units wanted to stop the project and a decision was made to stop the work, or at least take a break. All people represented at the meeting agreed on the importance to take care of the experiences and therefore try to investigate why the situation has appeared.
6.2.4 Data Gathering
During the project work attitudes have been followed up using questionnaires and interviews; see Svensson & Klefsjö (2004). The different occasions at which empiric has been gathered is
• The four educational occasions, one at each one of at the four different units (January 2003).
129
• Questionnaires answered by all staff members, including the headmasters (May 2003).
• Interviews with the headmasters and the municipality head of upper secondary school in Luleå (March-April 2003).
• Questionnaire to all the staff (Autumn 2003).
6.3 Development of the Tool ‘Lärostegen’
Based on the experiences from the AVE-project and the AEI-project, the self-assessment tools used and described in Chapters 4 and 5, respectively, was revised before the start of the USS-project. The new self-assessment tool was called ‘Lärostegen’, and the main difference is that the number of questions was reduced, see Appendix LS and Appendix MSLS or Svensson (2003) for a complete version of ‘Lärostegen’.
6.3.1 The Background of the Tool ‘Lärostegen’
A large number of organizations participating in the AVE-project and the AEI-project expressed that the description work had been extensive and that the resources available, mainly in terms of labour time, had been insufficient. The organizations had not been able to allocate the resources required.
To handle this problem a new tool was developed with the aim to reduce the need of resources, but still give a complete picture of the organization’s way to work. The new tool was called ‘Lärostegen’. The basic structure of ‘Lärostegen’ is identical with that of the two versions of ‘Läroverket’, including the four areas and the five evaluation dimensions. One way to reduce the amount of resources needed when using ‘Lärostegen’, was to reduce the num-ber of assessment dimensions. A second alternative was to reduce or change the four areas included in the tool. However, such solutions would probably have broken the learning issue built into the model or changed its value base. Instead the number of questions in each of the four areas was reduced.
To express the process view and the holistic perspective in a better way a pro-cess model was used when deciding about which questions to include. This process model combined with the different questions in the tool is shown in Figure 6.2.

130
CC2MP2 MP3
L1 L2 L3EC1 EC2
Activities
Control and support
REFLECTIONIM OP
EER V
TM
N
MP1
CC1
InputCC3
EC3
Output
MP4CC3
L4EC3
Figure 6.2 A process model showing the different questions in ‘Lärostegen’. The letters combined with numbers show the different questions in the tool. See Appendix MSLS for the individual questions in “Lärostegen”. Here L means ‘leadership’, CC means ‘customer co-operation’, EC means ‘employee commitment’ and MP means ‘management of processes’.
There were a couple of reasons for the name ‘Lärostegen’, which in English roughly means ‘Learning ladder’ or ‘Learning steps’. One was to create a fairly simple tool, supporting organizations in their training and learning how to think and act in TQM-based self-assessment – a step towards improvements. The other one was to create a tool working as a help to identify areas for improvements – a ladder for organizational leaning.
Another idea behind the name was that ‘Lärostegen’ could be a link in a chain of tools supported by the Swedish Association for Local Authorities (‘Svenska Kommunförbundet’). The other tools in this chain would be the the First Step (‘Första steget’), as the simplest one, and the criteria for the Swedish School Award (‘Utmärkelsen Svensk Skola’), as the most comprehensive one.
6.3.2 The Different Parts of ‘Lärostegen’
The use of ‘Lärostegen’ in self-assessment of an organization consists of two major steps. Firstly, an ‘overview’ shall be written to acquire a description of the organization and its general structure, its common values, and who the customers are, for instance. Secondly, the work within the organization shall be described more in detail by answering four different questions within each of the four areas.

131
The Value Base
‘Lärostegen’ is based on the same core values as the two versions of ‘Läroverket’. These core values refer to Bergman & Klefsjö (1994) and are described in Chapter 2 in this thesis.
The Overview
The content of the overview in ‘Lärostegen’ was reduced compared to the two versions of ‘Läroverket’. The main reason for the reduction is the experiences from the AVE-project and the AEI-projects, respectively, saying that ‘Läroverket’ was too extensive for small organizations. The points required in the overview are:
• The organization • Customers
• Internal control documents • Learning
• Other control documents • Factors for success
• Values, policies, and rules
The Model
The model for ‘Lärostegen’ is mainly the same as the model in ‘Läroverket 1999’. The triangular part is the same, but one change has been made in the circular part. In order to elucidate the two types of results the word ‘outcome’ is used as well; see Figure 6.3.
Dep
loym
ent
Approach
Impr
ovem
ent
Reflection
OutcomeResult
CustomerCooperation
Employee Commitment
.
.
.
Management of processes
Leadership
Figure 6.3 The model used for ‘Lärostegen’. The triangular part shows the areas of an organization’s business that shall be assessed. The circular part describes the five different dimensions that are used for the assessment.
132
The Four Areas
‘Lärostegen’ is structured according to the four areas: Customer co-operation, Leadership, Employee commitment, and Management of Processes, see Figure 6.3. These areas are the same as in the two versions of ‘Läroverket’.
As in several other similar tools, there are questions asking about ‘approaches’ and their ‘deployment’ in an organization. More specific in ‘Lärostegen’ is the two types of result-questions, which are asked. The first type, called ‘outcome’, is related to the use of a certain approach. This gives a direct link between approach – deployment – outcome. The ‘outcome’ shall give an answer of whether the approach leads to what it is aimed for.
For example, if the organization uses one special approach to collect data about customer needs and expectation, the ‘outcome’ should show whether the organization really receives useful data about customer needs and expectation from that particular approach. With ’results’ means here what the gathered information shows, e.g. what needs and expectations the customers really have. Within the result dimension also general results connected to the area as a whole might be described.
The reason for putting ‘improvement’ as a special dimension is, in a similar manner as with ‘Läroverket’, to emphasize the importance of accomplishing improvement work based upon the evaluation described in the fourth dimen-sion. If no improvement work follows from the evaluation, no improvements and no learning will take place as a consequence of the evaluation in phase four. By introducing the fifth dimension, the TQM core value ‘continuous improvements’ is emphasized in the model.
The Assessment Dimensions
The circular part of the model describes the five dimensions that are used in ‘Lärostegen’. These are the same as in ‘Läroverket 1999’, besides that the result-dimension has been divided into the two different types of result-parameters called ‘outcome’ and ‘result’, instead of just describe the result-dimension as containing two types of results as it was done in ‘Läroverket 1999’.
The Dimension ‘Result’
The connection mentioned here in ‘Läroverket’ between the three dimensions ‘approach’, ‘deployment’, and ‘result’ instead implies a description of the result from a certain activity that is used to a certain extent. In this case the result contains data describing whether the used activity really gives what it was aimed to give. If the activity is about collecting data about customer

133
satisfaction, the result should show whether the organization receives know-ledge about customer satisfaction by using the activity.
However, as another result, the data from the investigation, whether custo-mers are satisfied or not, should be important to describe as well. So, for some of the questions in ‘Lärostegen’ at least two types of results should be described and analysed.
The Dimensions ‘Reflection’ and ‘Improvement’
The reason for putting ‘improvement’ as a special dimension was to emphasise the importance of accomplishing improvement work based upon the evalua-tion described in the fourth dimension. If no improvement work follows from the evaluation, no improvements and no learning will take place as a con-sequence of the evaluation in phase four. By using the fifth dimension, the TQM core value ‘continuous improvements’ is also shown more clearly in the model.
Act Plan
DoStudy
OutcomeResult
Approach
Dep
loym
ent
&
Reflection
Aim?
of
Improvem
ent
Reflection
Outcome & Result
ofw
hat
thin
gs
aredone
Impr
o
(I3& I4)
&ho
w
vem
ent
(I5)
of improvem.
Dev
elo
of
pmentsugges-
forchanges
tions
(I1
&I2
)
(I6)
vement
workof
Impr
o
improvement
(I7)
(Ref1-4
)
Figure 6.4 The connection between the five dimensions and the organizational learning might be shown by connecting them to the PDSA-cycle. The five dimensions described in Section 6.3.2, and specified in the ‘help-notes’ are placed in the spiral around the PDSA-cycle. The indexes ‘Ref 1-4’ refers to the four questions within the dimension reflection and ‘I1 to I5’ refers to the five questions within the dimension ‘Improvement’; see Appendix LS.

134
Furthermore, the sequence of phases ‘approach’, ‘deployment’, ‘outcome & result’, ‘reflection’ and ‘improvement’ is closely related to organizational lear-ning; see Swieringa & Wierdsma (1992) and Kolb (1984). So, the separation between the dimensions ‘reflection’ and ‘improvement’ is also to accentuate the connection to organizational learning. This is illustrated in Figure 6.4
The Area-questions
In each one of the four areas, there are five area-questions, formulated to stimulate the systematic work with quality improvement. The first four ask about activities connected to the area. One example of such an area-question is ‘In what way do we identify needs and expectations among our groups of customers?’ (from the area ‘customer co-operation’; see Appendix LS). Connected to each one of these area-questions, three sub-questions are asked. The sub-questions are of the type:
• How are we working (approach)? • To what extent do we do it (deployment)? • What outcome does the deployment of the approach lead to (outcome)?
Here it is shown in detail why the third dimension is divided into both ‘outcome’ and ‘result’. The outcome is about what usage of an approach leads to. By describing that, it is possible to compare it to the aim of the approach later within the analysis phase. This emphasizes the links between approach-deployment-outcome. The ‘result’, in turn, is set as the fifth area-question is also a sort of result-oriented question as well, although it is not how well an approach fulfils its aim that is the point. To explain the thought here a questionnaire can be used as an example. While the sub-question asks about how well (the outcome) the questionnaire gather knowledge about something, the fifth area-question asks about the answers from the questionnaire. Another type of results consists of those that do not directly respond to one of the area-questions, but to the area as a whole.
Finally, two questions are asked about ‘reflection’ and ‘improvement’, and these refer to the four areas as a whole.
• How do we reflect upon our approaches and deployments (reflection)• How do we work to improve our approaches and deployments
(improvement)?
All the questions together, can be described using Figure 6.5, which shows how activities, connected to the four areas, within an organization are studied. Each one of the four areas is split into four different pieces and each of them in turn is the base for an area question (Q1-Q4). These area-questions shall be
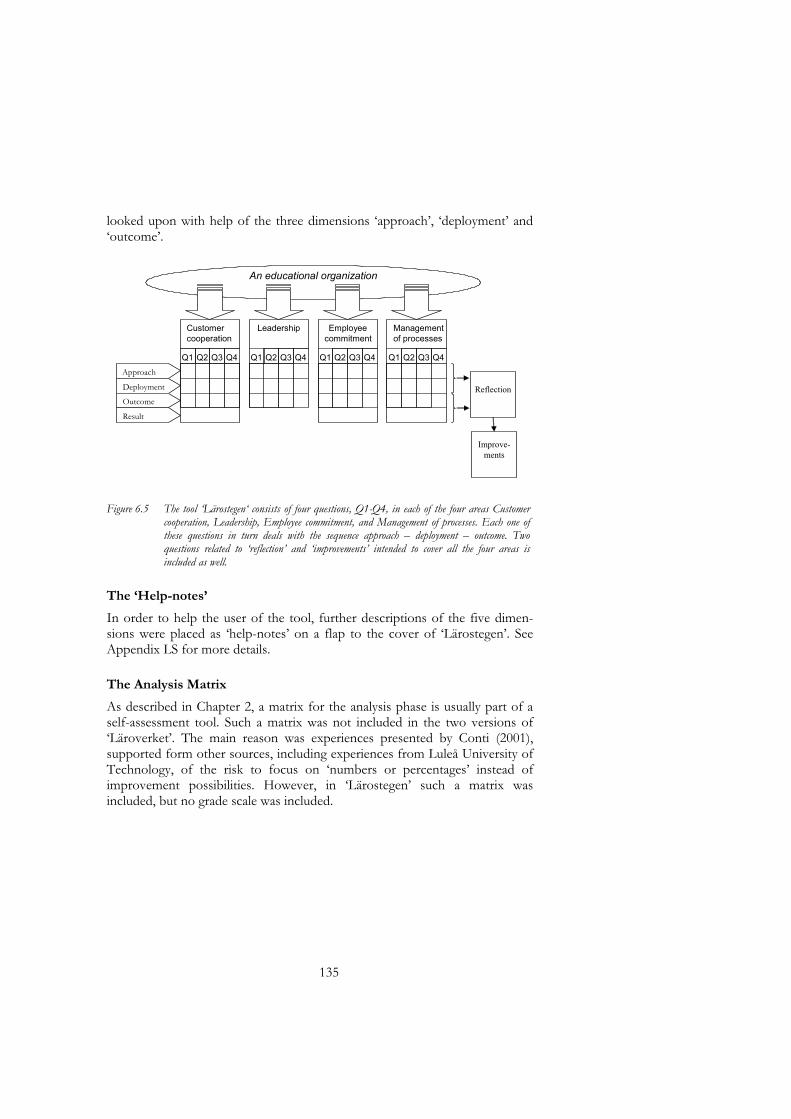
135
looked upon with help of the three dimensions ‘approach’, ‘deployment’ and ‘outcome’.
Customer
cooperation
Q1 Q2 Q3 Q4
Leadership Employee
commitment
Management
of processes
Q1 Q2 Q3 Q4 Q1 Q2 Q3 Q4 Q1 Q2 Q3 Q4
Approach
Deployment
Outcome
Result
An educational organization
Reflection
Improve-ments
Figure 6.5 The tool ‘Lärostegen‘ consists of four questions, Q1-Q4, in each of the four areas Customer cooperation, Leadership, Employee commitment, and Management of processes. Each one of these questions in turn deals with the sequence approach – deployment – outcome. Two questions related to ‘reflection’ and ‘improvements’ intended to cover all the four areas is included as well.
The ‘Help-notes’
In order to help the user of the tool, further descriptions of the five dimen-sions were placed as ‘help-notes’ on a flap to the cover of ‘Lärostegen’. See Appendix LS for more details.
The Analysis Matrix
As described in Chapter 2, a matrix for the analysis phase is usually part of a self-assessment tool. Such a matrix was not included in the two versions of ‘Läroverket’. The main reason was experiences presented by Conti (2001), supported form other sources, including experiences from Luleå University of Technology, of the risk to focus on ‘numbers or percentages’ instead of improvement possibilities. However, in ‘Lärostegen’ such a matrix was included, but no grade scale was included.

136
6.4 Research Design of the USS-project
6.4.1 Research Strategy
The work with self-assessment among the four upper secondary school units should be followed up in order to obtain experiences about TQM-based self-assessment within educational organisations. Since a lot of people, about 350 altogether, were involved at the units there might be different prerequisites and differences in methodologies used, it seemed necessary to obtain experiences and opinions from all the people involved. This implied the usage of questionnaires in order to gain data from as many persons as possible and to follow up the development and changes.
The USS-project was aimed to be in progress during five years, but it was only the first lap of self-assessment that should be used for data collecting to this thesis due to time limits. This implied a limitation for the planning of the research within the USS-project, in the sense of what data might be possible to gather. Therefore, a decision was made that a questionnaire should be accomplished after the second phase of the self-assessment work, the description phase. This questionnaire should be completed by interviews with the headmasters and the municipality head; see Section 6.5.4.
Furthermore, it was decided to use a short questionnaire directly after the educations to all employees at the four units, to get a picture of their opinion, see Figure 6.6-6.9.
The self-assessment work at the four upper secondary school units has been studied using questionnaires and interviews. These different data gathering occasions are specified below.
The First Questionnaire
Directly after each one of the educations to all employees at the four units in January 2003 (see Figure 6.1) a short questionnaire was accomplished. The questionnaire can be found in Appendix QUSS1.

137
The Second Questionnaire
A second questionnaire was used in May 2003 to evaluate factors as, for instance, background variables, participation in the educations and self-assessment work, judgement of the value with self-assessment, the own inspiration for self-assessment and improvement possibilities.
The Third Questionnaire
After the summer 2003, the USS-project had ceased and after discussions it was decided that the self-assessment work should not continue. The experien-ces that different persons had achieved during the work should however be gathered by a questionnaire as a final data collecting step within the project.
In order to investigate the experiences regarding the project among the staff within the four upper secondary school units, a questionnaire was chosen as the most feasible way to collect data. The questionnaire was created with both quantitative and qualitative questions, in order to obtain data suitable for sta-tistical analysis and to gain verbal explanations in order to complete the nume-rical picture. The qualitative part of the questionnaire constituted partly by questions with open answers and partly by the possibility to leave comments to quantitative questions.
The questionnaire was distributed to all members of the staffs at the four units. In order to get the opinions as soon as possible, the questionnaires were distributed in December 2003. However, that meant that the response rate became fairly low (about 20%) since the staff had many other duties during the last weeks of the semester.
Interviews with the headmasters and municipality head
Each one of the ten headmasters, as well as the municipality head of upper secondary school, was interviewed by the author of this thesis individually during one hour or one hour and a half. The interviews were made during March and April 2003. They were all tape-recorded and analysed. The interview questions can be found in Appendix IUSS.

138
6.5 Analysis of the USS-project
Table 6.1 illustrates the number of people at the four units and the response rate at the three questionnaires used in the evaluation.
Table 6.1 The number of employees at the different upper secondary school units and the number of answered questionnaires. It is important to note that the percentage in the table is given in relation to the number in the staff for questionnaire1 and 2 (but not questionnaire 3). For instance, the number of participants at the education in January, after which questionnaire 1 was used were about 75 at unit B, about 65 at unit C and about 40 at unit D.
A B C D Approximate number of employees
71 130 83 63
Number of answers in questionnaire 1
- 68 (53%) 50 (60%) 32 (51%)
Number of answers in questionnaire 2
39 (55%) 59 (45%) 74 (89%) -
Number of answers in questionnaire 3
13 (18%) 28 (22%) 26 (31%) 11 (17%)
6.5.1 The First Questionnaire
The first questionnaire was given to all the participants of the education at a unit in January 2003. The answers, illustrated in Figure 6.6-6.9, show some differences among the three upper secondary schools units from which data were gathered.

139
0
5
10
15
20
25
30
35
40
45
50
No, absolutely not No, with hesitation Either yes or no Yes, with hesitation Yes, absolutely
An
sw
ers
in p
erc
en
t
Unit B
Unit C
Unit D
Figure 6.6 This diagram shows the answers to the question ‘as a whole I found the education about TQM, self-assessment, and the project interesting and rewarding.
Figure 6.7 shows how the people attending the education at the different units experienced the afternoon as a whole.
When separating the different parts discussed and asking the respondents about the general presentation of quality and TQM, a majority thought it had been fruitful; see Figure 6.8. Not surprisingly, here is a correlation between these answers and the answers illustrated in Figure 6.7.
0
5
10
15
20
25
30
35
40
45
50
No, absolutely not No, with hesitation Either yes or no Yes, with hesitation Yes, absolutely
An
sw
ers
in
pe
rce
nt
Unit B
Unit C
Unit D
Figure 6.7 This diagram shows the answers to the question ‘the general presentation of quality and TQM was interesting and useful’.
The picture of the USS-project, with aim, activities and time schedule that the respondents received, seems to have been clear, according to the diagram in

140
Figure 6.8. Based on that result, it seems as the respondents got knowledge about the project and why it should be accomplished, at least they thought so.
0
5
10
15
20
25
30
35
40
45
50
No, absolut ely not No, wit h hesit at ion Eit her yes or no Yes, wit h hesit at ion Yes, absolut ely
Unit B
Unit C
Unit D
Figure 6.8 This diagram shows the answers to whether the respondents thought they got a clear picture of the aim of the USS-project.
Concerning the presentation of the overview that was carried out by the headmasters as a result of the preceding work at the unit, there are quite difference opinions among the respondents from different units, as Figure 6.9 shows.
0
5
10
15
20
25
30
35
40
45
No, absolutely not No, with hesitation Either yes or no Yes, with hesitation Yes, absolutely
An
sw
ers
in
pe
rce
nt
Unit B
Unit C
Unit D
Figure 6.9 This diagram shows the answers to whether the respondents thought the presentation of the ‘Overview’, given by the headmasters as a result of the work at the unit, was good and valuable.

141
6.5.2 The Second Questionnaire
The second questionnaire
In this section the results from the second questionnaire are presented and analysed.
The respondents were asked to estimate the value that self-assessment could bring to the unit were they worked. As shown in Figure 6.10 the answers differ to some extent. There are more respondents in unit A that think self-assessment is valuable, compared to the units B and C.
0%
5%
10%
15%
20%
25%
30%
35%
Not at
all
High
Est imat ed value f o r t he o wn unit ( A )
0%
5%
10%
15%
20%
25%
30%
35%
Not at
all
High
Est imat ed value f o r t he o wn unit ( B )
0%
5%
10%
15%
20%
25%
30%
35%
Not at
all
High
Estimated value for the own unit (C)
Pe
rce
nt
of
an
sw
ers
0%
5%
10%
15%
20%
25%
30%
35%
Not at
all
High
Estimated value for the own unit (totally for org. A, B, & C)
Pe
rce
nt
of
an
sw
ers
Figure 6.10 These four diagrams show how the respondents have estimated the value of the self-assessment-work for the own unit.
The respondents were also asked to estimate the value that self-assessment could bring to their own work; see Figure 6.11.

142
0%
5%
10%
15%
20%
25%
30%
35%
Not at
all
High
Estimated value for everyone´s own work (co-worker at unit A)
Pe
rce
nt
of
an
sw
ers
0%
5%
10%
15%
20%
25%
30%
35%
Not at
all
High
Estimated value for eryone´s own work (co-workers at unit B)
Pe
rce
nt
of
an
sw
ers
0%
5%
10%
15%
20%
25%
30%
35%
Not at
all
High
Estimated value for eryone´s own work (co-workers at unit C)
Pe
rce
nt
of
an
sw
ers
0%
5%
10%
15%
20%
25%
30%
35%
Not
motivated
Strong
motivated
Estimated motivation for accomplish self-assessment
work(tototally for org. A, B, & C)
Per
cen
t o
f an
swer
s
Figure 6.11 These four diagrams show how the respondents have estimated the value of the self-assessment-work for their own work.
The respondents were asked to estimate their motivation for accomplish self-assessment work. According to the diagram in Figure 6.12 the motivation among the respondents was not so strong in neither of the units. Totally, it seems that respondents within unit ‘C’ are less motivated than unit ‘A’, and the respondents of unit ‘B’ place themselves somewhere in between.
0%
5%
10%
15%
20%
25%
30%
35%
40%
Not
motivated
Strong
motivated
Estimated motivation for accomplishment of
self-assessment (co-workers at unit A)
Pe
rce
nt
of
an
sw
ers
0%
5%
10%
15%
20%
25%
30%
35%
40%
Not
motivated
Strong
motivated
Estimated motivation for accomplishment of
self-assessment (co-workers at unit B)
Pe
rce
nt
of
an
sw
ers

143
0%
5%
10%
15%
20%
25%
30%
35%
40%
Not
motivated
Strong
motivated
Estimated motivation for accomplishment of
self-assessment (co-workers at unit C)
Pe
rce
nt
of
an
sw
ers
0%
5%
10%
15%
20%
25%
30%
35%
40%
Not
motivated
Strong
motivated
Estimated motivation for accomplish self-assessment
work(tototally for org. A, B, & C)
Per
cen
t o
f an
swer
s
Figure6.12
These four diagrams show how the respondents have estimated their motivation for the self-assessment-work.
Headmaster: 1
Pupil assistants: 3
Teachers: 55
Unit A
Teachers: 52
Headmasters: 3
Liberians: 2
Study advisors: 2
Unit B
Teachers: 55Pupil assistants: 4
Cleaners: 3
Beadles: 3
Liberians: 2
Pupil welfare persons: 2Study advisors: 2
School meal assistant: 1Unit C
Figure 6.13 The figure illustrates the distribution between different categories of employees at the four units.
As described in Figure 6.13 most of the respondents at the four units are teachers. However, there are differences between the units. Among the respondents in unit A more than 90% are teachers, but at unit C about 75% of the respondents are teachers.
6.5.3 The Third Questionnaire
Since the response rate of the questionnaire was fairly low (about 20%; see Table 6.1) the main focus of the analysis was decided to be on the verbal data. That analysis partly consisted of an analysis of verbal data connected to individual questions. However, the answers from the qualitative part of the questionnaire were also aimed for an overwhelming analysis in order to search for potential patterns among the respondents’ answers studying their own words. This methodology to read the answers carefully several times in order to find similarities, without connection to a specific question, is described by Lindholm (1999) and Goetz & LeCompte (1984) and called thematic.
In the thematic work the following three analysis criteria were used in order to find different themes:

144
• What the respondents to some extent say spontaneously about the project
• What anyone of the respondents says several times; that is what they return to in their comments
• What the respondents say with emphasis.
This scanning of the qualitative answers and comments were firstly structured into a list of themes. Thereafter the structured data has been analysed. The search of different themes resulted in a list of twelve different themes shown in Table 6.2.
As a first step, the qualitative answers were put in groups dependent on the contents. These groups were thereafter given headings, the themes, based on the common principal point within the answers. The themes are shown in the left column of Table 6.2.
The second step was to clarify what the themes deal with connected to the project, and the result of that step is shown in the middle column of Table 6.2.
Table 6.2 This table shows the twelve themes that were found by the thematic analysis. The themes found were sorted into the list shown in the left column. Most of them were found to be connected to either the ‘TQM-triad’ (see Figure 2.3) or the planning phase of the self-assessment work (see Figure 2.9). Additionally, two themes connected to ‘support’ and ‘result’, were found. These connections are shown in the middle and the right columns.
Themes What the themes are connected to
Found main groups
• Leadership & Organizational aspects
• Planning
• Time & resources • Planning
• The purpose of the project • Planning
• The project • Planning
• The field of education • Planning & Values
vs school environment
• Time period & context • Planning vs school
environment
Self-assessment phase 1
• The concept ‘customer’ • Values
• Accomplishment of the self- assessment
• Methodologies
• Collective assessment • Methodologies
(partly not TQM-based) & Phase II
• The tool ‘Lärostegen’ • Tool
TQM-triad
• Assistance from LTU • Support Support
• Different view of business • Result Result

145
The third step of the data structuring concerned searching for similarities among the areas the themes are connected to. This led to that the themes were clustered in the four main groups, shown in the right column of Table 6.2. Here it became clear that most of the twelve themes were connected to either the TQM-triad model (see Figure 2.3) or to the first phase, the ‘planning phase’, in the four phase model of self-assessment (see Figure 2.9). Furthermore, two separate themes resulted in the separate main groups ‘support’ and ‘result’, respectively.
The data is discussed below in relation to the four found main groups to the right in Table 6.2.
The Main Group ‘Self-assessment phase 1’
The themes in this main group deal with foundational matters for the project that might be called planning issues.
Firstly, the theme ‘Leadership & organisational aspects’ comprises several different parts that might be described as four sub themes, namely:
• Leadership on different organizational levels. There is dissatisfaction about the leadership on different organizational levels25. There are comments related to the Swedish National Agency for Education and the governmental level, but also related to educational issues on municipality level26. An example is: “sometimes I feel that the government, the Swedish National Agency for Education, the heads of schools, and the headmasters construct pedagogical objectives that not are based on what really is needed and urgent”. Foremost, the respondents have commented on the leadership among the headmasters, and the municipality head of the school and, to some extent, the municipality head of the upper secondary school27. One respondent has written: ”… , this project was overkill, since there are large deficiencies within the leadership as well as in the participation among employees, and there are also unwillingness to do changes within the school in general”.
• Top-down work. The fact that the self-assessment project was initiated by the municipality head of the upper secondary school, and that the main work during the planning phase was done by the managerial group, makes some respondents to look upon the self-assessment project as too much top-down. One of them comments: “I’m irritated to have been involved in a project that was controlled from above, once again”. The top-down view has also been connected to the fact that a special tool, ‘Lärostegen’, was used and
25 The different levels are explained in more detail in Figure 6.14 below. 26 These belong to Level 5 and 6 in Figure 6.14. 27 Level 2, 3 and 4 in Figure 6.

146
led to too much control of what should be assessed. Also, see the analysis of the main group ‘TQM-triad’.
• Establishment. The work with self-assessment has not, according to several respondents, been established enough among the staff that should be involved in the project. One comment is, for example: “It was neither established, nor checked, if the project was feasible in practice at each one of the four units”.
• The staff. Some of the respondents have expressed their disinclination and indifference for participation in the self-assessment work. One example is: “there was lack of a widespread and genuine interest among the staff”.
Secondly, within the theme ‘Time & resources’ it is obvious that a lot of people have felt that they had not had time enough to work with the self-assessment. Several people say that they had too much work to do even before the self-assessment work started. For instance, one respondent wrote: “If you take such things seriously, some people have to have reduction of teaching hours in order to be able to participate.” This point may, of course, be related to the general decrease of resources within the public sector.
Thirdly, the theme ‘Purpose of the project’ comprises lack of discussion or information why the project should be accomplished at all. For instance, one of the respondents said: “Aim and goals were unclear. For whmo is this performed? And why? That have been very unclear. What was the vision of the project? What is in it for me?” Here some links might be found to the top-down shaping of the project that some of the respondents have criticized.
Fourthly, the theme ‘The project’ deals with general criticism about how the project has been carried through: “We have got a good example of how a project not shall be accomplished”. According to one respondent “…this project is another one that have failed”, and another one says that “it is not easy to apply a complicated quality systems in schools”.
Fifthly, the theme ‘The field of education’ embraces respondent views whether the project assesses things that are important in schools: “withdraw the project, maybe it is suitable for the industry”. Since a lot of the comments here are linked to the tool, this theme is partly overlapping the theme ‘The tool Lärostegen’ below.
Sixthly, the theme ‘Time period & context’ comprises comments about the situation for the upper secondary school in terms of economical problems and threats of notices to quit. As one of the respondents said: “The aim of quality work is necessary and shall always be developed at a school for the students’ own good. But the accomplishment of it might be done in a more easy way; this is the explanation of the

147
interruption of the project. Wrong time point due to personal reductions and scepticism due to earlier failed projects.“
The Main Group ‘TQM-triad’
There are four themes that are connected to the TQM-triad, which means that respondents have written comments related to the TQM-values, to the methodology self-assessment, and to the tool ‘Lärostegen’ that was used in the project.
Firstly, regarding the TQM-values, there are both negative and positive attitu-des among the respondents. Especially the customer-focus is, according to some respondents, mentioned as a value that is impossible to use in educatio-nal organisations. For example, one respondent says: “Do not like the word customer, it feels completely wrong”. But, on the other hand, there is one positive comment as well about the use of the customer concept: “Started to think more about quality and the customers”.
Secondly, the self-assessment methodology has been questioned from diffe-rent perspectives by several respondents. Some respondents have experienced the self-assessment work as complicated, and some of them think that it should have been performed in an alternative way. There are also opinions about the subjects that are put in focus in ‘Lärostegen’. What phenomena that should be assessed and how this should be done, ought to be decided together with co-workers, according to some respondents. These respondents’ view is connected to the planning issues.
But there is also criticism about the usage of collective methodologies on a more general level. The respondents want to focus on the teaching in the class room. One respondent says: ”The concepts are relevant, but they function individually among teachers provided that he or she is committed in the work and reflects about what he or she is doing. Organizing of collective methods is just waste, I think”. In addition, there is one comment saying“it is quality of knowledge that shall be assessed” and another one saying that “other forms of education is better”.
Several of the respondents have commented on the chosen tool ‘Lärostegen’. These comments are given from different perspectives. One type of view is that the tool is too comprehensive. Another type of comment is that it is hard to understand the questions in ‘Lärostegen’, and a third view is that it does not include the parts of the work that they think are most relevant.
The questions are experienced abstract and one respondent wanted, for instance, instead to evaluate more concrete issues as mentorship, grading, team-working and mobbing, but also forms for cooperation between the school and future employers.

148
Besides what now have been said about ’Lärostegen’, the main point among the comments deals with excluding the word ‘customer’ from the tool.
The Main Group ‘Support’
Some different points can be identified concerning the respondents’ view of the support given by Luleå University of Technology. One thing is the ‘TQM specific language’ that is used and that have been perceived as difficult to un-derstand. Another thing that respondents have noticed is lack of communica-tion in general, but also the more specific situation within the upper secondary school in Luleå with threats about personnel reduction and financial problems. Too little training in self-assessment is a third thing mentioned and also a general question whether the university representatives should not have been more involved in the practical the self-assessment work.
The Main Group ‘Result’
Several comments are here related to that they have got better insight in how other members in the staff work, but are also emphasizing that there is no common view within the organization. Examples of comments are: “I have got better knowledge how other teachers work”, “How different we work in the different programmes.”, “There is no common view about quality within school. We all have different opinions in the different courses in school. Control documents say one thing, the resources another and we all try to survive in that reality.
6.5.4 Analysis of the USS-project
The main part of the analysis is made based on the structured empirical data described above. Some comments are also made related to the interviews with the headmasters. However, in order to complete the picture and broaden the view of the self-assessment project, another analysis related to the organizational context in which the project was accomplished is made as a second step.
Analysis of the Interviews with Headmasters and Municipality Head
The intension in the analysis is not to focus on the interviews with the headmaster too much. The reason is that the analysis has not been performed in depth yet. However, a brief analysis of those interviews indicates a number of interesting points, worth to be considered and have therefore briefly commented upon below.
Knowledge about the project, TQM and self-assessment. Most of the headmasters had, at the start of the project, just brief knowledge about the TQM concept and

149
what self-assessment really means. These concepts were probably not sufficiently rooted in the managerial group before the project started. The headmasters were not quite convinced about the benefit and had difficulties to defend the ideas when questions were asked within their organization. However, when asked about their own interpretation of certain concepts during the interviews, the answers were in many cases ‘TQM-oriented’, for instance, concerning the quality concept and the core values. One explanation is that they had been influenced during the project. Another explanation might be that they answered what they thought they were expected to answer28.
Furthermore, they were not sufficiently aware of the background for the project. The project as a whole was not sufficiently well rooted in this group by the municipality head and the project group. The impression of enthusiasm in the beginning was probably more due to a conviction that it was already decided that the project should be performed than a genuine conviction of the suitability.
Here it could be added that several of the headmasters were employed on short time basis, which might have influenced their inspiration and their willingness to question the project at the beginning.
Experiences of the project. The headmasters mentioned that several improvement possibilities had been identified, but at the same time they meant that the self-assessment process with ‘Lärostegen’ had not ‘went to the bottom’ with problems, and they felt disappointed about that. They had expected an assessment on a more detailed level. They said that they were in general more hesitant to the project at the time for the interviews than they were in the beginning. It was also apparent from the interviews, as well, that the self-assessment work had been performed in quite different ways at the different units. This is partly a consequence of the fact that the project group emphasized as much as possible that the project is ‘owned’ by themselves and they were free to perform the work as they wanted, but could get support from the project group; see Section 6.2.1.
No exchange of experiences between the units. It was obvious from the interviews that the project and the problems with self-assessment was not discussed at the regular meetings the headmasters had with each other and the municipality head of upper secondary school. This in spite of the size of the project and that all the staff was included.
Some comments from the interview with the municipality head of the upper secondary school are also of interest. She expressed her opinion that self-assessment is a suitable methodology, since it means that the staff itself 28 The interviews were performed by the author of this thesis.
150
identifies improvement possibilities and improvement actions. She said that it is important to discuss concepts as “quality” among the staff to create a more common view and that she hoped that the project should equalize differences in values and culture between the four units. She also said that the project needed more resources than she understood from the beginning and that she had realised that not the least the creation of the ‘overview’29 at the units had been beneficial and created a common and important picture of the frame and structure for the school work. The opinions about ‘Lärostegen’ differed, according to her opinion, between people at the units, some people liked the system view but others had expected a more detailed level. But, as far as she had heard, nobody had expressed the opinion that it was unsuitable. She also confirmed that at the regular meetings with the headmasters just reports of the work within the project were given, but no discussions about experiences.
Analysis of the Structured Empirical Data
Firstly, when looking at the six themes that have been classified in the main group dealing with planning issues, it is obvious that they are very similar to the points mentioned above as important to consider during the planning phase. This implies at least two things. At one side, since the themes are based upon respondent answers and the fact that these answers comment different forms of lacks, the planning work during the first self-assessment phase was not fulfilled carefully enough and in a satisfying way. This reflection is directly connected to this particular project. But on the other side, it is possible to do the more general reflection that the respondent answers confirm the need of the proposed parts of a planning phase; see Eriksson (2003) and Klefsjö & Eriksson (2004).
Secondly, the themes connected to the TQM-triad also show the need of sufficient education, where all the three components in the triad are discussed. This point is emphasized by, for instance Conti (2001) and Eriksson (2003). According to the respondents, this point has not been paid sufficient attention to during the project. This conclusion is also supported by the interviews with the headmasters.
The need to choose the different steps in the self-assessment methodology in relation to resources, maturity and possibilities in the organization can also be identified, see EFQM (1996) and Lindström et al. (1999). This is also connected to the planning phase. The interview with the municipality head confirmed that she did not realise the necessary resources from the beginning.
29 See Section 6.3.2 for the contents. See also the results from questionnaire 2, which support her opinion.

151
Due to the amount and the emphasis of the negative comments related to the use of the word ‘customer’, it is obvious that this word have caused obstacles. It seems that if several respondents mean that it is what happens in the classroom that mainly shall be assessed. This view was also evident in the interviews with the headmasters.
However, the respondent that says that the questions in ‘Lärostegen’ is too abstract, mentions besides mentorship and marking also such things as harassment, forms of cooperation between schools and working life, and work within teams. These three things are, nevertheless, assigned in different questions in ‘Lärostegen’. For instance, that the pupils should not be mobbed must be considered as a need within that group of customers, and ways for cooperation between the school and future employers should be considered among the needs and expectations in the customer group of employers. One of the questions within the area of processes is in fact formulated: “In what way do we stimulate communication and cooperation between actors related to our education process? This question is also clarified and exemplified with explanations as “between teachers within a subject or within different subjects, between teachers and other staff members, between employers and pupils and between employers and supplies.”
One can wonder why at least a part of the respondents do not see these relations. Should tools as ‘Lärostegen’ be made even more concrete, or does it depend on bad communication related to the interpretation of the questions? Another explanation might be that due to the strong focus on “how” activities are done, the result of these activities, “what” the output is, is put too much in background, at the same time as these things by many are considered as the most interesting. In ‘Lärostegen’ is the ‘output’ included as a sub-question, which should be answered, in fact just to avoid this situation, based on earlier experiences; see Svensson (2002). Still another explanation might be that organisations which are unfamiliar to TQM should start with an even more basic tool as a start and successively use more advanced tools.
Mistrust to the management is something that was not handled before the project started. Here most comments are related to the headmasters’ leadership, but also leadership at other levels is commented upon. Here, the answers and comments were interpreted to be on a general leadership level. However, it is the author’s opinion that the fairly low knowledge among the headmasters about the particular project and its purpose, and what TQM-based self-assessment means at some units contributed to decrease the status of the project at the unit since this resulted in unclear signals within the unit.
Thirdly, about support from an external organization, it seems that different people, within the upper secondary school, as well as among the support persons from Luleå University of Technology, have had different views about

152
their roles and also different expectations. Most likely, there are several reasons for this. Unclear roles are caused by lack of communication and inadequate planning. Once again the need of a careful planning phase is emphasized; see also further analysis about organizational aspects based on Figure 6.14.
Fourthly, there are some results related to the self-assessment procedure that are crystallized within the four units. One thing, unfortunately mentioned by several respondents, is that self-assessment work has been experienced as something negative. But on the other hand several respondents have mentioned that they have realized that different people in a unit have various views of quality, and they also use different methodologies in their ordinary work. So, although the phase number three of the self-assessment, the analysis phase, was not fully accomplished at some units, some experiences about the object for assessment are found. It seems, at least for some of the respondents, that it has been fruitful just to discuss questions like those in ‘Lärostegen’. A similar result was found in another study of self-assessment in educational organizations; see Svensson (2002).
Analysis Related to the Organizational Context
In order to broaden the analysis of the project, it seems appropriate to describe the organizational context. This step is motivated by the fact that several organizational aspects have been found among the thematic study. In Figure 6.14 the core and the starting-point is the self-assessment project. The two groups of people that were involved in the work with self-assessment, headmasters and other employees at the four upper secondary school units, have be placed nearest the core. After that, the different organizational decision making levels in the municipality is shown.
The black thick lines with end dots show which levels that have been involved in the self-assessment work. The black double arrows show some form of communication like transfer of information and discussions between different levels. Here the possibility that these arrows in practice might go between two not nearby levels is disregarded. The white arrows show different kinds of contacts between the upper secondary school and Luleå University of Techno-logy. But these two kinds of arrows also show that several possible gaps might arise, if the arrows do not contain any substance. Due to the black arrows, there might have been contacts taken between other levels than just near by ones, for example teachers and somebody on the political levels might have had contacts.

153
Self-assessment
Teachers & other employees
Headmasters
The head of theupper secondary school
Support
from Luleå
University of
Technology
P
DS
A
The municipal council and government
The child & education committee
The head of the Schools of Luleå
Level 1
Level 2
Level 3
Level 4
Level 5
Level 6
Politicallevels
Leaderlevels
Figure 6.14 The context in which the self-assessment project in the upper secondary school was accomplished. The black arrows show transfer of information and discussions between different levels. Here the possibility that these arrows in practice might go between two not nearby levels is disregarded. The white arrows show different kinds of contacts between the upper secondary school and Luleå University of Technology. But these two kinds of arrows also show that several possible gaps might occur; due to lack of communication between the organizational parts or levels that are linked by the arrows. The shaded arrow between Luleå University of Technology and the head of the upper secondary school shows principally the initial contacts of the project.
Based on Figure 6.14 it is easier to describe two circumstances that have not been mentioned earlier in this chapter.
One is related to organizational turbulence at some levels. Firstly, the municipality head of the upper secondary school (level 3) left early in the sum-mer 2003 and this was the person that initiated the project and did engage Luleå University of Technology. Furthermore, the municipality head of the school (level 4) left during spring 2003. Thereafter, the political levels, decided that the level 3 should not exist any longer. Instead the municipality head of the school should have direct contacts with the headmasters in the upper secondary schools. An appointed municipality head of school was engaged to fill the vacancy, but left during the summer, so a temporarily appointment was done during the rest of the year 2003. In January 2004 another person was engaged as permanent head of school. Furthermore, among the group of headmasters two left during 2003 and one new person was engaged. This turbulence caused a mass medial focus and influenced the project in a negative

154
way, since the people on different municipality levels were not sufficiently informed abut the project and, maybe, doubtful to the benefit.
Another circumstance is that another quality project was launched by the municipal council during 2002. It was decided that all the municipal administrations should use balanced scorecards. Accordingly, there were two projects that should be implemented in parallel, and they were seen as competing by many people participating in the project. This situation was handled by discussions between the head of the upper secondary school, people leading the implementation of balance scorecards, and representatives from Luleå University of Technology. However, it is doubtful whether the staff saw the synergy potential in the two projects.
But nevertheless, there were two different approaches that should be used, but the decisions about the usage were taken at different levels in the municipality organisation; the self-assessment project was launched at a lower level (level 3 in Figure 6.14). The decision about use of balanced scorecard was taken at a higher level (level 6 in Figure 6.14). Note that both the municipality head that decided about self-assessment and the leader of the implementation of balance scorecard left their positions during 2003.

Part III
Overall Analysis


155
Chapter 7
Comparison of Findings from the Three Projects
n this chapter the findings about self-assessment work within the AVE-project, the AEI-project, and the USS-project that are presented in the Chapter 4-6 are compared and an overwhelming analysis is accomplished.
7.1 Differences Between the Projects
Before any comparison between the results from the three projects that are described in Chapter 4-6 might be done, the question whether it is possible to accomplish such a comparison have to be asked. At a general level, it seems reasonable to do a comparison since all the participating organizations are giving education in some form and they have all worked with TQM-based self-assessment based on similar tools. However, as shown in Part II of this thesis, it is obvious that there are several differences between the three projects. Therefore, it is essential to have the important discrepancies in mind when comparing the results from the three projects.
In order to conclude which differences are most important, one base might be the four basic questions about pedagogic evaluations by Franke-Wikberg & Lundgren (1979) mentioned in Chapter 1. Based upon these four questions, presented in the left column in Table 7.1, the discrepancies between the projects that appear to be the most important are listed in the right column in Table 7.1. The discrepancies are then commented upon in the following sections.
I

156
Table 7.1 This table shows discrepancies between the three self-assessment projects described in the Chap-ters four to six. The discrepancies are linked to the four questions that are important to ask about evaluations according to Franke-Wikberg & Lundgren (1979). Here self-assessment is used as equal to evaluation.
Questions by Franke-Wikberg &
Lundgren (1979)
Important discrepancies
Which is the aim of the evaluation and to whom shall it be made?
• There are different background to the three projects
What shall be evaluated? • The three projects have been accomplished at different levels in the educational system
• The Type of organizations
How shall the evaluation be made? • Differences in the design of the two projects
• There are differences in how the methodology is used in detail
• Three different tools have been used.
Who shall accomplish the evaluation? • Different persons with different preferences have participated
• People with different roles in their organizations did participate
7.1.1 The Different Backgrounds to the Projects
Firstly, the AVE-project was performed as a part of an overall evaluation project of the AVE pilot period. This fact connoted that the self-assessment part, the part, which here is called the AVE-project, was formed with some restrictions that commonly do not exist within self-assessment work.
The AVE-organizations had requirements from the AVE-commission (‘KY-kommittén’) on performing some form of ‘self-evaluation’ as part of the granting. This meant that these organizations were forced to do something, independently of their maturity and knowledge and their understanding about the necessity and benefit of such work. The TQM-based self-assessment within the AVE-project was offered as one of several possibilities.
Another thing worth to remember is that it was two aims with the self-assessment work within the AVE-project. One was to support the quality improvement work within the organizations. The other one was to gather information to the ‘overall AVE-evaluation’. This in turn meant then the organizations were asked to submit their descriptions to the research group.

157
Secondly, the AEI-project was initiated by a person at Swedish Association ofLocal Authorities (‘Svenska Kommunförbundet’). The organizations participated of their own will and had their own aims with the self-assessment work. Some organizations wanted to carry through a self-assessment work, in order to find possible improvement areas, while others did participate since they were just interested in learning about TQM-based self-assessment.
Thirdly, the USS-project was founded from a mutual interest of cooperation between the Upper Secondary School in Luleå (USS) and Luleå University of Technology, which resulted in discussions within the USS about possible projects, which in turn led to the decision to accomplish quality improvement work by assistance of TQM-based self-assessment.
7.1.2 Organizations at Different Levels in the Educational System
The three projects have been performed at different levels within the Swedish school system, which is illustrated in Figure 7.1. This means that there were differences in pre-knowledge and age among the pupils and students, and regarding the contents and the aim with the educations. Besides of that, there might also be other differences between the levels which are related to the culture in the organizations.
University & other post
upper secondary education
University & other post
upper secondary education
Pre-School EducationPre-School Education
Upper Secondary SchoolUpper Secondary School
Compulsory SchoolCompulsory School
Adult
Education
&
Adult
Education
initiative
Adult
Education
&
Adult
Education
initiative
W
o
r
k
i
n
g
l
i
f
e
The USS-project
The AVE-project
The AEI-project
Figure 7.1 The three self-assessment projects (AVE, AEI & USS) have been performed at different levels within the Swedish school system.

158
7.1.3 The Type of Organizations
In Section 7.1.2 the differences between the three projects with reference to the Swedish educational system is shown, but that description does not give the whole picture. In the AVE-project, the were several types of organizations involved, as organizations giving municipal adult education (‘Komvux’), universities, private educational organizations, educational associations (‘studieförbund’), and upper secondary schools. In the AEI-project, the participating organizations were mostly those giving municipal adult education (‘Komvux’), but also one private educational company did participate.
7.1.4 Differences in the Design
Due to the different prerequisites of each one of the three projects, the design of them differed in a number of ways. The time schedule, for instance, for the projects differed. Furthermore, the number of education sessions, their contents and geographical places differed. Also the design of the training sessions and other meetings related to the accomplishment of the self-assessment differed between the projects.
7.1.5 Differences in the Methodology Used
The organizations that did participate in the three projects chose different ways to carry their work through. In the AVE-project there were organizations in which just one person performed the self-assessment and at least one in which all the staff participated. Within the AEI-project there was a similar dispersion in the number of involved persons.
In the USS-project the basic principle from the beginning was that all the staff should be involved, but in reality it varied between the units. There were also differences between the units, regarding how the work was performed and how many people that were involved.
7.1.6 Three Different Tools
As described in Chapters 4-6, there were three different tools that were used within the three projects. However, these tools were connected to each other since experiences from the use were, together with theoretical results, used for improvements of the following ones.
159
7.1.7 Different Persons with Different Preferences
It is clear that the preferences among the persons that did participate in the three projects differ. One example of this is that the use of the word ‘customer’ was discussed frequently during meetings. In all three projects there were people that supported the usage of ‘customer’ concept as well as those who could not accept the use.
7.1.8 People with Different Roles in Their Organizations
The people who participated in the education sessions and the projects had roles that varied quite a lot. This was partly related to how the organizations chose to perform the self-assessment work in detail; see Section 7.1.7.
Among the organizations, which participated in the AVE-project, the representatives in the educations were chosen by the organizers. In some cases the contact persons attended the sessions and in other cases within the AEI-project it was mainly headmasters or other people with responsibilities that participated, but just a few teachers together with their headmasters. During the USS-project headmasters as well as teachers and other co-workers participated at the educational sessions.
7.1.9 Another Discrepancy
Another discrepancy that is not a part of the design of the projects, but indirectly linked to them, is the differences in methodology when gathering empirical data.
Regarding the AVE-project, the contact persons answered the questionnaires. In the AEI-project, all persons that participated at the training sessions got the questionnaires. When opinions were gathered from the USS-project, all persons that participated the education sessions or, regarding the third questionnaire, all the staff was asked to answer the questionnaire. This means that also, for instance, study advisors (‘studievägledare’), school meat assistants and librarians have answered.

160
7.2 Summary of Findings from the
Projects
In this section the results from the three projects described in Section II are summarized and briefly described.
7.2.1 The AVE-project
Background
The background of the AVE-project implied that all organizations giving Advanced Vocational Education at the time of the AVE-project were demanded to accomplish some sort of ‘self-evaluation’. Several organizations chose to do that as a self-assessment using ‘Läroverket AVE-version’. Among the users of ‘Läroverket’, a number of contact persons felt it compulsory to accomplish the evaluation by ‘Läroverket’.
Resources vs. benefit
When the respondents were asked to compare the resources used within the AVE-project to the benefit of the self-assessment work, a majority of them estimated the work as useful. Those who earlier had knowledge about TQM, or knowledge or experience of self-assessment, were more positive to the benefit than other people.
TQM-values
The attitudes about the usage of the word ‘customer’ among the respondents show that most of them seem to accept, or even be positive to the use. Their attitudes to the concept, as a whole, can be summarized as ‘relevant’, interesting’, ‘clear’ and ’valuable’.
Self-assessment with ‘Läroverket’
In this project the attitudes among the majority of the respondents about the usage of self-assessment are positive. A brief summary of the comments gives, for most respondents: ‘valuable’, relevant’, ‘useful’ and ‘thorough’.
Improvements
The respondents were asked about whether they did find some improvement possibilities just by answering the questions in the tool ‘Läroverket AVE-version’. In this case, about 80 percent of them answered ‘yes’ to that question.

161
The tool ‘Läroverket’
The respondents’ view of the tool ‘Läroverket AVE-version’ can be described from several perspectives. Regarding the choice and suitability of the four areas included in the tool ’Läroverket AVE-version’, a majority of the respondents were positive.
Regarding the individual questions in ‘Läroverket AVE-version’ the respondents are more negative compared to their attitudes about the four areas. However, a majority of them are neutral or positive to some degree. It is hard to judge whether the individual questions are commented upon or if the answers may reflect an opinion that the number of questions was too high, which in turn led to comments about lack of time resources. Also the use of the word ‘customer’ in ‘Läroverket’ led to a lot of comments.
There were also other experiences that were obtained during the AVE-project. One thing was the need to develop a structured description of how to accomplish the fourth phase of self-assessment, that is ‘plan for improvement’. Another thing was that the Swedish word ‘utvärdering’ (evaluation) was used at several levels within both the description of the project and the tool ‘Läroverket’ AVE-version’. This confused the participants, not the least those who had low or no experience of TQM and self-assessment.
This, in turn, resulted in the use of the words ‘analysis’ and ‘reflection’ when describing the third self-assessment phase and the fourth dimension within the tool. A third thing is also connected to the tool and was recognised during the project, namely that the dimension ‘result’ contains of at least two forms of results.
An aspect of the training sessions was that just two such occasions was not enough. There seemed to be a need of more regular education and forms of support during the self-assessment work
7.2.2 The AEI-project
Background
The background to the AEI-project was that all organizations had chosen to participate without any compulsion.
Resources vs. benefit
When the respondents were asked to compare the resources used within the AEI-project to the benefit of the self-assessment work, almost all of them

162
estimated the work as useful. The picture is even more positive than for the AVE-project, but we have to consider that the number of organizations participating in the AEI-project is fairly small.
TQM-values
The attitudes among the respondents about the usage of the word ‘customer’ show that this concept does not create problems to most of the participants. The picture is roughly the same as for the AVE-project.
Self-assessment with ‘Läroverket’
In this project the attitudes among the majority of the respondents about the usage of self-assessment are positive. The picture seems to be roughly the same as in the AVE-project.
Improvements
The respondents were asked whether they had found some improvement possibilities just by answering the questions in the tool ‘Läroverket AEI-version’ and 14 out of 15 answered ‘yes’ to this question. It might be worth to mention that the person that answered ‘no’ worked in an organization, where the other persons answered ‘yes’ to the question. So, in all participating organizations improvement possibilities were found by just accomplish phase II.
The tool ‘Läroverket’
Several of the respondents experienced ’Läroverket 1999’ as too comprehen-sive. A large majority of them considered the chosen areas for the assessment as useful and suitable.
Looking at the individual questions in ‘Läroverket 1999’, the respondents are more negative compared to their attitudes about the four areas. However, a majority of the respondents have a positive tendency. Some respondents expressed that they found some of the questions overlapping.
7.2.3 The USS-project
Background
Shortly, the USS-project was based on an interest of working with self-assessment among the municipality head of the upper secondary schools and among the headmasters. In other words there was no obvious demand on starting and carrying the project through at that level. But among the co-
163
workers there seems to have been a view of the self-assessment as a requirement, a top-down project without sufficient rooting, and the purpose of the work was unclear to the staff.
Resources vs. benefit
When the respondents early in the usage of self-assessment were asked to compare the resources used within the USS-project to the benefit of the self-assessment work, there were differences between the four units. But as a whole, there was a clear opinion that the self-assessment work was experienced as negative.
TQM-values
In the third questionnaire the respondents within the USS-project were asked about their attitudes to the TQM-values, but the answers were more or less related to just the use of the ’customer’ concept.
The attitudes to the use of the word ‘customer’ among the respondents clearly show that this was considered as an obstacle, among the staff within the USS-project. But even though several persons strongly disliked the use, some people expressed the opinion that it was thought-provoking and useful. However, it is a little bit hard to know how large the resistance is or whether it to some extent is a result of ‘the load-voiced’ people.
Self-assessment with ‘Läroverket’
Although the number of questions have been reduced in ’Lärostegen’ compared to the two versions of ‘Läroverket’, many persons experienced the work as too comprehensive and complex. It is important here to emphasize that the four units in this project, although they chose different ways in the operational work, started with the intention that everybody should be represented in the work.
Among those who answered the third questionnaire, the impression about self-assessment varied from a very negative attitude to a very positive attitude.
Improvements
Just a few of those who answered the third questionnaire considered that improvement possibilities were found. However, the headmasters said in the interviews that such possibilities were found.

164
The tool ‘Lärostegen’
Considering the choice of the four areas in ’Lärostegen’ a large majority of the respondents were positive for those as a base for the assessment.
The respondents at the four units got a question regarding whether they think that ’Lärostegen’, as a whole, is suitable as a tool to assess an organization’s work with quality improvements. On this question the answers varied from ‘very unsuitable’ to ‘very suitable’ but with a tendency towards ‘unsuitable’.
7.3 Summary of the Empirical Findings
As a whole, most respondents in both the AVE-project and the AEI-project tend to show a positive attitude to the self-assessment, despite the fact that almost no organization had fulfilled all phases in the self-assessment process at the time for the measurements. On the other hand the respondents that participated in the USS-project are mostly negative.
The AEI-project shows better results in several measures concerning self-assessment compared to the AVE-project. Several hypothetical explanations are possible here. One is that some AVE-organizations might have felt forced to join the self-assessment work, even though they had the opportunity to choose other forms of evaluation as well. Another one may be that the AVE-organizers were aware of that some form of ‘self-evaluation’ was compulsory to perform and saw the self-assessment within the AVE-project as a help to perform this, in particular since it apparently had support from the AVE-commission (‘KY-kommittén’).
7.3.1 The TQM-values
In connection with the AVE-project and the AEI-project only the attitudes towards the value ‘customer focus’ were investigated. According to the results from these investigations the value does not at all seem to be controversial, although there are people saying that this value is unsuitable in educational organizations. This is in clear contrast to the reactions in the USS-project. In this project the attitudes against all the values in the base of ‘Lärostegen’ were checked, but here the value of ‘customer focus’ was the controversial, mainly due to the obstacles to the word ‘customer’. However, the other five values used as a base for ‘Lärostegen’ were as a whole accepted, or even experienced as suitable. Here seems to be a clear difference between the projects. One explanation may be that the projects were performed at different levels within the school system, and that might have influenced the result.

165
7.3.2 Self-assessment
In all three projects, improvement possibilities have been found in almost all of the participating organizations. And these results have been reached despite the fact that the measurements were done after phase two, i.e. the description-phase. The analysis phase were for most organizations still left, which should imply even more opportunities to find improvements. The main purpose with self-assessment is to get a list of possibilities for improvements as an output, and this purpose seems to be fulfilled.
7.3.3 The Self-assessment Tools
In both the AVE-project and the AEI-project, persons that participated in the education sessions described the tool ‘Läroverket’ as too extensive, which led to the evaluation of the tool ‘Lärostegen’ in the USS-project.
In both the AVE-project and the AEI-project, when asking about self-assessment by using ‘Läroverket’, the answers about clearness tend to be negative. There also seems to be some marks of interrogation about the evaluation of efficiency as well, but this might depend on how different people interpreted the question in the questionnaire. But on the other hand, almost none organization had earlier experience in using tools like ‘Läroverket’.
The use of ‘Lärostegen’ within the USS-project showed a similar result, in spite of the reduction of the number of questions compared to the two versions of ‘Läoverket’. The view of self-assessment with ‘Lärostegen’ as too resource requiring might be linked to the design of the project with ‘everybody’s commitment’ and the use of the ‘award process’ for the self-assessment. However, since ‘let everybody be committed’ is a basic TQM-value, it might be either the tool or the methodology that has to be changed in order to influence the opinions.

166
Chapter 8
A Theoretical Discussion
n this chapter some criticism of TQM and some supplementing theories are discussed in order to broaden the perspective of the usage of TQM within educational organizations.
8.1 Introduction
The discussion presented in this chapter has its origin in literature studies related to criticism against TQM in general, and towards the use of TQM in educational organizations in particular. Also some other phenomena and circumstances within the educational sector are included to give perspective on the discussion.
The literature study has been performed by searching in data bases, where the words ‘education’ and ‘school’ have been combined with ‘TQM’ and ‘criticism’. The found extent of articles in agreement with these search criteria was limited, in particular regarding recent articles dealing with higher education. Therefore, the literature used consists not only of articles, but also of books written by researchers. The criticism is compared to the theoretical description of TQM given in Chapter 2 of this thesis.
The discussion in this chapter on criticism against the use of TQM within the educational sector is held on a fairly general organizational level, although this means a risk that the scientific accuracy is reduced, when the clarity of what is meant and what it supports is unclear. The reason is that it was hard to find much criticism related to those levels in the educational system that are of main interest in this thesis. In fact, several critics talk about the use of TQM in the school sector in sweeping terms, without mentioning what level they discuss. A similar reservation also holds for the discussion in Section 8.5 related to organizational circumstances within educational organizations.
I

167
What is considered as the main process in most educational organisations is ‘learning’. Therefore, a comparison is made in Section 8.3 between TQM and socio-cultural learning, which is one way to look at learning, the interest of which has increased during the last years. That comparison is done by comparing a number of components, found in a literature study of socio-cultural learning, with the core values of TQM. A more detailed description is presented in Section 8.3.
8.2 A Discussion about Criticism of TQM
TQM is a concept that traditionally has been connected with business life, and commercial and industrial manufacturing organizations. However, the domain of applications of TQM has changed, and TQM has been applied more and more also in the private service area and recently also in the public sector. The interest in working with quality in these sectors have grown quite a lot during the last decade. Some examples were presented in Section 2.3. As was mentioned already in Section 1.1, the use of TQM in the public sector is, sometimes considered as part of the New Public Management (Hood, 1995).
Applications of TQM have also reached the third sector with non-profit organizations. There has been research conducted in the area of managing the third sector with its non-profit organizations; see, for instance, Hudson (1995), Lyons (2001), Nutt & Backoff (1992) and Mertens (1999). Fredriksson (2004) also discusses the experiences and possibilities to use TQM as a base for societal development, mainly based on case studies from the Swedish municipalities Åseda and Seskarö. An interesting study is Boggs (2004), who discusses the use of TQM in a local church. Reavill (1999) discusses the current status and possible future of TQM as a major management concept and states that the third sector organizations could benefit from adopting TQM concepts.
The different, and sometimes, unclear, definitions of TQM, discussed in Section 2.2, generate problems both for those practitioners, who are applying TQM, and for those theorists, who are studying TQM. There are, for instance, consequences when discussing the effectiveness, use and utility of TQM. The evolution of TQM also implies new definitions, or modifications of existing definitions, for instance, the interpretation of different concepts, as ‘quality’ and ‘customer’.
168
8.2.1 TQM in the Educational Sector
The criticism about use of TQM in the educational sector can be separated in at least two different perspectives. One of these perspectives is the criticism of transplantation of concepts from one context to another; in this case start to apply methodologies and adopt values that has been developed in goods producing companies. Another perspective of criticism is also connected to the transfer of TQM to a new area, but more based upon an ideological point of view. Here, focus in the discussion is related to the fact that the use of TQM in educational organizations sometimes is seen as part of an econo-mization of the education area.
As mentioned in Section 1.1.4, Kohn (1993) discusses the use of TQM in schools. He questions the use of TQM in the classroom and interprets that use as educators trying to transplant a model, stemming from the business world, into classrooms. He states that classrooms are not comparable to companies.
Similar criticism is presented by Scherp (2002), who asserts that TQM originates from Japanese efficiency movement and that use of TQM implies that quality is defined by the customers. According to Scherp (2002), learning within the TQM-field is emphasized by learning about ‘doing’ and ‘best practice’. In his discussion, he also criticizes that students are considered customers and that quality improvements might be carried through by influence of the customer’s expectations. According to this reasoning, quality will be a matter of marketing and to have a good reputation, which is not necessarily connected to the performance of pedagogy. Scherp (2004) also says that quality from the TQM perspective means to put customer experiences in relation to customer expectation, and that quality in this view is measured by inquires among customers in order to determine to what extent customer expectations are fulfilled.
However, this discussion presupposes that quality is based upon customer expectations only. Several definitions of quality also explicitly include customer needs. For instance, Dahlgaard et al. (1998) and Bergman & Klefsjö (2003) base their definitions of quality on both customer needs and expectations. These definitions in fact focus on the importance of not just trying to satisfy explicit demands and expectations that the customer has and accordingly is aware of, but also implicit needs that the customer can not realize. The customer does not know about these needs, and sometimes the customer cannot appreciate the fulfilment at the moment. This discussion is closely related to the discussion of ‘basic needs’, ‘explicit needs’ and ‘exiting needs’ in the Kano model; see Kano (1995) or, for instance, Bergman & Klefsjö (2003).

169
The perspective of quality that is emphasized by Scherp (2004) is founded on a problem-based attitude seeking to create a learning environment for pupils ba-sed upon their different needs. So, even if there are differences between his preferred view of quality and the one presented by Bergman & Klefsjö (2003), and others, these differences do not seem as diametrically opposed as he asserts. This discussion seems to be related to differences in interpretation of TQM and concepts within TQM.
The ideological aspects of TQM include, among other things, customer focus, system-view, continuously improvements, and focus on processes. However, here just the customer-view is discussed. The ideological discussion often ema-nates from the use of the word ‘customer’ within the TQM-perspective.
This customer perspective often brings about criticism of TQM as something connected to a market perspective. Whether this is true or not partly depends on which implications ‘a market perspective’ is given. Within the TQM-per-spective the word ‘customer’ is usually not used as a synonym of ‘buyer’. Customers within TQM are often interpreted broader as the persons or organizations that are the reasons for the existence of the organization, or ‘…those, the organization should create value to’; see Bergman & Klefsjö (2003), for example1. Another illustration of a broad interpretation of the customer concept is given by Juran & Godfrey (1999), who define a customer as ‘anyone who is affected by the product or by the process used to produce the product’.
However, it is important to emphasize here that the feelings to the concept of ‘customer’ within the educational sector differ. Owlia & Aspinwall (1996) found in an investigation covering higher educational institutes in Europe, Asia, Australia and the US, that the value ‘customer orientation’ was accepted and that a large majority of the respondents found the ‘TQM principles’ applicable in higher education.
One criticism about quality work in schools emanates from the point of view that introducing TQM in the educational sector implies an economisation of that sector and, at the same time, introduction of a new set of values that chal-lenge the traditional pedagogical values; see Kenway (1994) and Kenway et al. (1995). Changes in educational organizations to use approaches that incorporate managerial and market driven responses are also discussed by Mcinerney (2003).
1 Sometimes the concepts of “interested party’ or ‘stakeholder’ is used to separate the extended customer concept from the traditional one. ‘Interested party’ may be defined as ‘persons or groups having an interest in the performance or success of the organization (ISO 9000) and ‘stakeholder’ may be defined as ‘anyone, who is affected by the product or by the process used to produce the product, today or in the future’ (Söderholm, 2003).

170
According to this discussion the use of the customer perspective might be seen as means to increase the number of private schools. On the other hand, it could be questioned whether use of TQM in schools within the public sector, instead of being a threat, might strengthen public educational organizations’ ability to compete. Nowadays, when the word ‘compete’ is mentioned related to the educational field, it might be questioned whether the use of TQM really opens up the ability for competition, or if use of TQM just is one way to act in an environment already characterized by competition. In other words, it is quite possible that use of TQM not at all is a threat to the public sector, but instead a possibility to strengthen the ability for improvements and even survival in a new environment, where competitors act on a national as well as an international scene. In this perspective, it can be discussed to what extent TQM leads to economisation, or whether it instead stimulates improvement work.
Still another aspect of the use of a customer perspective is that it might imply a shift of power. The argument is that it reduces the possibility for some sort of ‘experts’ to make decisions founded upon their own views and agendas. A discussion along these lines is presented by Mcinerney (2003). The shift of preferential right of interpretation about what quality is, a shift from ‘experts’ to ‘customers’, does not mean that an organization strictly has to follow what customers explicitly say about their wants. Instead, Arnerup & Edvardsson (1992), as well as others, mean that an organization shall listen to their customers, and by the professional knowledge in the particular organization, as education and learning, for example, help their customers to realize and express their needs and expectations. However, at the end, the customer judges whether he or she is satisfied or not. Except for monopoly situations, the customers always have the opportunity to leave for another deliverer, as long as there are no legal obstructions. This also begins to hold for the school sector in many countries.
Another aspect of the customer concept is that in most cases there is more than one group of customers. It is possible that not just one person or group shall be put in focus. It can be several persons or groups that should be focu-sed on and whose expectations, demands, and needs should be taken under considerations. On one hand this opens up to see other groups than pupils or students as customers, which gives the opportunity to broaden the perspective. On the other hand, this might result in a more complex picture for an educational organization. A discussion about different customers might be necessary and a prioritization of needs and expectations may occur. The customer-view implies work in order to find out and use needs among students, pupils, their parents, next school or educational level, forthcoming employees or others, as the base for design of activities in an educational organization. But still, this discussion leads to a fundamental question: whose

171
expectations, demands or needs shall be fulfilled? The reality might look that way and therefore requires a broader overview about which customer needs that shall be prioritized and which shall have lower priority.
Criticism about usage of TQM within educational organizations has also been expressed by Capper & Jamison (1993). According to them, TQM does not have “…an explicit concern for democracy, making no overt statements about social values or morals”. Instead, they mean that TQM focuses on “…narrow concepts of quality and productivity without designating the goal” and that quality within TQM has not been defined related to democracy and justice, but related to productivity, efficiency and reliability. This might imply a hindrance to some pupils, for instance those with learning difficulties.
Another aspect, discussed by Capper & Jamison (1993), which is connected to the alleged lack of democracy, is their interpretation of the ‘customer focus’ in TQM. This because customer focus and the assumption that TQM entails all customers to have equal access to resources and services and ignore power differences among customers, lead to that all customers will not express their needs. Capper & Jamison (1993) mean that “… TQM’s naive belief that the ‘custo-mer’s voice will be heard ignore the forces that elevate some customer voices and silence ot-hers”.
But, as Lagrosen (1997) says, such a view of ‘customer focus’ and TQM, as expressed by Capper & Jamison (1993), is based on lack of understanding of TQM, since quality, within the TQM perspective is not defined in explicit terms, but related to the needs and expectations of the customer. As described in Chapter 2, a customer focus means to find out customer needs, which not at all means just to listen to the customers that are yelling most or with best expression. Customer focus starts with deciding who the customers are and thereafter find out what their needs are. These needs also comprise unspoken needs, even needs that the customer is not aware of; see Kano (1985). The third step is to create and produce goods and services that as well as possible fulfil the identified needs, or even exceed them.
If there is a view within the society that democracy should be a base in educa-tional organizations, it might be possible to let a representative of the society, the government, for instance, to be seen as a customer and let the government express this particular need. Another possibility might be that the government expresses such an opinion by law.
Capper & Jamison (1993) discuss and criticize the tendency of TQM as repre-senting and supporting the metaphor “school as factory”, which, according to them, historically have influenced the educational sector. This leads, according to them, to a mechanistic and antiquated view of education and learning that

172
implies an obstacle for any development of pedagogy. To some extent Lagro-sen (1997) agree to this criticism. He means that there is a problem within TQM due to its view of knowledge. This condition might, according to him, depend on the history of TQM as founded within the goods producing indust-ry with its possibility to easier quantify different measures.
As a consequence of what has been mentioned here in the theoretical discussion, it seems reasonable to try to compare TQM with aspects of the environment connected to educational organizations. The following two sections comprise such a comparison. The next section, which to a large extent is based on Svensson & Lindell (2004), comprises learning.
8.3 A Comparison of TQM and Learning
The epistemology for how knowledge is, or should be, transferred from teachers to pupils is summarised in the scientific disciplines of pedagogy and didactics. During the twentieth century, different learning styles and imple-mentation of various learning cultures have been presented. The fundamental theoretical traditions on which the disciplines are built are, among others: behaviourism and cognitivism, and the ideas, similar to cognitivism, by Jean Piaget. In addition to these traditions, the socio-cultural learning, based on ideas by Lev Vygotsky, have received a lot of attention lately; see Säljö (2000) and Vygotsky (1999).
Figure 8.1 describes a comparison of TQM and the socio-cultural learning at a theoretical level, before they reach practice in educational organizations. The main idea is that perspectives about learning and TQM are coming from the surrounding world, directly or indirectly via researchers, and reach educational organizations in some way. During the way to the organizations, different filters might change the content of the philosophies developed by the resear-chers. Therefore, our comparison is made between the two types of filter le-vels, since we are discussing the philosophies, not the practice of them.
To make it possible to compare TQM and socio-cultural learning, there is a need to identify concrete parts or fundamental ideas that build up each of the concepts. Within the area of TQM, such fundamental ideas have been discussed by several authors for at least the last ten years, and they more or less agree about which these ideas, often called ‘principles’, ‘values’ or ‘cornerstones’, are. But, as far as the author of this thesis has noticed, there is no list of explicit fundamental ideas within the area of socio-cultural learning, similar to TQM, even though some parts are pointed out. Therefore, we first had to specify the fundamental ideas of socio-cultural learning.

173
Use of theories in educational organisations
Theories & hypothesisabout learning
Theories & hypothesis about TQM
Comparison
Consultant filters & user filters
Researchers’ theory-building
& hypothesis-building filters
The surrounding world
Figure 8.1 The model illustrates the discussion in this section of TQM vs. one learning perspective within an educational organization. The main idea is that different phenomena in the surrounding world are recognized by researchers, for example, and described by them. At the same time the phenomenon is influenced by these people. Later the description is passed on to the educational organization, for instance, by a consultant. Now the consultant, as well as people within the organization, probably has made their own interpretations of the phenomenon. When the phenomenon reaches the organization, it will also be confronted with the existing culture within the organization. Accordingly, it is not any longer the originally described phenomenon that will be confronted with the existing environment in the organization. Therefore, the idea in this section is to try to compare the two different phenomena before they reach practice, so that it is the theoretical descriptions of the phenomena that are compared.
As a consequence, a first step was to compile descriptions of socio-cultural learning by different authors to obtain a group of concrete fundamental ideas that describe the main character of the socio-cultural perspective. In order to create such a group, the descriptions of socio-cultural learning by authors referred to in Section 8.3.1 were used. These descriptions were interpreted and sorted together under five headlines, used as the fundamental ideas of the social-cultural learning and shown in Figure 8.2 and described in Section 8.3.2.
The second step was to carry out the comparison between the two theories. In order to facilitate a comparative analysis of the value-laden foundations of two rather incommensurable concepts, a conceptual framework, or toolbox, has to be applied. In this work, we used dimensions from a revised existing analytical framework developed by Höghielm (2003)2.
The analytical framework for analysing TQM and socio-cultural learning, pre-sented as the middle row of the analysis matrix in Figure 8.2, comprises four different analytical dimensions. The first dimension, ‘societal focus & social 2 The framework was originally developed by Höghielm to understand the transformation of western society connected to the transformation of educational sector and teaching.

174
dimensions’, considers how the theories deal with society and social dimen-sions. The second dimension, ‘organization of education’, focuses on how education and learning should be developed. In the third dimension, ‘percep-tions of human being’, emphasis is put on how the two theories regard the possibility of human beings to participate, to reflect upon, and to change situa-tions. The fourth, and final, dimension, ‘focus of pedagogy and role of teacher’, focuses on how pedagogy and the teacher’s role are treated.
As a third step, we combined each analysis dimension with the fundamental ideas of TQM and socio-cultural learning. This interpretation was made by looking at each fundamental idea though the glasses of each one of the analysis dimensions in order to find connections.
Finally, the fourth step was accomplished as an analysis of the results from the third step.
Fundamental a) Use of artefacts
ideas within b) Use of language
socio-cultural c) Cultural context
learning d) Mediation
e) Continuous learning
Analysis dimensions
I
Societal
focus &
social
dimension
II
Organiza-
tion of
education
III
Percept-
ions of
human
being
IV
Focus of
pedagogy
& role of
teacher
f) Focus on customers
Fundamental g) Focus on processes
ideas within h) Improve continuously
total quality i) Fact-based decisions
management j) Everybody’s participation
k) Management commitment
Figure 8.2 The matrix diagram used for the analysis when comparing Total Quality Management and socio-cultural learning.
8.3.1 Socio-cultural Learning
In recent years, the need of learning in different situations of the society has attracted much attention. Learning has also reached a position as an important part in our society, since it is regarded to be connected to economic growth and social development. Among business executives and politicians, for in-stance, high-educated people are seen as one of the most important prerequi-sites to obtain increased prosperity and reach higher level of quality of life, according to Säljö (2000). When discussing the subject of learning and the

175
increasing interest in this subject, the occurrence of learning within educational organizations is one important environment to consider. Parallel to a discus-sion on learning in educational organizations, it seems important to pay atten-tion to other things that influence the sphere of activities in such an organiza-tion. Rather obvious, schools are places aimed for learning and the epistemo-logy for how learning takes place in educational organizations or how teaching shall be accomplished is summarised in the scientific disciplines of pedagogy and didactics.
Socio-cultural learning, based on ideas mainly by Lev Vygotsky, A.N. Leont’ev, A.R. Luria and developed during the 1920s and 1930s, has received a lot of attention lately; see Vygotsky (1999), Säljö (2000) and Forman et al. (1993). As Vygotsky and his peers lived in a totalitarian regime, their research was almost unknown to the outside world, and no coherent attempt to apply and develop their ideas in the western world was made until mid 1970s and early 1980s. As a result, new and valuable aspects of the theoretical framework as developed by Vygotsky and his peers have been explored and applied in educational research (Forman et al., 1993; Säljö, 2000).
Säljö (2000) claims that one important reason for the discussion of the socio-cultural learning is the changing in the society within the labour market. The dominance of the manufacturing industry and its traditional manual labour will decrease and activities like supervision, administration, and control of techno-logical or social systems will increase simultaneously. Furthermore, products will more and more consist of service and event production within the media and the information sections (Normann, 2002). New technology leads to more built-in knowledge in artefacts and systems. These new conditions require more of human insight in the function of intellectual complex physical tools, which necessitate knowledge and formal education, and at the same time such an evolution got characteristic features that support socio-cultural perspective of learning. In this kind of a social and technological complex society, the threshold to reach different work systems will be higher. As a con-sequence, learning increasingly will be a matter of handling the new technolo-gy. Learning will no longer be limited to receive information, but to get expe-rience in environments, where physical and intellectual tools and instruments are available for individuals. Teaching will still be the main way to handle lear-ning, Säljö (2000) asserts, but there might be questions about where and how it will be accomplished, and traditional teacher-centred and text-focused learning will decrease.
Parallel to the discussion of a need for another perspective of learning than the behaviouristic and the cognitive views, and thereby arguing for the socio-cultural standpoint, this latter one has been criticised. For instance, Marton (2000) means that the socio-cultural perspective lacks explanatory power,

176
when statements are made about learning on an individual level based on this perspective.
When Ashton (2002) explores the social basis and the cultural significance for learning, the works by Vygotsky and his peers today constitute the theoretical and conceptual foundations of which several educational reforms are built. Examples of that are the Adult Education Initiative (Skolverket, 2003), indivi-dual learning accounts (SOU 1999:119, 2000), and the particular forms with situated learning (Lave & Wenger, 1991) that are practised around Europe and elsewhere. Also worth noting is the close relationship between Vygotsky’s ideas of human beings’ ability to endless learning, and the political-driven paradigm of lifelong learning, a cornerstone to future economic growth and democratic stability according to, for instance, National Agency for Education (2000) in Sweden.
One description of learning, with connections to the socio-cultural view, is stated by Hård af Segerstad et al. (1996), who talk about learning as a learning-process3 comprising different activities. Hård af Segerstad et al. (1996) talk about such a learning-process as a complicated interaction between emotional and skill development in the mind of a person, who, at the same time, interact with the social environment. Säljö (2000) says that learning basically involves things that persons, individually or collectively, bring from one situation to use in different situations in the future. He also says that learning cannot be limited to methodology only, as it does in educational situations. It is also a matter of how people acquire and are formed by their participation in cultural activities and how they use instruments that are placed at disposal by the culture.
According to Säljö (2000), learning is a part of the society and the way it works, since it is characterised by social practices and intellectual and physical tools and instruments. Learning is a natural part of life and cannot be avoided, since daily conversations lead to new knowledge. The question is not whether people learn or not, the question is what they learn in a specific situation. This means that all forms of human activities result in learning, and this is not limi-ted to school situations, even though these are important in a knowledge per-spective of a society.
3 Here it is important to elucidate that the interpretation of the word ‘process’ in a learning-process is not the same as that of the concept ‘process’ within the TQM theory.

177
8.3.2 The Dimensions in Socio-cultural Learning
Five fundamental ideas of socio-cultural leaning were identified by studying literature, in particular Säljö (2000), Vygotsky (1999) and Wertsch (1993), and structuring the contents. The obtained fundamental ideas have also been discussed with Säljö during personal communication.
Use of Artefacts
One main point in Säljö’s description of socio-cultural learning is, according to Marton (2000), that “humans are tool-using beings”. Säljö (2000) states that even though humans are biological creatures, the socio-cultural world they live in with its different means of assistance will lead beyond the limits of the biologi-cal requisites. Humans of today are not so different from our ancestors a hundred thousand years ago, from a biological point of view, according to Säljö (2003). However, humans are nowadays incredibly more powerful as a result of the use and the development of different tools; Marton (2000). So, a central perspective is the focus on the acquiring and then the use of artefacts4,among individual persons, among collectives or the interaction between indivi-duals and a collective. Some examples of tools among the cognitive, or con-ceptual, ones are science and language. Among physical tools, hammers, wheels or spaceships, for instance, might be mentioned, according to Marton (2000).
Use of Language
In a socio-cultural perspective, communication and the use of language are central and constitute a link between a person and the environment; see Tul-viste (1991). People develop during interaction with other humans, who support understanding of the function of the world, as Säljö (2000) points out. Forman et al. (1993) say that: “Development of mind in its socio-cultural context alter the notion of cognition by recognising that modes of thinking evolve as integral systems of motives, goals, values and beliefs that are closely tied to concrete forms of social practice.”.Vygotsky (1999) says that, without social communication, no development of neither language nor thinking will occur.
Cultural Context
Knowledge is transferred from one specific situation with a specific socio-cul-tural context to another. People learn to make observations about the world, describe it, and act in it based upon the cultural setting that persons live in. This means that learning is limited by what is allowed and what is stimulated in
4 The word ‘artefact’ means ‘something made by a human being’ and the origin is the words ‘arte’ meaning ‘by’, ‘ars’ meaning ‘ability’ and ‘factum’ meaning ‘the made’. (The Swedish National Encyclopaedia, 1996).

178
a specific cultural context. Learning becomes a reality within the frame of the ‘semiotic resources’ that are constituted by interpretations and thinking made in the cultural setting.
Mediation
People meet the world as it is mediated to them, by language, according to Säljö (2003). Wertsch (1993) says that the concept ‘mediation’ is the process by use of tools that at the same time are incorporated by humans and also form their acts. He also says that mediation might be the most important part of his attempt to describe the socio-cultural area, in a similar way as it was prioritised in work by Vygotsky.
According to Wertsch (2002), the cultural tools, also called ‘mediational means’, are provided by a particular socio-cultural context. The mediation involves an ‘irreducible tension’ between active individuals and items such as computers, maps, and narratives. Based upon such a perspective remembering is an example of an active process, where both sides of this tension are invol-ved. Remembering, and the individuals who carry the memory, are inherently situated in a cultural and social setting, since it involves socio-culturally situa-ted mediational means (Wertsch, 2002). How people learn and progress differ, but both heredity and environments have an important influence, according to Säljö (2000).
Continuous Learning
The thought of lifelong-learning can be found in the socio-cultural perspecti-ve, since it is characterised by no terminal point of learning; see Säljö (2000). This is because of the occurrence of the psychological and the physical tools or instruments, which are improved over time and influence human know-ledge and human intellect positively. Most prominent of the educational reforms and movements that build on these ideas are, for example, the adult education initiative in Sweden (National Agency for Education, 2000) and individual learning accounts.
8.3.3 Socio-cultural Learning and TQM
In this section we analyse the fundamental ideas of TQM against the funda-mental ideas of socio-cultural learning. The analysis is accomplished by means of the four analytical dimensions presented above.
The analysis is carried out through a comparison between the fundamental ideas through the glasses of each one of the four analysis dimensions. The connections found, between a certain fundamental idea and a particular

179
analysis dimension, are described below. Each one of the described con-nections is shown in Figure 8.3, and marked with a number.
In this way we try to answer the question whether Total Quality Management (TQM) and socio-cultural learning are complementary or conceptual opposites, in terms of their value-laden views on education and learning – are the phenomena friends or foes?
Analysis Dimension I: Societal focus and social dimension
According to Säljö (2000), socio-cultural theory emphasises the role of arte-facts in learning.
The societal development moves towards a more cognitive and service-based mode of production, including massive build-up of information, and life-style oriented production. Such a development supports the theory of socio-cultural theory and an increased use of it. See “1a” and “1e” in Figure 8.3.
On the other hand, the theory of TQM can be said to emanate from the very transition of an agricultural society into an industrial society with need for firstly checking the result of production and secondly control the production process. Within TQM, the view is strictly based on science, technology and ra-tionality. See “1j” and “1k” in Figure 8.3.
Analysis Dimension II: Organization of education and teaching
According to the socio-cultural theory, learning is not strictly applied to a classroom. People learn everywhere and constantly. From a socio-cultural perspective, learning should be organised so that students or pupils learn by participation in a practice. Hence, the traditional front-loaded view upon lear-ning and training is loosing ground as a model of how knowledge is re-created within the minds of people.
There is a careful attention to the institutional context of social interaction. Culturally, specific institutions such as schools, systematically structure the interactions that occur among people or between people and cultural artefacts, such as books or computers. This leads to that there should be careful attention to the way individuals interact to each other, as well as persons and artefacts interact to each other, and the way human life is organised upon the-se interactions. See “2a”-“2d” in Figure 8.3.
In the TQM view, the arrangement of education shall be based on customer needs and expectations. One concrete example of how learning can be shaped in a systematic way is the improvement cycle, also called the PDSA-cycle (Plan, Do, Study, Act); see Deming (1993). This cycle have similarities to the
180
cyclic learning model proposed by Kolb (1984). Kolb’s theories in turn, has connections to the theories of learning described by Dewey5, whose thinking in turn are connected to the ideas by Vygotsky. The thought of continuous improvement might be used for improvements by acquiring of new knowledge among humans, as well as improvements of the learning itself, meta-learning. For that reason, an educational organization shall be organised in a way that reinforce continuous improvements. The focus on continuous improvement is connected to the lifelong learning and to the socio-cultural perspective that learning will never stop. See “2f” - “2k” in Figure 8.3.
Analysis Dimension III: Perceptions of human being
In the socio-cultural theory humans both influence and are affected by a cer-tain context, so people might have both active and passive roles in relation to the surrounding world. There is a continuous and lifelong evolution among humans in the socio-cultural view. See “3b” and “3c” in Figure 8.3.
According to Säljö (2000), learning and progress among people differ, but both heredity and environment have an important role. The socio-cultural perspective is characterised by no terminal point of learning. See “3e” in Figure 8.3. The thought of life-long learning is to be found in the socio-cultural learning; see Säljö (2000). The occurrence of the psychological and the physical tools or instruments, which are improved over time, and their positiveinfluence on human knowledge and human intellect are here arguments. Most prominent of the educational reforms and movements that build on these ideas are, for instance, the adult education initiative and individual learning accounts, not to mention the paradigm of life-long learning (National Agency for Education, 2000).
Needs and expectations among both internal and external customers shall be collected and used as a base for the organizational activities according TQM. The staff in an organization is seen as internal customers, but they do not only have needs and expectations as customers in the organizational processes. They also have needs of personal development and the TQM value ‘everybody’s participation’ is based on active persons that are interested and motivated. See “3f” in Figure 8.3.
According to Björkman (2002), there are similarities between TQM and taylorism. But in this comparison, only the control view within TQM, including predictability, reduction of variation, and zero defects are taken into consideration. The three ‘quality gurus’ Shewhart, Deming, and Juran, mentio-
5 John Dewey (1859-1952) was an American philosopher and educational theorist, but also an important commentator on contemporary issues, due to his frequent contributions to popular magazines. (www.iep.utm.edu/d/dewey.htm)

181
ned by Björkman (2002), did not talk about TQM themselves and their view of quality work is not exactly the way TQM have been presented in this thesis. However, their ideas can be seen as a base for what is called TQM today. Even though control of processes is included in TQM, it embraces more, as has been described above. One example is the commitment among the staff, which involves some degree of freedom to manage the work. As Foster (2001) says, the focus of today is continuous improvements, not process or organizational control. So, how tayloristic the TQM theory is might depend on what parts of it and to which extent the different parts of it are introduced in organizations. See “3h” in Figure 8.3.
Analysis Dimension IV: Focus of pedagogy and role of teacher
According to the socio-cultural theory, learning is no longer only about receiving information, but to experience new physical and intellectual tools (artefacts). Hence the role of pedagogy is to make these tools available to the students or pupils in every possible way. It is also important that these artefacts or tools are used in a practical manner. See “4a” in Figure 8.3.
Within TQM it is essential to find out the needs and expectations of the custo-mers, and therefore firstly identify who the activities are aimed for. From that standpoint, the aim of TQM is to adapt and form learning to achieve these needs and expectations. Doing this, the concept of reflection is important, as the basis to perform changes in order to improve the efficiency of the organization. The role of the teacher might be to function as a mentor, rather than to reproduce knowledge for the pupils. The teacher’s role, which should be characterised by dedicated leadership, meaning acting as a coach and support to help finding new information and from that creating new knowledge, is also important. See “4f”and “4j”-“4k” in Figure 8.3.
Summary of the Analysis
Above we have discussed some similarities we have found between the two groups of fundamental ideas. It is when the fundamental ideas overlap each other it possible to do a comparison. In the comparison above we have not found any clear opposites between the two groups, but at the same time there are areas, where no overlaps exist and accordingly it is difficult to accomplish any comparison.

182
a) Use of means 1a 2a 4a
b) Communication 2b 3b 4b
c) Cultural context 2c 3c 4c
d) Mediation 2d 4d
Fundamentalideas withinsocio-culturallearning e) Continuous
learning 1e 3e 4e
Analysis dimensionsI
Societal focus & social
dimension
IIOrganization of education
IIIPercept-ions of human being
IVFocus of pedagogy & role of teacher
f) Focus on customers 2f 3f 4f
g) Focus on processes 2g 3g 4g
h) Improve continuously
2h 3h 4h
i) Fact-based decisions 2i 4i
j) Everybody’s participation
1j 2j 3j 4j
Fundamentalideas within total qualitymanagement
k) Management commitment
1k 2k 3k 4k
Figure 8.3 The analysis matrix diagram where the connections described in the analysis above are marked in the cells.
TQM and Socio-cultural Learning - Ideological Friends or Foes?
As the analysis has shown, there appears to be some similarities between the concepts. Indeed, even though the dissonances between the two at face-valid level appear strong, this study has shown that behind the rhetorical level, the theories do have some areas of mutual interest. The dissimilarities are most clearly shown on the analysis dimensions of ‘societal focus & social dimen-sions’, and ‘perceptions of human being’, which both emphasize the develop-ments of various methodologies that support man in society.
However, it is a fact that socio-cultural learning present learning as a phenomenon that not necessarily takes place in educational organizations, which might strengthen the similarities we have found. At the same time as socio-cultural learning does not imply an educational organization as the cultural context where it takes place, the continuous improvement part of TQM should be seen as a form of learning (Balbastre et al., 2003).
Finally, it is important to emphasize that this study only has analysed the un-derpinnings of TQM and socio-cultural learning on a theoretical level. As Furusten (1999) states, concepts do travel around the world in all kinds of forms and shapes. Therefore, further research within the field where TQM

183
and socio-cultural learning, but also other learning theories, are used in parallel in practice, is needed.
8.4 A Further Theoretical Discussion
The perspective of criticism about TQM at one hand, and the problem with vague descriptions of the concept mentioned in Chapter 2 on the other hand, gives a picture of TQM as a concept, which to some extent is unspecified. This picture of TQM is also supported by Park Dahlgaard (2002), who states that TQM is characterized by a dual or multiple framework; TQM is “…holisticas well as atomistic/reductionistic?, human as well as mechanistic, and dynamic as well as static.”
This dualistic description of TQM can also be noticed in the description of the development of TQM as two schools by Kroslid (1999). Park Dahlgaard (2002) has found support for this dualistic view of TQM by authors, who can be placed in two groups because of their perception of TQM. On the one hand, some authors view TQM as “…normative, cultural oriented, humanistic, participative/involvement and change/innovation oriented…”. On the other hand, one group of authors considers TQM as “…’new Taylorism’ or a ‘new scientific mana-gement.”.
However, as shown in the discussion above, parts of the criticism can be met by definitions and descriptions of TQM, or by the dualistic characteristic of TQM, described by Park-Dahlgaard (2002). However, still there are parts that can be questioned. This is indicated by the following discussion.
8.4.1 The influence of school code
Arfwedson (1983) uses the concept of ‘skolkod’ (in Swedish), here translated to ‘school code’. According to him, there is a tendency that more or less commonly interpreted judgements and assumptions of attitudes appear regarding a work place and its environment and problems.
However, it is not sure that all people within a school judge in the same way and share all views. However, most of them are at least conscious about the views that are dominating and which judgments the most influential people in the organization have. Arfwedson (1983) means that neighbourhood, traditions, staff and pupils interact with each other, but also in connection to the rules and goals of the school system, when the school code is created.

184
Arfwedson (1983) means that it is not possible to completely judge what a school code contains, since it can vary from school to school and also over time. Since the factors contained in the interaction, change over time each school code continuously changes. In principle, it is possible that each one of the teachers might influence the school code. However, the status and role the person has in the system influences the real possibility for this influence.
Besides the power that headmasters have, it is possible to notice a number of teachers with high influence. Arfwedson (1983) means that the school has more hierarchical organisation than several other working places. An informal power structure is often created, built upon personality, competence and employment time at the particular school.
According to Arfwedson (1983), it is quite possible that the power of the individual teacher has decreased over time, but increased among different groups of teachers. At the same time, the different situation in last years compared to earlier, might be possible to identify regarding the headmaster’s changed position and reduced influence. Earlier the headmaster controlled the school code, maybe in cooperation with a number of “high status” teachers. Nowadays, the headmaster is to a higher degree questioned and contradicted.
8.4.2 Leadership and Teachers Attitudes
This development might be set in relation to the TQM-value ‘let everybody be committed’ that is described in Chapter 2. In addition, it also can be connected to the description of leadership in form of a continuum or range, between the two extremes “the manager who maintains a high degree of control…” and “…themanager who releases a high degree of control” (Tannenbaum & Schmidt, 1973). In Figure 8.4 their idea of available leadership behaviour is presented as a continuum instead of just one of either authoritarian or democratic.

185
Manager able to make decision which non-managers accept.
Manager must ’sell’ his (sic!) decision before gai-ning accep-tance.
Manager presents decision but must respond to questions from non-managers.
Manager presents ten-tative deci-sion subject to change after non-managers inputs.
Manager presents problem, gets inputs from non-managers, then decides.
Manager defines li-mits within which non-managers make deci-sion
The organi environment
The societal environment
Area of freedom
for non-managers
Area of freedom
for non-managers
zational
Manager and non-managers jointly make decision within limits defined by organizatio-nal constraints.
Non-manager powerand influenceManager power
and influence
Figure 8.4 Continuum of manager – non-manager behaviour. There is a continuum or range of possible leadership behaviour available. From Tannenbaum & Schmidt (1973).
Arfwedson (1983) says that there are, in many cases, large differences between teachers within a school regarding how they look at their profession. He means that it is possible to identify two extreme situations with a number of variations between.
”The teacher looks at
himself as a ordinary
worker, with decided
duties and working times,
contractual working
contribution and
compensation in spare
time and salary. Money is
the reason to work”
”The teacher, who looks at
himself as an ’educator’, who
lives with the work on full time
and does not separate working
time from spare time. The work
makes the teacher’s life richer
and compensation is not
important.”
Figure 8.5 Illustration of a scale between two extreme positions related to how teachers look upon their profession. From Arfwedson (1983).

186
The two extremes in Figure 8.5 seem to be fairly general, and applicable in more organisations than just within the school sector. It might therefore be interesting to use it also when other organizations are studied.
According to Arfwedson (1983), the reason for many conflicts can be found in the fact that the teachers at a school take different positions on the scale in Figure 8.5. He means that this holds in particular regarding improvement work, since this requires more work and higher efforts to make it possible to perform the improvements. How large the resistance against improvement work is depends on how the teachers are spread in their view of the profession, or, in another way, what positions on the scale they have.
It seems reasonable here to draw a parallel to the work with self-assessment and the additional work this may cause an organization. This situation may cause teachers that hold a position to the left on the scale in Figure 8.5 to be negative to the self-assessment initiative. Here is one obvious relation to the USS-project and probably one explanation to the fact that the project was interrupted. But, on the other hand, it is not sufficient that people want to participate in the improvement work. It is also necessary that they share the basic view and the values that the improvement work is based on.
187
Chapter 9
Comparison of Empirical Findings and the Theoretical Discussion
n this chapter a comparison and an analysis is made of the empirical findings described in Chapter 7 and the theoretical discussion in Chapter 8.
9.1 Background
One experience from both the three empirical studies and the theoretical discussion presented in this thesis is the importance of agreement about the values of TQM in an organization, before it is possible to do any successful TQM-work.
It is shown in Chapter 2 that some weaknesses exist regarding the definition of TQM. There are several interpretations of the concept, which contributes to the difficulties related to implementation and application. However, it should be mentioned here that one reason for this situation is also the continuous evolution of the TQM concept as such. In fact this evolution is in itself in agreement with the core value of TQM of ‘continuous improvements’, and Hellsten & Klefsjö (2000) even defines TQM as ‘…a continuously evolving management system…’ ; see Figure 2.3.
In spite of that evolution, it seems to be an agreement among many people working within the quality area about the main core values; see Section 2.2.4. In the theoretical discussion in Chapter 8, it was revealed that, among people working outside the TQM area, there are interpretations of what TQM and its values stand for, which do not agree with the views discussed in Chapter 2. However, at the same time is seems as at least some of the core values, in spite of existing descriptions, made by people within the quality area, contains a
I

188
span of interpretations. In other words, it seems possible to separate two interpretations of values, which are discussed in Section 9.2
9.2 Different Interpretations of TQM-values
In the light of what is said in Section 9.1 follows here a discussion about the two forms of interpretations of values in TQM. The following discussion of values contains some examples of interpretations and should not be seen as a complete and covering review.
9.2.1 Misunderstandings
During the work within the three self-assessment projects described in this thesis, it has been obvious that some of the TQM-values have been interpreted in a way, which differs from the established TQM view, we could say that they have been ‘misunderstood’.
In particular, the value ‘customer focus’ have been interpreted in a way that obstacle a lot of persons to feel motivated to participate in the self-assessment work based upon TQM.
Customer Focus
There are at least two interpretations of the customer concept, which have appeared now and then in the three projects with self-assessment, described in Chapter 4-6.
One interpretation is that ‘customer’ is the same as ‘buyer’ and not, as described in Chapter 2, ‘those we, and our activities, should to give value to’. This problem may partly be due to the everyday interpretation of the word ‘customer’ as ‘a person, who makes purchases or benefit from a certain type of service’6; the Swedish National Encyclopaedia (1996).
Since the pupils and students in the educational forms that are included in the three projects in the thesis do not buy their educations, this interpretation leads to that the customer concept was perceived as irrelevant to use for many teachers in their work.
The other interpretation is that the ‘customer focus’ should be interpreted as giving the customers what they want, i.e. fulfil their expectations, without
6 The origin of the word ‘customer’ is from the German word ’kunde’ meaning ’well-known’; the Swedish National Encyclopaedia (1996).

189
exception in all cases, since the customers always are right. The enlarged perspective of ‘needs and expectations’ does not seem to be well-known (or not attractive) either. The same holds for the knowledge of the Kano model, illustrating ‘basic needs, expected needs’ and “excitement needs’; see Kano (1995).
Process Focus
As described in Chapter 2, there is some dissimilarity between how different authors define the concept of process, but the main thoughts are more or less the same. One main point is that a process focus stimulates a customer focus as well, since ‘…it transforms certain resources to result that should satisfy its customers’.
However, there might be a risk that the process concept is interpreted freely and that it is seen as containing activity descriptions only. In this case, the near connection between the two conceptions ‘process focus’ and ‘customer focus’, described in Chapter 2, is forgotten or neglected.
The difficulties to grasp the TQM interpretation of the process concept in educational organizations may be due to that the concept is used within pedagogical contexts meaning the unique relation between the teacher and the pupil, which develops over time. In the pedagogical context the unique element is often emphasized, while the repetitive element is emphasized within TQM; Bergman & Klefsjö (2003).
System View
It was clear at least within the USS-project that a lack of system view existed. The teachers wanted to focus on what happened in the classroom and were not that interested to see the own activities as part of a system; see comments in Section 6.5.3. This experience is also in agreement with Cruickshank (2003) who discusses TQM applications in the academia and means that “academicmembers will need to recognize their institution as a system, and view the institution as a system of interrelated parts”.
9.2.2 Interpretations
Experiences from the three self-assessment projects described in this thesis as well as from literature studies have shown that there are possible to do different interpretations even though existing definitions are used. The existing definitions do not always seem to clarify every part of a phenomenon, which results in possibilities for making different interpretations.

190
Customer Focus
Even if an organization uses a customer focus perspective and defines their customers as ’those the organization want to create value to’ and also stipulates who the customers or groups of customers are, an organization may choose to focus on just one customer group at a time, due to lack of resources. The USS-project is one such example. Here several customer groups were identified at the four units in their ‘overview’, but the organizations decided to answer the questions in ‘Lärostegen’ based upon just one of them.
This might be a reasonable way to handle a situation when there is a will to work with TQM activities, like self-assessment, but the resources are limited. If this is taken into consideration in the decision making, there have to be an awareness of that all facts are not known because of a deliberately choice. But when an organization has made such a choice, there is a risk for sub-optimization
Everybody’s Commitment
This example is related to the description of the working environment in schools, by Arwedson (1983), which was discussed in Section 8.4. According to the interpretation of ‘everybody’s commitment’ in Chapter 2 this value means that all members in the staff should be given possibilities to be involved in the organization’s work with quality improvements. To obtain this, the management must create possibilities for the members of the staff to be involved. This in turn means, of course, moral support, but also sufficient resources in the form of time and training. But, as Arwedson (1983) states, this is not sufficient. The management can only create possibilities for commitment. It is also required that the members of the staff themselves want to be involved and are motivated to participate. They must see ‘what is in it for me’. This is discussed in, for instance, Bergman & Klefsjö (2001) and Harnesk (2004).
This situation of unwillingness was apparent also in the USS-project, described in Chapter 6. Some people expressed clearly that they did not want to work with self-assessment but do other tasks instead. In other words, the empirical experiences presented in this thesis support the discussion in Section 8.4.2.
Committed Leadership
According to the description of the TQM-value ‘committed leadership’, a leader has to support quality work financially and morally as well as serve as a model and be active in the practical improvement work; see Section 2.2.3. However, this view of leadership is connected to the description of different leadership patterns by Tannenbaum & Schmidt (1973) and presented in

191
Section 8.4 indicates that there might be a span for interpretation and behaviour.
Continuous Improvements
Concerning this value, one point of discussion is what should be improved; on which base should decisions be taken about what should be changed to achieve improvement? Here it can be mentioned that within the USS-project several people expressed strong doubts about the benefit of assessments in general, in the sense that they did not believe that anything should happen.
According to Bergman & Klefsjö (2003), improvement work shall comprise the three ’p:s’, namely ’people’, ‘products’, and ‘processes’. But still there is a question about on what base these three areas shall be improved. It might be reasonable to use the customer focus as a base for the decisions because of its strong position within TQM, but this is not clarified in the descriptions of the field TQM.
It might be argued that improvements that increase financial results or decrease costs shall be preferred as well. Such improvements might give advantages to owners, customers and others. So, here the question about who shall get advantages of improvement work is found.
These examples related to different stakeholders indicate that a discussion about from what perspective improvements should be prioritized is important in order to avoid different interpretations within the TQM-values.
TQM and Socio-cultural Learning
We can see that some of the basic core values have had difficulties to be accepted in the educational organizations for different reasons. However, on the other hand, the comparison in Section 8.3 between the ides of TQM and socio-cultural learning did not reveal any large contrasts. One conclusion may be that the core values and basic ideas of TQM have not been discussed sufficiently with in the educational sector and that this is a matter of time.

192

Part IV
The Bottom Line

193
Chapter 10
Conclusions and Discussion
his chapter describes the most important conclusions that can be drawn based on the accomplished research described in the earlier chapters of this
thesis. A discussion related to the results is also included. Finally, some suggestions for further research based on the findings are presented.
10.1 The Three Research Questions
In the title of this thesis, the main question is asked, namely whether TQM-based self-assessment is a help or hindrance for the educational organizations that accomplish such work. In order to answer this question, the whole TQM system has to be taken into consideration. The reason is that the components of the system, which are described as ‘the TQM-triad’ in Chapter 2, are linked together and dependent of each other. Therefore, the aim of the thesis was specified in three research questions, each one connected to one of the three components in the TQM-triad. The conclusions, as well as discussions related to the results, are presented below using three headings connected to each one of the three research questions.
10.1.1 The TQM-values
Research question number one was formulated:
• How well is a culture, based on the TQM-values, in harmony with the existing culture in the educational sector?
In order to answer this question, the empirical part of the thesis in Chapters 4-6, as well as the theoretical discussion in Chapter 8, has been a foundation. With this base the answer is ambiguous. The reason is that the suitability of the TQM-values within the educational sector, seems to depend on the opinion of the people that get in touch with them.
T

194
People within the educational sector, defined as in Figure 2.20, look differently upon the TQM core values, and accordingly there is a variation between different educational organizations concerning the maturity related to the TQM-culture. In other words, there will probably be differences in how well the TQM-culture would suite an existing culture.
On the other hand, looking at the comparison made in Chapter 8 between the TQM-values and the basic ideas of socio-cultural learning, no obvious confrontation was obtained. Therefore, it is hard to see that any of the TQM-values is in conflict with that kind of learning.
As described in Chapter 2, there is not just one single definition of TQM, and as shown in Chapter 8, people in some cases describe TQM as something quite different compared to today’s theoretical view of the concept. Moreover, even if one of the definitions shown in Chapter 2 is used in this thesis, there are examples of possible spans of interpretation within TQM-values, see the discussion in Chapter 9. So, it seems that the suitability of TQM within educational organizations partly depends on the interpretation within the organization of what is called TQM.
On the other hand, it is obvious that a TQM-based culture is possible to obtain in an educational organization. There are a number of such organizations that have got different quality awards, national awards or awards intended for the school sector. In 2001, for instance Älta School outside Stockholm got the Swedish Quality Award, St Mary’s College in Northern Ireland got the European Quality Award, and Chugach School District in Anchorage in Alaska, Pearl River School District in New York, and University of Wisconsin-Stout all got the Malcolm Baldrige National Quality Award – in all cases in comparison with traditional private manufacturing and service companies. A description of the three Malcolm Baldrige recipients can be found in Daniels (2002). Accordingly, it is not at all impossible to create a TQM-culture in an educational organization. It could be mentioned here also that the new category intended for “educational organizations” has 17 applications during 20041, which indicates an interest to create or support a TQM-based culture as well as a keen interest for quality improvements.
But in all these cases when an educational organization has got a quality award, the headmasters have been convinced about the benefit and have been driving forces in the work; Daniels (2002). This indicates that a sufficient level of knowledge and maturity has to be obtained first, not the least among the managers. This conclusion is supported by experiences from a case study of
1 That can be compared with 22 applicants within the category ‘healthcare organizations’, 8 within the category ‘large manufacturers’ and 8 within ‘small businesses’, and 5 within ‘service companies’ during 2004. (Quality Progress, August 2004, p. 17)

195
organizations working with self-assessment presented by Samuelsson & Nilsson (2002).
The initiative is to a large extent dependent of the headmasters, who must themselves be convinced of the applicability and have arguments for that in order to create a successful discussion within the organization. But when discussing maturity, it seems important to include co-workers as well, not at least since everybody’s participation is one of the values within TQM as defined in Chapter 2.
Since the TQM-base originally was established in the private sector, one can wonder whether there is a difference of interest and applicability between organizations from the private and the public sector. However, looking at the experiences from the AVE-project, in which both private and public organizations participated, it is hard to see any differences in attitudes between the sectors; see Table 4.42.
To sum up, it is not possible to answer ‘yes’ or ‘no’ to the stated research question. Instead it seems, as in many other cases, to a large extent be dependent on the maturity within the particular organization. It seems clear that the values have to be discussed and rooted in the organization before a TQM-based self-assessment is started.
In Figure 10.1 the two discussions, mentioned in Chapter 8, about leadership patterns by Tannenbaum & Schmidt (1973) and about co-worker patterns by Arfwedson (1983) are combined. This is done in order to illustrate that the meeting between these two patterns might influence the possibility to adopt TQM work within an organization. On the horizontal axis the seven manager patterns by Tannenbaum & Schmidt (1973) are shown. On the vertical axis are the two extreme variants of co-worker patterns, by Arfwedson (1983), discussed in Section 8.4. The shaded area illustrates a combination of the patterns that might support use of TQM in the educational organizations. Itmight be discussed if there is a continuum on the horizontal axis to the right in the figure, where the leader has capitulated, and whether TQM is possible to use then. The vertical axis might be drawn downwards as well, but this area, logically viewed, is an impossible area for TQM.
Figure 10.1 also illustrates a dilemma regarding TQM. The core value ‘everybody’s commitment’ gives support to leaders who choose a leadership to the right on the scale. However, to do that means at the same time that it is more difficult to implement TQM if the co-workers for some reason do not want that.
2 In the AEI-project just one private organization participated so it is impossible to draw any conclusions from that project.

196
Manager able to make deci-sion which non-mana-gers accept.
Manager must ’sell’ the deci-sion before gaining acceptance.
Manager presents decision but must respond to questions from non-managers.
Manager presents tentative decision subject to change after non-managers inputs.
Manager presents problem, gets inputs from non-managers, then decides.
Manager defines li-mits within which non-managers make decision
Manager and non-mana-gers jointly make deci-sion within limits defi-ned by orga-nizationalconstraints.
The non-manager regard him- or herself as an employee wor-king for the salary, with certain tasks, working hours, work effort and compen-sation with the salary and leisure time. The work is livelihood.
The non-manager that lives with the work full-time and do not distinguish between working hours and leisure time. The work makes the life richer and compen-sation in form of salary and leisure is not a determining factor.
‘Possibility-area’ for
usage of TQM
.
Supposed increasing possibility
‘Impossibility-area’
for usage of TQM
.
Figure 10.1 In this figure the discussions about leadership patterns by Tannenbaum & Schmidt (1973) and about co-worker patterns by Arfwedson (1983), discussed in Section 8.4, are combined. This is done in order to show that the meeting between these two patterns might influence the possibility to adopt TQM work within an organization. The shaded area shows an example of combinations of patterns that might support usage of TQM.
10.1.2 Methodologies
Research question number two was formulated:
• How suitable is TQM-based self-assessment as a methodology within the educational sector to support quality improvements?
When answering this question it is important to recognize that there are three components in the question that have to be taken into consideration; two about the methodology itself (‘TQM-based’ and ‘self-assessment’) and one about the outcome of the methodology (‘quality improvements’)

197
Firstly, there is a connection to the first research question regarding the component ‘TQM-based’. TQM-based self-assessment means assessing an organization’s work related to quality, where quality is defined from the perspective of customer needs and expectations. The fact that the methodo-logy is based upon the TQM-values implies that these values have to be accepted by the people that shall carry through the work; see Eriksson (2003). The importance of this has been observed in all the three projects. In particular this holds for the USS-project, where the resistance from several persons was very obvious and frequent discussions and comments appeared3.
It is important here also to remember what TQM-based self-assessment means, namely to assess an organization’s work related to quality, where quality is defined from the perspective of customers needs and expectations, and also based on the other core values. This means that difficulties will appear if those who shall perform the self-assessment do not share the customer perspective and the view of what quality is.
Secondly, self-assessment can be performed in different ways. The suitability seems partly to deal with choice of the process. In this thesis all projects were performed according to the quality award process, and the reasons were presented in Section 3.4.2. The experiences found are that this process was considered to require too much resources.
If resources are not available and if sufficient maturity is not yet obtained in the organization, it seems to be better to use a simpler process the first time self-assessment is performed to study whether the ideas are fruitful. This conclusion is supported also by Conti (1997) and Eriksson (2004). To use a simpler approach than the award process might be even more important in an organization in which there are doubts about the benefit of self-assessment as a methodology.
However, the positive experiences by the staff, not the least in the USS-project, about the documentation and presentation of the ‘overview’ (see Chapters 4-6 and Figure 6.9), confirm that there in many cases is a need to create a shared picture of the organization, its surrounding environment and how the work is performed within the organization.
Earlier research and experiences related to self-assessment has emphasized the planning phase; see Svensson & Klefsjö (2000, 2004), Eriksson (2003) and Conti (2002). This point has once again got strong support in this thesis. The intended self-assessment work has to be rooted, the reasons and the goals with the performance of self-assessment must be clear – and the managers have to
3 This observation may of course partly be due to the author followed the USS-project deeper and geographically more close than the other two projects.

198
know what it means both regarding theory and practice as well as the need of resources. This comment is emphasized also by many authors related to general organizational changes and not specific for the self-assessment work; see, for instance, Pressman & Wildavsky (1973), Sandberg & Targama (1998) and Eisenstat (1993).
One thing, which has shown to be important to emphasize when self-assessment is discussed within an organisation is the fact that the assessment is aimed to be done at organizational level. A number of times during the described three projects in this thesis, people have felt anxious that the individual person’s work should be scrutinized. This is also strongly related to the overall aspect of this type of assessment. The aim is to focus on the way we work in the organization and in that way create a base for the improvement work - not to find ‘whipping-boys’; Brown & van der Wiele (1996). This also deals with the importance of having a system view.
The main point with self-assessment, namely that the staff itself creates a picture of how the organization’s work on a system level, find strengths and improvement possibilities and themselves decide about improvement activities, is judged to be suitable for educational organizations, not the least due to the close ideological relation between self-assessment and learning; see Hellsten & Sandvik Wiklund (1999) and Balbastre et al. (2003). Which organization should be a learning organization if not an educational one?
Thirdly, the number of organizations within the AVE-project and the AEI-project that have said that they found possibilities for improvements is another measure that supports the view of self-assessment as fruitful. A large majority of the organizations participating in the projects discussed in this thesis have confirmed that they found improvements.
When considering the benefit of self-assessment for quality improvements it is also important to remember that several of the participating organizations had not passed all the four phases when the empiric for the thesis was gathered. That might of course have influenced the judgements.
Scherp (2004) discusses a ‘platform’ for improvements in the school environ-ment based on the everyday problems and dilemmas that occur to teachers and headmasters. This is an approach, in contrast to the TQM-based self-assessment, without a system view. Experiences, primarily documented in the USS-project in the interviews and in the third questionnaire, emphasises the need of this improvement work as well.
It seems quite possible that the organizations within the educational sector need both the two approaches of improvement work.
199
10.1.3 Tools
Research question number three was formulated:
• How should a tool for TQM-based self-assessment be designed to support self-assessment in the educational sector?
Based on the empirical experiences, the conclusion is that in all the three projects the tools have been experienced as too comprehensive.
The two versions of ‘Läroverket’ were created based on good experiences from using the Springboard, mainly in industry; Hellsten (1997a) and Nilsson (1999). ‘Lärostegen’ was designed from a process model (see Figure 6.2) in order to reduce the contents even more but still keep the basic improvement ideas from TQM and to create a tool, which could give a fairly good overview of the organization’s work today on a system level. If the tool is reduced even more the complete picture, the system view, probably is lost.
This result is not only related to the educational sector, but many other types of organizations as well. With less resources and ‘leaner’ organizations there is a need for less comprehensive tools if self-assessment should be able to perform. Here the reduced resources in the public sector certainly influences on the need of reduced tools. As a further example, the number of applicants to the Swedish Quality Award decreased during 2001-20034. The main argument when talking to possible applicants is lack of resources5.
A less comprehensive tool may consist of fewer questions. Another possibility is that minor information is required to answer the individual questions, for example, answers on a grade scale instead of a full description. Another idea might be to just ask about ‘what’ the ‘approach’ is and ‘why’ the ‘approach’ is used and compare these answers to the outcome. In those cases where the outcome shows that the used approach does not fulfil the aim, a ‘how’-description can be a complement to identify causes.
However, the author’s opinion is that parts of the benefit is lost if the tool becomes too ‘lean’, since one main point is the focus on ‘how’ we work (the way we work) and not primarily ‘what’ we do (the individual output of the process). This is also close to the ideas of the process view, which is an important part of TQM.
4 The number of applicants was 6 and 7 during 2002 and 2003, respectively, but between 10 and 17 during 1994-2001. 5 Personal communication with Bengt Klefsjö, member of the judge committee of the Swedish Quality Award all the time the award has existed.

200
It was also clear that there was criticism saying that the organization could not recognize the own situation and the own business in the used tools, as the questions were experienced too general in their formulation. The possibility to identify the own business seems to be more important the lower TQM maturity level the organization has. Another result, related to this discussion, is that it is important to use concepts and a terminology that does not block the discussions, as the concept of ‘customer’ did, primarily in the USS-project.
10.2 General Conclusions
It is important to realize that the obtained results of the three research questions presented above do not give a complete picture that can be used to answer the overwhelming question whether TQM-based self-assessment is help or hindrance for educational organizations.
One reason for that is that the possibility to answer the overwhelming question requires that all the steps in the chain described in Figure 1.1 and Figure 10.1 are passed through. This thesis only focuses on the first parts of the chain. This fact does not imply that the three research questions do not have relevance. On the contrary, the commented results related to the research questions should be considered as indications and conclusions how to facilitate the introduction and performance of self-assessment.
work
Areas possible for
improvements
• End of self-assessmentwork/• Start of improvement work
• Stop / new turn
Facts about thework in an organisation
and the resultsfrom this
Gained resultsof changes:
• Start
- improvements-no improvements
Scope of this thesis
Self-assessmentSelf-assessmentImprovement work:
Changes in order to
get improvements
Improvement work:
Changes in order to
get improvements
Figure 10.1 This figure illustrates the scope of this thesis in relation to the self-assessment and improvement work. The figure is based on Figure 1.1. Each one of in these procedures consists of four phases closely related to the PDSA-cycle.
There might be several obstacles for educational organizations to use TQM-based self-assessment, but one thing that spontaneously and frequently was mentioned by the representatives from the organizations in all projects concerned lack of resources. This opinion was mentioned during the training sessions dealing with how to accomplish self-assessment, when the author met the several representatives in a group, but was also given during individual dis-cussions. So, it appeared that one main problem was the lack of resources

201
combined with the opinion that ‘Läroverket’ in both versions, as well as ‘Lärostegen’, were considered too extensive.
This picture is also strengthened by the fact that most organizations had prob-lems to carry through the self-assessment work. For instance, after more than one year, just a few of the AVE-organizations had fulfilled the description work (phase two) and started the third phase containing analysis of the description. Accordingly, in just a few cases the improvement work based upon their self-assessment had started at the time for the questionnaires.
This leads to a difficulty when trying to answer the overwhelming question in the thesis. One form of answer has, however, been obtained by the use of the attitude questions in the AVE-project and the AEI-project. According to these, a majority of the respondents in the organizations in both projects expe-rienced self-assessment as useful in several perspectives. However, here it is important to remember that it is not quite sure that the attitude-measurements used really measure what they are aimed to.
Many people seem to have a diffuse picture of what is considered as quality within the environment they are working. Many do not seem to have thought very much on this and even less have a shared view within the organization. When requirements appear on performing some form of quality improvement work, or when there is a will to work with quality improvements the result is too often that the organization starts working with self-assessment without sufficiently think of ‘why’ and ‘how’. The work is performed without preparing all people, who should participate in the project and discuss those core values, which constitute the base for TQM. One example is that quality should be defined from the perspective of customers’ needs and expectations.
Therefore, it seems to be of great importance that the start with self-assessment is done in a conscious and well prepared way. A clear experience, in particular in the USS-project, is also the importance of establishing the project before start. The USS-project was experienced as a top-down project with decisions taken from the managerial group.
Figure 10.2 illustrates a number of possible ways to choose when starting such a work. It is reasonable to assume that alternative A should be the best way to start the work. However, as shown in Figure 10.2, a start at A can lead to that a TQM-based self-assessment procedure not will be performed. But, on the other hand, that methodology is not an end in itself. If the organization has not reached the necessary maturity level it is probably waste of resources to start a comprehensive self-assessment project.

202
QualityQuality
TQM-valuesTQM-values Self-assessmentSelf-assessment
Other qualitydefinitions
Award method.Award method.
Some other methodology
Some other methodology
Tools forself-assessment
Tools forself-assessment
’Lärostegen’’Lärostegen’
Some other tool
Some other tool
Possible entrances to TQM-based self-assessment Possible entrances to TQM-based self-assessment
B C D E F
A
Other methodologies
Figure 10.2 There are several possible entrances to work with TQM-based self-assessment in an organization, inside or outside the educational sector.
In the case, for example, when somebody comes across a tool for TQM-based self-assessment, it is of course a possibility to enter self-assessment work, as ‘Lärostegen via ‘F’. But, according to what has been said above, there is a need of decision making within the earlier boxes in Figure 10.2 as well. Therefore, the person has to go backwards through the chain shown in Figure 10.2.
Based on the experiences described in Chapter 4-6, the following two points seem important to have fulfilled in order to recommend to start the work with self-assessment:
• The manager, who decides about TQM-based self-assessment, has to understand and accept the different parts in the chain shown in Figure 10.2 and their consequences.
• At least those members in the staff, who shall be involved in the work must also have the same understanding.
These two points must be taken care of during the planning phase within the TQM-based self-assessment procedure.
Finally, we want to touch upon a reflection by the author concerning self-assessment as a hindrance. Educational organizations are also considered creative organizations. Some people mean that too much structure might be an obstacle for such organizations in their creativity. For instance, Hackman & Wageman (1995) touch this issue. However, it is hard to see that the structured self-assessment really is such an obstacle.

203
10.3 Some recommendations
Based upon what has been found in this thesis, there seems to be at least five points that are central when using self-assessment.
One is the importance of planning, since this is something that is recurrent in different aspects of the analysis. It is obvious that the managerial group in the USS-project did not focus enough on the planning phase. This shows the importance of really devote time and resources to accomplish a profound planning phase, where different aspects of the self-assessment project are discussed and decided upon. Here is as well a link to leadership issues and how and which different projects shall be adopted; shall it be done by top-down decisions and implementing, or by some other approach?
Another point is organizational context. Due to experiences from the projects referred to above, it is important to pay attention to the overwhelming organizational context for a self-assessment working organization. Decisions made at a higher organizational level and whether the leaders, same or new, have the same view regarding project priority, might affect the possibility to accomplish a self-assessment project that already has been started. The occurrence of any organizational levels above the one using self-assessment requires that also this level has to be included and taken into consideration.
A third point of importance is resources. If a self-assessment project shall be possible to carry out, there have to be enough resources. One possible way to assure this is to choose form of the self-assessment methodology, including choice of tool and how many people that shall be involved, in relation to the aim and the available resources. Also here the importance of the planning phase is clear.
A fourth point that appears as important is communication. This is connected to communication about needs and expectations within the organization that will use self-assessment as well as between this organization and any external support. As a part of the communication, different roles among the people involved in a self-assessment project have to be clarified. An important part of the communication is of course to establish the core values, which are the base for the self-assessment work.
The co-workers’ view is something that also have to be considered and handled in a proper way if it shall be possible to create participation. This is important since there might be differences among the co-workers view or differences between the view among co-workers and leaders. Examples of important forms of views are their confidence in the leadership, different views of quality and whether the work in an organization shall be based on TQM-values or
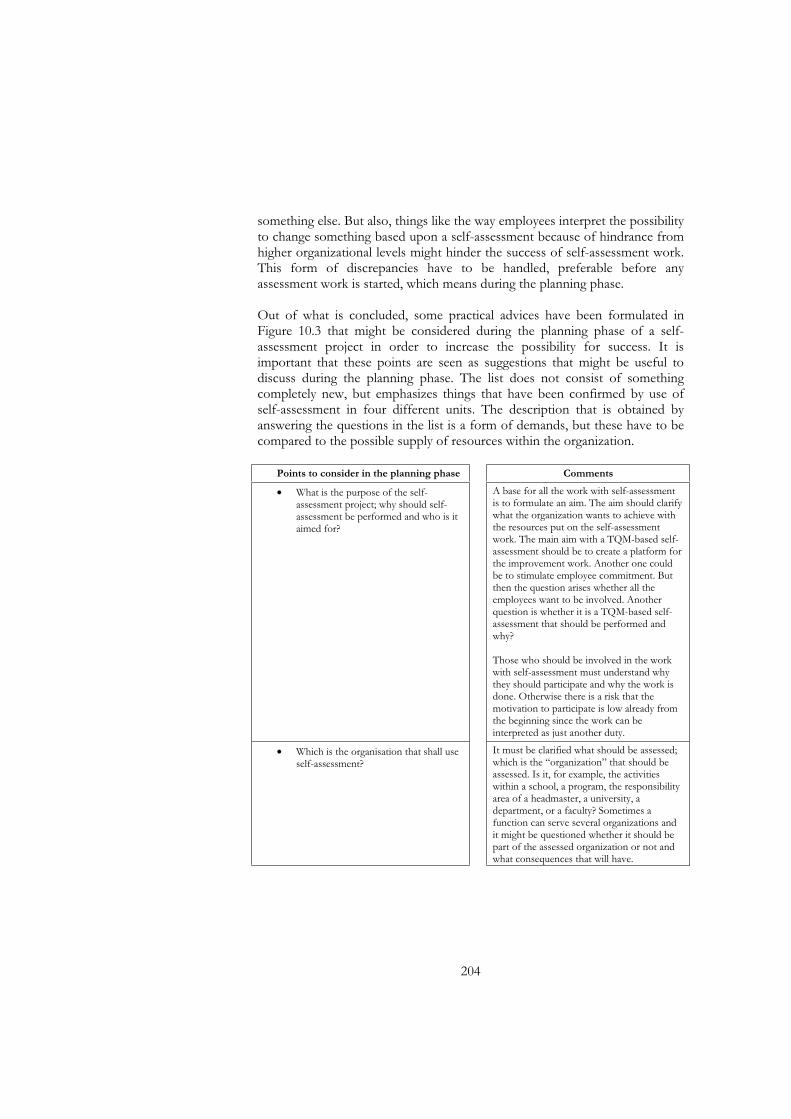
204
something else. But also, things like the way employees interpret the possibility to change something based upon a self-assessment because of hindrance from higher organizational levels might hinder the success of self-assessment work. This form of discrepancies have to be handled, preferable before any assessment work is started, which means during the planning phase.
Out of what is concluded, some practical advices have been formulated in Figure 10.3 that might be considered during the planning phase of a self-assessment project in order to increase the possibility for success. It is important that these points are seen as suggestions that might be useful to discuss during the planning phase. The list does not consist of something completely new, but emphasizes things that have been confirmed by use of self-assessment in four different units. The description that is obtained by answering the questions in the list is a form of demands, but these have to be compared to the possible supply of resources within the organization.
Points to consider in the planning phase Comments
• What is the purpose of the self-assessment project; why should self-assessment be performed and who is it aimed for?
A base for all the work with self-assessment is to formulate an aim. The aim should clarify what the organization wants to achieve with the resources put on the self-assessment work. The main aim with a TQM-based self-assessment should be to create a platform for the improvement work. Another one could be to stimulate employee commitment. But then the question arises whether all the employees want to be involved. Another question is whether it is a TQM-based self-assessment that should be performed and why?
Those who should be involved in the work with self-assessment must understand why they should participate and why the work is done. Otherwise there is a risk that the motivation to participate is low already from the beginning since the work can be interpreted as just another duty.
• Which is the organisation that shall use self-assessment?
It must be clarified what should be assessed; which is the “organization” that should be assessed. Is it, for example, the activities within a school, a program, the responsibility area of a headmaster, a university, a department, or a faculty? Sometimes a function can serve several organizations and it might be questioned whether it should be part of the assessed organization or not and what consequences that will have.

205
• Which are the conditions in the organizational context?
Is there support in the organization for starting work with self-assessment and the improvement work afterwards? Examples of obstacles might be lack of long-term perspective, lack of internal support, lack of cooperation with higher organizational levels, forth-coming organizational changes as reduction or new leaders. If organizational changes are ahead, the project must be planned in a way, which makes it possible to continue the self-assessment to the end if it should give sufficient value.
• During what time period shall the project be carried through?
The self-assessment work should be done at a time point when it is suitable due to other ordinary duties and projects. A long stop in the self-assessment work is negative and it is also dangerous if the work takes too long time, since the description then can give something that was reality earlier instead of what is reality today.
• Which one of the self-assessment methodology variants shall be used?
There are different ways to perform the self-assessment. The description of the four phases (see Figure 2) is on a general overview level; different ways to gather facts and make the description, as well as perform the analysis afterwards, should be considered.
• What tool shall be used? Different tools means differences related to what shall be assessed in an organization and in what detail. This in turn means differences in the resources needed.
• Which people shall be involved in the project (the amount of people included)?
It is often emphasized that the more people in an organization is involved the better description is obtained and in the same way employee commitment is obtained. On the other hand it is also important to realize the practical consequences of involving many people.
Firstly, there is the question whether all people want to be committed in a TQM-based self-assessment. If not, how should the situation be handled.
Secondly, there is a question of resources. Can everybody get sufficient time to participate?
Thirdly, there is a question how those who should be committed should be involved.
Fourthly, in which parts or in which phases of the self-assessment shall each one be involved?

206
• It must be decided what education and training is needed
•
What previous knowledge does each one of the persons that shall be involved have and to what amount is knew knowledge needed? This is connected to what methodology and what tool that are chosen, but also to resour-ces; what amount of resources can be spent on training, for teaching people as well as for those who will or need to gain more knowledge.
• It must be decided if any external support is needed and role that support should have
If external people are involved to support the work with self-assessment, it is important to clarify the extent and the roles of the different parts both to each other but also to the employees. An external part can, for example, be involved as a support to create the project plan, but it is important to clarify who has the responsibility as project leader to take the different steps and decisions.
What resources are required if the self-assessment work is formed according to the answers to the questions above?
What total amount of resources is available to be used for the self-assessment work?
Figure 10.3 The figure emphasizes a number of questions, which should be discussed before starting the self-assessment work. The questions are to a large extent based on the experiences from the USS-project, but many of them are mentioned also in other contexts.
10.4 Discussion of the Used Research Methodology
Research is on a scientific base judged by different criteria. Two different measures are validity and reliability, respectively. We will here shortly discuss these measures in relation to the used methodology. See also Section 3.5.
However, before that discussion we want to comment the response rates related to the projects:
• The response rates were high in the AVE-project and in the AEI-project. However, in the AVE-project only the contact persons answered the questionnaires. It can, of course, be questioned whether their opinions are representative for the organizations they represent. In the AEI-project the number of participating organizations was fairly low. On the other hand, the author has tried to give that project less influence on the conclusions.

207
• In the USS-project the response rate unfortunately was fairly low in particular in the third questionnaire due to the circumstances discussed in Section 6.4.1. As a consequence, the analysis was mainly based on thematic studies and not on numerical evaluations. It is also hard to estimate the influence of the fact that the project was interrupted.
10.4.1 Validity
The concept of validity is about assuring to get the tool for the measurement to measure what it is aimed to. According to Yin (1994), there are tree forms of validity, namely: construct, internal, and external. The validity concept and actions taken to increase the validity was briefly discussed also in Section 3.5.1 of this thesis.
The construct validity implies establishing correct operational measures for the studied objects. In order to improve the validity in this thesis, several persons studied the questionnaires before they were used. A test was also done in the AVE-project with people involved in that type of education. The questionnaires are to some extent also built upon experiences from meetings with representatives from the organizations; see Sections 4.5 and 5.5. This might also have increased the validity.
One problem, often mentioned when using attitude questions, however, is that there is always reluctance about the results got from measure of attitudes. However, this is not seen as a problem here, since the aim was in fact to obtain the opinions of the people. As far as results from attitude measurements not are presented as ‘objective data’ we can not see any problem with that.
The attempts to describe the author’s interpretation of concepts related to the phenomena studied, for instance the ’TQM-triad in Section 2.2.5 and self-assessment in Section 2.27, hopefully also increase the validity.
In order to ensure internal validity, the author has asked both supervisors and other colleagues for comments on a regular basis. Another approach is different forms of triangulation, as the use of both questionnaires and discussions with the participants in, primarily the AVE-project and the AEI-project, to collect data about the self-assessment work. In the USS-project questionnaires were complemented with interviews. In all projects the use of different forms of reference groups hopefully also has increased the validity.
The external validity can, according to Merriam (1988), be achieved by comparisons with similar studies. Here one reason for using a number of

208
similar projects occurs. The comparison, described in Chapter 9, was also used in order to compare the results from the projects and also to compare with other published studies and theory.
10.4.2 Reliability
The concept of reliability is about assuring other researchers to get the same results as in this thesis if the study is repeated; see Bell (1993) and the discussion in Section 3.5.2.
The author has had several roles during all the projects. In all projects he has been the scientist, with the duty to analyse the phenomenon and draw conclusion, but also involved as teacher and member of the project group. This form of action research may, as commented in Section 3.2.4, cause problems with reliability. However, awareness of the problem, participation of several people in the projects observing the phenomena as well as careful documentation of events and the process have hopefully reduced this risk.
In the AVE-project the author also had another role, namely as a member of the project group for the ‘overall AVE evaluation’ (see Section 4.1). The circumstance that there was a relation between the commission with evaluation and the evaluation of the self-assessment part might have influenced the respondents to give more positive answers than otherwise, since they might felt being dependent on the group. However, during the training sessions and also in other cases when the research group had contact with the organizations a lot of their representatives did told their opinions, even negative opinions for the research group. This fact together with the results obtained from ‘the evaluation of the overall AVE-evaluation’ in Section 4.7 indicates that a fairly trustful relation was obtained in many cases, which hopefully has reduced that problem.
The processes through which the projects have been performed have been described as thorough as possible in Chapter 4-6 and in other references mentioned there. This should also have increased the reliability.
Finally, since several of the conclusions drawn in this thesis are in agreement with other research results the reliability seems to be quite good.
10.4.3 Generalizations
One can of course discuss whether the conclusions drawn in this thesis are possible to generalize to other parts of the educational sector when the
209
organizations participating in the projects have been from AVE, AEI and USS education, respectively. It is worth mentioning that these organizations in fact cover a fairly broad part of the educational sector; see Figure 7.1. It is also here important to remember that several of the results also are in harmony with other studies from the educational sector as well as other sectors of the society. It is therefore the opinion of the author of this thesis that many of the conclusions are valid also in other areas if the educational sector – and maybe also in other sectors.
10.5 Further Research
There is a number of interesting research issues left as a result of the research work with this thesis.
10.5.1 Research Connected to the ‘TQM-triad’
There seems to be a number of possibilities to go further with research within the three parts of the ‘TQM-triad’, about values, methodologies, and tools.
One question related to the TQM-values is whether those values that were found unclear to some extent, are possible to elucidate.
It would be interesting to perform a less self-assessment procedure within an educational organization of a similar level of maturity as those in the USS-project. Should a simple procedure influence the attitudes in the organization? A less resource demanding procedure can be obtained in several ways. One is to include fewer members of the staff. However, that is, according to the author, a doubtful way to go since ‘everybody’s commitment’ and the anchorage work is important.
Another way is to require less material when answering the questions in the tool used, for instance, by using a grade scale instead of a comprehensive description of how the work is done today. A third alternative is the one described in Section 10.1.3, with just the ‘what’ and ‘why’ questions are used within the approach first. A fourth alternative, not studied at all, as far as the author knows is to do one area at a time, i.e. get the description from one area and then start the improvement work within that area, and then go further to the next area. The main point is that in this way the improvement work starts much earlier. One drawback with a comprehensive process for the descriptions that it takes too long time until the improvement work starts. On

210
the other hand the improvement work starts before the complete picture has been obtained.
The last ideas are in accordance with similar suggestions by van der Wiele et al. (1997), who claim that beginners do not benefit from using too comprehen-sive processes or award criteria booklets.
10.5.2 Research Connected to the Projects
There is a group of interesting issues related to the particular projects included in this thesis. The AVE-organizations were more or less left in 1999 when the AVE pilot project evaluation was finished. What has happened with the self-assessment activities after that? How many organizations continued, first of all, all the phases on the work they had started. In what way did the last phases influence their opinions about self-assessment? What improvements did that work result in? Have some organizations even continued with self-assessment in a second lap. Similar questions are of course relevant for the AEI-organizations as well.
Another issue related to the USS-project is whether it is possible to restart the project; if not at all the four organizations at the one with the most ‘positive’ group of headmasters and in that way create ‘a good example’ as inspiration for the others.
10.5.3 Some Other Ideas
Since educational organizations should be examples of learning organizations an interesting issue is whether self-assessment really supports organizational learning? Related to that issue is how to make self-assessment a sustainable methodology in an organization? Are the assessment matrices with analysis dimensions and different types of ‘points’ as a summary of the organization’s TQM-level a support to continuously set higher goals from procedure to procedure? Does the design of the process and tool have any influence here? One can also ask whether tools like ‘Lärostegen’ is a hindrance for creativity.
An interesting issue, not only connected to educational organizations, is how to support the organization to prioritize the improvement possibilities found in the self-assessment. A good trial was used in the AEI-project to create such a help (see Appendix SPh4) but it was not used that much within the project and above all no experiences were gathered.
How effective is self-assessment when comparing the used resources to the ‘benefit’, measured in some way, after improvements have been performed?

211
References
Alexandersson, M. (1994). Fördjupad reflektion bland lärare – för ökat lärande. In T. Madsén (Red.). Lärares lärande. Studentlitteratur, Lund.
Allwood, C.M. (1999). Distinktion mellan kvalitativ och kvantitativ ansats. In Kvalitativa metoder i arbetslivsforskningen (Lindén, J., Westlander, G. & Karlsson, G.) Rådet för arbetslivsforskning, Stockholm.
Alveson, M. & Sköldberg, K. (1994). Tolkning och reflektion. Vetenskapsfilosofi och kvalitativ metod. Studentlitteratur, Lund. (In Swedish)
Andersen, B. & Fagerhaug, T. (2000). Root cause analysis. ASQ Quality Press, Milwaukee.
Argyris, C. & Schön, D. A. (1996). Organizational learning II. Addison-Wesley, Reading, Massachusetts
Arif, M. & Smiley, F.M. (2004). Baldrige theory into practice: a working model. International Journal of Educational Management, Vol. 18, No. 5, 324-328.
Arnerup, B. & Edvardsson, B. (1992). Marknadsföring av tjänster. Student-litteratur, Lund. (In Swedish)
Arfwedson (1983) Varför är skolor olika? En bok om skolkoder. Liber Utbildningsförlag, Stockholm.
Ashton, D. (2002) The dynamics of workplace learning: the role of work organisations. In K. Evans, P. Hodkinson and L. Unwin (Eds.) Working to learn: Transforming learning in the workplace Kogan Page Limited, London.
Balbastre, F. & Moreno-Luzon, M. (2003). Self-assessment application and learning in organizations: a special reference to the ontological dimension. Total Quality Management, Vol. 14, No. 3, 367-388.
Bass, K., Dellana, S. & Hebert, F. (1996). Assessing the use of quality management in the business school classroom. Journal of Education for Business, July/August.
Bell, J. (1993). Introduktion till forskningsmetodik. Studentlitteratur, Lund. (In Swedish)
Bergman, B. & Klefsjö, B. (1994). Quality From Customer Needs to Customer Satisfaction. McGraw-Hill, London and Studentlitteratur, Lund.
Bergman, B. & Klefsjö, B. (1995). Kvalitet från behov till användning. Studentlitteratur, Lund. (In Swedish)
Bergman, B. & Klefsjö, B. (2001). Kvalitet från behov till användning. Third edition Studentlitteratur, Lund. (In Swedish)
Bergman, B. & Klefsjö, B. (2003). Quality From Customer Needs to CustomerSatisfaction. Second edition. Studentlitteratur, Lund.
Bergman, B., Klefsjö, B., Edgemann, R. & Dahlgaard, J.J. (1999). The development of Total Quality Management in Sweden. Quality Engineering,Vol. 11, No. 3, 463-474.

212
Bergquist, B., Fredriksson, M. & Svensson, M. (2004). TQM –Terrific Quality Marvel or Tragic Quality Malpractice. Accepted for publication in The TQM Magazine.
Bjereld, U., Demker, M. & Hinnfors, J. (1999). Varför vetenskap? Student-litteratur, Lund. (In Swedish)
Ellström, P-E. (2002). Lärande – i spänningsfältet mellan produktionens och utvecklingens logik. (In Utbildning, kompetens och arbete. Red: Abrahamsson, K., Abrahamsson, L., Björkman, T., Ellström, P-E. & Johansson, J.). Studentlitteratur, Lund.
Ensby, M. & Mahmoodi, F. (1997). Using the Baldrige criteria in college classroom. Quality Progress, Vol. 30, No. 4 (April), 85-91.
Eriksson, H. (2002) Benefits from TQM for organisational performance, Licentiate Thesis 2002:46, The Division of Quality and Environment Management, Luleå University of Technology, Luleå.
Eriksson, H. (2003). Experiences of working with in-company quality awards: A case study. The TQM Magazine, Vol. 15, No. 6, 397-404.
Erlingsdóttir, G. (1999). Förförande idéer – kvalitetssäkring i hälso- och sjukvården. Doctoral Thesis. Department of Business Administration, Lund University, Lund. (In Swedish)
Feigenbaum, A.V. (1951). Total Quality Control. MacGraw-Hill, New York. Finn, M. & Porter, L.J. (1994). TQM self-assessment in the UK. The TQM
Magazine, Vol. 6, No.4, 56-61. Foley, K. (2004). Five essays on quality management. To be published. Forman, Elice A., Minick, Norris & C. Addison Stone (1993) Contexts for
learning. Socio-cultural Dynamics in Children´s Development. Oxford University Press, New York.
Franke-Wikberg, S. & Lundgren, U. P. (1979). Att värdera utbildning I. Wahl-ström & Widstrand, Stockholm.
Fredriksson, M. (2004). From customer satisfaction to citizen interaction. Doctoral dissertation, Division of Quality and Environmental Manage-ment, Luleå University of Technology, Luleå.
Fredriksson, M. (2002) TQM as a support for societal development – A tentative model based on experiences from a Swedish community, Licentiate Thesis 2002:42, The Division of Quality and Environment Management, Luleå University of Technology, Luleå.
Fredriksson, M. & Svensson, M. (2000). Delrapport för KL-projektet. Division of Quality Technology & Statistics, Luleå University of Technology. (In Swedish)
Furusten, S. (1999). Popular management books. How they are made and what they mean for organisations. Routledge, London.
Garvin, D. A. (1984). What Does Product Quality Really Mean? SloanManagement Review, fall, 25-43.
Garvin, D. A. (1988). Managing quality. The Free Press, New York.

213
Garvin, D. A. (1993). Building a Learning Organisation. Harvard BusinessReview, Vol. 71, July-August, 78-91.
Giertz, E. (2002). Tjänstesamhällets mångfacetterade arbetsliv. In Utbildning kompetens och arbete (Ed. Abrahamsson, K., Abrahamsson, L., Björkman, T, Ellström, P-E. & Johansson, J.) Studentlitteratur, Lund. (In Swedish)
Goetz, J.P. & LeCompte, M.D. (1984). Ethnography and qualitative design ineducational research. Academic Press, New York.
Grant, D., Mergen, E. & Widrick, S.W. (2004). A comparative analysis of quality management in US and international universities. Total Quality Management & Business Excellence, Vol. 15, No 4, 423-438.
Grønhaug, K. & Olson, O. (1999). Action research and knowledge creation: merits and challenges. Qualitative Market Research, Vol. 2, No. 1, 6-14.
Grønholdt, L. & Martensen, A. (2001). Linking Employee Loyalty, Customer Loyalty and Profitability. Proceedings from The 6th World Congress for Total Quality Management, St Petersburg, 20-22 June 2002, Volume 2, 332-339.
Grönroos, C. (1990). Service Management and Marketing in the Service Sector.Marketing Science Institute, Cambridge, Massachusetts and Chartwell-Bratt and Studentlitteratur, Lund.
Gummesson, E. (1987). Marketing – a Long Term Interactive Relationship. Research Report. Marketing Technology Center, Stockholm.
Gummesson, E. (1991). Kvalitetsstyrning i tjänste- och serviceverksamheter. Forskningsrapport. Centrum för tjänsteforskning, Högskolan i Karlstad, Karlstad. (In Swedish)
Gummesson, E., (1985). Forskare och konsult – om aktionsforskning och fallstudier i företagsekonomi. Studentlitteratur, Lund. (In Swedish)’
Hackman, J.R. & Oldham, G. (1976). Motivation through design of work: test and theory. Organizational Behaviour and Human Performance, Vol. 16, 250-279.
Hackman, J.R. & Wageman, R. (1995). Total Quality Management: empirical, conceptual and practical issues. Administrative Science Quarterly, Vol. 40, No. 2, 309-344.
Hagedorn-Rasmussen, P. (2002). Toqua village – en amerikansk kvalitetskommun. In Bejerot, E. & Hasselbladh, H. (1992). Kvalitet utan gränser, Academia Adacta, Lund. (In Swedish)
Hakes, C. (1996). The Corporate Self Assessment Handbook. Third edition. Chapman & Hall, London.
Hamel, J., Dudour, S. & Fortin, D. (1993). Case study methods. SAGE Publications, Newbury Park.
Hansson, J. & Eriksson, H. (2002) The impact of TQM on financial performance. Measuring Business Excellence, Vol. 6, No. 4, 44-54.
Hansson, T. (2000). The Heart of Learning Organizations – Exploring Competence for Change in Schools. Doctoral Thesis. Department of Teacher Education, Centre for Research in Teaching and Learning, Luleå University of Technology, Luleå.

214
Harnesk, R. (2004). Leadership for co-worker commitment. A TQM approach. Licentiate thesis 2004:33. Division of Quality & Environmental Management, Luleå University of Technology, Luleå.
Harnesk, R., Bäckström, I. & Schön, K. (2004). How successful Swedish organizations achieve sustainable health. To be published in International Journal of Management Practice.
Harrington, H. J. (1991). Business Process Improvement. McGraw-Hill, New York.Hellevik, O. (1984). Forskningsmetoder i sociologi och statsvetenskap. Natur &
Kultur, Stockholm. (In Swedish) Helling, J., Ståhlgren, E. & Jonson, M. (1998). Ballongkraften. Lokal samhälls-
utveckling med kvalitet. Offensiva Åseda, Åseda. (In Swedish) Hellsten, U. & Sandvik Wiklund, P. (1999). Self-assessment as a Facilitator for
Learning. Proceedings of the 52nd Annual ASQ Symposium, Anaheim, USA. Hellsten, U. & Klefsjö, B. (2000). TQM as a management system consisting
of values, techniques and tools. The TQM Magazine, Vol. 12, No. 4, 238-244.
Hellsten, U. (1997a) The Springboard - a TQM-based tool for self-assessment. Licentiate Thesis 1997:42, Division of Quality Technology & Statistics, Luleå University of Technology, Luleå.
Hellsten, U. (1997b). The Springboard: A strategy for continuous improvement of small and medium-sized companies. Total QualityManagement, Vol. 8, No. 2 & 3, 183-186.
Hellsten, U. (1997c). The Springboard – A TQM Based Tool For Self-Assessment. Division for Quality Technology & Statistics, Luleå University of Technology, Luleå.
Henerson, M. E., Morris, L. L. & Fitz-Gibbon, C. T. (1991). How to Measure Attitudes. Second edition. SAGE Publications, London.
Herzog, T. (1996). Research methods and data analysis in the social sciences.HarperCollins Publisher, New York.
Hides, M.T., Davies, J. & Jackson, S. (2004). Implementation of EFQM excellence model self-assessment in the UK higher education sector – lessons learned from other sectors. The TQM Magazine, Vol. 16, No. 3, 194-201.
Hillman, G. P. (1994). Making self-assessment successful. The TQM Magazine,Vol. 6, No.2, 29-31.
Holme, I.M. & Solvang, B.K. (1991). Forskningsmetodik – om kvalitativa och kvantitativa metoder. Studentlitteratur, Lund. (In Swedish)
Hood, C. (1995). The New Public Management in the 1980s: Variations on a theme. Accounting, Organizations and Society, Vol. 20, No 2&3, 93-109.
Hård af Segerstad, H., Klasson, A. & Tebelius, U. (1996). Vuxenpedagogik: att iscensätta vuxnas lärande. Studentlitteratur, Lund. (In Swedish)
Höghielm (2003). Personal communication. Ishikawa, K. (1982). Guide to Quality Control. Asian Productivity Press, Tokyo. ISO 8402 (1986). Kvalitet – Terminologi. SIS, Stockholm. (In Swedish)

215
ISO 9000 (2000). Quality management systems – fundamentals and vocabulary. International Organisation for Standardisation, Geneva.
Jackson, J. C. (1995). Beyond the Fads: Systems Thinking for Managers. Systems Research, Vol. 12 No. 1, 25-42.
Jackson, S. (1999). Exploring the possible reasons why the UK government commended EFQM Excellence Model as the framework for delivering governance in the new NHS. International Journal of Health Care QualityAssurance, Vol. 12, No. 6, 244-253.
Jackson, S. (2001). Using the EFQM Excellence Model within health care: a practical guide to success. Kingsham Press, Chichester.
Johansson, J., Björkman, T., Olsson, M. & Lindell, M. (2000). Qualified Voca-tional Education beyond 2000 – a report from a pilot project in Sweden. Vocational Training, Vol. 21, September-December 2000/III, 7-15.
Jonson, M. (2004). Värdesamhället. Hur har det varit? Hur är det? Hur skulle det kunna vara? Books on Demand, Visby (In Swedish)
Juran, J. F. (1951). Quality-control handbook. McGraw-Hill, New York. Juran, J. F. (1989). Juran on Leadership for Quality. McGraw-Hill, New York. Juran, J. F. (1995). Managerial Breakthrough: The Classic Book on Improving
Management Performance. Second edition. McGraw-Hill, New York. Juran, J. & Godfrey, A.B. (1999). Quality Control Handbook. Fifth edition.
McGraw-Hill, New York. Kano, N. (1995). Upsizing the organization by attractive quality. Proceedings the
First World Congress for Total Quality Management, 10-12 April, Sheffield, 60-72.
Kaplan, R.S. & Norton, D.P. (1996), The Balanced Scorecard. Translating strategies into actions. Harvard Business School Press, Massachusetts.
Kennerfalk, L. (1995). Changes in organizational structure related to the implementation of a Total quality management strategy. Licentiate thesis 1995:39. Division of Quality Technology & Statistics, Luleå University of Technology, Luleå.
Kenway, J. (1994). Economising Education: The Post-Fordist Directions. DeakinUniversity, Geelong.
Kivimäki, M., Mäki, E. & Lindström, K. (1997). Does the implementation of TQM change the well-being and work-related attitudes of health care personnel? Journal of Organizational Change Management, Vol. 10, No. 6, 45-470.
Klefsjö, B. (2003). Self-assessment as a support for minor organizations to adopt TQM. Proceedings of the Eighth International Conference on ISO 9000 and TQM, 8-ICIT, Montreal, April 23-25, 8:3.
Klefsjö, B. & Eriksson, H. (2004). What is the value of participating in a quality award process? Proceedings of the Ninth International Conference on ISO 9000 and TQM, 9-ICIT, Bangkok, April 5-7, 7-15.
Klefsjö, B. Eliasson, H., Kennerfalk, L., Lundbäck, A. & Sandström, M. (1999). De sju ledningsverktygen. Studentlitteratur, Lund. (In Swedish)

216
Koch, J.V. (2003). TQM: why is its impact in higher education so small? TheTQM Magazine, Vol. 15, No. 5, 325-333.
Koch, J.V. & Fisher, J.L. (1998). Higher education and total quality management. Total Quality Management, Vol. 9, No. 8, 659-668.
Kohn, A. (1993). Turning Learning into a business: Concerns about Total Quality Management. Educational Leadership, Vol. 51, No.1, 58-61.
Kolb, D.A. (1984). Experiential learning: experience as the source of learning and development. Prentice-Hall, N.J., Englewood Cliffs.
Kolb, D.A. (1984). Experiential learning: experience as the source of learning and development. Prentice-Hall, N.J., Englewood Cliffs.
Kommittén för kvalificerad yrkesutbildning. (1997). Anvisningar för ansökan till försöksverksamhet med kvalificerad yrkesutbildning 1997-09-10, Birger Jarls Torg 5, 103 33 Stockholm. (In Swedish)
Kommittén för kvalificerad yrkesutbildning (1998). Branschvis förteckning beviljade utbildningar i försöksverksamhet med kvalificerad yrkesutbildning. Utskrift 1998-01-29. (In Swedish)
Kondo, Y. & Park Dahlgaard, S. M. (1994). Kvalitetsmotivation. Centrum, Copenhagen.
Kondo, Y. (1991). Human Motivation – A Key Factor for Management, 3A Corporation. (Published in Japanese in 1989)
Kotter, J. P. (1996). Leading Change. Harvard Business School Press, Boston. Kroslid, D. (1999). In Search of Quality Management. Rethinking and
Reinterpreting. Doctoral thesis. Division of Quality Technology & Management, Linköpings University, Linköping.
Lagrosen, S. (1997). Kvalitetsstyrning i skolan?. Research Reports No 1997:2, Department of Business Administration, Stockholm School of Business. (In Swedish)
Lagrosen, S. & Lagrosen, Y. (2003). Management of service quality – differences in values, practices and outcomes. Managing Service Quality, Vol. 13, No. 5, 370-381.
Lave, J. & Wenger, E. (1991). Situated learning. Legitimate peripheral participation.Cambridge University Press, New York.
Lawrence, J.J. & Mccollough, M.A. (2004). Implementing Total Quality Mana-gement by means of student satisfaction guarantees. Total Quality Management & Business Excellence, Vol. 15, No. 2, 235-254.
Lindell, M. (2004). From formulation to realisation: Reform in Swedish continuing vocational training. The case of Advanced Vocational Education. Doctoral thesis. Division of Industrial Work Environment, Luleå University of Technology, Luleå.
Lindell, M. & Svensson, M. (2002) Among Demons and Angels: Attitudes Towards System Evaluation for Quality Improvement in Advanced Vocational Education. Quality in Higher Education, Vol. 8, No. 2, 127-136.
Lindholm, S. (1999), Forska och skriva – En liten vägledning, Academia Adacta, Lund. (In Swedish)

217
Lindström, P., Grubb, H., Ericsson, B. & Odén, L. (1999). Bli bättre med EFQM-modellen, IVF-skrift 99803, Institutet för verkstadsteknisk forsk-ning, Göteborg. (In Swedish)
Lozier, G.G. & Teeter, D.J. (1996). Quality improvement pursuits in American Higher Education. Total Quality Management, Vol. 7, No. 2, 189-201.
Lundin, R. A. & Söderholm, A. (1995). Bland änglar och demoner. Om utvär-derarroller. In Rombach, B. & Sahlin-Andersson, K. (Eds.) Från sannings-sökande till styrmedel. Moderna utvärderingar i offentlig sektor. Nerenius & Santérus förlag, Stockholm. (In Swedish)
Lundquist, R. (1997). Quality in Higher Education – Approaches to its Management and Improvement. Licentiate Thesis 1997:46. Division of Quality Technology & Statistics, Luleå University of Technology, Luleå.
Lundvall, B-Å (1995). National systems of innovation: Towards a theory of innovation and interactive learning. Pinter, London.
Lyons, M. (2001). Third Sector. Allen & Unwin, New South Wales, Australia Marshall, C. & Rossman, G.B. (1999). Designing qualitative research. Sage
Publications, Thousand Oaks, California Marton, F. (2000). The practice of learning. Nordisk Pedagogik, Vol. 20, No.4,
230-236.Maskell, P., Eskelinen, H., Hannibalsson, I., Malmberg, A. & Vatne, E.
(1998). Competitiveness, Localized learning and Regional Development. Specialisation and prosperity in small open economies. Routledge, London.
Mcinerney, P. (2003) Moving into dangerous territory? Educational leadership in devolving education system. International Journal of Leadership in Education, Vol. 6, No.1, 57-72.
McKenna, E. & Beech, N. (2002). Human Resource management – A concise analysis. Pearson Education Limited, Edinburgh.
Melan, E. H. (1992). Process Management. McGraw-Hill, New York. Merriam, S. B. (1988). Case Study Research in Education. A qualitative approach.
Jossey-Bass Publishers, San Francisco. Mertens, S. (1999). Non-profit organizations and social economy: Two ways
of understanding the third sector. Annals of Public and Cooperative Economics, Vol. 70, No. 3, 501-520.
Miles, M.B. & Huberman, A.M. (1984). An expanded sourcebook approach.Jossey-Bass, San Fransisco, California.
Molander, B. (1998). Vetenskapsfilosofi. Second edition. Thales, Stockholm. Muller, D. & Funnell, P. (1992). An exploration of the concept of quality in
vocational education and training. Educational & Training Technology International, Vol. 5, 257-261.
Myndigheten för skolutveckling (2004), The Swedish National Agency for School Improvement, Available: http://www.skolutveckling.se/in_english/

218
National Agency for Education (2000) Det Livslånga och Livsvida Lärandet. Liber, Stockholm. (In Swedish)
Swedish National Encyclopedia “Nationalencyclopeden.” (1996). Bra Böcker, Höganäs. (In Swedish)
Nilsson, I. (1999). Evaluation of the project “The Quality Award in Northern Sweden” 1996-1999. Report available from the Division of Quality & Environmental Management, Luleå University of Technology, Luleå.
NIST (2004). Criteria for Performance Excellence. National Institute for Standards and Technology, Gaithersburg.
Normann, R. (1992). Service Management. Liber, Malmö. (In Swedish) Normann, R. (2001). Reframing Business when the map changes the landscape. John
Wiley & Sons, Chichester. Nutt, P.C. & Bachoff, R.W. (1992). Strategic Management of Public and Third
Organizations. Jossey-Bass Publishers, San Fransisco. Nwabueze, U. (2001). An industry betrayed. The case of Total Quality
Management in manufacturing. The TQM Magazine, Vol. 13, No. 6, 400-408.
Oakland, J. S. (1989). Total quality management. Butterworth- Heinemann, Oxford.
Oakland, J. S. (1993). Total Quality Management: The route to improving performance. Second edition. Butterworth-Heinemann Ltd, Oxford.
Osborne, D. & Gaebler, T. (1992). Reinventing Government. Addison-Wesley Publishing, Reading.
Owlia, M.S. & Aspinwall, E.M. (1996). Quality in higher education – a survey. Total Quality Management, Vol. 7, No. 2, 161-171.
Pall, G. A. (1987). Quality process management. Prentice-Hall, Englewood Cliffs, N.J.
Park Dahlgaard, S.M. (1999). The evolution patterns of quality management: some reflections on quality movement. Total Quality Management, Vol. 10, No. 4&5, 473-480.
Park Dahlgaard, S.M. (1999). The evolution patterns of quality management: some reflections on quality movement. Total Quality Management, Vol. 10, No. 4&5, 473-480.
Park Dahlgaard, S.M. (2002). The human dimension of TQM - learning, training and motivation. Doctoral thesis no 55, Department of Management and Economics, Linköping University, Linköping.
Phillips, E.M. & Pugh, D.S. (2000). How to get a PhD. Third edition. Philadelphia, Open University Press.
Porter, L. & Tanner, S. (1996). Assessing Business Excellence, Butterworth-Heinemann, Oxford.
Pressman, J-L. & Wilavsky, A.B. (1973). Implemenation – how great expectations in Washington are dashed in Oakland. University of California Press Ltd, Berkeley.
219
Price, M.J. & Chen, E.E. (1993). TQM in small high-technology company. California Management Review, Vol. 35, No. 3, 96-117.
Puay, S.H., Tan, K., Xie, M. & Goh, T. (1998). A comparative study of nine national quality awards. The TQM Magazine, Vol. 10, No. 1, 30-39.
Quist, J. (2003). Att översätta TQM. Doctoral thesis 2003:23. Karlstad University. (In Swedish)
Rapoport, R.N. (1970). Three dilemmas in action research. Human Relation,Vol. 23, No. 4, 499-513.
Reavill, L.R.P. (1999) What is the future direction of TQM development? TheTQM Magazine, Vol.11, No. 5, 291-298.
Rentzhog, O. (1998). Processorientering. En grund för morgondagens organisationer. Studentlitteratur, Lund. (In Swedish)
Rombach, B. (1986). Rationalisering eller prat. Doxa AB, Lund. (In Swedish) Rombach, B. (1990). Kvalitet i offentlig sektor: att mäta och förbättra kvaliteten i
landstingets verksamhet. Norstedts, Stockholm. (In Swedish) Rombach, B. (1998). Nöjdhetsmätningar: en kritisk granskning av attitydunder -
sökningar i sjukvården. Förvaltningshögskolans rapporter, Göteborgs universitet, Göteborg. (In Swedish)
Rombach, B. & Olsson, Ö. (1998) Res pyramiderna: om frihetsskapande hierarkier och tillplattningens slaveri. Svenska Förlaget, Stockholm. (In Swedish)
Ruben, B.D., Lehr, J. & De Angelis, J. (2000). The value of the Baldrige framework for self-assessment and improvement in education: the Rutgers excellence in higher education program. Higher Education Forum (on.line). QCI, Centre for Organizational Development and Leadership, Rutgers University, available at www.qci.rutgers.edu.
Samuelsson. P. & Nilsson, L-E. (2002). Self-assessment practices in large organizations. International Journal of Quality & Reliability Management, Vol. 19, No. 1, 10-23.
Sandberg, J. & Targama, MA. (1998). Ledning och förståelse – ett kompetens-perspektiv på organisationer. Studentlitteratur, Lund. (In Swedish)
Saraiva, P.M., Rosa, M.J. & d’Orey. J.L. (2003). Applying an excellence model to schools. Quality Progress, Vol. 36, No 11 (November), 46-51.
Schein, V.H. (1985). Organizational culture and leadership: A dynamic view. Jossey-Bass Publishers, San Fransisco.
Scherp, H-Å. (2002). Lärares lärmiljö, att leda skolan som lärande organisation. Karlstad University Studies 2002:44, Institutionen för pedagogik, Karlstads universitet, Karlstad. Scherp, H-Å. (2004). Quality Work from a Learning Perspective. Available:
http://www.pbs.kall.se/pdf/kvalitetsarbete_utifran_larandeperspektiv.pdf[2004 Mars 3]. (In Swedish)
Schmoker, M. & Wilson, R.,B. (1993). Adapting Total Quality Doesn't Mean "Turning Learning into a Business". Educational Leadership, Vol. 51, No. 1, 62-63.
220
Scrabec, Q. (2000). A quality education is not customer driven. Journal of Education for Business, Vol. 75 No. XXX, 298-300.
Senge, P.M. (1990). The fifth discipline: the art and practice of learning organization.Dubleday Currency, New York.
SFS 1997: 702 (1997) http://www.notisum.se/rnp/sls/lag/19970702.htmSFS 1997:702. (1997), Available:
http://www.notisum.se/rnp/sls/lag/19970702.HTM (In Swedish) SFS 2001: 649 (2001) http://62.95.69.3/SFSDOC/01/010649.PDFShewhart, W. A. (1939). Statistical Method from the viewpoint of quality control.
Graduate School of the Department of Agriculture, Washington, D. C. Shiba, S., Graham, A. & Walden, D. (1993). A new American TQM: Four
practical revolutions in management. Productivity Press, Portland. Shin, D., Kalinowski, J.G. & El-Enein, G.A. (1998). Critical implementation
issues in Total Quality Management. SAM Advanced Management Journal. Vol. 63, No. 1, 10-14.
Sila, I. & Ebrahimpour, M. (2002), An investigation of the Total Quality Management survey based on research between 1998 and 2000. International Journal of Quality and Reliability Management, Vol. 19, No. 7, 902-970.
Simons, H. (1996). The paradox of case study. Cambridge Journal of Education.Vol. 26, No. 2, 225-236.
SIQ (2002). The SIQ Model for Performance Excellence 2002. Swedish Institute for Quality, Gothenburg. (English version)
SIQ. (2004). SIQs modell för kundorienterad verksamhetsutveckling. Swedish Institute for Quality, Gothenburg. (In Swedish)
Skolverket (2003). http://www.skolutveckling.se/vux/dokument/delrapp_k_lyft/rapport12_k-lyftet_2003.pdf Fetched: 2003-08-27.
Skålén, P. (2002). Kvalitetsidén möter praktiken. Doctoral thesis 2002:12. Karlstad University, Karlstad.
SOU (1999). Evaluation of the AVE. Stockholm: Ministry of Education and Science. (Authors: Björkman, T., Fredriksson, M., Garvare, R., Johansson, J., Klefsjö, B., Lindell, M., Lindgren, A., Olsson, M. & Svensson, M. at Luleå University of Technology). SOU Report 1999:119, Stockholm. (In Swedish)
SOU (2000). Individuellt kompetenssparande, IKS – en stimulans för det livslånga lärandet. SOU Report 2000:51, Stockholm. (In Swedish)
Stahr, H. (2001). Developing a culture of quality within the United Kingdom health-care system. International Journal of Health Care Quality Assurance, Vol. 14, No 4, 174-180.
Stoner, J.A.F., Freeman, R.E. & Gilbert, D.R. (1995). Management. Sixth edition. Prentice Hall, New York.
Stringer, E. (1999). Action Research. Second Edition. Sage Publications, Thousand Oaks, California.

221
Sturkenboom, J., van der Wiele, T. & Brown, A. (2001). An action-oriented approach to quality management self-assessment in small and medium sized enterprises. Total Quality Management, Vol. 12, No. 2, 231-246.
Srikanthan, G. & Dalrymple, J. (2004). A synthesis of quality management model for education in universities. International Journal of EducationalManagement, Vol. 18, No. 4, 266-279.
Suminski, L. T. Jr. (1994). Measuring the cost of quality. Quality Digest, March, 26-32.
Svenska kommunförbundet (2003).http://www.svekom.se/skola/kvalitet/kvalutm2003.htm
Svensson, M. & Klefsjö, B. (2000). Experiences from creating a quality culture for continuous improvements in Swedish school sector by using self-assessments. Total Quality Management, Vol. 11, No. 4/5&6, 800-807.
Svensson, M. & Ögren, U. (1996). Utmärkelsen Kvalitet i Norr – Utvärdering av provomgången 1996. Research Report 1996:10. Division of Quality Technology & Statistics, Luleå University of Technology, Luleå. (In Swedish)
Svensson, M. (1998). Läroverket KY-version. Division for Quality Technology & Statistics, Luleå University of Technology, Luleå. (In Swedish)
Svensson, M. (1999). Läroverket 1999. Division for Quality Technology & Statistics, Luleå University of Technology, Luleå. (In Swedish)
Svensson, M. (2002). TQM-based self-assessment in educational organizations, Licentiate thesis, Division of Quality Technology & Statistics, Luleå University of Technology.
Svensson, M. (2003). Lärostegen. Division for Quality & Environmental Management, Luleå University of Technology, Luleå. (In Swedish)
Svensson, M. (2004), Experiences from TQM-based self-assessment at four units within the upper secondary school. Research Report 2004:6, Division of Quality & Environmental Management, Luleå University of Technology.
Svensson, M. & Klefsjö, B. (2004a). Self-Assessment in the educational sector – Experiences from a Swedish upper secondary school project. Submitted for publication.
Svensson, M. & Klefsjö, B. (2004b). Erfarenheter från TQM-baserad självutvärdering vid fyra enheter inom gymnasieskolan. Research Report 2004:6, Division of Quality & Environmental Management, Luleå University of Technology. (In Swedish)
Svensson, M. & Lindell, M. (2004). Total quality management and socio-cultural learning within educational organizations – ideological friends or foes. Submitted for publication.
Swieringa, J. & Wierdsma, A. (1992). Becoming a Learning Organization.Addison-Wesley, Workingham.
Säljö, R. (2000). Lärande i praktiken. Ett sociokulturellt perspektiv. Prisma, Stockholm. (In Swedish)

222
Säljö, R. (2003). Personal communication at a seminar held at Luleå University of Technology, Sweden.
Söderholm, P. (2003). Continuous improvements of complex technical systems. Aspects of stakeholder requirements and systems function. Licentiate thesis, Division of Quality and Environmental Management, Luleå University of Technology, Luleå.
Sörqvist, L. (1998). Poor Quality Costing. Doctoral Thesis. Production Engineering, Department of Materials Processing, Royal Institute of Technology, Stockholm.
Tannenbaum, R. & Schmidt, W.H. (1973). How to choose leadership. Harvard Business Review, Vol. 51, May-June, 162-188.
Taylor, S.J. & Bogdan, R. (1994). Introduction to Qualitative Research Methods: The search for meanings. John Wiley & Sons, New York.
Tenner, A.R. & deToro, I.J. (1992). Total Quality Management: three steps tocontinuous improvement. Addison-Wesley Publishing Company Inc., Reading Massachusetts.
Tarschys, D. (1978). Den offentliga revolutionen. Liber, Falköping. (In Swedish) The Commission for Adult Education and Training. (1999). The Commission
for Adult Education and Training [Online]. Available: <http://utbildning.regeringen.se/klk/commiss.html>, [2000, February 2].
The Swedish National Agency for Education. (2004). The Swedish school system. Available: http://www.skolverket.se/english/system/index.shtml[May 2004]
Tierney, W.G. (1998). Responsive university: restructuring for higher performance. John Hopkins University Press, Baltimore.
Tollgerdt-Andersson, I. (1997). Ledare och ledarskap. Akademikerförbundet SSR och Svensk chefsförening, Stockholm. (In Swedish)
Tulviste, P. (1991). The Cultural-Historical Development of Verbal Thinking. Nova Science Publishers Inc., New York.
van der Wiele, A., Dale, B.G. & Williams, A.R. (1997). ISO 9000 registration to Total Quality Mangament. The transformation journey. International Journal of Quality Science, Vol. 2, No. 4, 236-252.
van der Wiele, A. (1998). Beyond fads: management fads and organisational change with reference to quality management. Eburon Publishers, Delft.
van der Wiele, A., Williams, A.R.T. & Dale, B.G. (2000). Total Quality Management . Is it a fad, fashion or fit? Quality Management Journal, Vol. 7, No. 2, 65-79.
van der Wiele, A., Williams, A.R.T., Dale, B.G., Carter, G., Kolb, F., Luzon, D.M., Schmidt, A. & Wallace, M. (1996). Self-assessment. A study of progress in Europe’s leading organizations in quality management practices. International Journal of Quality and Reliability Management, Vol. 13, No. 1, 84-104.
Wallace, K.J. (1999). The case for student as customer. Quality Progress, Vol. 32, No. 2 (February), 47-51.
223
Wallén, G. (1996). Vetenskapsteori och forskningsmetodik. Studentlitteratur, Lund. (In Swedish)
Wertsch, J. V. (1991) Voices of the Mind – A socio-cultural Approach to Mediated Action. Harvard University Press, Massachusetts.
Wertsch, J. V. (1998) Mind as action. Oxford University Press, Oxford. Wertsch, J. V. (2002) Voices of collective remembering. Cambridge University
Press, Cambridge. Westlund, A. & Löthgren, M. (2001). The Interactions Between Quality,
Productivity and Economic Performance: The Case of Swedish Pharmacies. Total Quality Management, Vol. 12, No. 3, 385-396.
Wiedersheim-Paul, F. & Eriksson, L. T. (1992). Att utreda och rapporter. Thirdedition. Liber, Malmö.
Wilkes, N. & Dale, B.G. (1998). Attitudes to self-assessment and quality awards: A study in small and medium-sized companies. Total Quality Management, Vol. 9, No. 8, 731-739.
Wilkinson, XX & Willmott, XX (1995) Making quality critical: New perspectives on organizational change. Critical Perspectives on Work and Organization Series. Routledge, New York, 1-32.
Vygotsky, L.S. (1999). Tänkande och språk. Daidalos, Göteborg. (In Swedish) Yin, R. K. (1994). Case Study Research, Design and Methods. SAGE Publications
Inc., Thousand Oaks, California. Zbaracki, M. (1998). The rhetoric and reality of Total Quality Management.
Administrative Science Quarterly, Vol. 43, No. 3, 602-636. Zikmund, W.G. (2000). Business research methods. Sixth edition. Dryden Press,
Fort Worth, Texas. Zink, K. J. (1997). Successful TQM: inside stories from European quality award
winners. Gower Publishing Limited, Hampshire.

224

Appendices
Notation Description
QAVE1 Questionnaire no. 1 within the AVE-project
QAVE2 Questionnaire no. 2 within the AVE-project
QAEIa Questionnaire (a) within the AEI-project
QAEIb Questionnaire (b) within the AEI-project
SPh4 Structure proposed for phase 4: ’plan for improvements’
MSLS Base structure behind the tool ’Lärostegen’
LS The tool ’Lärostegen’
QUSS1 Questionnaire no. 1 within the USS-project
QUSS2 Questionnaire no. 2 within the USS-project
IUSS Interview guide within the USS-project
QUSS3 Questionnaire no. 3 within the USS-project


Frågeformulär om självutvärdering med Läroverket
Detta frågeformulär sänds till alla de organisationer som använder Läroverket för självutvär-dering. Syftet är att samla in data kring arbetet med Läroverket. Detta görs dels för använd-ning inom Utvärderingsgruppen av KYs arbete, dels för forskning kring den typ av verktyg som Läroverket utgör och användning av sådana verktyg. Formuläret består av tre delar. På denna sida finns några inledande frågor. De därpå följande två sidorna utgörs av sex stycken attitydfrågor, varefter en mer traditionell enkät följer.
Del 1 – Inledande frågor
1.1 Vilken är Din befattning? …………………………………………………………
1.2 Är Du för närvarande organisationens kontaktperson med KY-kansliet?
Ja Nej Vet ej
1.3 Om ”ja” på fråga 1.2, hur länge har Du varit organisationens kontaktperson med KY-kansliet?
Tidsperiod: ……………..
1.4 Hur många personer är involverade i den KY-utbildning Du är engagerad i? (Här avses dels exempelvis alla inblandade lärare, administratörer och rektor och dels led- ningsgruppen, dock ej handledare m.fl. vid organisationer där lärande i arbetet bedrivs!)
Din organisations egna medarbetare Externa medarbetare, Ledningsgruppen
Heltid inom KY Deltid inom KY t ex inhyrda konsulter
Antal personer:
Del 2 - Attityddel
Ta personligen ställning till de kursiverade termer och företeelser, exempelvis ”Förbättrings-arbete”, som återfinns på de två följande sidorna. Gör detta genom att bedöma respektive term med hjälp av de adjektivpar som följer efter var och en av termerna (företeelserna). Markera med ett kryss i varje rad i någon av rutorna beroende på hur väl respektive adjektiv
överensstämmer med Din bild av respektive term. Svara snabbt och med det första intryck Du får. Observera att de positiva och negativa adjektiven är slumpvis fördelade till vänster eller till höger om rutorna. Om Du ej kan ställning till någon av de 6 termerna, kryssa i ”vet ej”.
Organisation:
Exempel Besvara enkäter
Dåligt Bra
Intressant Ointressant
AppendixQAVE1

Enkätdel
2.1 Generellt om förbättringsarbete Vet ej
Dåligt Bra
Intressant Ointressant
Otydligt Klart
Värdefullt Värdelöst
Irrelevant Relevant
Oanvändbart Användbart
Grundligt Ytligt
Effektivt Ineffektivt
2.2 Generellt om självutvärdering*) Vet ej (m h a Läroverket i nästa fråga)
Dåligt Bra
Intressant Ointressant
Förvirrande Klar
Värdefullt Värdelöst
Irrelevant Relevant
Oanvändbart Användbart
Grundligt Ytligt
Effektivt Ineffektivt
*) att organisationen själv utvärderar den egna verksamheten
2.3 Självutvärdering med hjälp av Läroverket Vet ej
Dåligt Bra
Intressant Ointressant
Förvirrande Klar
Värdefull Värdelös
Irrelevant Relevant
Oanvändbar Användbar
Grundlig Ytlig
Effektivt Ineffektivt

Enkätdel
2.4 Att de fyra områdena**) i Läroverket används som Vet ej grund för beskrivning av utbildningsverksamhet
(detta handlar ej om de enskilda frågorna i områdena)
Dåliga Bra
Intressanta Ointressanta
Förvirrande Klara
Värdefulla Värdelösa
Irrelevanta Relevanta
Oanvändbara Användbara
Grundliga Ytliga
Effektiva Ineffektiva
**) ”Kundsamverkan”, ”Ledarskap”, ”Medarbetarnas utveck- ling och delaktighet” samt ”Verksamhetens processer”
2.5 De enskilda frågorna i de fyra områdena**) i Läroverket Vet ej
Dåliga Bra
Intressanta Ointressanta
Förvirrande Klara
Värdefulla Värdelösa
Irrelevanta Relevanta
Oanvändbara Användbara
Grundliga Ytliga
Effektiva Ineffektiva
**) ”Kundsamverkan”, ”Ledarskap”, ”Medarbetarnas utveck- ling och delaktighet” samt ”Verksamhetens processer”
2.6 Termen kund inom utbildningsverksamhet Vet ej
Dåligt Bra
Intressant Ointressant
Förvirrande Klart
Värdefullt Värdelöst
Irrelevant Relevant
Oanvändbart Användbart
Grundligt Ytligt
Effektivt Ineffektivt
Om Du har ytterligare synpunkter kring dessa termer och begrepp, kommentera gärna på baksidan!

Enkätdel
Del 3 - enkätdel
Sätt kryss eller skriv svar på de prickade raderna, använd gärna baksidan vid behov!
3.1 Hur tänkte Din organisation genomföra egenutvärderingen innan Läroverket valdes? (Flera alternativ kan markeras!)
Kursenkäter Intervjuer med studenter Gruppdiskussioner med studenter
Enkäter med medarbetare Intervjuer med medarbetare
Enkäter/samtal med ”lärande i arbete”-organisationer Vet ej
Annat:
………………………...….…………………………………………….…………….
3.2 Anser Du att Din organisation blivit informerad om Läroverket tillräckligt tidigt för att kun-na avsätta tillräckliga resurser för egenutvärdering med Läroverket?
Ja Nej Vet ej
Kommentar: ……………………………………..……………………..….….…………………………
3.3 Var Du personligen med och fattade beslutet att använda Läroverket?
Ja Nej
Kommentar: ……………………………………..………………………..…..…………………………
3.4 Varför valde Din organisation att använda Läroverket? (Flera alternativ kan markeras!)
Vi visste inte hur vi skulle genomföra egenutvärderingen
Vi ville gärna göra en mer omfattande egenutvärderingen men hade inte hittat något verktyg
Användning av Läroverket föreföll vara ett outtalat krav från KY-kommittén
Vi bedömde läroverket vara intressant för egenutvärderingen
Annat: …………………………………………………………………………………………..
Vet ej
3.5 Anser Du att Din organisation börjat använda Läroverket vid en för organisationen lämplig tidpunkt?
Ja Nej, för tidigt Nej, för sent Vet ej
Kommentar: ……………………………………..…………………….….…………………………
3.6 Vilka kunskaper hade Du om offensiv kvalitetsutveckling (TQM) före kontakten med Läro-verket? (Flera alternativ kan markeras!)
Inga Kunskaper från självstudier kring begreppet
Hört talas om begreppet Kunskaper från kurs kring begreppet
Annat, nämligen: ……………………………...………………………………………………...

Enkätdel
3.7 Hur mycket kände Du till om verktyg för självutvärdering, liknande Läroverket, innan Du kom i kontakt med det? (Markera med kryss, flera alternativ kan väljas i varje kolumn)
Utmärkelsen Svensk Kvalitet
Utmärkelsen Svensk Skola
Språngbrädan Andra verktyg
……………… ……….……..Inget Hört talas om Studerat själv Deltagit i kurs om
3.8 Har Du själv deltagit i utbildning I beträffande Läroverket (två dagar under våren 1998)?
Ja Nej
3.9 Var det någon personalkategori i Din organisation som inte deltog i utbildning I (två dagar våren 1998), men som Du anser borde ha gjort det med hänsyn till arbetet med Läroverket?
Ja, även följande personer borde ha deltagit (ange befattning):
……………………………………….…………………………………………………………..
………………………………………….………………………………………………………..
Nej
Vet ej
3.10 Anser Du att utbildning I beträffande Läroverket (två dagar våren 1998) givit Dig tillräck-liga kunskaper inför arbetet med att beskriva Din organisation med hjälp av Läroverket?
Ja Nej Vet ej
Kommentar: ……………………………………..…………………….….…………………………
3.11 Hur många personer i Din organisation har informerats om Läroverket, såväl avseende verk-tygets uppbyggnad som hur arbetet med det skall genomföras, av Dig eller av någon annan i Din organisation? (skriv ”0” om inte någon i respektive grupp nedan informerats)
Din organisations egna medarb. Externa medarbetare, Lednings- Andra:
Heltid i KY Deltid i KY t ex inhyrda konsulter gruppen ………….…….. Antal pers:
3.12 Hur många personer har aktivt deltagit i arbetet med den översiktliga beskrivningen?(skriv ”0” om inte någon i respektive grupp nedan informerats)
Din organisations egna medarb. Externa medarbetare, Lednings- Andra:
Heltid i KY Deltid i KY t ex inhyrda konsulter gruppen ………….…….. Antal pers:
Om ingen i Din organisation deltagit i utbildning kring Läroverket, gå vidare till fråga 3.11

Enkätdel
3.13 Hur många timmar har uppskattningsvis använts totalt i Din organisation för att sammanställa den översiktliga beskrivningen?
Antal timmar: ……….
3.14 Vilken eller vilka är anledningarna till att Din organisation inte sänt den detaljerade beskriv-ningen till Utvärderingsgruppen av KY?
Arbetet med detaljerade beskrivningen har ej påbörjats
Arbetet med detaljerade beskrivningen har ej avslutats
Annat: …………………..………………………………………………….…………………..
Vilken är bakgrunden till det i fråga yy beskrivna förhållandet?
…………………………………………………………………………………………………………..
3.15 Hur många personer har aktivt deltagit i arbetet med den detaljerade beskrivningen?
Din organisations egna medarb. Externa medarbetare, Lednings- Andra:
Heltid i KY Deltid i KY t ex inhyrda konsulter gruppen …………………..
Antal pers:
3.16 Hur många timmar har uppskattningsvis använts totalt i Din organisation för arbetet med den detaljerade beskrivningen?
Antal timmar: ……….
3.17 Om arbetet med den detaljerade beskrivningen inte slutförts, kommer Din organisation att göra detta och när beräknas i så fall detta arbete vara färdigt?
Ja, den detaljerade beskrivningen beräknas vara färdig: ……………………..….
Ja, vi kommer att färdigställa den, men vi kan ej säga något om tidpunkt för detta
Nej, vi kommer inte att färdigställa den detaljerade beskrivningen
Vet ej
3.18 Om Du svarat nej på fråga 3.17 hur genomför då Din organisation egenutvärderingen?
…………………………………………………………………………………………………………..
…………………………………………………………………………………………………………..
…………………………………………………………………………………………………………..
…………………………………………………………………………………………………………..
…………………………………………………………………………………………………………..
…………………………………………………………………………………………………………..

Enkätdel
3.18 Samlar Din organisation in data om krav och behov avseende utbildningen, och i så fall hur, bland följande grupper? (Markera med kryss, flera alternativ kan väljas i varje kolumn)
Studenter Medarbetare Lärande i arb.-organisationer
KY-kommittén Andra grupper / organisationer
Enkäter
Intervjer
Gruppdiskussioner
Annat: ………….….
Annat: ………….….
3.19 Om arbetet med Läroverket påbörjats, bedöm då värdet av detta genom att väga de resurser som använts mot det utfall arbetet hittills givit genom att kryssa i den ruta nedan som Du finner mest lämplig.
Mycket nyttigt Mycket onyttigt
Kommentar: ……………………………………..…………………….….………..……………………
3.20 Har Din organisation påbörjat utvärderingen (analysen) av den detaljerade beskrivningen?
Ja Nej Vet ej
3.21 Har Din organisation avslutat utvärderingen (analysen) av den detaljerade beskrivningen?
Ja Nej Vet ej
3.19 Har arbetet med att beskriva er organisation genom att besvara frågorna i Läroverket inneburit att ni identifierat möjligheter till förbättringar?
Ja Nej Vet ej
Kommentar: ……………………………………..…………………….….………………..……………
3.20 Om Du har några ytterligare synpunkter Du vill framföra, gör det gärna här:
………………………………………………………………………………………………………….
……………………………………………………………………………………………………….….
…………………………………………………………………………………………………………..
Tack för Din medverkan! Sänd enkäten i bifogat svarskuvert senast 1999-04-23
till Magnus Svensson Avd. för kvalitetsteknik & statistik
Luleå tekniska universitet 971 87 LULEÅ
Om arbetet med den detaljerade beskrivningen ej avslutats, gå vidare till fråga 3.20


Luleå tekniska universitet Lindell/Svensson
Hur Du betraktade arbetet med att utvärderingen av KY
Nedan lämnas fyra påståenden om hur utvärderingsgruppens arbete med att utvärdera försöks-verksamheten av KY kan ha, totalt sett, uppfattats under den tid utvärderingen pågick. Vi ber Dig besvara hur påståendena stämmer överens med Din bild genom att ringa in något av de fem svarsalternativ som ges på skalan under varje påstående.
Svaren på frågorna skall inte skickas till Luleå, utan en person anställd vid Luleå tekniska universitet kommer att kontakta Dig per telefon för en kort intervju kring dina svar.
Påstående 1. Jag kände i huvudsak ett misstroende för utvärderingsgruppen och deras arbete med att utvärdera KY.
Instämmer helt Instämmer delvis Varken/eller Instämmer delvis inte Instämmer inte alls
Påstående 2. Jag tyckte i huvudsak att utvärderingsgruppens arbete med att utvärdera KY innebar stöd till en förnyelse av vår utbildningsverksamhet.
Instämmer helt Instämmer delvis Varken/eller Instämmer delvis inte Instämmer inte alls
Påstående 3. Jag kände i huvudsak ett förtroende för utvärderingsgruppen och deras arbete med att utvärdera KY.
Instämmer helt Instämmer delvis Varken/eller Instämmer delvis inte Instämmer inte alls
Påstående 4. Jag tyckte i huvudsak att utvärderingsgruppens arbete med att utvärdera KY innebar kontroll av vår utbildningsverksamhet.
Instämmer helt Instämmer delvis Varken/eller Instämmer delvis inte Instämmer inte alls
Appendix QAVE2


Avdelningen för kvalitetsteknik & statistik Luleå tekniska universitet
Frågeformulär (2a) om självutvärdering med Läroverket
Detta frågeformulär sänds till alla de organisationer som använder Läroverket för självutvärdering inom ”KL-projektet”. Syftet är att samla in data kring arbetet med Läroverket. Detta görs för den uppföljning som utgör en del av projektet. Formuläret består av tre delar. På denna sida finns en inledande fråga. Därpå följer två sidor med sex stycken attitydfrågor samt därefter några mer tradi-tionella enkätfrågor.
Del 1 – Inledande fråga
1.1 Arbetar Du fortfarande med självutvärderingsprojektet?
Ja Nej Vet ej
Om Du svarat ”nej” eller ”vet ej” behöver Du inte besvara övriga frågor i frågeformuläret. Vi önskar ändå att Du skickar oss enkäten i bifogat kuvert. Tack för Din medverkan.
Del 2 - Attityddel
Ta personligen ställning till de kursiverade termer och företeelser, exempelvis ”förbättringsar-bete”, som återfinns på de två följande sidorna. Gör detta genom att bedöma respektive term med hjälp av de adjektivpar som följer efter var och en av termerna (företeelserna). Markera med ett kryss i varje rad i någon av rutorna beroende på hur väl respektive adjektiv överens-
stämmer med Din bild av respektive term. Svara snabbt och med det första intryck Du får. Observera att de positiva och negativa adjektiven är slumpvis fördelade till vänster eller till höger om rutorna. Om Du ej kan ställning till någon av de 6 termerna, kryssa i ”vet ej”
Organisation:
Exempel Besvara enkäter
Dåligt Bra
Intressa Ointressant
AppendixQAEIa

Enkätdel
Avdelningen för kvalitetsteknik & statistik Luleå tekniska universitet
2.1 a) Vilken är din definition av ”förbättringsarbete”? ………………………………..……….….
…………………………………………………………………………………...………………
2.1 b) Ta ställning till: Generellt om förbättringsarbete Vet ej
Dåligt Bra
Intressant Ointressant
Förvirrande Klart
Värdefullt Värdelöst
Irrelevant Relevant
Oanvändbart Användbart
Grundligt Ytligt
Effektivt Ineffektivt
2.2 a) Vilken är din definition av ”utvärdering”? ………………………………..……………….….
…………………………………………………………………………….………………………
2.2 b) Ta ställning till: Utvärdering av Din egen organisations verksamhet Vet ej
Dåligt Bra
Intressant Ointressant
Förvirrande Klar
Värdefullt Värdelöst
Irrelevant Relevant
Oanvändbart Användbart
Grundligt Ytligt
Effektivt Ineffektivt
2.3 Ta ställning till: Utvärdering med hjälp av Läroverket Vet ej
Dåligt Bra
Intressant Ointressant
Förvirrande Klar
Värdefull Värdelös
Irrelevant Relevant
Oanvändbar Användbar
Grundlig Ytlig
Effektivt Ineffektivt
Om Du har ytterligare synpunkter på dessa termer och begrepp, kommentera gärna på baksidan!

Enkätdel
Avdelningen för kvalitetsteknik & statistik Luleå tekniska universitet
2.4 Ta ställning till: Att de fyra områdena**) i Läroverket används som Vet ej
grund för beskrivning av utbildningsverksamhet (detta handlar ej om de enskilda frågorna i områdena)
Dåliga Bra
Intressanta Ointressanta
Förvirrande Klara
Värdefulla Värdelösa
Irrelevanta Relevanta
Oanvändbara Användbara
Grundliga Ytliga
Effektiva Ineffektiva
**) ”Kundsamverkan”, ”Ledarskap”, ”Medarbetarnas utveck- ling och delaktighet” & ”Verksamhetens processer”
2.5 Ta ställning till: De enskilda frågorna i de fyra områdena i Läroverket Vet ej
Dåliga Bra
Intressanta Ointressanta
Förvirrande Klara
Värdefulla Värdelösa
Irrelevanta Relevanta
Oanvändbara Användbara
Grundliga Ytliga
Effektiva Ineffektiva
2.6 a) Vilken är Din definition av ”kund”?: ………………………………..……………….….
………………………………….………………………………………….………………
2.6 b) Ta ställning till: Termen kund inom utbildningsverksamhet Vet ej
Dåligt Bra
Intressant Ointressant
Förvirrande Klart
Värdefullt Värdelöst
Irrelevant Relevant
Oanvändbart Användbart
Grundligt Ytligt
Effektivt Ineffektivt
Om Du har ytterligare synpunkter på dessa termer och begrepp, kommentera gärna på baksidan!

Enkätdel
Avdelningen för kvalitetsteknik & statistik Luleå tekniska universitet
Del 3 - enkätdel
Sätt kryss eller skriv svar på de prickade raderna. Använd gärna baksidan vid behov!
3.1 a) Anser Du att informationen om projektet och projektuppläggningen kommit till Din organisation tidsmässigt lämpligt eller olämpligt?
För tidigt Lämpligt För sent Vet ej
b) Motivera Ditt svar: ………………………..…………………….….………………..……………
3.2 Vilket eller vilka syften har Din organisation med att deltaga i det nu pågående projektet med självutvärdering?
…………………………………………………………………………….……………………………
…………………………………………………………………………………………………..………
………………………………………………………………………………………………………..…
3.3 Anser Du att Din organisation börjat arbeta med självutvärdering vid en för organisationen lämplig tidpunkt eller ej? (Markera med ett kryss!)
Vet ej
För tidigt Lämpligt För sent
Kommentar: ……………………………………..…………………….….…………………………
3.4 Vilka förväntningar har Du nu på utvärderingsprojektet?
…………………………………………………………………………….……………………………
…………………………………………………………………………………………………..………
………………………………………………………………………………………………………..…
3.5 Har arbetet med att beskriva er organisation genom att besvara frågorna i Läroverket inneburit att ni identifierat möjligheter till förbättringar?
Ja Nej Vet ej
Kommentar: ……………………………………..…………………….….………………..……………
3.6 Om Du har några ytterligare synpunkter Du vill framföra, gör det gärna här:
………………………………………………………………………………………………………….
……………………………………………………………………………………………………….….
…………………………………………………………………………………………………………..
Tack för Din medverkan! Sänd enkäten i bifogat svarskuvert snarast
till Magnus Svensson Avd. för kvalitetsteknik & statistik
Luleå tekniska universitet, 971 87 LULEÅ

Avdelningen för kvalitetsteknik & statistik vid Luleåtekniska universitet
Frågeformulär (2b) kring självutvärdering med Läroverket
Detta frågeformulär sänds till alla de organisationer som använder Läroverket för självutvärde-ring inom ”KL-projektet”. Syftet är att samla in data kring arbetet med Läroverket. Detta görs för den uppföljning som utgör en del av projektet.
Sätt kryss eller skriv svar på de prickade raderna och använd gärna baksidan vid behov!
Inledande frågor
1.1 Vid vilka av följande samlingar i Stockholm har Du deltagit? (Markera med kryss)
Informationsmöte
(2/9 – 1999)
Utbildning 1
(30/9 – 1999)
Uppsamling 1
(28/10 – 1999)
Utbildning 2
(24-25/11 – 1999)
1.2 Deltar Du fortfarande i arbetet med självutvärderingsprojektet?
Ja Nej Vet ej
Om Du svarat ”nej” eller ”vet ej” behöver Du inte besvara övriga frågor i frågeformuläret. Vi önskar ändå att Du skickar oss enkäten i bifogat svarskuvert. Tack för Din medverkan!
1.3 Hur långt har Din organisation kommit i arbetet med självutvärdering med hjälp av Läroverket? (Markera med kryss)
Arbetet har ej påbörjats
Översiktligbeskrivning
är färdig
Detaljerad beskrivningär påbörjad
Ungefärhälften av detaljerad
beskrivningär färdig
Detaljerad beskrivning
är nästan färdig
Detaljerad beskrivning
är helt färdig
Analys av detaljerad
beskrivningär påbörjat
ο Vet ej
Enkätkod:
Enkät kontaktperson
AppendixQAEIb

Frågeformulär 2b(kp)
Avdelningen för kvalitetsteknik & statistik vid Luleåtekniska universitet
Frågor kring information
2.1
Vilken är Din uppfattning om information som lämnats från någon av projektets arrangörer avseende:
- Tydlighet: Lämplig Olämplig Vet ej
- Omfattning: För stor Lämplig För liten Vet ej
- Tidpunkt: För tidig Lämplig För sen Vet ej
2.2 Har Du informerat någon i Din organisation, som inte deltagit vid någon av projektets samlingar i Stockholm, kring projektet?
Ja Nej
Kommentar: ……………………………………..…………………….….…………………………
2.3
Vilka och hur många personer har Du informerat om projektet i Din organisation?
Lärare Rektor Studierektor Andra: ………….….………………….….Antal pers:
2.4 Vad har Du informerat om i Din organisation kring projektet?
Att det handlar om att personer i organisationen utvärderar den egna verksamheten
Att verktyget Läroverket används och i korthet hur man arbetar med det
Att Läroverket bygger på teori inom kvalitetsteknik
Att det bland annat handlar om att besvara frågor kring organisationens kunder
Vilka som arrangerar projektet
Vilka som deltar från Din organisation vid samlingar i Stockholm
Vilket syfte Din organisation har med medverkan i projektet
Annat: ……………………………………………………………………….………………..
2.5 Hur har Du informerat i Din organisation kring projektet?
Via informella möten Via formella möten Skriftligt
2.6 När under 1999 spred Du informationen i Din organisation kring projektet?
…………………………………………………………………………………………………………..
Om Du svarat ”Nej” på fråga 2.2, gå vidare till fråga 3.1!

Frågeformulär 2b(kp)
Avdelningen för kvalitetsteknik & statistik vid Luleåtekniska universitet
2.7 Hur upplever Du att medarbetarna reagerat på Din information kring projektet?
Markera med ett kryss i varje rad i någon av rutorna mellan motsatsparen utifrån hur Du upplever att medarbetarna reagerat på informationen.
Negativt Positivt
Med intresse Med ointresse
Som ett hot mot verksamheten Som en möjlighet för verksamheten
Engagerat Oengagerat
Med förståelse Med oförståelse
Med misstroende Med förtroende
Som en möjlighet för dem själva Som ett hot mot dem själva
2.8 Har de som Du informerat reagerat över något speciellt och i så fall vad?
…………………………………………………………………………………………………………..
……………………………………………………………….…………………………………………..
Frågor kring utbildning
3.1 Anser Du att utbildning 1 (30 september - 1999) givit Dig tillräckliga kunskaper inför arbetet med att beskriva Din organisation med hjälp av Läroverket?
Ja Nej, något bristande Nej, helt otillräckliga Vet ej
b) Om Du saknade något, vad: …………………………..…...…………….….…………………………
c) Om Du tyckte något var överflödigt, vad: …………………………..…….….…………………………
3.2 Anser Du att uppsamling 1 (28 oktober - 1999) givit Dig tillräckliga kunskaper under arbetet med att beskriva Din organisation med hjälp av Läroverket?
Ja Nej, något bristande Nej, helt otillräckliga Vet ej
b) Om Du saknade något, vad: …………………………..…...…………….….…………………………
c) Om Du tyckte något var överflödigt, vad: …………………………..…….….…………………………
3.3 Anser Du att utbildning 2 (24-25 november - 1999) givit Dig tillräckliga kunskaper inför arbetet med att analysera beskrivningen av Din organisation?
Ja Nej, något bristande Nej, helt otillräckliga Vet ej
b) Om Du saknade något, vad: …………………………..…...…………….….…………………………
c) Om Du tyckte något var överflödigt, vad: …………………………..…….….…………………………

Frågeformulär 2b(kp)
Avdelningen för kvalitetsteknik & statistik vid Luleåtekniska universitet
3.4 Om Ni inte färdigställt beskrivningen av Er organisation vid tiden för utbildning 2, anser Du att denna utbildning, kring analys, underlättat det fortsatta arbetet med beskrivningen?
Ja Nej Vet ej
Motivering: ……………………………………………………………………………………………..
……………………………………………………………….…………………………………………..
3.5 Var det någon personalkategori i Din organisation som inte deltagit vid samlingarna i Stockholm under hösten, men som Du anser borde ha gjort det med hänsyn till arbetet med Läroverket?
Ja, även (ange befattning):…………………………………………………………..…………..
…………………………………………………………………………………….……………..
Nej
Vet ej
3.6 Tycker Du att det antal personer från Din organisation som deltagit vid samlingarna i Stockholm varit lämpligt, eller borde fler eller färre deltagit? (Markera med kryss)
Utbildning 1 Uppsamling 1 Utbildning 2 ο Vet ej
Fler borde ha deltagit: Lämpligt antal:
Färre borde ha deltagit:
3.7 Vad anser Du om antalet samlingar i Stockholm?
För många Lämpligt antal För få Vet ej
3.8 Har Du fört kunskaper om självutvärdering och Läroverket vidare till någon eller några andra i Din organisation?
Ja, till någon/några som deltagit vid samlingar i Stockholm men missat något till fälle
Ja, till någon/några som ej deltagit vid samling i Stockholm
Nej
3.9 Om Du svarat ”Ja” på fråga 3.8, vilka och hur många har Du fört kunskaper vidare till i Din organisation?
Lärare Rektor Studierektor Andra: ………….….………………….….Antal pers:
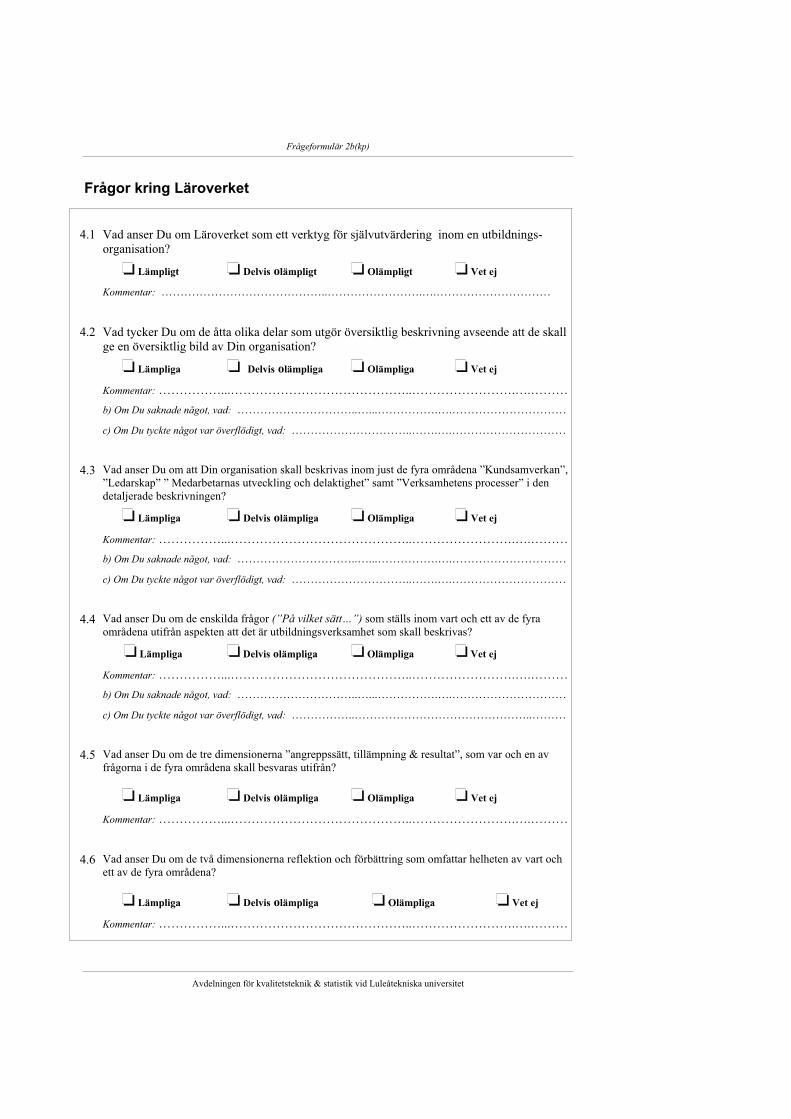
Frågeformulär 2b(kp)
Avdelningen för kvalitetsteknik & statistik vid Luleåtekniska universitet
Frågor kring Läroverket
4.1 Vad anser Du om Läroverket som ett verktyg för självutvärdering inom en utbildnings-organisation?
Lämpligt Delvis olämpligt Olämpligt Vet ej
Kommentar: ……………………………………..…………………….….…………………………
4.2 Vad tycker Du om de åtta olika delar som utgör översiktlig beskrivning avseende att de skall ge en översiktlig bild av Din organisation?
Lämpliga Delvis olämpliga Olämpliga Vet ej
Kommentar: ……………...……………………………………..…………………….….………
b) Om Du saknade något, vad: …………………………..…...…………….….…………………………
c) Om Du tyckte något var överflödigt, vad: …………………………..…….….…………………………
4.3 Vad anser Du om att Din organisation skall beskrivas inom just de fyra områdena ”Kundsamverkan”, ”Ledarskap” ” Medarbetarnas utveckling och delaktighet” samt ”Verksamhetens processer” i den detaljerade beskrivningen?
Lämpliga Delvis olämpliga Olämpliga Vet ej
Kommentar: ……………...……………………………………..…………………….….………
b) Om Du saknade något, vad: …………………………..…...…………….….…………………………
c) Om Du tyckte något var överflödigt, vad: …………………………..…….….…………………………
4.4 Vad anser Du om de enskilda frågor (”På vilket sätt…”) som ställs inom vart och ett av de fyra områdena utifrån aspekten att det är utbildningsverksamhet som skall beskrivas?
Lämpliga Delvis olämpliga Olämpliga Vet ej
Kommentar: ……………...……………………………………..…………………….….………
b) Om Du saknade något, vad: …………………………..…...…………….….…………………………
c) Om Du tyckte något var överflödigt, vad: ……………..………………………………………..………
4.5 Vad anser Du om de tre dimensionerna ”angreppssätt, tillämpning & resultat”, som var och en av frågorna i de fyra områdena skall besvaras utifrån?
Lämpliga Delvis olämpliga Olämpliga Vet ej
Kommentar: ……………...……………………………………..…………………….….………
4.6 Vad anser Du om de två dimensionerna reflektion och förbättring som omfattar helheten av vart och ett av de fyra områdena?
Lämpliga Delvis olämpliga Olämpliga Vet ej
Kommentar: ……………...……………………………………..…………………….….………

Frågeformulär 2b(kp)
Avdelningen för kvalitetsteknik & statistik vid Luleåtekniska universitet
Frågor kring genomförande av beskrivningsfasen
5.1 Hur många personer har aktivt deltagit i arbetet med den översiktliga beskrivningen?(skriv ”0” om inte någon i respektive grupp nedan deltagit)
Lärare Rektor Studierektor Andra: ………….….………………….….
Antal pers:
5.2 Är det endast personer som deltagit vid samlingar i Stockholm som på något sätt deltagit då den översiktliga beskrivningen tagits fram?
Ja Nej Vet ej
5.3 Hur många timmar har uppskattningsvis använts totalt i Din organisation för att sammanställa den översiktliga beskrivningen?
Antal timmar: ……….
5.4 Hur har arbetet med den översiktliga beskrivningen genomförts i Din organisation? (Markera med kryss, eventuellt kan mer än ett alternativ vara möjligt)
En medarbetare har skrivit allt utan att rådgöra med någon annan i organisationen
En medarbetare har skrivit allt och intervjuat andra kring hur de arbetar
En medarbetare har skrivit allt och haft andra personer i organisationen som remissinstanser
Flera medarbetare har skrivit utan att rådgöra med andra i organisationen
Flera medarbetare har skrivit och intervjuat andra kring hur de arbetar
Flera medarbetare har skrivit och haft andra personer i organisationen som remissinstanser
Alla medarbetare har deltagit på något sätt i skrivarbetet
Annat: ……………………………………………………………………….………………..
5.5 Hur många personer har aktivt deltagit i arbetet med den detaljerade beskrivningen? (skriv ”0” om inte någon i respektive grupp nedan deltagit)
Lärare Rektor Studierektor Andra: ………….….………………….….
Antal pers:
5.6 Är det endast personer som deltagit vid samlingar i Stockholm som på något sätt deltagit då den detaljerade beskrivningen tagits fram?
Ja Nej Vet ej
5.7 Hur många timmar har uppskattningsvis använts totalt i Din organisation för arbetet med den detaljerade beskrivningen?
Antal timmar: ……….

Frågeformulär 2b(kp)
Avdelningen för kvalitetsteknik & statistik vid Luleåtekniska universitet
5.8 Hur har arbetet med den detaljerade beskrivningen genomförts i Din organisation? (Markera med kryss, eventuellt kan mer än ett alternativ vara möjligt)
En medarbetare har skrivit allt utan att rådgöra med någon annan i organisationen
En medarbetare har skrivit allt och intervjuat andra kring hur de arbetar
En medarbetare har skrivit allt och haft andra personer i organisationen som remissinstanser
Flera medarbetare har skrivit utan att rådgöra med andra i organisationen
Flera medarbetare har skrivit och intervjuat andra kring hur de arbetar
Flera medarbetare har skrivit och haft andra personer i organisationen som remissinstanser
Alla medarbetare har deltagit på något sätt i skrivarbetet
Annat: …………………………………………………………………….………………..
Frågor kring resultat av självutvärderingen hittills
6.1 Bedöm värdet av arbetet med Läroverket genom att väga de resurser som använts mot det utfall arbetet hittills givit genom att kryssa i den ruta nedan som Du finner mest lämplig.
Mycket nyttigt Mycket onyttigt
Kommentar: ……………………………………..…………………….….………..……………………
6.2 Har arbetet med att beskriva er organisation genom att besvara frågorna i Läroverket inneburit att ni identifierat möjligheter till förbättringar?
Ja Nej Vet ej
Kommentar: ……………………………………..…………………….….………………..……………
6.3 Om Du svarat ”Ja” på fråga 6.2, vilken typ av förbättringsmöjligheter handlar det om?…………………………………………………………………………………..………………………
…………………………………………………………………………….…………………….………
6.4 Om Du svarat ”Ja” på fråga 6.2, när hittade Ni i Din organisation förbättringsmöjligheterna?
Under arbetet med översiktlig beskrivning
Under arbetet med detaljerad beskrivning
Vet ej
Kommentar: …………………………………………….…………………………………………..……

Frågeformulär 2b(kp)
Avslutande frågor
7.1 Har Din organisation påbörjat analysen av den detaljerade beskrivningen?
Ja Nej Vet ej
7.2 Kommentera gärna här om Du har någon synpunkt på denna enkät. Det kan till exempel handla om någon fråga som varit otydlig eller omöjlig att besvara.(ange frågenummer)
…………………………………………………………………………………….…………………….
…………………………………………………………………………………..………………………
……………………………………..……………………………………………..……………………..
7.3 Om Du har några ytterligare synpunkter kring projektet, gör det gärna här:
……………………………………………………………………………………….………………….
…………………………………………………………………………………………………………..
……………………………………..……………………………………………..……………………..
Tack för Din medverkan! Vi önskar att Du sänder enkäten i bifogat svarskuvert senast 1999-12-17
till Magnus Svensson Avd. för kvalitetsteknik & statistik
Luleå tekniska universitet 971 87 LULEÅ

Ind
ata
Möj
liga
ste
g in
om h
and
lin
gsp
lan
erin
gU
tdat
aF
örb
ättr
ings
möj
-li
ghet
er i
for
m a
v k
omm
enta
rer
från
an
alys
en
Gal
lrin
g av
kom
men
tare
r(f
ör f
oku
seri
ng
på
bri
ster
)
Eve
ntu
ell
red
uce
rin
g &
gr
up
per
ing
av
bri
ster
Ors
akss
ökn
ing
Åtg
ärd
s-fr
amta
gnin
g K
onse
kve
ns-
bed
ömn
ing
han
dli
ngs
-p
lan
erin
gh
and
lin
gsp
lan
för
ge
nom
föra
nd
e av
fö
rän
dri
nga
r
Kun
dsam
verk
an•
Xxx
xxx
xxxx
xxx
xx
•X
xxxx
x xx
xx x
xxxx
•
Xxx
xxx
xxxx
xxx
xx
•X
xxxx
x xx
xx x
xxxx
•
Xxx
xxx
xxxx
xxx
xx
Led
arsk
ap•
Xxx
xxx
xxxx
xxx
xx
•X
xxxx
x xx
xx x
xxxx
•
Xxx
xxx
xxxx
xxx
xx
•X
xxxx
x xx
xx x
xxxx
•
Xxx
xxx
xxxx
xxx
xx
Med
arb.
utv
. & d
elak
t.
•X
xxxx
x xx
xx x
xxxx
•
Xxx
xxx
xxxx
xxx
xx
•X
xxxx
x xx
xx x
xxxx
•
Xxx
xxx
xxxx
xxx
xx
•X
xxxx
x xx
xx x
xxxx
Ver
ksam
h. p
roce
sser
•
Xxx
xxx
xxxx
xxx
xx
•X
xxxx
x xx
xx x
xxxx
•
Xxx
xxx
xxxx
xxx
xx
•X
xxxx
x xx
xx x
xxxx
•
Xxx
xxx
xxxx
xxx
xx
Inne
bär
resp
ek-
tive
kom
men
tar
verk
lige
n at
t br
iste
r fi
nns,
el
ler
har
orga
-ni
sati
onen
med
-ve
tet
valt
att
ar-
beta
så?
Fin
ns k
omm
en-
tare
r kr
ing
otyd
-li
ghet
er i
den
de
talj
erad
ebe
skri
vnin
gen?
B
eror
det
på
”dål
ig b
eskr
iv-
ning
” el
ler
okun
-sk
ap o
m f
akti
ska
förh
ålla
nden
?
För
tydl
iga
kom
-m
enta
rern
a om
så
är
nödv
ändi
gt
och
lyft
fra
m
bris
ter.
Om
ant
alet
br
iste
r är
mån
ga
kan
det
vara
nöd
-vä
ndig
t at
t re
du-
cera
ant
alet
ge-
nom
att
gör
a en
pr
iori
teri
ng b
land
de
m.
Gen
om a
tt g
rup-
pera
bri
ster
kan
de
t vi
sa s
ig a
tt d
e li
gger
på
olik
a ni
-vå
er o
ch a
tt d
et
kan
finn
as
”sam
land
e ru
b-ri
ker”
för
någ
ra
av d
em.
Vil
ken
elle
r vi
lka
är o
rsak
erna
til
l hi
ttad
e br
iste
r?
Det
är
orsa
ker
som
ska
ll å
tgär
-da
s oc
h in
te
sym
ptom
.
Vil
ka å
tgär
der
behö
vs f
ör a
tt
kom
ma
till
rät
ta
med
ors
aker
na
till
de
bris
ter
som
hi
ttat
s?
Ran
gord
na d
e ol
ika
åtgä
rder
na.
Lös
er v
i de
id
enti
fier
ade
orsa
kern
a m
ed d
e pr
iori
tera
de
åtgä
rder
na?
Hur
påv
erka
r ol
i-ka
åtg
ärde
r va
-ra
ndra
(ko
rrel
a-ti
on);
pos
itiv
t el
ler
nega
tivt
?
Vil
ka å
tgär
der
skal
l ge
nom
föra
s ut
ifrå
n de
n gj
orda
åt
gärd
s-pr
iori
teri
ngen
?
När
ska
ll a
rbet
et
med
res
pekt
ive
åtgä
rd p
åbör
jas
och
avsl
utas
?
Vem
ska
ll a
nsva
ra
för
att
resp
ekti
ve
proj
ekt
geno
m-
förs
?
Den
öve
rsik
tlig
a ha
ndli
ngsp
lane
n bö
r in
nehå
lla
uppg
ifte
r så
som
:
•li
sta
över
de
åtgä
rder
so
m s
kall
vid
taga
s
•an
svar
ig p
erso
n fö
r re
spek
tive
åtg
ärd
•st
artd
atum
för
re
spek
tive
åtg
ärd
•fä
rdig
datu
m f
ör
resp
ekti
ve å
tgär
d,
Men
den
kan
äve
n om
fat-
ta t
.ex.
upp
följ
ning
, i
form
av
hur
lång
t ar
bete
m
ed r
espe
ktiv
e fö
ränd
-ri
ngsp
roje
kt k
omm
it.
Des
sa u
ppgi
fter
na k
an
läm
plig
en s
amm
anst
älla
s i
tabe
llfo
rm.
Anv
änd
t ex
:
•Par
etod
iagr
am
•Sl
äkts
kaps
diag
ram
Anv
änd
t ex
:
•’D
e fe
m v
arfö
r’
•Is
hika
wad
iagr
am
(Fis
kben
sdia
gram
)
•Rel
atio
nsdi
agra
m
Anv
änd
t ex
:
•T
rädd
iagr
am
•Sl
äkts
kaps
-di
agra
m
Anv
änd
t ex
:
•M
atri
sdia
gram
•
Trä
ddia
gram
m.
prio
rite
ring
stab
ell
Anv
änd
t ex
:
•Pil
diag
ram
Appendix
SPh4


Appendix MSLS overleaf

Ö5Beskrivning av: • kundgrupper • (olika grupper av
studenter/elever)
Ö5Beskrivning av: • kundgrupper • (olika grupper av
studenter/elever)
K1 (CC1)På vilket sätt tar vi reda på behov & förvänt-
ningar hos våra kundgrupper?
Ö2Beskrivning av: • verksamhetsidé • vision • mål • strategier
Ö2Beskrivning av: • verksamhetsidé • vision • mål • strategier
Ö7Beskrivning av: • framgångsfaktorer
Ö7Beskrivning av: • framgångsfaktorer
K2 (CC2)På vilket sätt ser vi till att medarbetarna
vet vilka behov och förväntningarvåra kundgrupper har?
VP1 (MP1)På vilket sätt rekryterar och
antar vi studerande?
VP2 (MP2)På vilket sätt väger samman fakta om kund-
gruppernas behov och förväntningar med våra värderingar, policys och de krav
våra styrdokument ställer?
Ö3Beskrivning av: • nationella styrdok. • lokala styrdok.
Ö3Beskrivning av: • nationella styrdok. • lokala styrdok.
AllaK
, L, M&
VP
Ö6Beskrivning av:
• lärande
Ö6Beskrivning av:
• lärande
Sty
rdo
ku
men
t
Alla
:K
, L, M
&V
P
- Ledare
Ö1Beskrivning av:• organisationen
Ö4Beskrivning av:• värderingar • policies
Ö4Beskrivning av:• värderingar • policies
L2På vilket sätt avsätter vi I ledningen resurser
till vår organisations förbättringsarbete?
Övr
iga
K, L
,
M&
VP
L1På vilket sätt ser vi i ledningen till att
visioner, verksamhetsidé, mål & strategier utvecklas för vår organisation?
Övr
iga
K, L
, M&
VP
All
a:K
, L, M
&V
P
M4
K4
- Medarbetare

K4 (CC4)På vilket sätt tar vi reda på hur väl vi lyckastillfredsställa våra kundgruppers behov och
förväntningar?
L4På vilket sätt arbetar vi i ledningen för att
ta fram vilka mätetal eller data som ärrelevanta för vår verksamhet?
M4 (EC4)På vilket sätt tar vi reda på hur nöjda eller missnöjda medarbetarna är med
sin arbetsplats och arbetssituation?
VP3 (MP3)På vilket sätt använder vi sammanvägningen(se fråga VP2) för att utforma en utbildnings-process som fokuserar på lärande och ger de
studerande relevant kunskap?
M2 (EC2)På vilket sätt tar vi, utifrån vår organisations
behov, reda på behov av kompetens-utveckling bland medarbetarna?
M1 (EC1)På vilket sätt tar vi reda på behov och
förväntningar hos medarbetarna?
Övriga K, L, M& VP
Beskrivningen kan exempelvis avse:• pedagogik, didaktik & metodik • kunskap & kunskapsutveckling• kunders roll (inkl. studerandes) i
utbildningsprocessen.
Beskrivningen kan exempelvis avse:• pedagogik, didaktik & metodik • kunskap & kunskapsutveckling• kunders roll (inkl. studerandes) i
utbildningsprocessen.
M3 (EC3)På vilket sätt stimuleras medarbetarna attutveckla vår organisations verksamhet?
VP4 (MP4)På vilket sätt stimulerar vi kommunikation
och samarbete mellan aktörer koppladetill vår utbildningsprocess?
Beskrivningen kan exempelvis avse:• de studerandes studiemiljö och stu-
diesituation under utbildningen • förmågan att uppfylla alla kund-
gruppernas behov och förväntningar efter avslutad utbildning.
Beskrivningen kan exempelvis avse:• de studerandes studiemiljö och stu-
diesituation under utbildningen • förmågan att uppfylla alla kund-
gruppernas behov och förväntningar efter avslutad utbildning.
L3På vilket sätt driver vi i ledningen vår
organisations förbättringsarbete?
Beskrivningen kan exempelvis avse:Kommunikation och samarbete• mellan lärare inom ett ämne• mellan lärare inom olika ämnen• mellan lärare och andra medarbetare• mellan lärare och studerande• mellan medarbetare & leverantörer
Beskrivningen kan exempelvis avse:Kommunikation och samarbete• mellan lärare inom ett ämne• mellan lärare inom olika ämnen• mellan lärare och andra medarbetare• mellan lärare och studerande• mellan medarbetare & leverantörer
K3 (CC3)På vilket sätt hanterar vi klagomål
från våra kundgrupper?
K1M2 K4
M4
M1
Ö5
L2 & L3
Tillbaka till lämpligaÖ, K, L, M & VP
Ö1
CC4
AppendixMSLS


Ett verktyg för arbete med självutvärderingi utbildningsorganisationer
LÄROSTEGEN I
SVENSK SKOLA
Lärostegen


InnehållsförteckningInledning ................................................................................................ 1
Hörnstenar i offensiv kvalitetsutveckling ......................................... 2
Utvärderingsverktyget Lärostegen .................................................... 3
Arbetsgång vid självutvärdering ........................................................ 4Fas I – Planering ........................................................................................... 4Fas IIa – Översiktlig beskrivning ................................................................... 4Fas IIb – Detaljerad beskrivning ................................................................... 4Fas III – Analys .............................................................................................. 5Fas IV – Åtgärdsplanering ............................................................................ 5Arbetet efter självutvärderingen .................................................................. 5
Fas I – Planering ................................................................................... 6
Fas IIa – Översiktlig beskrivning ........................................................ 7Fas IIb – Detaljerad beskrivning ........................................................ 8
Kundsamverkan .................................................................................... 9
Ledarskap ............................................................................................ 10
Medarbetarnas utveckling och delaktighet ................................... 11
Verksamhetens processer ................................................................ 12
Reflektion respektive förbättring ..................................................... 13
Fas III – Analys .................................................................................... 14
Fas IV – Handlingsplanering ............................................................. 14
Förbättringsarbete .............................................................................. 15
Beskrivningsmall ................................................................................ 16
FLIKAR:
Beskrivningshjälpen
Analysmatris
© Magnus Svensson och Avdelningen för kvalitets- och miljöledning,Luleå tekniska universitet
Form: Ordförrådet, Stockholm
Tryck: Universitetstryckeriet, Luleå

Beskrivningshjälpen (fas IIb)
AngreppssättBeskriv vilka angreppssätt vi använder idag.• Vad gör vi – vilka angreppssätt använder vi?• Hur gör vi – vilka metoder och aktiviteter ingår i angreppssätten? Beskriv kortfattat, men
så ingående att även personer som inte är inblandade får en bild av hur arbetet går till.• Varför använder vi dessa angreppssätt – vilket är syftet & vad vill vi uppnå?
TillämpningBeskriv i vilken omfattning vi använder de beskrivna angreppssätten.• I hur stor del av vår verksamhet där de beskrivna angreppssätten bör nyttjas använder vi
dem i praktiken? (bredd)• Hur ofta använder vi de beskrivna angreppssätten i dessa processer och aktiviteter?
(frekvens)
UtfallBeskriv i vilken utsträckning tillämpning av beskrivna angreppssätten leder till det de är av-sedda för och om eventuell mätning är tillförlitlig. Utfall kan vara i numerisk eller verbal form.• Redovisa det utfall vi erhållit det senaste året genom beskriven tillämpning av angreppssätt.• Redovisa om möjligt utfall för de tre senaste åren.• Redovisa om möjligt de utfall andra organisationer erhåller från tillämpning av liknande
angreppssätt.
ResultatBeskriv vilka resultat vi uppnått inom området. Resultat bör vara i numerisk form, men kanvara i verbal form.• Redovisa vilka resultat vi uppnått det senaste året.• Redovisa satta mål för beskrivet angreppssätt.• Redovisa om möjligt resultat från de tre senaste åren.• Redovisa om möjligt andra organisationers resultat.
ReflektionBeskriv följande:RF1 Vad och hur gör vi för att reflektera kring angreppssätt, tillämpningar, utfall och resultat?RF2 I vilken utsträckning vi reflekterar kring följande fem punkter:
a) Om anledningen till att just de beskrivna angreppssätten används.b) Om anledningen till att vi tillämpar angreppssätten i beskriven omfattning?c) Om angreppssätt & tillämpningar leder till avsett utfall & resultat.d) Hur våra utfall & resultat står sig över tiden och i jämförelse med andras utfall &
resultat?e) Om beskrivna angreppssätt & tillämpningar innebär att vi gör rätt saker och
dessa saker på rätt sätt?
RF3 I vilken omfattning genomför vi reflektion?RF4 Vad och hur gör vi för att reflektera kring vårt sätt att genomföra reflektion enligt RF1–RF3?
FörbättringBeskriv följande:F1 Vad & hur gör vi för att ta fram förändringsförslag utifrån reflektion?F2 I vilken omfattning tar vi fram förändringsförslag utifrån reflektion?F3 Vad & hur gör vi för att förändra utifrån förändringsförslagen?F4 I vilken omfattning förändrar vi utifrån förändringsförslag?F5 Vilka utfall och resultat har vi uppnått genom förändringarna?F6 Vad & hur gör vi för att förbättra vårt sätt att reflektera?F7 Vad & hur gör vi för att förbättra vårt förbättringsarbete?

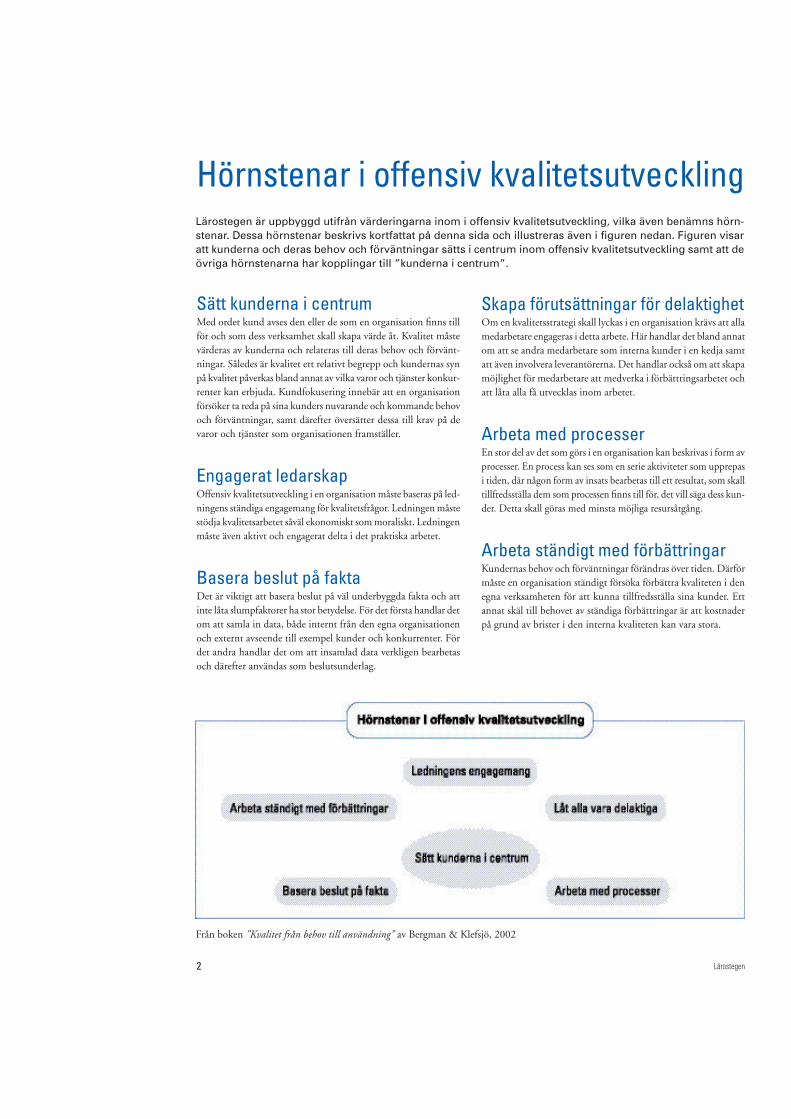


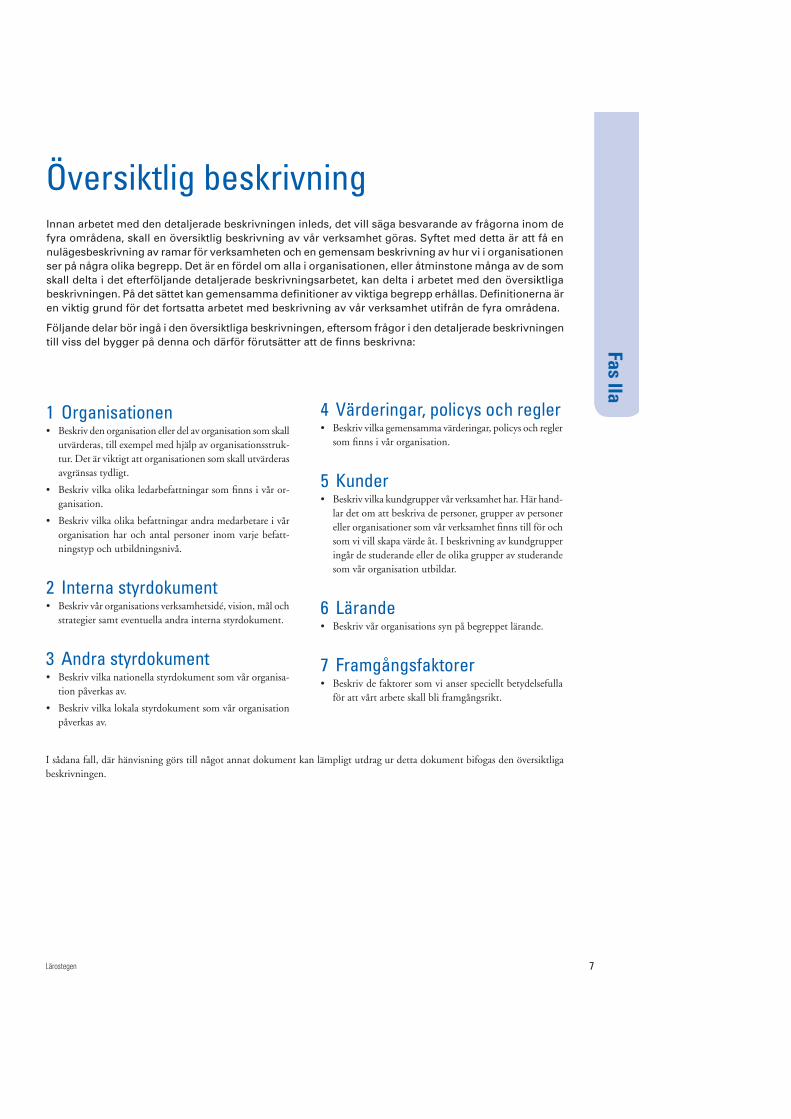


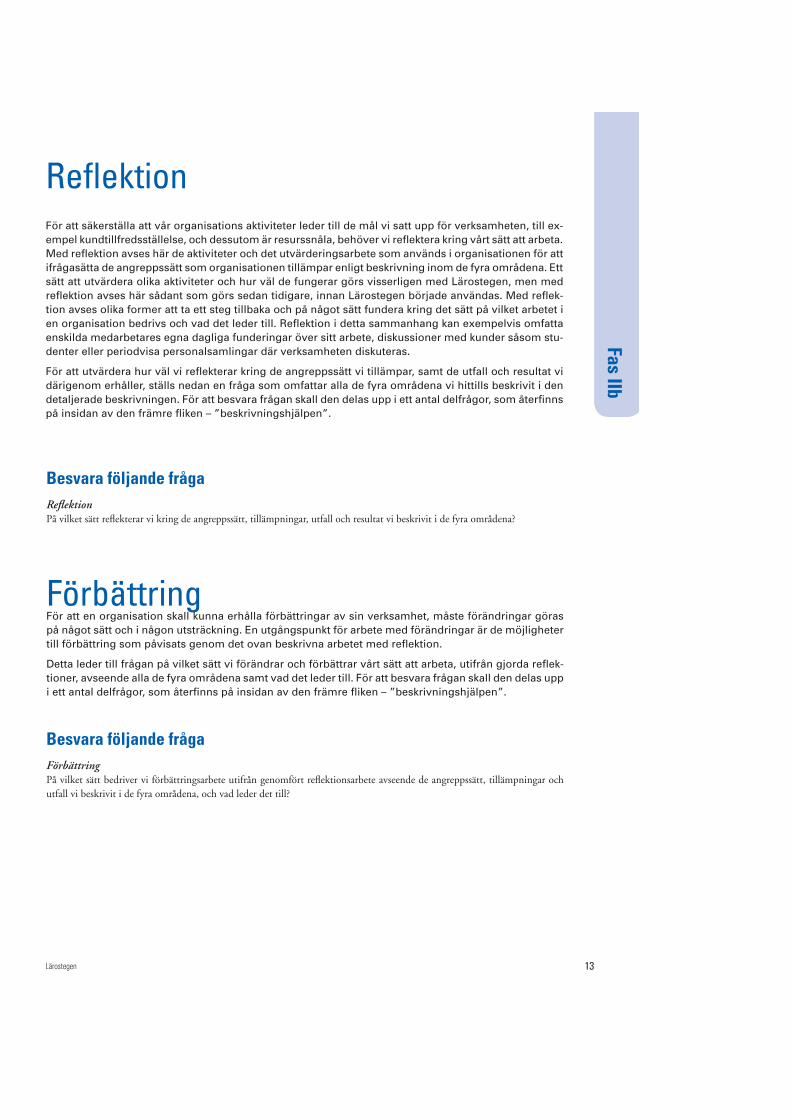


Lärosteget 1
Refle
ktio
n
RF1
RF2
RF3
RF4
Vad
och
hur
gör
vi f
ör a
tt r
efle
kter
aI
vilk
en u
tstr
äckn
ing
r efle
kter
ar v
i kri
ngI
vilk
en o
mfa
ttni
ng g
enom
för
vi r
efle
ktio
n?V
ad o
ch h
ur g
ör v
i för
att
ref
lekt
era
krin
g vå
rt s
ätt
krin
g an
grep
pssä
tt, t
illäm
pnin
gar ,
utfa
ll oc
h re
sulta
t?de
fem
pun
kter
na u
nder
RF2
i be
skri
vnin
gen?
att g
enom
föra
ref
lekt
ion
enlig
t RF1
–RF3
?
Förb
ättri
ng
F1F2
F3F4
F5F6
F7V
ad &
hur
tar
vi fr
amI
vilk
en o
mfa
ttni
ng ta
r vi
Vad
& h
ur g
ör v
i för
att
I vi
lken
om
fatt
ning
gen
om-
Vilk
a ut
fall
och
resu
ltat
Vad
& h
ur g
ör v
i för
att
Vad
& h
ur g
ör v
i för
att
förä
ndri
ngsf
örsl
agfr
am fö
ränd
ring
sför
slag
geno
mfö
ra fö
ränd
ring
arfö
r vi
förä
ndri
ngar
har
vi u
ppnå
tt g
enom
förb
ättr
a vå
rt s
ätt
förb
ättr
a vå
rtut
ifrån
ref
lekt
ion?
utifr
ån r
efle
ktio
n?ut
ifrån
förä
ndri
ngsf
örsl
ag?
utifr
ån fö
ränd
ring
sför
slag
?fö
ränd
ring
arna
?at
t ref
lekt
era?
förb
ättr
ings
arbe
te?

Analysmatris ATUR
Finns angreppssättbeskrivet?
Finns tillämpning be-skriven?
Finns utfall beskrivet?
Finns resultatbeskrivet?
Analys av beskrivningens utformning Analys av innehåll
Angr
epps
-sä
tt
För analys av RF1:Använd ”Angreppssätt” i analysmatris ATUR.
För analys av RF2:Kommentera i vilken grad reflektion görs kring de fem punkterna under RF2 i”beskrivningshjälpen”.
För analys av RF3:Använd ”Tillämpning” i analysmatris ATUR
För analys av RF4:Använd ”Angreppssätt” i analysmatris ATUR.
Är angreppssättetanekdotiskt beskrivet?Har allt som efter-frågas beskrivits?
Avser beskrivning avtilllämpning beskrivetangreppssätt?
Avser utfallet den be-skrivna tillämpningenav angreppssättet?
Avser resultaten debeskrivna engrepps-sätten inom området?
Har följande beskri-vits: vad, hur, varför,och i såfall tillräckligtingående?
Har följandebeskrivits:• bredd• frekvens?
Har följandebeskrivits:• eget utfall under flera år?• andra organisatio- ners utfall?
Har följandebeskrivits:• egna resultat• mål?• egna resultat under minst tre år?• andra organisatio- ners resultat?
Är angreppssättet: in-tegrerat, systematiskt,förebyggande, och i såfall i vilken grad?
I vilken omfattningsamt hur regelbundettillämpas angrepps-sättet?
Jämför och kommen-tera följande:• utfall mot svaret på frågan ”varför” inom angreppssätt.• utfall under flera år (ev. positiv eller negativ trend)?• egna utfall mot andra organisa- tioners
Jämför och kommen-tera följande:• resultat mot mål• resultat under flera år (ev. positiv eller negativ trend)?• egna resultat mot andra organisatio- ners.
För analys av F1:Använd ”Angreppssätt” i analysmatris ATUR
För analys av F2:Använd ”Tillämpning” i analysmatris ATUR
För analys av F3:Använd ”Angreppssätt” i analysmatris ATUR
För analys av F4:Använd ”Tillämpning” i analysmatris ATUR
För analys av F5:Använd ”Utfall” respektive ”Resultat” i analysmatris ATUR
För analys av F6:Använd ”Angreppssätt” i analysmatris ATUR
För analys av F7:Använd ”Angreppssätt” i analysmatris ATUR
Analysmatris ”Reflektion”
Analysmatris ”Förbättring”
Refle
ktio
nFö
rbät
trin
gRe
sulta
tUt
fall
Tillä
mpn
ing

SynpunkterOm du har synpunkter på Lärostegen, framför dem gärna till:[email protected]
ReferenserBergman B. & Klefsjö, B. (2002). Kvalitet från behov till användning. Studentlitte-ratur, Lund.
Klefsjö, B., Eliasson, H., Kennerfalk, L., Lundbäck, A. & Sandström, M. (1999).De sju förbättringsverktygen. Studentlitteratur, Lund.
Hellsten, U. (1997). The Springboard – A TQM-Based Tool for Self-Assessment.Licentiatuppsats 1999:42. Avdelningen för kvalitets- & miljöledning, Luleå tek-niska universitet.
Hellsten, U. & Klefsjö, B. (2001). Självutvärdering. Kvalitetsmagasinet, 2001:1respektive Kvalitetsmagasinet 2001:2.
Svensson, M. (2002). TQM-Based Self-Assessment in Educational Organisations.Licentiatuppsats 2002:12. Avdelningen för kvalitets- & miljöledning, Luleåtekniska universitet.
Svensson, M. (1998). Läroverket KY-version. Avdelningen för kvalitets- & miljöled-ning, Luleå tekniska universitet.

Postadress: 118 82 StockholmBesöksadress: Hornsgatan 20Tel: 08-452 71 00Fax: 08-452 72 28www.svekom.se
SVENSKAKOMMUNFÖRBUNDET
LÄROSTEGEN I
SVENSK SKOLA
Postadress: 971 87 Luleå
Besöksadress: Alfa-huset,Universitetsområdet,Porsön, Luleå
Tel: 0920-49 10 00
Fax: 0920-49 21 60
www.ies.luth.se/kval/

Snabbenkät angående utbildningen kringkvalitet och kvalitetsprojektetpå X-enheten den 9 januari 2003
Vi som försöker hålla ihop det projekt vi diskuterade på onsdag eftermiddag vill gärna ha Din syn på eftermiddagen . Vi ber Dig fylla i svar på frågorna nedan och skicka blanketten till
Magnus Svensson (e-post: [email protected], fax: 0920-492160)
eller
Bengt Klefsjö (e-post: [email protected], fax: 0920-492160)
Ja absolut Ja med lite tvekan
Varken ja eller nej
Nej med viss tvekan
Nej absolut inte
Som helhet tycker jag eftermiddagen var intressant och givande Jag fick en tydlig bild av vad projektet går ut på med hjälp av Magnus presentation Jag hade god behållning av den allmänna presentationen kring kvalitet och kvalitetsutveckling som Bengt höll Presentationen av den översikt som sammanställts på X-enheten och som presenterades av MM och NN var bra och värdefull
Dessa saker tycker jag var bra under eftermiddagen:
•
•
Detta tycker jag inte var så bra under eftermiddagen:
•
•
Tack för att Du hjälper oss!
Kommentera gärna andra saker:
AppendixQUSS1


Enkät till X-enheten angående självutvärdering
Använd gärna papperets baksida om Du behöver mer plats!
1. Vilken är Din befattning inom gymnasieenheten? …………….………...……..….…(t ex lärare, vaktmästare, rektor)
2. Vilken är Din ålder? (markera med ett kryss)
Yngre än 30 år 30-40 år 41-50 år Äldre än 50 år
3. Tycker Du att du fått tillräcklig information om projektet kring självutvärdering för att förstå vad det syftar till och hur det är tänkt att genomföras? (markera med ett kryss i en av rutorna i följande skala)
Kommentar:Nej
absolut inteJaabsolut ………………………………………….…...…………..
4. Deltog Du i utbildningstillfället kring självutvärdering onsdagen den 8 januari som hölls i X-enhetens elevmatsal?
Ja Nej Kommentar: …………………………...…………………………..….
5. Vilka kunskaper anser Du att Du hade om offensiv kvalitetsutveckling (TQM) sedan tidigare, före Ditt eventuella deltagande vid utbildningstillfället den 8 januari som hölls i X-enhetens elevmatsal?
(markera med ett kryss i någon av rutorna i följande skala)
Kommentar:Inga kun-
skaper allsGoda kunskaper …………………………………………………..…...….
6. Har Du deltagit i arbetet med att ta fram den översiktliga beskrivning som ingår i arbetet med självutvärdering, och som NN presenterade vid utbildningstillfället den 8 januari som hölls i X-enhetens elevmatsal?
Ja Nej Kommentar: ………………………………….………..…..….
7. Vilket värde tror Du att arbetet med självutvärdering vid X-enhetens kommer att ha för denna enhets verksam-het? (markera med ett kryss i en av rutorna i följande skala)
Kommentar:Inte alls
värdefulltMycket värdefullt ……………………………………………………..……
8. Vilket värde tror Du att arbetet med självutvärdering vid X-enhetens kommer att ha för Ditt eget arbete inom denna enheten? (markera med ett kryss i en av rutorna i följande skala)
Kommentar:Inte alls
värdefulltMycket värdefullt ………………………………………………..…………
9. I vilken grad känner Du Dig motiverad att själv delta i arbete med självutvärdering vid X-enhetens? (markera med ett kryss i en av rutorna i följande skala)
Kommentar:
Känner ingen motivation
Känner stark motivation ………………………………………………………..…
10. Nämn de tre viktigaste sakerna eller förhållandena inom gymnasieskolan i Luleå som du tycker bör förbättras:
1. ………………………………….. 2. ……………………………….. 3. …………………..………………
11. Andra kommentarer: ……………………………………………………………..…………………………………
………………………………………………………………………………………………………………………
Tack för din medverkan Enkäten lämnas i lådan eller skickas till:
Magnus Svensson, Avd. för kvalitets- & miljöledning, 971 87 LULEÅ, Fax: 0920-49 21 60
AppendixQUSS2


Intervju guide
För Intervjuer med rektorer & gymnasiechef inom GS-projektet
1 Respondenten
a) När började du som rektor/skolchef vid denna enhet?
b) Vilka program ansvarar du för vid denna enhet eller annan enhet / gymnadieskolan?
- När blev du ansvarig för dessa program?
c) Kan du berätta om din bakgrund?
- utbildning - tidigare arbete inom gymnasieskolor - ev. arbete utanför gymnasieskolor
d) Skapandet av gymnasiebyn tycks innebära vissa förändringar av organisationen.
Vet du om du kommer att arbeta vidare vid denna enhet och med nuvarande program även de närmaste tre åren? (flytta till någon av de andra enheterna, att sluta eller byta?)
Om sluta vid enheten – När, anledningen till detta, konsekvenser för nuvarande arb.?
Om byta program – När, anledningen till detta, konsekvenser för nuvarande arb.?
e) Hur definierar du kvalitet inom utbildningsverksamhet?
- Har arbetet med självutvärdering under det senaste läsåret påverkat din syn på vad kvalitet inom utbildningsverksamhet är?
f) Har du arbetat med någon form av kvalitetsarbete före detta läsår?
g) Självutvärderingsarbetet under detta läsår är ju baserat på den teori som brukar kallas offensiv kvalitetsutveckling eller TQM.
Har du arbetat med någon form av kvalitetsarbete baserat på TQM före detta läsår?
Om ja: på vilket sätt?
Projektet mellan gymnasieskolan i Luleå och LTU består ju av två delar, dels skolutveck-lingsprojektet (Arbetsvetenskap) och dels självutvärderingsprojektet (Kvalitetsavdelningen). Dessa två delprojekt tillsammans kan vi kalla ”totalprojektet”. Nu närmast kommer några frågor kring detta så kallade ”totalprojektet”.
2 Initiering av totalprojektet
a) Vilken är din bild av hur totalprojektet (d v s där både självutvärdering och skolutvecklings ingår) initierats: - vem var initiativtagare? - vilket var syftet?
b) Vilken info har du fått om totalprojektet? - på vilket sätt har du erhållit den?
c) Har du haft möjlighet att påverka totalprojektets utformning, om ja: hur?
AppendixIUSS

3 Initiering av självutvärderingsprojektet
a) Vilken är din bild av hur självutvärderingsprojektet initierats (varför just detta): - vem var initiativtagare? - vilket var syftet i inledningsskedet?
b) Fick du någon information om självutvärderingsprojektet innan Bengt & Magnus var med vid det första informationsmötet som hölls i Sunderbyn? - på vilket sätt har du erhållit denna info?
c) Tycker du att du haft möjlighet att påverka utformningen av självutvärderings-projektet?
Om ja: på vilket sätt har du påverkat självutvärderingsprojektet?
4 Syfte med självutvärderingsprojektet a) Vilket eller vilka syften har din enhet med självutvärderingsprojektet?
(vad vill enheten uppnå med arbetet)
5 Bengts & Magnus möten med & utbildning av rektorer
a) Har du deltagit vid alla möten och utbildningstillfällen? - vilka har du inte varit med på?
b) Tycker du att du vid varje möte/utbildning fått veta tillräckligt mycket om självutvär-dering för att förstå vad: - en självutvärdering innebär? - en självutvärdering skall leda till?
c) Tycker du att du vid varje möte/utbildning fått veta tillräckligt mycket om självutvär-dering för att kunna: - informera andra vid din enhet om syfte, innehåll & upplägg?
- utbilda andra vid din enhet om arbete med självutvärdering?
6 Information till medarbetare före utbildning för projektgrupper vid Midskogsskolan 31 oktober
a) Har du eller någon annan informerat medarbetare om ”totalprojektet” respektive självutvärderingsprojektet före utbildningen för projektgrupper vid Midskogsskolan 31 oktober?
7 Utbildning för projektgrupper vid Midskogsskolan 31 oktober
a) Tycker du att utbildningstillfället där de som skulle ingå i projektgrupperna gav medarbetarna tillräcklig beskrivning av självutvärdering för att de skulle kunna delta i det kommande arbetet?
b) Tycker du att något som togs upp vid detta utbildningstillfälle var överflödigt; vad?
c) Tycker du att något saknades helt eller borde tagits upp i större omfattning vid detta utbildningstillfälle?; vad saknades/borde tagits upp mer?

8 Arbetet med översiktlig beskrivning
a) Har du eller någon annan informerat medarbetare vid enheten inför arbetet med att ta fram en översiktlig beskrivning? Vem/vilka, hur spridits, var, när? Varför inte?
b) På vilket sätt har ni arbetat med att ta fram den översiktliga beskrivningen?
- Vilka personer har varit aktiva i arbetet med ö.b. och på vilket sätt har dessa personer varit aktiva?
c) Hur mycket tid har totalt använts (i mantimmar) vid enheten för arbetet med ö.b.?
d) Har du eller någon annan informerat medarbetare som inte varit aktiva i arbetet med ö.b. om dokumentet och dess innehåll före ”breddutbildningstillfället?
- På vilket sätt har denna information genomförts
e) Har arbetet med ö.b. lett till något annat resultat än själva dokumentet (öb)?
(insikt om förbättr.möjl., gemensam bild, kännedom om skillnader mellan arb.lag)
9 Information till medarbetarna före ”breddutbildningstillfället” vid din enhet
a) Har alla medarbetare fått information om totalprojektet som helhet respektive självutvärderingsprojektet? Hur, när, av vem, till vilka? Syn på varför ej?
10 ”Breddutbildningstillfället”
a) Tycker du att utbildningstillfället där en stor del av medarbetarna deltog i januari gav medarbetarna tillräcklig beskrivning av självutvärdering för att de skulle kunna delta i det kommande arbetet?
b) Tycker du att något som togs upp vid breddutbildningstillfället var överflödigt? Vad?
c) Tycker du att något saknades helt eller borde tagits upp i större omfattning vid breddutbildningstillfället? Vad?
d) Har resultatsammanställning av enkäten angående ”breddutbildningstillfället” förts vidare till medarbetare? (enkäten som avslutade utb.tillf. i matsalen, stadshuset, Medican eller ateljén)
Om nej: vem eller vilka har det gjorts?
Om ja: hur har det gjorts och har du fått några reaktioner på sammanställningen?
11 ”Extrautbildningstillfället” eller deltagandet vid startskede
a) Tycker du att detta tillfälle givit tillräcklig utbildning eller stöd för genomförandet av den detaljerade beskrivningen?
Om nej - vad skulle behövts mer av eller gjorts på annat sätt?
12 Arbetet med detaljerad beskrivning
a) Hur långt har din enhet kommit i arbetet med den detaljerade beskrivningen fram till idag? Om färdigt: Hur ni tänkt arbeta vidare, anledningen till att ni tänker arbeta på det sättet?

b) På vilket sätt arbetar (-ade) ni vid din enhet med den detaljerade beskrivningen?
c) Hur många medarbetare är/har varit inblandade?
d) Vilka medarbetare är/har varit inblandade?
e) På vilket sätt har dessa medarbetare varit inblandade? (viss överlappn. 10b)
f) Vilken är anledningen till att ni valt att lägga upp arbetet på det sättet?
g) Vilken har din roll varit? - har du deltagit i arbetet och i så fall på vilket sätt? - om ja, för vilka program har du deltagit i arbetet (ansvarar för eller. alla)?
13 Lärostegen
a) Vilken relevans tycker du att de fyra områdena i LS har för din enhet?
b) Vilken relevans tycker du att de enskilda frågorna i LS har för din enhet?
c) Hur bedömer du formuleringarna av frågorna i LS?
d) Tycker du att det är det något som saknas i LS?
e) Vilket är ditt totalomdöme av LS som verktyg (två aspekter):
14 Ledningsmöten (Rektorer & Gymnasiechefen)
a) I vilken utsträckning har ni diskuterat arbetet med självutvärdering på ledningsmötena under innevarande läsår
b) Vad har ni diskuterat vid dessa ledningsmöten kring självutvärderingsarbetet? (syfte, organisatoriskt genomförande, samordning …)
15 Stöd för arbetet
a) Beskriv hur du ser på stöd för arbete med självutvärdering utifrån dina erfarenheter från pågående projekt?
Tycker du att du har fått stöd i någon form för genomförande av självutvärde- ringsarbetet fram till idag?
(dels avseende ÖB, dels avseende DB)
Om fått stöd - vem eller vilka tycker du har givit detta stöd? - vilken form av stöd har du fått? - har stödet varit tillräckligt för att genomföra projektet?
- är det någon form av stöd som du saknat? – vilken form av stöd?
Om ej fått stöd - är det någon form av stöd som du saknat? - vilken form av stöd hade du velat få? - av vem eller vilka hade du velat få stödet?
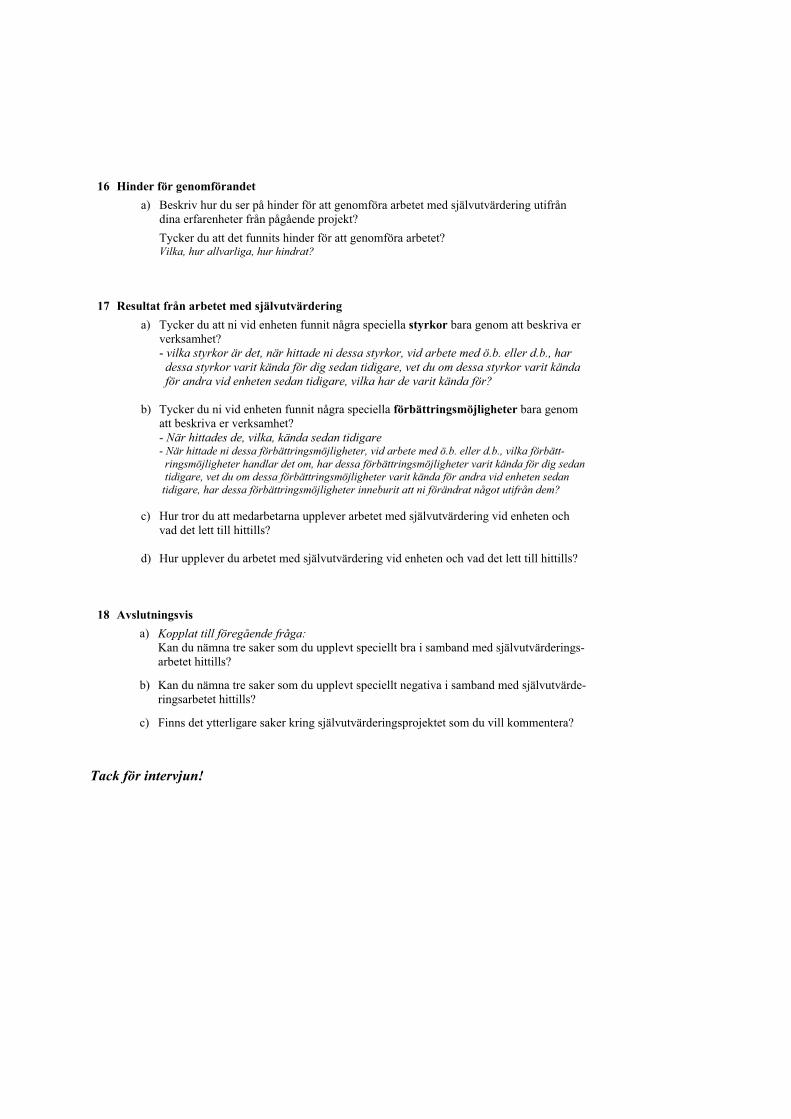
16 Hinder för genomförandet
a) Beskriv hur du ser på hinder för att genomföra arbetet med självutvärdering utifrån dina erfarenheter från pågående projekt?
Tycker du att det funnits hinder för att genomföra arbetet? Vilka, hur allvarliga, hur hindrat?
17 Resultat från arbetet med självutvärdering
a) Tycker du att ni vid enheten funnit några speciella styrkor bara genom att beskriva er verksamhet? - vilka styrkor är det, när hittade ni dessa styrkor, vid arbete med ö.b. eller d.b., har dessa styrkor varit kända för dig sedan tidigare, vet du om dessa styrkor varit kända för andra vid enheten sedan tidigare, vilka har de varit kända för?
b) Tycker du ni vid enheten funnit några speciella förbättringsmöjligheter bara genom att beskriva er verksamhet? - När hittades de, vilka, kända sedan tidigare - När hittade ni dessa förbättringsmöjligheter, vid arbete med ö.b. eller d.b., vilka förbätt- ringsmöjligheter handlar det om, har dessa förbättringsmöjligheter varit kända för dig sedan tidigare, vet du om dessa förbättringsmöjligheter varit kända för andra vid enheten sedan tidigare, har dessa förbättringsmöjligheter inneburit att ni förändrat något utifrån dem?
c) Hur tror du att medarbetarna upplever arbetet med självutvärdering vid enheten och vad det lett till hittills?
d) Hur upplever du arbetet med självutvärdering vid enheten och vad det lett till hittills?
18 Avslutningsvis
a) Kopplat till föregående fråga: Kan du nämna tre saker som du upplevt speciellt bra i samband med självutvärderings-arbetet hittills?
b) Kan du nämna tre saker som du upplevt speciellt negativa i samband med självutvärde-ringsarbetet hittills?
c) Finns det ytterligare saker kring självutvärderingsprojektet som du vill kommentera?
Tack för intervjun!

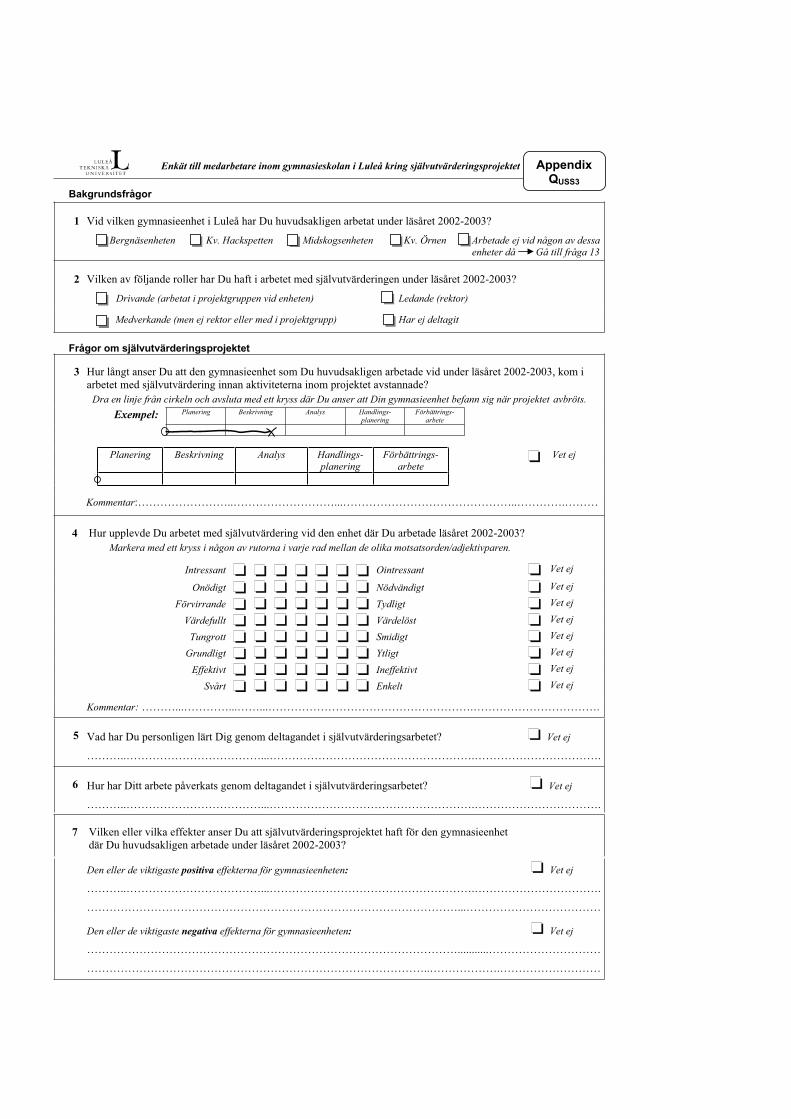
Enkät till medarbetare inom gymnasieskolan i Luleå kring självutvärderingsprojektet
Bakgrundsfrågor
1 Vid vilken gymnasieenhet i Luleå har Du huvudsakligen arbetat under läsåret 2002-2003?
Bergnäsenheten Kv. Hackspetten Midskogsenheten Kv. Örnen Arbetade ej vid någon av dessa enheter då Gå till fråga 13
2 Vilken av följande roller har Du haft i arbetet med självutvärderingen under läsåret 2002-2003?
Drivande (arbetat i projektgruppen vid enheten) Ledande (rektor)
Medverkande (men ej rektor eller med i projektgrupp) Har ej deltagit
Frågor om självutvärderingsprojektet
3 Hur långt anser Du att den gymnasieenhet som Du huvudsakligen arbetade vid under läsåret 2002-2003, kom i arbetet med självutvärdering innan aktiviteterna inom projektet avstannade?
Dra en linje från cirkeln och avsluta med ett kryss där Du anser att Din gymnasieenhet befann sig när projektet avbröts.
Exempel: Planering Beskrivning Analys Handlings-planering
Förbättrings-arbete
Planering Beskrivning Analys Handlings-
planering Förbättrings-
arbete Vet ej
Kommentar:……………………..………………………...………………………………………..………….………
4 Hur upplevde Du arbetet med självutvärdering vid den enhet där Du arbetade läsåret 2002-2003? Markera med ett kryss i någon av rutorna i varje rad mellan de olika motsatsorden/adjektivparen.
Intressant Ointressant
Vet ej
Onödigt Nödvändigt
Vet ej
Förvirrande Tydligt Vet ej
Värdefullt Värdelöst Vet ej
Tungrott Smidigt
Vet ej
Grundligt Ytligt
Vet ej
Effektivt Ineffektivt
Vet ej
Svårt Enkelt Vet ej
Kommentar: ………...…………...……...……………………………………………….…………………………….
5 Vad har Du personligen lärt Dig genom deltagandet i självutvärderingsarbetet? Vet ej
………..………………………………...……………………………………………….…………………………….
6 Hur har Ditt arbete påverkats genom deltagandet i självutvärderingsarbetet? Vet ej
………..………………………………...……………………………………………….…………………………….
7 Vilken eller vilka effekter anser Du att självutvärderingsprojektet haft för den gymnasieenhet där Du huvudsakligen arbetade under läsåret 2002-2003?
Den eller de viktigaste positiva effekterna för gymnasieenheten: Vet ej
………..………………………………...……………………………………………….…………………………….
………………………………………………………………………………………...………………………………
Den eller de viktigaste negativa effekterna för gymnasieenheten: Vet ej
………………………………………………………………………………………...........…………………………
………………………………………………………………………………..……………….………………………
AppendixQUSS3

8 Bedöm värdet av arbetet med självutvärdering genom att väga de resurser som använts mot det utfall arbetet hittills givit genom att kryssa i den ruta nedan som Du finner mest lämplig.
Mycket onyttigt Mycket nyttigt Vet ej
Kommentarer:………………………………………...…………………...………………………..………….………
9 Vilka är, enligt Din bedömning, de viktigaste orsakerna till att aktiviteterna inom projektet avstannade? Svara med ett kryss i någon av rutorna för var och en av delfrågorna på skalan 1-5, där:
1 = inte alls bidragande 5 = mycket starkt bidragande
1 5 Motivering till Din bedömning
a) Den arbetsmängd som krävdes i förhållan-de till de resurser som avsatts för arbetet: Vet ej ……………………………………
b) Det sätt som arbetet genomfördes på vid den gymnasieenhet där Du arbetar: Vet ej …………………………….……...
c) Brister i utbildning(ar) som hållits inom projektet kring självutvärdering: Vet ej ………………………….………...
d) Brister i den information som Du fått kring projektet: Vet ej …………………………………....
e) Valet av Lärostegen som verktyg för självutvärderingen: Vet ej ……………………………………
f) Olika personers agerande: (Se även fråga 10) Vet ej ………………..…………………..
g) Annat: ……………………………..…. Vet ej ……………………………………
h) Annat: ………….…………………….. Vet ej ………………………….………...
Kommentar:…...……………………………………...…………………………...……………..………...…….…….
10 I vilken grad tycker Du att följande gruppers eller personers agerande, eller brist på agerande, bidrog till att aktiviteterna inom projektet avstannade? Svara med ett kryss i någon av rutorna för var och en av delfrågorna på skalan 1-5, där:
1 = inte alls bidragande 5 = mycket starkt bidragande
1 5 Motivering till Din bedömning
a) Rektorsgruppen vid den gymnasieenhet där Du arbetade läsåret 2002-2003: Vet ej ……….…………………………...
b) Projektgruppen vid den gymnasieenhet där Du arbetade läsåret 2002-2003: Vet ej ……….…………………………...
c) Luleå tekniska universitet (Bengt Klefsjö & Magnus Svensson): Vet ej ……………………………………
d) Kommunal skolledning, t ex gymnasie-chef eller skolchef: Vet ej ……………………………………
e) Din egen insats: Vet ej ……………………………………
f) Andra medarbetare vid den gymnasieenhet där Du arbetade läsåret 2002-2003: Vet ej ……………………………………
g) Annat: ………….……….……………. Vet ej ……………………………………
Kommentarer:………………………………………...…………………...………………………..………….………
11 Vad tycker Du borde göras annorlunda om ett liknande självutvärderingsprojekt skulle startas vid någon gymnasieskola?
……………………………………………………………………………………………...…………………………
……………………………………………………………………………………………...…………………………
……………………………………………………………………………………………...…………………………

12 Vi är tacksamma om Du vill lämna ytterligare kommentarer kring självutvärderingsprojektets syfte, genomförande och avbrott:
……………………………………………………………………………………………...…………………………
……………………………………………………………………………………………...…………………………
……………………………………………………………………………………………...…………………………
……………………………………………………………………………………………...…………………………
Allmänna frågor om utvärdering och verktyget Lärostegen
13 I vilken grad anser Du att det finns behov av att ni själva vid den gymnasieenhet där Du arbetar, tillsammans utvärderar gymnasieenhetens verksamhet genom att beskriva och analysera hur ni arbetar?
Markera Din bedömning med ett kryss i en av rutorna på skalan mellan de två yttervärdena:
Inget behov Mycket stort behov Vet ej
Kommentar: ……...…………...………………………..………………………………………...……………………
14 Självutvärdering med hjälp av Lärostegen är uppbyggt kring sex värderingar, som innebär att i en organisation:
• sätts de som verksamheten är till för (kunderna) i centrum
• skapas det förutsättningar för delaktighet
• arbetas det ständigt med förbättringar
• arbetas det med processer
• baseras beslut på fakta
• är ledningen engagerad
Hur relevanta bedömer Du att dessa sex värderingar är som helhet för den utbildningsverksamhet som bedrivs vid den gymnasieenhet där Du arbetar?
Markera Din bedömning med ett kryss i en av rutorna på skalan mellan de två yttervärdena:
Irrelevant Relevant Vet ej
Kommentar: ……...………...………………………………..……………………………...………….………………
15 I vilken grad anser Du att ”Lärostegen” är lämplig som verktyg för att utvärdera en utbildningsorganisationsarbete med kvalitet?
Ge Ditt svar med ett kryss i någon av rutorna för var och en av delfrågorna på skalan 1-5, där:
1 = mycket olämplig(t) 5 = mycket lämplig(t)
1 5 Motivering till Din bedömning
a) Att använda Lärostegen för utvärdering är: Vet ej ……….…………………….
b) Att Lärostegen omfattar de fyra områdena ”Kundsamverkan”, ”Ledarskap”, ”Medar-betarnas utveckling & delaktighet” samt”Verksamhetens processer”
Vet ej …...………………………...
c) Det som tas upp i frågorna i Lärostegen är: Vet ej …………...………………...
d) Antalet frågor som ställs i Lärostegen är: Vet ej ……...……………………...
e) Formulering av frågorna i Lärostegen är: Vet ej ………...…………………...
f) Annat: ……………………………….…….…… Vet ej …………...………………...
Kommentar:…………………………...……………...…………………...………………………..………….……….
Tack för Din medverkan!
Vi vill be Dig att lägga enkäten i lådan senast 2003-12-18. Om Du vill kan enkäten skickas till: Magnus Svensson, Avd. för kvalitets- & miljöledning, Luleå tekniska universitet, 971 87 LULEÅ, Fax: 49 21 60