Embed Size (px)
Citation preview

Highlights
Press release Q3 2003 Page 1 of 23

Highlights
Press release Q3 2003 Page 2 of 23
Excellent Mail and Express performances in TPG�s third quarter
Good progress in Logistics transformation plan
TPG has today announced its third quarter 2003 results
Highlights:
� Solid improvement in free cash flow
� Excellent performances in Mail and Express, offset by lower earnings in Logistics
� Good progress in execution of Logistics transformation plan (TtS)
� Goodwill impairment charge and asset write downs of �193 million in line withpreliminary estimates leading to negative net income for quarter
� Outlook for 2003 full year unchanged
Q3 2003 Q3 2002
�mil �mil
Revenues 2,829 2,805 0.9%
Operating income (EBIT) (16) 191 (108.4%)
Net income (88) 99 (188.9%)
Underlying net income* 117 99 18.2%
Underlying earnings per share* 24.6 20.8 18.2%
Free cash flow 186 122 52.5%
*before pension increase and one-off costs (see page 2)
Peter Bakker, CEO :
�Given the economic background, the results delivered by Mail and Express in the quarter are outstandingachievements. Although the earnings in Logistics are still depressed, underlying performance has beenstabilised. Good progress is being made by our new Managing Director Dave Kulik and his team with theimplementation of the TtS programme and the actions taken so far have started to provide tangible savings.Despite the one-offs in the quarter, which were in line with previous guidance, the achievement of a healthyimprovement in free cash flow is indicative of the underlying strength of the business and the focus ofmanagement on increasing shareholder value�.
Summary
Press release Q3 2003 Page 3 of 23
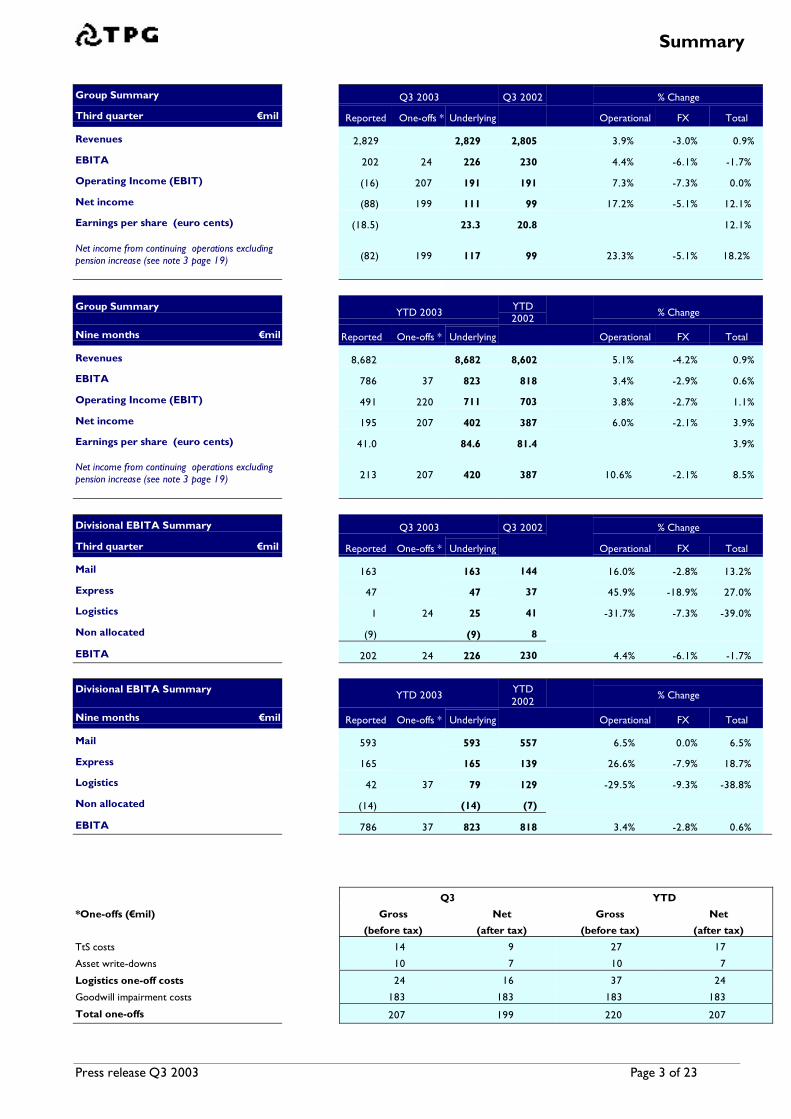
Group Summary Q3 2003 Q3 2002 % Change
Third quarter �mil Reported One-offs * Underlying Operational FX Total
Revenues 2,829 2,829 2,805 3.9% -3.0% 0.9%
EBITA 202 24 226 230 4.4% -6.1% -1.7%
Operating Income (EBIT) (16) 207 191 191 7.3% -7.3% 0.0%
Net income (88) 199 111 99 17.2% -5.1% 12.1%
Earnings per share (euro cents) (18.5) 23.3 20.8 12.1%
Net income from continuing operations excludingpension increase (see note 3 page 19) (82) 199 117 99 23.3% -5.1% 18.2%
Group SummaryYTD 2003
YTD2002
% Change
Nine months �mil Reported One-offs * Underlying Operational FX Total
Revenues 8,682 8,682 8,602 5.1% -4.2% 0.9%
EBITA 786 37 823 818 3.4% -2.9% 0.6%
Operating Income (EBIT) 491 220 711 703 3.8% -2.7% 1.1%
Net income 195 207 402 387 6.0% -2.1% 3.9%
Earnings per share (euro cents) 41.0 84.6 81.4 3.9%
Net income from continuing operations excludingpension increase (see note 3 page 19) 213 207 420 387 10.6% -2.1% 8.5%
Divisional EBITA Summary Q3 2003 Q3 2002 % Change
Third quarter �mil Reported One-offs * Underlying Operational FX Total
Mail 163 163 144 16.0% -2.8% 13.2%
Express 47 47 37 45.9% -18.9% 27.0%
Logistics 1 24 25 41 -31.7% -7.3% -39.0%
Non allocated (9) (9) 8
EBITA 202 24 226 230 4.4% -6.1% -1.7%
Divisional EBITA SummaryYTD 2003
YTD2002
% Change
Nine months �mil Reported One-offs * Underlying Operational FX Total
Mail 593 593 557 6.5% 0.0% 6.5%
Express 165 165 139 26.6% -7.9% 18.7%
Logistics 42 37 79 129 -29.5% -9.3% -38.8%
Non allocated (14) (14) (7)
EBITA 786 37 823 818 3.4% -2.8% 0.6%
Q3 YTD
*One-offs (�mil) Gross Net Gross Net
(before tax) (after tax) (before tax) (after tax)
TtS costs 14 9 27 17
Asset write-downs 10 7 10 7
Logistics one-off costs 24 16 37 24
Goodwill impairment costs 183 183 183 183
Total one-offs 207 199 220 207

Report by the Board of Management
Press release Q3 2003 Page 4 of 23
Third quarter group overview
A strong performance in the third quarter of 2003 hasagain demonstrated the overall resilience of the TPGbusiness model. The underlying economic conditions inthe quarter remained weak and the relative strength ofthe euro continues to adversely impact comparisons tothe previous year.
Group revenues increased by 0.9% to �2,829 million,equivalent to a growth of 3.9% at constant exchangerates. Mail and Express earnings continue to be strongand the execution of the Logistics transformation plan(TtS) is on track. �14 million of TtS one-off costs wereincurred in the quarter as well as a �10 million assetwrite-down.
Excluding the after tax impact of the Logistics one-offcosts and the goodwill impairment, net income increasedby 12.1%. Net income from continuing operations,excluding the one-offs and a year on year pensionincrease of �9 million, was 18.2% higher (23.3% atconstant exchange rates).
Strong free cash flow generation of �186 million in thequarter represents a 52% increase compared to the thirdquarter of last year and was fuelled by further workingcapital savings and tight controls over capitalexpenditure.
Review of operations
Mail continued to perform strongly in the third quarter,significantly increasing its earnings by 13.2%, despite anincrease in the rate of decline in Dutch volumescompared to the first half year and higher pension costs.The main driver of this is the continuing good progress inthe roll out of the Cost Flexibility programme, togetherwith ongoing productivity measures and tight costcontrol.
Express also had an excellent quarter with earningsincreasing by 27% and the operating margin rising to4.6% from 3.7% last year. On like for like exchange ratesthe earnings increase was over 45% and the third quartermargin was 5.1%. Revenue quality yields have now beenpositive for four full years and the very clear andpersistent focus provided by our Express strategycontinues to pay off.
Logistics operational performance has stabilised butcontinues to be affected by the three business unitsFrance, Italy non-automotive and Germany. The mainfocus in the third quarter was the implementation of theTtS programme and many of the required actions havenow been taken. Year to date, one-off costs of �27million have been incurred as part of TtS, including �14
million in the third quarter. Total TtS one-off costs arestill expected to be around �65 million, with most of theremaining cost actions expected in the final quarter ofthis year.
Financial Review
A goodwill impairment charge of �183 million and anasset write-down of �10 million were made in the thirdquarter. The sum of these two items (�193 million) is inline with the preliminary estimate announced at the halfyear stage. No further charges for goodwill impairmentor asset write-downs are anticipated. The impairmentsare in respect of France, Italy non-automotive, Germanyand the Nordics in Logistics and UK Data and DocumentManagement in Mail.
Net financial expense was some 25% lower than last yearmainly as a result of lower net debt and a higherproportion of variable rate debt. The underlyingeffective tax rate in the quarter improved to 33.9%compared to 37.5% last year, mainly due to a favourableEuropean ruling on the tax deductibility of interestexpense in respect of foreign subsidiaries.
Prospects
The Board of Management does not expect anysignificant change in underlying economic conditions inthe final quarter of the year and reiterates its previousoutlook statement for the full 2003 year : Growth in netincome from continuing operations, excluding additionalpension costs, one-off costs in Logistics and goodwillimpairment, is expected to be around 5% at constantrates of exchange.
Update of events in 3rd Quarter 2003 to date
August 28 Express adds Naples and Florence toEuropean air network
September 10 TPG Post obtains favourable courtdecision on the delivery of tax forms
September 18 Logistics contract with NACCO inEurope and North America announced
September 23 Acquisition of Full Service, an Italianprint and mail company
October 2 OPTA compliments TPG on servicequality and postal location policy
October 16 �600 million standby credit facilitysigned

Business Highlights - Mail
Press release Q3 2003 Page 5 of 23
� Very strong third quarter performance
� Improvement driven by Cost Flexibility and other efficiency savings
� Netherlands volumes decline higher than first half year
� Further positive developments in European Mail Networks
Summary Q3 2003 Q3 2002 % Change YTD 2003 YTD 2002 % Change
� mil � mil � mil � mil
Revenues 897 918 -2.3% 2,863 2,887 -0.8%
EBITA 163 144 13.2% 593 557 6.5%
Operating margin 18.2% 15.7% 20.7% 19.3%
Mail revenues fell by 2.3% in the third quarter mainlydue to lower revenues in the Netherlands and CrossBorder. Revenues from European Mail Networks andData & Document Management (Cendris) both grewsignificantly, partly through acquisitions.
Third quarter earnings increased by 13.2% to �163million and the operating margin improvedsignificantly from 15.7% last year to 18.2%. Theincrease in earnings is driven by Mail Netherlandstogether with continuing positive developments in theEuropean Mail Networks.
The main contributor to this excellent performance isthe Cost Flexibility programme in Mail Netherlandswhich delivered a further �16 million savings in thequarter. Year to date Cost Flexibility savings are now�52 million (cumulative �78 million from the start ofthe programme). Reduced sick leave, and lower costsof materials and services also contributed to theenhanced performance.
An additional �9 million in pension costs has beenabsorbed in the quarter compared to last year (�26million on a year to date basis).
The preliminary assessment of the quality of next daydelivery in the Netherlands in the quarter is 96.4%,well ahead of the government target of 95%.
Revenue Analysis
Third Quarter Q3 2003 Q3 2002 % Change Org% Acq% FX%
� mil � mil
Mail Netherlands 604 634 -4.7% -3.6% -1.1% 0.0%
Cross Border 142 155 -8.4% -5.8% 0.0% -2.6%
European Mail Networks 100 85 17.6% 14.1% 5.9% -2.4%
Data & Document Management 51 44 15.9% -4.5% 22.7% -2.3%
Mail 897 918 -2.3% -2.3% 0.8% -0.8%
Nine Months YTD 2003 YTD 2002 % Change Org% Acq% FX%
� mil � mil
Mail Netherlands 1,967 2,015 -2.4% -2.2% -0.2% 0.0%
Cross Border 447 474 -5.7% -1.9% 0.0% -3.8%
European Mail Networks 297 258 15.1% 10.8% 6.2% -1.9%
Data & Document Management 152 140 8.6% 0.7% 10.0% -2.1%
Mail 2,863 2,887 -0.8% -0.8% 0.9% -0.9%

Business Highlights - Mail
Press release Q3 2003 Page 6 of 23
Mail Netherlands revenues fell by 4.7% in thequarter. Organic revenues declined by 3.6% of which2.0% was caused by lower Post Office and otherrevenues. Domestic and direct mail revenuescombined had a 1.6% negative impact on MailNetherlands revenues with positive price and mixeffects only partially compensating for lowervolumes.
Total addressed mail volumes declined by 3.4% inthe quarter (a decline of 2.0% year to date). Thiscompares to a decline of 1.3% in the first half year.Domestic mail volumes fell by 1.3% (a fall of 0.3%year to date compared to a positive 0.1% in the firsthalf year) mainly due to a 2% decline in letterboxmail and lower parcels volumes. Direct mail volumesdeclined by 6.6% in the quarter ( a fall of 4.4% yearto date compared to a 3.4% fall in the first half year).Most of this decline is due to lower printed mattervolumes caused by cost saving programmes at keyaccounts.
Cross Border revenues fell by 8.4% in the quarter.Organic growth was a negative 5.8%, due to theSpring business where revenues were underpressure, particularly in Europe. Revenues from theTPG Post brand were stable.
European Mail Networks again had strongrevenue growth with total revenues increasing by17.6% in the quarter. The organic growth rate was14.1% with most countries showing good organicgrowth, especially Italy and the UK. Acquisitions inthe current year, including Full Service in Italy andFischer and Blitzpunkt in Germany, added a further5.9% to revenue growth.
Data & Document Management revenuesincreased by 15.9% in the quarter. Acquisitions ofDocVision in the Netherlands earlier this year andDimar in the Czech Republic at the end of last yearcontributed a 22.7% growth in revenues. Organicgrowth was under pressure in the quarter mainly dueto the economic climate which has caused many ofour customers to focus on reducing costs and hasalso resulted in long lead times for attracting newcustomers.
Business Highlights - Express
Press release Q3 2003 Page 7 of 23
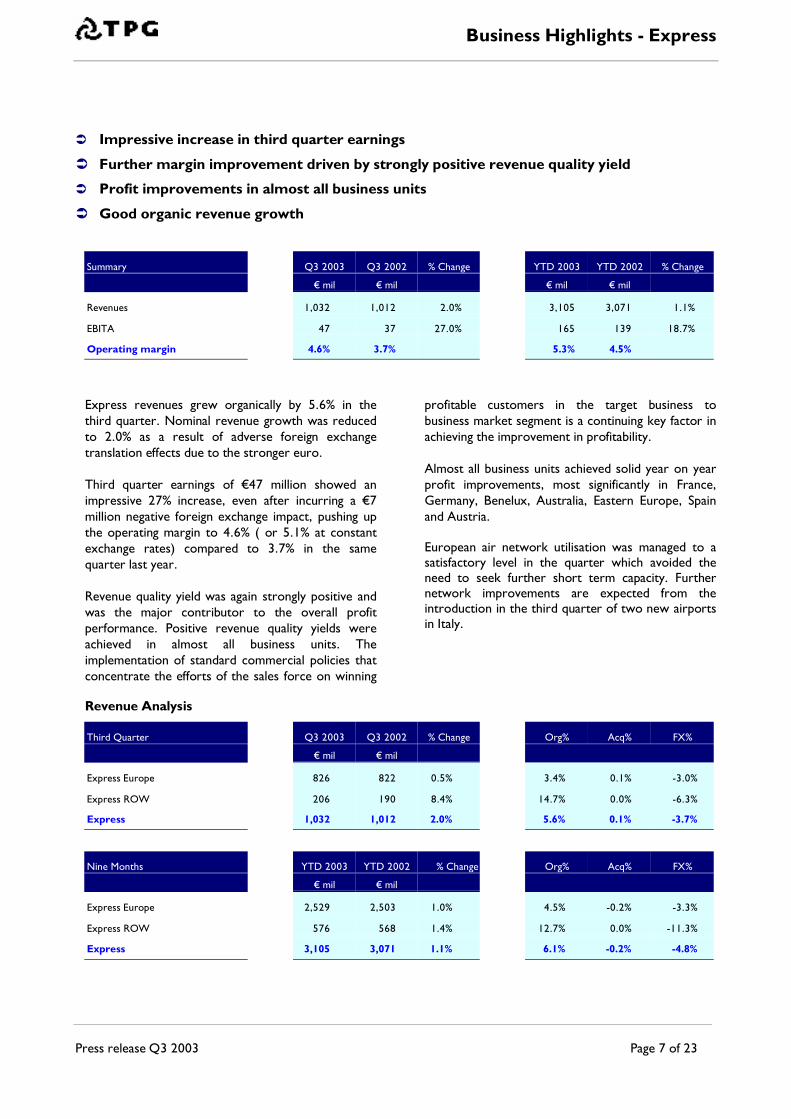
� Impressive increase in third quarter earnings
� Further margin improvement driven by strongly positive revenue quality yield
� Profit improvements in almost all business units
� Good organic revenue growth
Summary Q3 2003 Q3 2002 % Change YTD 2003 YTD 2002 % Change
� mil � mil � mil � mil
Revenues 1,032 1,012 2.0% 3,105 3,071 1.1%
EBITA 47 37 27.0% 165 139 18.7%
Operating margin 4.6% 3.7% 5.3% 4.5%
Express revenues grew organically by 5.6% in thethird quarter. Nominal revenue growth was reducedto 2.0% as a result of adverse foreign exchangetranslation effects due to the stronger euro.
Third quarter earnings of �47 million showed animpressive 27% increase, even after incurring a �7million negative foreign exchange impact, pushing upthe operating margin to 4.6% ( or 5.1% at constantexchange rates) compared to 3.7% in the samequarter last year.
Revenue quality yield was again strongly positive andwas the major contributor to the overall profitperformance. Positive revenue quality yields wereachieved in almost all business units. Theimplementation of standard commercial policies thatconcentrate the efforts of the sales force on winning
profitable customers in the target business tobusiness market segment is a continuing key factor inachieving the improvement in profitability.
Almost all business units achieved solid year on yearprofit improvements, most significantly in France,Germany, Benelux, Australia, Eastern Europe, Spainand Austria.
European air network utilisation was managed to asatisfactory level in the quarter which avoided theneed to seek further short term capacity. Furthernetwork improvements are expected from theintroduction in the third quarter of two new airportsin Italy.
Revenue Analysis
Third Quarter Q3 2003 Q3 2002 % Change Org% Acq% FX%
� mil � mil
Express Europe 826 822 0.5% 3.4% 0.1% -3.0%
Express ROW 206 190 8.4% 14.7% 0.0% -6.3%
Express 1,032 1,012 2.0% 5.6% 0.1% -3.7%
Nine Months YTD 2003 YTD 2002 % Change Org% Acq% FX%
� mil � mil
Express Europe 2,529 2,503 1.0% 4.5% -0.2% -3.3%
Express ROW 576 568 1.4% 12.7% 0.0% -11.3%
Express 3,105 3,071 1.1% 6.1% -0.2% -4.8%

Business Highlights - Express
Press release Q3 2003 Page 8 of 23
Organic revenue growth in Europe was 3.4% in thethird quarter although this was offset by a 3.0%adverse foreign exchange impact. Total core kiloscarried increased by 5.1% compared to the samequarter last year with core consignments growing by2.5%. Revenue quality yield was again stronglypositive at 2.8%.
In terms of the bigger countries, increased volumeswere seen in Germany and the UK although thevolume of consignments carried in France, Beneluxand Italy fell, partly due to a continued economicslowdown but also as a result of a strong focus onuprating or discarding lower yielding customers.
Revenues in the Rest of the World increased by8.4%, with organic revenue growth an impressive14.7%, fuelled by strong growth in Australia, Asia andthe Middle East.

Business Highlights - Logistics
Press release Q3 2003 Page 9 of 23
� Operational performance stabilised
� Implementation of TtS actions on track: further one-off costs booked in the quarter
� Majority of operational shortfall caused by three problem business units
� Good organic revenue growth and stable pipeline
Summary Q3 2003 Q3 2002 % Change YTD 2003 YTD 2002 % Change
� mil � mil � mil � mil
Revenues 909 882 3.1% 2,738 2,663 2.8%
EBITA 1 41 -97.6% 42 129 -67.4%
Operating margin 0.1% 4.6% 1.5% 4.8%
Operating margin excl one-off costs 2.8% 4.6% 2.9% 4.8%
Logistics revenues increased organically by 7.5% inthe third quarter. An adverse foreign exchangetranslation impact of 4.4% reduced nominal revenuegrowth to 3.1%.
Earnings in the quarter were significantly affected bythe incidence of �24 million of one-off charges. Costsof �14 million were incurred in respect of specificactions taken in the quarter to implement theTransformation through Standardisation (TtS)programme. These costs related to warehouseclosures, contract terminations and overheadrestructuring. In addition, a write down of assets of�10 million was booked in the quarter as aconsequence of the goodwill impairment review.Total one-off costs incurred so far this year are �37million, consisting of �27 million costs under the TtSprogramme and �10 million asset write downs.
Underlying third quarter earnings, excluding theseone-off costs, were �25 million, equivalent to anoperating margin of 2.8%. Eliminating the adverseimpact of foreign exchange rate translation (�3million) results in an operating margin of 3.0% atconstant rates compared to 4.6% in the same quarterlast year.
Most business units continue to be affected by lowvolumes as a result of the continuing weak economicclimate especially in Europe. The majority of theoperational shortfall in earnings in the third quarterhowever were again attributable to France, Italy non-automotive and Germany. Earnings in France and Italynon-automotive have fallen year on year mainly dueto operational difficulties on various contracts andincreased overheads which could not be completelypassed on to the customer. Despite good revenuegrowth in Germany from new contracts, earnings inthat country have also declined partly due to lowervolumes in the Innight business which has a relativelyhigh fixed cost base. All of these operational issuesare being addressed by the TtS plan.
The adverse impact from these three business unitshas been offset to some extent by continuing goodperformances in other countries, particularly the UKand North America, through good commercialmanagement and cost controls.

Business Highlights - Logistics
Press release Q3 2003 Page 10 of 23
Revenue Analysis
Third Quarter Q3 2003 Q3 2002 % Change Org% Acq% FX%
� mil � mil
Logistics Europe 678 659 2.9% 5.6% 0.0% -2.7%
Logistics North America 154 155 -0.6% 9.7% 0.0% -10.3%
Logistics ROW 77 68 13.2% 20.6% 0.0% -7.4%
Logistics 909 882 3.1% 7.5% 0.0% -4.4%
Nine Months YTD 2003 YTD 2002 % Change Org% Acq% FX%
� mil � mil
Logistics Europe 2,038 1,936 5.3% 4.2% 3.9% -2.8%
Logistics North America 483 537 -10.1% 8.7% -2.8% -16.0%
Logistics ROW 217 190 14.2% 37.9% 0.0% -23.7%
Logistics 2,738 2,663 2.8% 7.4% 2.3% -6.9%
The net organic revenue growth of 7.5% achieved inthe third quarter came from new contracts (+12.3%)and a positive volume and price impact (+0.8%),offset by terminated contracts (-5.6%).
New contract wins in the third quarter have anannualised revenue of �110 million. Contractrenewals provided further annualised revenues of�65 million. Contract terminations amounted toannualised revenues of �41 million. The businessdevelopment pipeline remains at �1.4 billion with thehigher certainty portion stable at around �200million.
Organic growth in Europe was a healthy 5.6% fuelledby recent new contract wins and the commencementof the sole operator project at Fiat in Italy.
North America organic revenue growth was 9.7%again mainly due to the impact of new contracts.
In the Rest of the World, organic revenues grew by20.6%. with particularly high growth achieved in Asiaand South America.
.

Quarterly information � Group
Press release Q3 2003 Page 11 of 23
Euro Million Q3 2003 Q2 2003 Q1 2003 Q4 2002 Q3 2002 Q2 2002 Q1 2002 Q4 2001 Q3 2001 Q2 2001 Q1 2001
Group
Revenues 2,829 2,936 2,917 3,180 2,805 2,899 2,898 3,013 2,642 2,787 2,776
Earnings from operations 211 299 290 382 222 305 298 363 210 278 277
Non-allocated items (9) (7) 2 12 8 (10) (5) (41) 4 (22) 87
EBITA 202 292 292 394 230 295 293 322 214 256 364
Goodwill amortisation (218) (39) (38) (39) (39) (38) (38) (37) (34) (35) (33)
Operating Income (EBIT) (16) 253 254 355 191 257 255 285 180 221 331
Financial income andexpenses (23) (23) (24) (25) (31) (25) (27) (8) (29) (26) (30)
Income taxes (49) (84) (87) (115) (60) (81) (85) (104) (56) (70) (105)
Results from affiliates (1) (3) (1) (1) (1) (3) (1) 2 (2)
Minority interests 1 (2) (2) (3) (3)
Net Income (88) 143 140 212 99 145 143 169 97 123 196
Net profit on sale of non-core business (14) 3 (5) (28)
Net Income fromcontinuing operations (88) 143 140 198 99 145 143 172 97 118 168
Average number of shares(mil) 475.1 475.1 475.0 475.0 475.0 475.0 475.0 475.0 475.0 478.0 475.3Earnings per share (eurocents) (18.5) 30.1 29.5 44.6 20.8 30.5 30.1 35.6 20.4 25.9 41.2
Net cash provided byoperating activities 277 74 324 227 214 337 254 256 161 34 322
Capital expenditure onproperty, plant andequipment and otherintangible assets (94) (72) (60) (152) (111) (130) (79) (147) (155) (114) (65)
Disposals of property, plantand equipment and otherintangible assets 3 14 17 23 19 16 5 21 36 27 7
Free cash flow 186 16 281 98 122 223 180 130 42 (53) 264
Number of employees 161,079 160,536 150,155 150,365 148,285 143,097 141,463 138,563 139,065 135,539 131,426Full time equivalentemployees 120,387 119,946 114,348 113,444 113,711 112,751 112,261 109,589 111,976 106,782 103,270

Quarterly Information - Mail
Press release Q3 2003 Page 12 of 23
Euro Million Q3 2003 Q2 2003 Q1 2003 Q4 2002 Q3 2002 Q2 2002 Q1 2002 Q4 2001 Q3 2001 Q2 2001 Q1 2001
Mail Netherlands
Revenues 604 663 700 780 634 666 715 801 624 657 688Growth % -4.7% -0.5% -2.1% -2.6% 1.6% 1.4% 3.9% 3.9% 4.5% 0.0% 1.5%Organic -3.6% -1.0% -2.1% -2.6% 1.6% 1.4% 3.9% 3.9% 4.5% 0.0% 1.5%Acquisition -1.1% 0.5% 0.0% 0.0% 0.0% 0.0% 0.0% 0.0% 0.0% 0.0% 0.0%Fx 0.0% 0.0% 0.0% 0.0% 0.0% 0.0% 0.0% 0.0% 0.0% 0.0% 0.0%
Addressed mail pieces (mil) 1,160 1,297 1,411 1,575 1,201 1,333 1,412 1,618 1,225 1,328 1,393Working days 65 61 64 63 65 61 64 63 65 61 64
Cross Border
Revenues 142 148 157 176 155 157 162 178 157 158 161Growth % -8.4% -5.7% -3.1% -1.1% -1.3% -0.6% 0.6% 4.1% 1.3% -2.5% -3.0%Organic -5.8% -1.9% 1.8% 1.1% 0.6% -1.8% -4.5% 2.8% -0.6% -1.4% -4.1%Acquisition 0.0% 0.0% 0.0% 0.0% 0.0% 3.7% 3.9% -0.6% 3.2% 0.0% 0.0%Fx -2.6% -3.8% -4.9% -2.2% -1.9% -2.5% 1.2% 1.9% -1.3% -1.1% 1.1%
European Mail Networks
Revenues 100 105 92 100 85 88 85 96 74 78 57Growth % 17.6% 19.3% 8.2% 4.2% 14.9% 12.8% 49.1% 45.5% 42.3% 39.3% 3.6%Organic 14.1% 12.5% 5.9% 8.4% -1.3% 3.2% 16.9% 0.2% 0.2% 8.6% -5.5%Acquisition 5.9% 9.1% 3.5% -4.2% 16.2% 10.1% 31.8% 45.8% 43.2% 30.7% 9.1%Fx -2.4% -2.3% -1.2% 0.0% 0.0% -0.5% 0.4% -0.5% -1.2% 0.0% 0.0%
Data & Doc Management
Revenues 51 51 50 62 44 48 48 48 45 42 32Growth % 15.9 6.3% 4.2% 29.2% -2.2% 14.3% 50.0% 71.4% 60.7% 23.5% 6.7%Organic -4.5% 0.1% 6.3% 6.3% -6.6% 1.0% 8.1% 34.6% 14.3% -1.0% 6.7%Acquisition 22.7% 8.3% 0.0% 25.0% 4.4% 13.3% 41.9% 36.8% 46.4% 24.5% 0.0%Fx -2.3% -2.1% -2.1% -2.1% 0.0% 0.0% 0.0% 0.0% 0.0% 0.0% 0.0%
Total Mail
Revenues 897 967 999 1,118 918 959 1,010 1,123 900 935 938Growth % -2.3% 0.8% -1.1% -0.4% 2.0% 2.6% 7.7% 8.4% 8.2% 2.9% 1.0%Organic -2.3% 0.2% -0.4% -0.7% 0.7% 1.0% 3.5% 4.3% 4.0% 0.3% 0.3%Acquisition 0.8% 1.6% 0.3% 0.7% 1.6% 2.1% 4.0% 3.8% 4.9% 2.8% 0.5%Fx -0.8% -1.0% -1.0% -0.4% -0.3% -0.5% 0.2% 0.3% -0.7% -0.2% 0.2%
EBITA 163 212 218 247 144 195 218 240 144 189 208
Operating margin 18.2% 21.9% 21.8% 22.1% 15.7% 20.3% 21.6% 21.4% 16.0% 20.2% 22.2%
Goodwill amortisation (28) (10) (7) (9) (6) (8) (7) (6) (4) (5) (4)Operating income (EBIT) 135 202 211 238 138 187 211 234 140 184 204

Quarterly Information � Express
Press release Q3 2003 Page 13 of 23
Euro Million Q3 2003 Q2 2003 Q1 2003 Q4 2002 Q3 2002 Q2 2002 Q1 2002 Q4 2001 Q3 2001 Q2 2001 Q1 2001
Express
Express Europe
Revenues 826 847 856 899 822 845 836 825 747 780 783Growth % 0.5% 0.2% 2.4% 9.0% 10.0% 8.3% 6.8% -2.5% 1.4% 3.2% 5.5%Organic 3.4% 3.8% 6.3% 8.4% 7.3% 7.7% 2.8% -2.2% 3.5% 4.1% 5.8%Acquisition 0.1% -0.2% -0.5% 1.8% 2.8% 1.9% 3.0% -0.1% -1.1% -1.3% 0.6%Fx -3.0% -3.4% -3.4% -1.2% -0.1% -1.3% 1.0% -0.2% -1.0% 0.4% -0.9%
Core consignments (mil) 31.0 33.7 33.8 35.2 30.2 33.8 32.9 33.0 28.8 31.6 32.0Core kilos (mil) 519.5 527.3 523.3 566.4 494.3 522.5 519.8 550.2 487.3 505.8 521.8Core revenue quality yield 2.8% 4.5% 3.3% 4.3% 2.8% 2.4% 2.0% 2.2% 2.8% 5.7% 7.5%improvement
Express ROW
Revenues 206 189 181 205 190 195 183 195 192 198 186Growth % 8.4% -3.1% -1.1% 5.1% -1.0% -1.5% -1.6% -11.8% -13.1% -3.4% -4.6%Organic 14.7% 10.3% 13.3% 14.9% 7.4% 5.0% -4.8% -7.1% -4.6% 1.2% 1.0%Acquisition 0.0% 0.0% 0.0% 0.0% 0.5% 0.0% 0.5% 0.1% 0.2% 0.0% 0.0%Fx -6.3% -13.4% -14.4% -9.8% -8.9% -6.5% 2.7% -4.8% -8.7% -4.6% -5.6%
Total Express
Revenues 1,032 1,036 1,037 1,104 1,012 1,040 1,019 1,020 939 978 969Growth % 2.0% -0.4% 1.8% 8.2% 7.8% 6.3% 5.2% -4.4% -2.0% 1.8% 3.4%Organic 5.6% 5.1% 7.6% 9.4% 7.2% 7.1% 1.4% -3.2% 1.6% 3.4% 4.8%Acquisition 0.1% -0.2% -0.4% 1.6% 2.4% 1.5% 2.5% -0.1% -0.9% -1.0% 0.5%Fx -3.7% -5.3% -5.4% -2.8% -1.8% -2.3% 1.3% -1.1% -2.7% -0.6% -1.9%
Working days 65 60 63 62 65 61 62 62 65 60 63
EB1TA 47 66 52 107 37 61 41 69 19 35 34
Operating margin 4.6% 6.4% 5.0% 9.7% 3.7% 5.9% 4.0% 6.8% 2.0% 3.6% 3.5%
Goodwill amortisation (13) (13) (13) (13) (14) (13) (12) (12) (14) (12) (13)Operating Income (EBIT) 34 53 39 94 23 48 29 57 5 23 21

Quarterly Information � Logistics
Press release Q3 2003 Page 14 of 23
Euro Million Q3 2003 Q2 2003 Q1 2003 Q4 2002 Q3 2002 Q2 2002 Q1 2002 Q4 2001 Q3 2001 Q2 2001 Q1 2001
Logistics
Logistics EuropeRevenues 678 703 657 707 659 651 626Growth % 2.9% 8.0% 5.0% 19.4% 26.5% 18.8% 32.6%Organic 5.6% 6.3% 0.5% 3.7% 4.1% 6.0% 19.3%Acquisition 0.0% 4.3% 7.5% 8.6% 11.3% 4.4% 0.4%Fx -2.7% -2.6% -3.0% 7.1% 11.1% 8.4% 12.9%
Logistics NorthAmericaRevenues 154 166 163 168 155 192 190Growth % -0.6% -13.5% -14.2% -5.6% -11.9% -9.9% -5.0%Organic -3.7% 11.5% 5.3% 6.2% -3.4% -1.9% -9.5%Acquisition 0.0% -7.8% 0.0% 0.0% 0.0% 0.0% 0.0%Fx -10.3% -17.2% -19.5% -11.8% -8.5% -8.0% 4.5%
Logistics ROWRevenues 77 75 65 72 68 65 57Growth % 13.2% 15.4% 14.0% 24.1% 21.4% 6.6% 14.0%Organic 20.6% 41.5% 54.4% 53.4% 44.6% 18.0% 18.0%Acquisition 0.0% 0.0% 0.0% 0.0% 0.0% 0.0% 0.0%Fx -7.4% -26.1% -40.4% -29.3% -23.2% -11.4% -4.0%
Total LogisticsRevenues 909 944 885 947 882 908 873 885 814 878 778Growth % 3.1% 4.0% 1.4% 7.0% 8.4% 3.4% 12.2% 9.8% 39.4% 72.7% 62.8%Organic 7.5% 9.9% 5.0% 7.7% 6.1% 0.6% 3.3% 1.9% 6.8% 11.5% 11.2%Acquisition 0.0% 1.4% 5.4% 4.8% 6.3% 6.9% 7.1% 7.7% 36.2% 61.5% 53.6%Fx -4.4% -7.3% -9.0% -5.5% -4.0% -4.1% 1.8% 0.2% -3.6% -0.3% -2.0%
Revenues by sector:Automotive 345 345 336 347 316 356 361Tyres 50 43 58 68 58 47 46FMCG 156 163 151 195 179 150 131Hi-tech electronics 126 117 119 125 103 109 109Publishing / media 65 48 56 66 57 57 56Other 167 228 165 146 169 189 170
EB1TA 1 21 20 28 41 49 39 55 46 53 36
Operating margin 0.1% 2.2% 2.3% 3.0% 4.6% 5.4% 4.5% 6.2% 5.7% 6.0% 4.6%
Goodwill amortisation (177) (17) (17) (18) (17) (18) (19) (18) (17) (18) (16)Operating Income (EBIT) (176) 4 3 10 24 31 20 37 29 35 20

Consolidated statements of income
Press release Q3 2003 Page 15 of 23
Q3 2003
� mil
Q3 2002
� mil
YTD 2003
� mil
YTD 2002
� mil
Net sales 2,811 2,777 8,622 8,525
Other operating revenues 18 28 60 77
Total operating revenues 2,829 2,805 8,682 8,602
Cost of materials (119) (133) (390) (382)
Work contracted out and other external expenses (1,218) (1,165) (3,637) (3,559)
Salaries and social security contributions (1,048) (971) (3,093) (2,994)
Depreciation, amortisation and impairments (327) (119) (573) (355)
Other operating expenses (133) (226) (498) (609)
Total operating expenses (2,845) (2,614) (8,191) (7,899)
Operating income (16) 191 491 703
Interest and similar income 5 3 13 24
Interest and similar expenses (28) (34) (83) (107)
Financial income and expenses (23) (31) (70) (83)
Income before income taxes (39) 160 421 620
Income taxes (49) (60) (220) (226)
Results from investments in affiliated companies (1) (1) (5) (4)
Net income before minority interests (89) 99 196 390
Minority Interests 1 0 (1) (3)
Net income (88) 99 195 387
Net income per ordinary share and per ADS ¹ (in euro cents) (18.5) 20.8 41.0 81.5
¹Based on the average amount of 475.1 million ordinary shares, including ADS (2002: 475.0 million).

Consolidated cash flow statements
Press release Q3 2003 Page 16 of 23
Before proposed appropriation of net income
Q3 2003� mil
Q3 2002*� mil
YTD 2003� mil
YTD 2002*� mil
Net income (88) 99 195 387
Depreciation, amortisation and impairments 327 119 573 355
Changes in working capital:
-inventory 3 (3) 3 (5)
-accounts receivable 162 97 123 244
-other current assets (38) (25) (75) (127)
-trade payables (56) (52) (15) 21
-current liabilities excl.short term financing (19) 14 (61) 12
Changes in provisions 9 12 (4) 25
Changes in pensions (58) (47) (167) (118)
Changes in deferred taxes 35 0 103 11
Net cash provided by operating activities 277 214 675 805
Acquisition of group companies (16) (13) (43) (118)
Disposals of group companies 0 0 6 4
Acquisition of affiliated companies (4) (3) (12) (10)
Disposals of affiliated companies 0 2 1 26
Capital expenditure on other intangibles (8) (18) (19) (18)
Disposals of intangibles (6) 1 3 2
Capital expenditure on property, plant & equipment (86) (93) (207) (302)
Disposals of property, plant and equipment 9 19 31 40
Changes in financial fixed assets 11 9 (8) (3)
Changes in minority interests 6 0 6 2
Net cash used in investing activities (94) (96) (242) (377)
Changes in shareholders� equity (87) (70) (207) (185)
Long-term liabilities acquired 2 20 58 30
Long-term liabilities repaid (10) (18) (44) (69)
Changes in short-term bank debt (15) (62) (76) (363)
Net cash provided by financing activities (110) (130) (269) (587)
Changes in cash and cash equivalents 73 (12) 164 (159)
Cash and cash equivalents at beginning of period 437 292 357 451
Exchange differences on cash items 1 (1) (6) (14)Cash and cash equivalents from acquisition and disposal of groupcompanies
0 6 (4) 7
Change in cash and cash equivalents 73 (12) 164 (159)
Cash and cash equivalents at end of period 511 285 511 285
*Reclassifications have been made to increase comparability withcurrent year presentation of other intangible assets separate fromproperty, plant and equipment.

Consolidated balance sheets
Press release Q3 2003 Page 17 of 23
Before proposed appropriation of net income
At 30 Sept2003� mil
At 31 Dec2002� mil
ASSETS
Fixed assets
Goodwill 2,365 2,668
Other intangible assets 93 98
Total intangible assets 2,458 2,766
Land & buildings 983 996
Plant & equipment 482 500
Other property, plant & equipment 497 567
Construction in progress 53 67
Total property, plant and equipment 2,015 2,130
Investments in affiliated companies 98 95
Loans receivable from affiliated companies 1 2
Other loans receivable 131 96
Repayments & accrued income 443 484
Total financial fixed assets 673 677
Total fixed assets 5,146 5,573
Current assets
Inventory 52 56
Accounts receivable 1,826 1,922
Prepayments and accrued income 432 358
Cash and cash equivalents 511 357
Total current assets 2,821 2,693
Total assets 7,967 8,266
LIABILITIES AND GROUP EQUITY
Group equity
Shareholders� equity 2,892 2,961
Minority interests 19 18
Total group equity 2,911 2,979
Provisions
Retirement schemes 25 35
Deferred tax liabilities 129 133
Other provisions 135 126
Total provisions 289 294
Pension liabilities 575 742
Long term liabilities
Long term debt 1,512 1,523
Accrued liabilities 194 138
Total long term liabilities 1,706 1,661
Current liabilities
Trade accounts payable 690 673
State loans 72 72
Other current liabilities 606 702
Accrued current liabilities 1,118 1,143
Total current liabilities 2,486 2,590
Total liabilities and group equity 7,967 8,266

Additional information
Press release Q3 2003 Page 18 of 23
Divisional Summary
Third quarter� mil
EBITA
Q3 2003� mil
Goodwillamortisation
� milOperating
income
� milEBITA
Q3 2002� mil
Goodwillamortisation
� milOperating
income
Mail 163 (28) 135 144 (6) 138
Express 47 (13) 34 37 (14) 23
Logistics 1 (177) (176) 41 (17) 24
211 (218) (7) 222 (37) 185
Non-allocated items (9) 0 (9) 8 (2) 6
202 (218) (16) 230 (39) 191
Nine months� mil
EBITA
YTD2003� mil
Goodwillamortisation
� milOperating
income
� milEBITA
YTD 2002� mil
Goodwillamortisation
� milOperating
income
Mail 593 (45) 548 557 (21) 536
Express 165 (39) 126 139 (39) 100
Logistics 42 (211) (169) 129 (55) 74
800 (295) 505 825 (115) 710
Non-allocated items (14) 0 (14) (7) 0 (7)
786 (295) 491 818 (115) 703
Capital expenditure on property, plant and equipment and other intangible assets
Q3 2003
� mil
Q3 2002
� mil
YTD 2003
� mil
YTD 2002
� mil
Mail 22 28 61 79
Express 46 41 105 123
Logistics 24 42 56 118
Corporate 2 0 4 0
Total 94 111 226 320
Movement in shareholders� equity
YTD 2003� mil
YTD 2002� mil
Opening balance at 1 January 2,961 2,600
Net income for the period 195 387
Foreign exchange effects (56) (22)
Cash dividend (208) (185)
Balance at 30 September 2,892 2,780

US GAAP Statement
Press release Q3 2003 Page 19 of 23
Net Income
YTD 2003� mil
YTD 2002� mil
Net income under Dutch GAAP 195 387
Adjustments for:
Employment schemes & group reorganisation (10) (9)
Stock based compensation expense (2) 0
Goodwill amortisation 113 113
Goodwill impairment (159) 0
Depreciation on restoration of previously recognisedimpairments
3 3
Depreciation of capitalised software 0 (6)
Financial instruments 4 (15)
Long term contract incentive payments 1 0
Pension curtailment gain 0 2
Real estate sale (3) 0
Tax effect of adjustments 51 8
Net Income under US GAAP 193 483
Net income per ordinary share and per ADS 1 (in Eurocents)
40.6 101.7
¹Based on the average amount of 475.1 million ordinary shares, including ADS (2002: 475.0 million)
Shareholders� Equity
YTD 2003� mil
YTD 2002� mil
Shareholders� equity under Dutch GAAP 2,892 2,780
Adjustments for:
Employment schemes & group reorganisation 142 155
Stock based compensation (3) 0
Goodwill 44 50
Other intangible assets (2) 0
Financial instruments (6) (26)
Real estate sale (19) 0
Sale and leaseback transaction (4) 0
Restoration of previously recognised impairments, net ofdepreciation
(8) (12)
Long-term contract incentive payment (5) 0
Capitalised software 0 4
Pension curtailment gain 2 2
Deferred taxes on adjustments 15 (46)
Shareholders� equity under US GAAP 3,048 2,907

Notes to the Financial Statements
Press release Q3 2003 Page 20 of 23
1. Accounting policies
Accounting policies have remained unchanged in the nine months to 30 September 2003.
2. Restatement of prior year numbers
The prior year numbers of Express and Logistics have been restated for consistency to reflect the transfer of the In-night business from Express to Logistics at the beginning of 2003.
Prior year revenues for Mail lines of business have been restated to reflect a more accurate elimination of internaltransactions.
In accordance with the Dutch Council for Annual Reporting directive RJ160 , prior year shareholders� equity has beenrestated to reflect that the appropriation of results for the year be recorded as a dividend upon shareholder approvaland not upon declaration by management.
3. Increase in pension costs
An additional gross pension cost of �37 million (�24 million net of tax) will be charged in the income statement in2003 compared to the previous year in respect of defined benefit schemes. As a result of this, net income excludingpension increase will be separately identified in 2003. Additional pension costs charged in the income statementcompared to the previous year are as follows:
Q3 YTDGross
(before tax)
� mil
Net
(after tax)
� mil
Gross
(before tax)
� mil
Net
(after tax)
� mil
Pension costs in 2003 11 7 32 20
Pension costs in 2002 (2) (1) (4) (2)
Increase in pension costs 9 6 28 18
4. Composition of the Group
There have been no material changes in the composition of the Group during the nine months to 30 September 2003.
5. Employees
Total number of employees at 30 September 2003 was 161,079 compared to 150,365 at 31 December 2002.
6. Net debt
At 30 Sept
2003
� mil
At 31 Dec
2002
� mil
Short term debt 191 238
Long term debt 1,512 1,523
Total interest bearing debt 1,703 1,761
Cash and cash equivalents (511) (357)
Net debt 1,192 1,404
Financial Calendar
Press release Q3 2003 Page 21 of 23
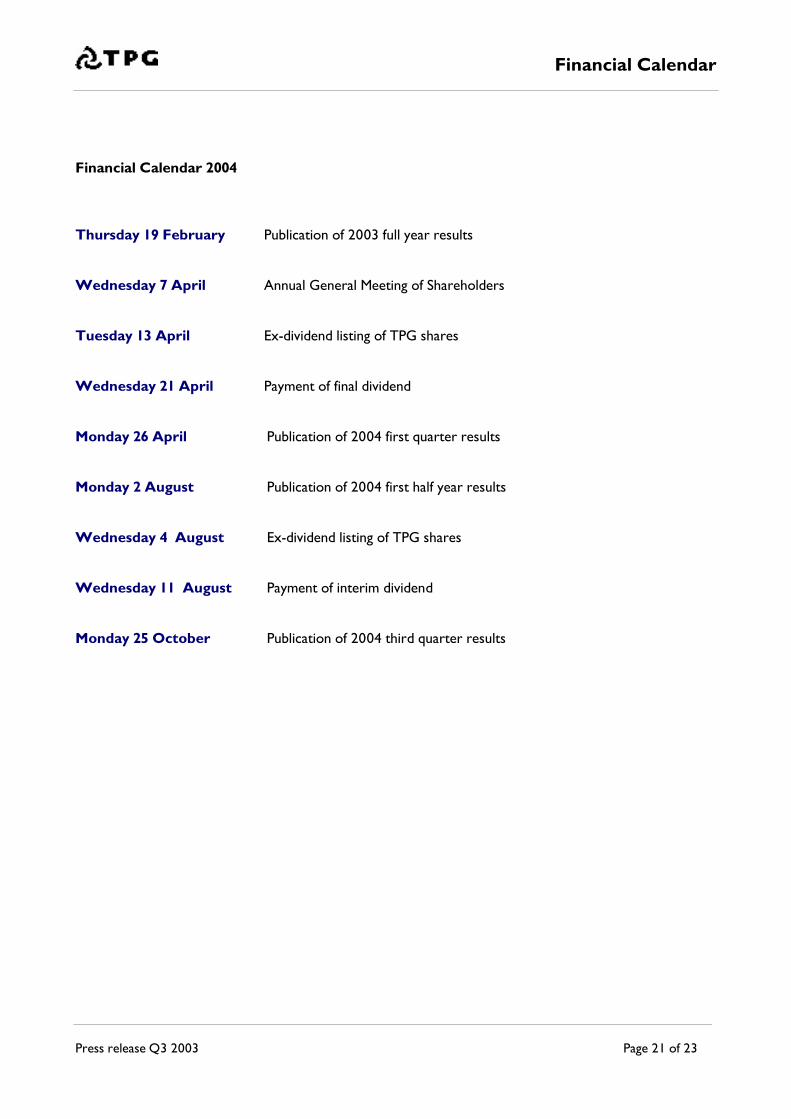
Financial Calendar 2004
Thursday 19 February Publication of 2003 full year results
Wednesday 7 April Annual General Meeting of Shareholders
Tuesday 13 April Ex-dividend listing of TPG shares
Wednesday 21 April Payment of final dividend
Monday 26 April Publication of 2004 first quarter results
Monday 2 August Publication of 2004 first half year results
Wednesday 4 August Ex-dividend listing of TPG shares
Wednesday 11 August Payment of interim dividend
Monday 25 October Publication of 2004 third quarter results

Contact Information
Press release Q3 2003 Page 22 of 23
Jon DowningDirector of Investor RelationsContact:Phone +31 20 500 62 41Fax +31 20 500 75 15Email [email protected]
Emilie de WeertManager of Investor RelationsContact:Phone +31 20 500 62 42Fax +31 20 500 75 15Email [email protected]
Tanno MassarDirector of Media RelationsContact:Phone +31 20 500 61 71Fax +31 20 500 75 20Email [email protected]
Published by:
TPG N.V.
Neptunusstraat 41-63
2132 JA Hoofddorp
P.O. Box 13000
1100 KG Amsterdam
Phone +31 20 500 60 00Fax +31 20 500 70 00Email [email protected]
Internet www.tpg.com
Responsible for content and editing:
TPG Investor Relations

Safe Harbour Statement
Press release Q3 2003 Page 23 of 23
Forward-looking statements warning - Safe Harbour Statement underthe US Private Securities Litigation Reform Act of 1995
Except for historical statements and discussions, statements contained in this press release are forward-lookingstatements. Forward-looking statements generally can be identified by the use of terms such as "ambition", "may","will", "expect", "intend", "anticipate", "believe", "plan", "seek", "estimate", "continue" or similar terms. By their nature,forward-looking statements involve risk and uncertainty because they relate to events and depend on circumstancesthat will occur in the future. These forward-looking statements involve known and unknown risks, uncertainties andother factors, many of which are outside of our control, that may cause actual results to differ materially from anyfuture results expressed or implied in the forward-looking statements. These forward-looking statements are based oncurrent expectations, estimates, forecasts, projections about the industries in which TPG operates, management'sbeliefs and assumptions made by management about future events. In addition to the assumptions specificallymentioned in this press release, there are a number of other factors that could cause actual results and developmentsto differ materially from those expressed or implied by these forward-looking statements. These factors include, butare not limited to: substitution of alternative methods for delivering information for TPG's Mail and Express services;regulatory developments and changes, including with respect to the levels of tariffs, the scope of mandatory andreserved services, quality standard, liberalisation in the Dutch and European postal markets and the outcome ofpending regulatory proceedings; competition in the mail, express and logistics businesses; decisions of competitionauthorities regarding proposed joint ventures or acquisitions; costs of complying with governmental regulations;general economic conditions, government and regulatory policies and business conditions in the markets served by us,including adverse effects of terrorist attacks, anthrax incidents, war or the outbreak of hostilities; higher costs ofinsurance coverage for future claims caused by acts of war, terrorism, sabotage, hijacking or other similar perils; theeffect of the current economic downturn and other risks and trends in the world economy and the timing, speed andmagnitude of any economic recovery; our ability to achieve cost savings and realise productivity improvements and thesuccess of investments, joint ventures and alliances; fluctuations in fuel costs; TPG's ability to increase our fuelsurcharge in response to rising fuel prices due to competitive pressures; changes in currency and interest rates;increased price transparency resulting from the adoption of the euro; changes in TPG's credit rating and their impacton TPG's financing costs and requirements; changes in TPG's relationship with the State of the Netherlands;disruptions at key sites; incidents resulting from the transport of hazardous materials; mismatches between TPG'sinvestment in infrastructure (aircraft, depots and trucks) and our actual capacity needs; strikes, work stoppages andwork slowdowns and increases in employee costs; costs of completing acquisitions or divestitures and integratingnewly acquired businesses; changes to the international conventions regarding the limitation of liability for the carriageof goods; significant changes in the volumes of shipments transported through our network, the mix of servicespurchased by our customers or the prices we obtain for our services; market acceptance of our new service andgrowth initiatives; changes in customer demand patterns; the impact of technology developments on our operationsand on demand for our services; disruptions to our technology infrastructure, including our computer systems andWeb site; TPG's ability to maintain aviation rights in important international markets; and adverse weather conditions.These factors and other factors that could affect these forward-looking statements are described in TPG's annualreport on Form 20-F and TPG's other reports filed with the US Securities and Exchange Commission. As a result ofthese and other factors, no assurance can be given as to TPG's future results and achievements. You are cautionednot to put undue reliance on these forward-looking statements, which are neither predictions nor guarantees of futureevents or circumstances. TPG disclaims any obligation to publicly update or revise these forward-looking statements,whether to reflect new information, future events or circumstances or otherwise.