Embed Size (px)
Citation preview
8/12/2019 (TP0A014) a Comparison of Liquid Petroleum Meters for Custody Transfer Measurement
http://slidepdf.com/reader/full/tp0a014-a-comparison-of-liquid-petroleum-meters-for-custody-transfer-measurement 1/12
8/12/2019 (TP0A014) a Comparison of Liquid Petroleum Meters for Custody Transfer Measurement
http://slidepdf.com/reader/full/tp0a014-a-comparison-of-liquid-petroleum-meters-for-custody-transfer-measurement 2/12
Issue/Rev. 0.0 (3/05)Page 2 • TP0A014
in 5 consultative runs. A more general statement isthe meter should be repeatable within +/- 0.027% at95% confidence level. This more general statementallows a wider repeatability test tolerance. For ex-ample, a repeatability of +/ - 0.12% in 10 consecutiveruns or a repeatability of +/- 0.17% in 15 consecutiveruns both meet +/- 0.027% at 95% confidence level.This latter definition of repeatability is important intesting Coriolis and Ultrasonic Flow meters, becausesampling type meters normally require more runs to
satisfy the repeatability requirement.• Linearity – the variation of meter factor over a flow range
at constant temperature, pressure and viscosity.
• Stability or Reproducibility – the variation of meterfactor over time. Unlike repeatability runs where con-ditions can be kept nearly constant, operating condi-tions over time may have wider variations. Therefore,it is important that the meter selected have minimumsensitivity to operational variations to achieve requiredaccuracy. For example, if heating oil with a viscosityrange of 2 cSt to 10 cSt over the operating tempera-ture range (see Appendix A) is being loaded at 100to 500 gpm, the meter must be stable over a 5:1 flow
range and a 5:1 viscosity range which is a measure-ment range of 25:1.
• On-site Verification or proving has always been, andremains, fundamental to custody transfer measure-ment. It is the only sure method to determine and cor-rect for both constant and variable systemic errors.
Positive Displacement Meters
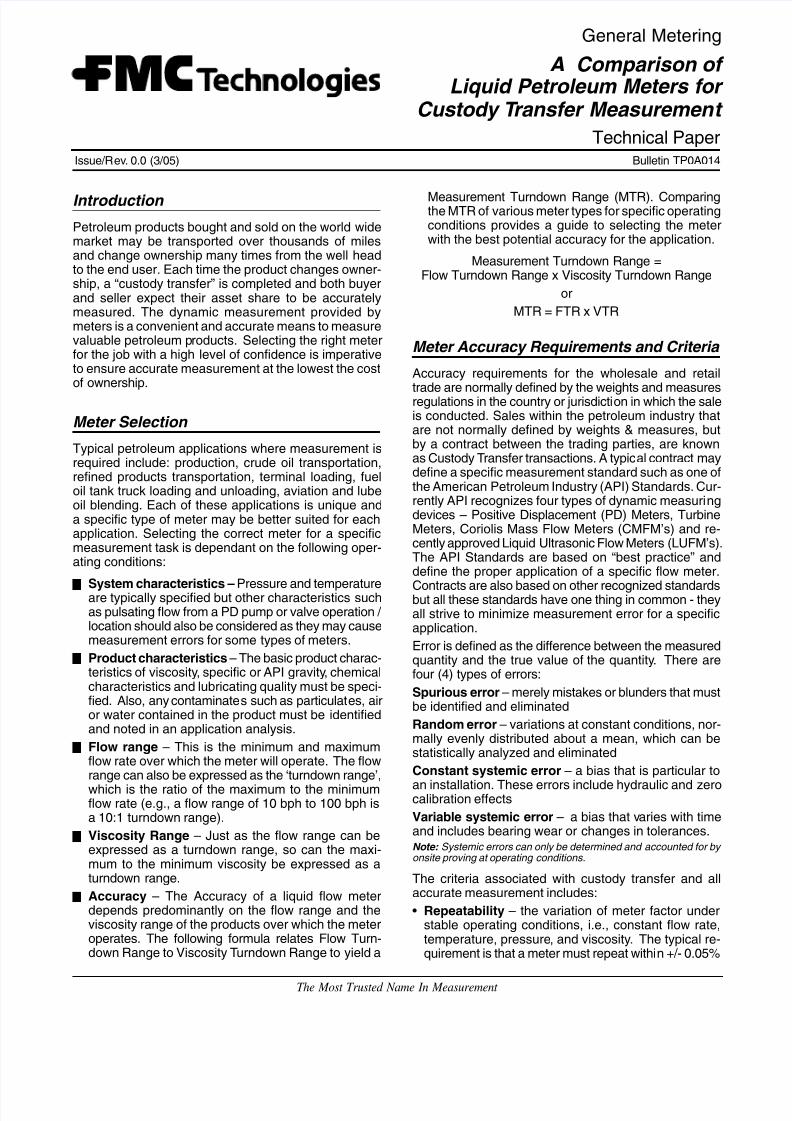
Dynamic fluid flow meters can be classified as eitherdirect volumetric meters or inference type meters. APositive Displacement (PD) meter (Figure 1) directlymeasures volumetric flow by continuously separating(isolating) the flow stream into discrete volumetric seg-ments. Inference meters determine volumetric flow rateby measuring some dynamic property of the flow stream.Turbine meters, both conventional and helical types, fallin the latter category along with Coriolis mass metersand ultrasonic meters.
Operating Principle
The PD meter measures flow by momentarily isolat-ing segments of known volume and counting them.For example in a rotating vane PD meter, as the rotorturns, isolated chambers are formed between blades,
rotor, base, cover and housing. Like a revolving door,known segments of fluid pass through the measurementchamber and are counted.
Figure 1 — PD Meter Types

8/12/2019 (TP0A014) a Comparison of Liquid Petroleum Meters for Custody Transfer Measurement
http://slidepdf.com/reader/full/tp0a014-a-comparison-of-liquid-petroleum-meters-for-custody-transfer-measurement 3/12
Issue/Rev. 0.0 (3/05) TP0A014 • Page 3
Figure 2 — Slippage across meter clearances
P ∇
L c
P ∇
Slippage (q ) =Xc
L cµ
X c
K
= Units Constant= Clearance Width= Clearance Length= Pressure Drop Across the Clearance= Absolute Viscosity of the Liquid
KXL
cc ∇
Where:
q
µ
P
3
PD Meter Accuracy Theory
There are two factors which affect the accuracy of a PDmeter - measuring chamber volume displacement andslippage through the capillary seals (clearances).
Volume Displacement
The volume displacement of a PD meter is determinedby the size of the volumetric measurement chamber. The
two factors that influence the physical volume displacedand the meter’s accuracy are temperature and coatings.Changes in temperature affect the displacement of themeter because of the thermal expansion or contractionof the materials in the measurement chamber. Most PDmeter designs are not highly sensitively to temperatureand can operate within the allowable measurement ac-curacy over a fairly wide temperature range.
Crude oils which contain paraffin wax can coat the insideof the measurement chamber. This reduces volumetricdisplacement and changes the meter’s factor. Somemeter designs, like the rotary vane PD meter, are moresuitable for these applications. The blades of the rotaryvane PD meter sweep away the build-up of wax from
the walls of the measuring chamber with each rotationof the rotor. PD meters can provide stable measurementat a high degree of accuracy in these applications if themeter is proven frequently after initial start-up until meterfactor stability is established.
Slippage
All PD meters have moving and stationary parts whichrequire clearances between them. In most PD meterdesigns, there is no contact between parts but the toler-ances are very tight and the liquid forms a capillary seal.Flow through the meter is caused by differential pres-sure across the measuring chamber. Flow through themeter not accounted for in the measurement chamberbut which flows though these clearances is commonlyknown as slippage.
Slippage through the clearances of a PD Meter can becharacterized by the Equation in Figure 2.
Figure 3 — Effect of Viscosity on PD measurement
Flow Rate
% S
l i p p a g e
100%
ZeroSlippage
16 cP8 cP
4 cP
2 cP
The slippage equation stipulates that for PD meter ac-curacy it is essential that the meter have low differentialpressure and tight clearances with wide land areas. Inaddition to meter design and manufacture quality, a key
determinate to slippage is viscosity. As the viscosity ofthe fluid increases, flow though the measuring elementclearances decreases. At a certain viscosity, about 10to 20 cSt depending on the type and size of meter, theamount of slippage is nil and the meter factor is constant.Figure 3 shows the affect of viscosity on slippage.
Application Advantages of PD Meters
PD meters are highly versatile and have been used
for custody transfer petroleum application since theirintroduction in the 1930’s. Because of their high ac-curacy, stability, reliability, mechanical output and easeof proving, they are still widely used in the petroleumindustry. Other meter technologies have displaced PDmeters for high volume, low viscosity applications likerefined product or light crude oil pipelines. PD metersstill have a measuring advantage in some applications,which include:
• Batching – For small to medium batch application,PD meters provide excellent measurement accuracyand are easily verified with calibrated can type prov-ers. PD meters remain one of the best meters forterminal and bulk plant loading applications especiallyfor diesel, jet fuel and heating oils in cold climates.They are also the leading meter choice for petroleumdelivery trucks and aviation refueling systems.
• Medium to high viscosity products – PD metersare one of the few meters that have highly stablemeter factors on medium to high viscosity products.As noted by the slippage equation, as the viscosityincreases the slippage decreases and the meterbecomes more linear over a wider measurementrange.
• Master Meters – PD meters make excellent mastermeters because they are not affected by flow profileand other installation conditions. In some applica-
tions, such as loading terminals that utilizes turbinemeters as the primary flow measurement device, aPD Master Meter is used to prove the line meters. ThePD master meter is first proven on a specific productusing a calibrated can or a dynamic prover before itis used to calibrate the line meters.
PD meters, if applied on non-abrasive products, pro-vide excellent service with relatively little maintenance.Many of the maintenance problems associated with PDmeters are actually problems with accessories like me-chanical counters, calibrators, mechanical temperaturecompensators and set-stop valves. Today’s PD meters,
8/12/2019 (TP0A014) a Comparison of Liquid Petroleum Meters for Custody Transfer Measurement
http://slidepdf.com/reader/full/tp0a014-a-comparison-of-liquid-petroleum-meters-for-custody-transfer-measurement 4/12
Issue/Rev. 0.0 (3/05)Page 4 • TP0A014
with electronic transmitters or direct electronic outputs,have a much lower cost of ownership.
Even though PD meters are the oldest custody transfermeasurement technology, they are considered the besttechnology for many applications where accuracy, stabil-ity and reliability are required.
PD Meter Performance
The following is typical performance of Smith RotaryVane type PD Meters. All types of PD meters exhibitsimilar performance but the manufacturer’s specificationmust be consulted to determine the particular perfor-mance and application requirements for a given meter.
Accuracy can also be improved over a specific measure-ment range with tuning or over the complete range withelectronic linearization.
Turbine Meters
In the mid 1960’s, the petroleum industry recognized thepotential of turbine meter technology for highly accuratemeasurement and in 1970, API published Standard
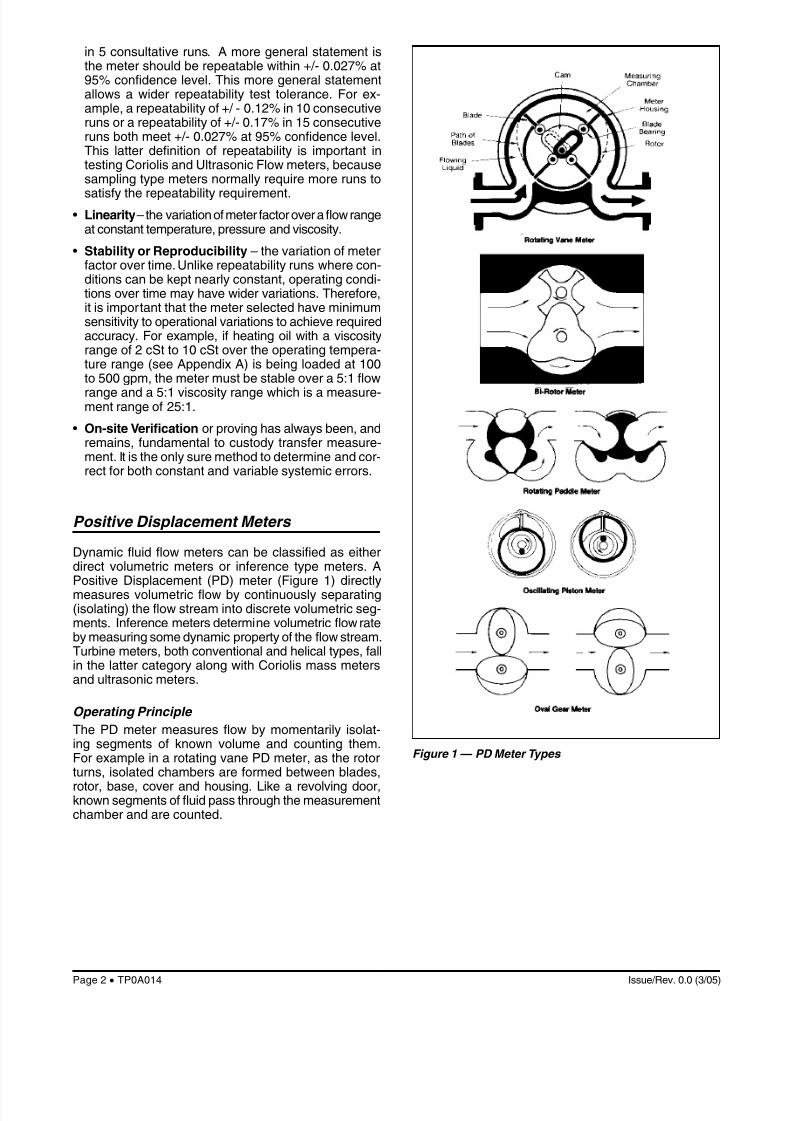
2534 - “Measurement of Liquid Hydrocarbons by Tur-bine Meter Systems”. After publication of this standard,conventional turbine meters (Fig. 4) gained broad ac-ceptance for custody transfer of petroleum liquids suchas liquefied petroleum gases (LPG’s), refined productsand light crude oil. With the introduction of helical turbinemeters in the 1990’s, turbine meter applications wereexpanded to higher viscosity crude oils, waxy crude oiland other troublesome turbine meter applications.
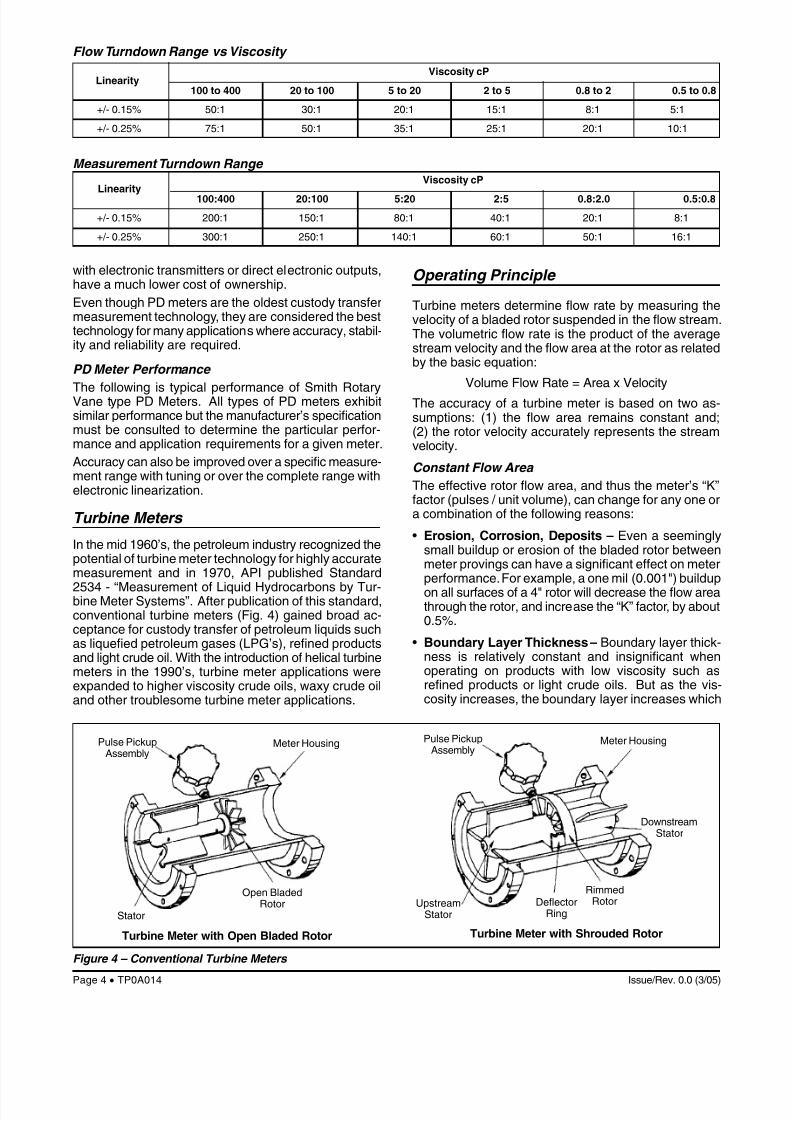
Flow Turndown Range vs Viscosity
Linearity Viscosity cP
100 to 400 20 to 100 5 to 20 2 to 5 0.8 to 2 0.5 to 0.8
+/- 0.15% 50:1 30:1 20:1 15:1 8:1 5:1
+/- 0.25% 75:1 50:1 35:1 25:1 20:1 10:1
Measurement Turndown Range
Linearity Viscosity cP
100:400 20:100 5:20 2:5 0.8:2.0 0.5:0.8
+/- 0.15% 200:1 150:1 80:1 40:1 20:1 8:1
+/- 0.25% 300:1 250:1 140:1 60:1 50:1 16:1
Meter Housing
Open BladedRotor
Pulse PickupAssembly
Stator
UpstreamStator
DeflectorRing
Meter Housing
DownstreamStator
RimmedRotor
Pulse PickupAssembly
Figure 4 – Conventional Turbine Meters
Operating Principle
Turbine meters determine flow rate by measuring thevelocity of a bladed rotor suspended in the flow stream.The volumetric flow rate is the product of the averagestream velocity and the flow area at the rotor as relatedby the basic equation:
Volume Flow Rate = Area x Velocity
The accuracy of a turbine meter is based on two as-sumptions: (1) the flow area remains constant and;(2) the rotor velocity accurately represents the streamvelocity.
Constant Flow Area
The effective rotor flow area, and thus the meter’s “K”factor (pulses / unit volume), can change for any one ora combination of the following reasons:
• Erosion, Corrosion, Deposits – Even a seeminglysmall buildup or erosion of the bladed rotor betweenmeter provings can have a significant effect on meterperformance. For example, a one mil (0.001") buildup
on all surfaces of a 4" rotor will decrease the flow areathrough the rotor, and increase the “K” factor, by about0.5%.
• Boundary Layer Thickness – Boundary layer thick-ness is relatively constant and insignificant whenoperating on products with low viscosity such asrefined products or light crude oils. But as the vis-cosity increases, the boundary layer increases which
Turbine Meter with Open Bladed Rotor Turbine Meter with Shrouded Rotor
8/12/2019 (TP0A014) a Comparison of Liquid Petroleum Meters for Custody Transfer Measurement
http://slidepdf.com/reader/full/tp0a014-a-comparison-of-liquid-petroleum-meters-for-custody-transfer-measurement 5/12
Issue/Rev. 0.0 (3/05) TP0A014 • Page 5
reduces the effective flow area. In fluid dynamics thiseffect is defined by the Reynolds’s Number (Re No),which is the ratio of the inertia forces (the force of theflow stream) to the viscous forces (the resistance toflow). Reynolds Number can be expressed as:
*Re = 2214 x Flow Rate (BPH)
Diameter x Viscosity (Inches) (cSt)
The following table defines the Re No of a 6" turbine
meter at various viscosities: Reynolds Number @ Viscosity Min/Max Flow (BPH)
cSt 4,000 400
1 1,474,000 147,400
5 294,800 29,480
50 29,480 2,948
100 14,740 1,474
500 2,948 295
• Cavitation – (the local vaporization of product)substantially reduces flow area through the rotor,dramatically increasing rotor velocity and the meter’s“K” factor.
• Obstructions – Temporary obstructions, such astrash or “grass” immediately upstream of the bladedrotor can substantially decrease effective flow areathrough the rotor as well as cause a pronounced shiftin fluid velocity profile.
Constant Rotor/Fluid Velocity Ratio Assumption
The second basic assumption is that rotor velocity ac-curately represents the stream velocity. The relationshipbetween these factors can be affected by:
• Rotor Blade Angle, Rotor Stability and BearingFriction – Changes in these areas are normallycaused by damage from large foreign objects or fine
grit in the fluid
• Velocity Profile and Swirl – Variations in velocity pro-file or fluid swirl are common causes of measurementerrors that can be minimized by proper installation anduse of flow conditioners.
• Fluid Density – The rotor driving torque available toovercome rotor drag forces is directly proportional tothe fluid density and fluid velocity squared. Therefore,as the fluid density decreases, as with LPG products,the driving torque decreases, resulting in a decreasein performance at lower flow rates.
Helical Turbine Meters
Helical turbine meters are similar to conventional turbinemeters in the fact that they have like housings, stators,bearings and pulse pickup systems and are governedby the same laws of fluid dynamics. They vary in onedistinct area - the rotor has only two helical bladesinstead of multiple blades (Figure 5).
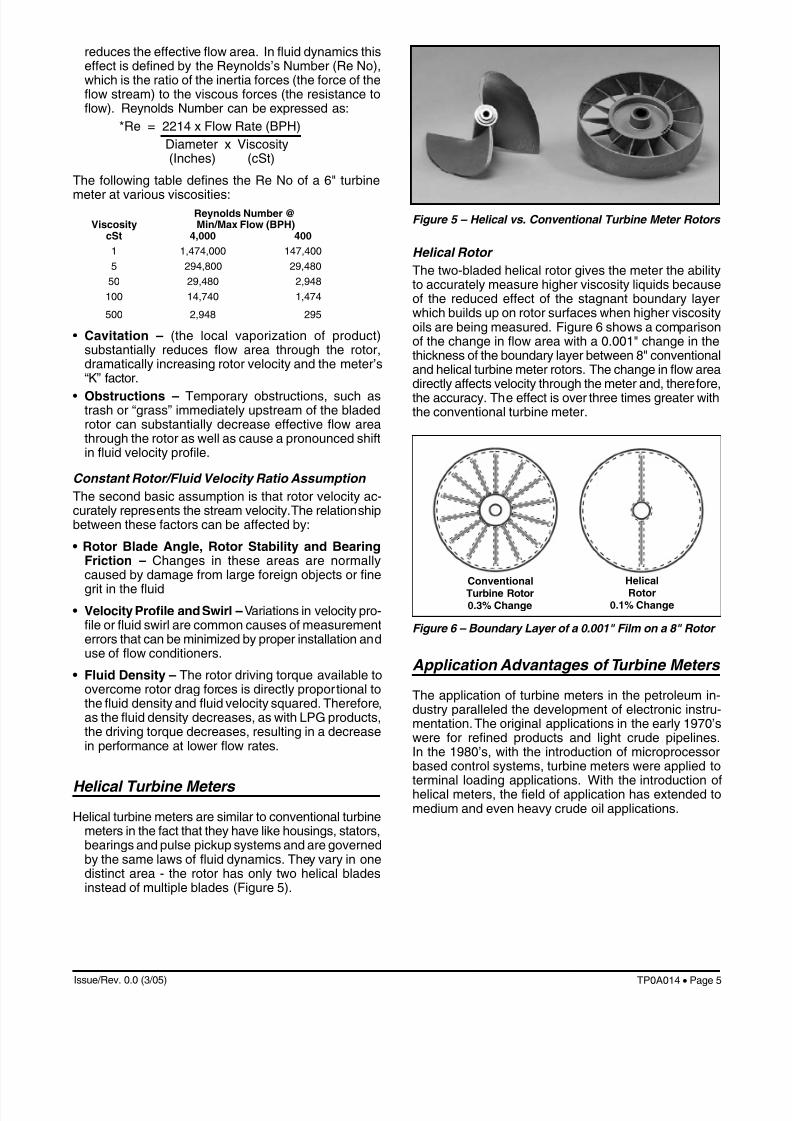
Figure 5 – Helical vs. Conventional Turbine Meter Rotors
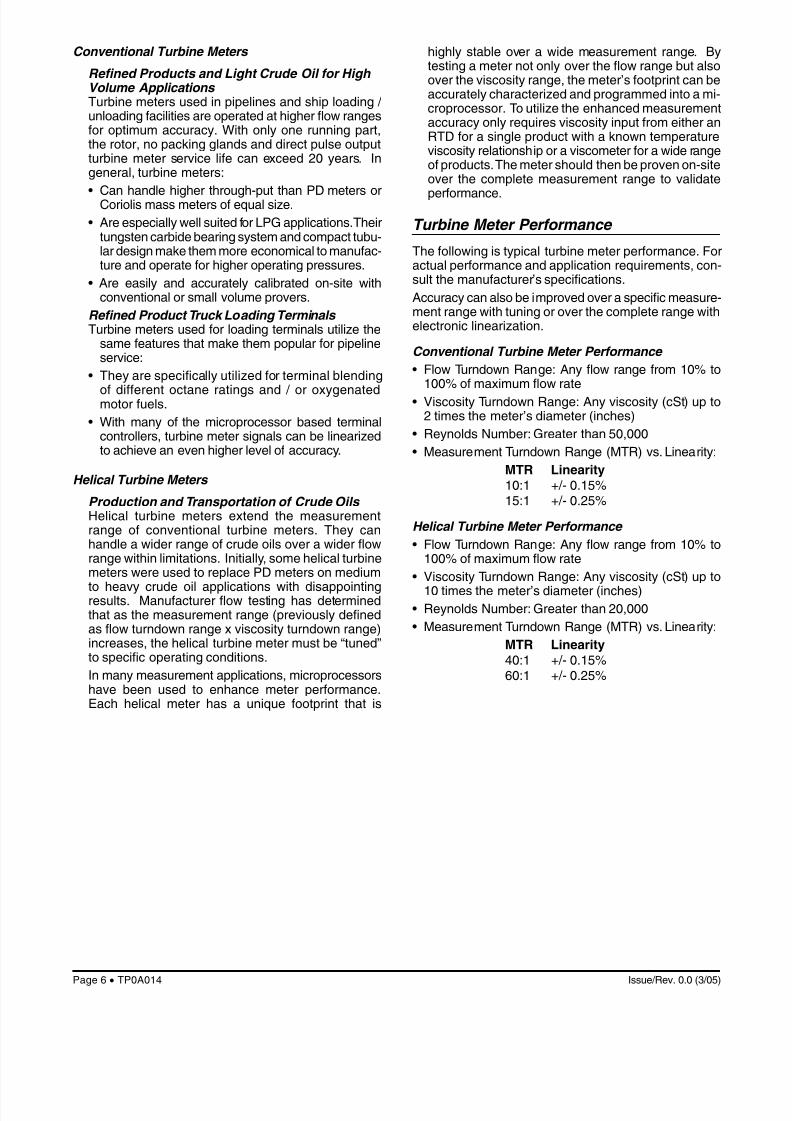
Figure 6 – Boundary Layer of a 0.001" Film on a 8" Rotor
Helical Rotor
The two-bladed helical rotor gives the meter the abilityto accurately measure higher viscosity liquids becauseof the reduced effect of the stagnant boundary layerwhich builds up on rotor surfaces when higher viscosityoils are being measured. Figure 6 shows a comparisonof the change in flow area with a 0.001" change in thethickness of the boundary layer between 8" conventionaland helical turbine meter rotors. The change in flow areadirectly affects velocity through the meter and, therefore,the accuracy. The effect is over three times greater withthe conventional turbine meter.
ConventionalTurbine Rotor0.3% Change
Helical
Rotor0.1% Change
Application Advantages of Turbine Meters
The application of turbine meters in the petroleum in-dustry paralleled the development of electronic instru-mentation. The original applications in the early 1970’swere for refined products and light crude pipelines.In the 1980’s, with the introduction of microprocessorbased control systems, turbine meters were applied to
terminal loading applications. With the introduction ofhelical meters, the field of application has extended tomedium and even heavy crude oil applications.
8/12/2019 (TP0A014) a Comparison of Liquid Petroleum Meters for Custody Transfer Measurement
http://slidepdf.com/reader/full/tp0a014-a-comparison-of-liquid-petroleum-meters-for-custody-transfer-measurement 6/12
8/12/2019 (TP0A014) a Comparison of Liquid Petroleum Meters for Custody Transfer Measurement
http://slidepdf.com/reader/full/tp0a014-a-comparison-of-liquid-petroleum-meters-for-custody-transfer-measurement 7/12
Issue/Rev. 0.0 (3/05) TP0A014 • Page 7
Coriolis Mass Meters
Coriolis mass meters were introduced to industry in theearly 1980’s and have gained acceptance as accurateand reliable flow measuring devices. A major factorcontributing to their popularity is that Coriolis metersmeasure mass flow rate directly thus eliminating theneed for pressure and temperature compensation. Di-rect mass flow measurement led to the rapid adoptionof Coriolis meters by the Chemical and Petrochemical
industries. Petroleum applications most often requirea volumetric flow rate output. To accomplish a volumemeasurement a Coriolis meter transmitter calculatesvolume flow rate (Q) from measured mass flow rate (m)
and measured density (ρ):
Q = m/ ρρ.
The Coriolis meter volume measurement accuracyreflects the combined uncertainty of the mass flow rateand density measurement.
Operating Principle
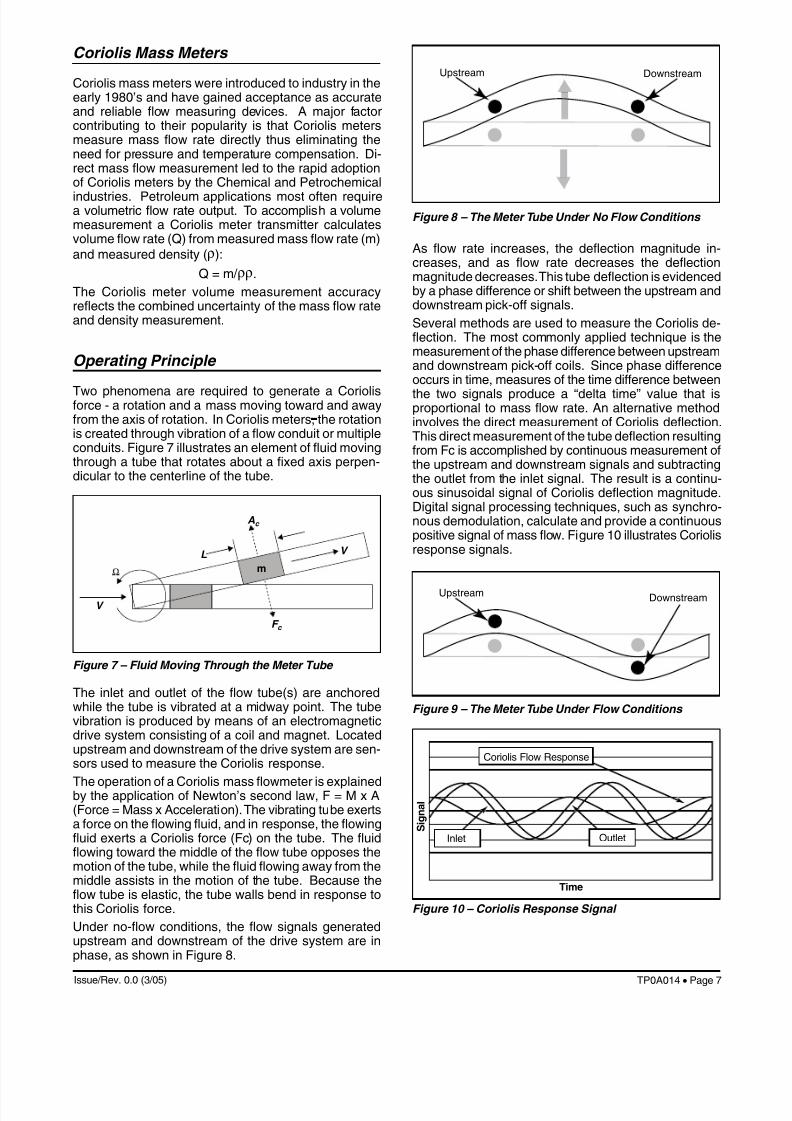
Two phenomena are required to generate a Coriolisforce - a rotation and a mass moving toward and awayfrom the axis of rotation. In Coriolis meters, the rotationis created through vibration of a flow conduit or multipleconduits. Figure 7 illustrates an element of fluid movingthrough a tube that rotates about a fixed axis perpen-dicular to the centerline of the tube.
The inlet and outlet of the flow tube(s) are anchoredwhile the tube is vibrated at a midway point. The tubevibration is produced by means of an electromagneticdrive system consisting of a coil and magnet. Locatedupstream and downstream of the drive system are sen-sors used to measure the Coriolis response.
The operation of a Coriolis mass flowmeter is explainedby the application of Newton’s second law, F = M x A(Force = Mass x Acceleration). The vibrating tube exertsa force on the flowing fluid, and in response, the flowingfluid exerts a Coriolis force (Fc) on the tube. The fluidflowing toward the middle of the flow tube opposes themotion of the tube, while the fluid flowing away from themiddle assists in the motion of the tube. Because theflow tube is elastic, the tube walls bend in response tothis Coriolis force.
Under no-flow conditions, the flow signals generatedupstream and downstream of the drive system are inphase, as shown in Figure 8.
Figure 7 – Fluid Moving Through the Meter Tube
Figure 8 – The Meter Tube Under No Flow Conditions
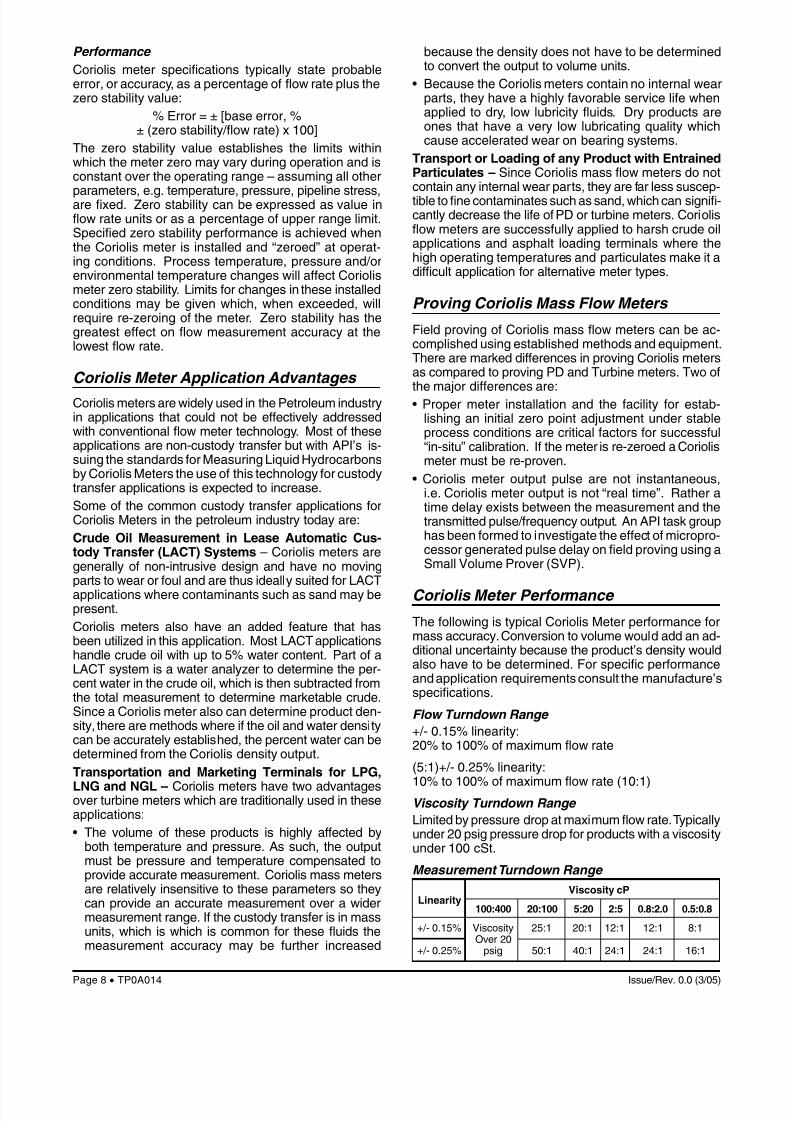
As flow rate increases, the deflection magnitude in-creases, and as flow rate decreases the deflectionmagnitude decreases. This tube deflection is evidencedby a phase difference or shift between the upstream anddownstream pick-off signals.
Several methods are used to measure the Coriolis de-flection. The most commonly applied technique is themeasurement of the phase difference between upstreamand downstream pick-off coils. Since phase differenceoccurs in time, measures of the time difference between
the two signals produce a “delta time” value that isproportional to mass flow rate. An alternative methodinvolves the direct measurement of Coriolis deflection.This direct measurement of the tube deflection resultingfrom Fc is accomplished by continuous measurement ofthe upstream and downstream signals and subtractingthe outlet from the inlet signal. The result is a continu-ous sinusoidal signal of Coriolis deflection magnitude.Digital signal processing techniques, such as synchro-nous demodulation, calculate and provide a continuouspositive signal of mass flow. Figure 10 illustrates Coriolisresponse signals.
Figure 9 – The Meter Tube Under Flow Conditions
Figure 10 – Coriolis Response Signal
V
F c
Ac
L V
m
Upstream Downstream
Upstream Downstream
Time
S i g n a l
Coriolis Flow Response
OutletInlet
8/12/2019 (TP0A014) a Comparison of Liquid Petroleum Meters for Custody Transfer Measurement
http://slidepdf.com/reader/full/tp0a014-a-comparison-of-liquid-petroleum-meters-for-custody-transfer-measurement 8/12
Issue/Rev. 0.0 (3/05)Page 8 • TP0A014
because the density does not have to be determinedto convert the output to volume units.
• Because the Coriolis meters contain no internal wearparts, they have a highly favorable service life whenapplied to dry, low lubricity fluids. Dry products areones that have a very low lubricating quality whichcause accelerated wear on bearing systems.
Transport or Loading of any Product with EntrainedParticulates – Since Coriolis mass flow meters do notcontain any internal wear parts, they are far less suscep-tible to fine contaminates such as sand, which can signifi-cantly decrease the life of PD or turbine meters. Coriolisflow meters are successfully applied to harsh crude oilapplications and asphalt loading terminals where thehigh operating temperatures and particulates make it adifficult application for alternative meter types.
Proving Coriolis Mass Flow Meters
Field proving of Coriolis mass flow meters can be ac-complished using established methods and equipment.There are marked differences in proving Coriolis metersas compared to proving PD and Turbine meters. Two of
the major differences are:• Proper meter installation and the facility for estab-
lishing an initial zero point adjustment under stableprocess conditions are critical factors for successful“in-situ” calibration. If the meter is re-zeroed a Coriolismeter must be re-proven.
• Coriolis meter output pulse are not instantaneous,i.e. Coriolis meter output is not “real time”. Rather atime delay exists between the measurement and thetransmitted pulse/frequency output. An API task grouphas been formed to investigate the effect of micropro-cessor generated pulse delay on field proving using aSmall Volume Prover (SVP).
Coriolis Meter Performance
The following is typical Coriolis Meter performance formass accuracy. Conversion to volume would add an ad-ditional uncertainty because the product’s density wouldalso have to be determined. For specific performanceand application requirements consult the manufacture’sspecifications.
Flow Turndown Range
+/- 0.15% linearity:20% to 100% of maximum flow rate
(5:1)+/- 0.25% linearity:
10% to 100% of maximum flow rate (10:1)Viscosity Turndown Range
Limited by pressure drop at maximum flow rate. Typicallyunder 20 psig pressure drop for products with a viscosityunder 100 cSt.
Measurement Turndown Range
Linearity Viscosity cP
100:400 20:100 5:20 2:5 0.8:2.0 0.5:0.8
+/- 0.15% Viscosity 25:1 20:1 12:1 12:1 8:1Over 20
+/- 0.25% psig 50:1 40:1 24:1 24:1 16:1
Performance
Coriolis meter specifications typically state probableerror, or accuracy, as a percentage of flow rate plus thezero stability value:
% Error = ± [base error, %± (zero stability/flow rate) x 100]
The zero stability value establishes the limits withinwhich the meter zero may vary during operation and isconstant over the operating range – assuming all other
parameters, e.g. temperature, pressure, pipeline stress,are fixed. Zero stability can be expressed as value inflow rate units or as a percentage of upper range limit.Specified zero stability performance is achieved whenthe Coriolis meter is installed and “zeroed” at operat-ing conditions. Process temperature, pressure and/orenvironmental temperature changes will affect Coriolismeter zero stability. Limits for changes in these installedconditions may be given which, when exceeded, willrequire re-zeroing of the meter. Zero stability has thegreatest effect on flow measurement accuracy at thelowest flow rate.
Coriolis Meter Application Advantages
Coriolis meters are widely used in the Petroleum industryin applications that could not be effectively addressedwith conventional flow meter technology. Most of theseapplications are non-custody transfer but with API’s is-suing the standards for Measuring Liquid Hydrocarbonsby Coriolis Meters the use of this technology for custodytransfer applications is expected to increase.
Some of the common custody transfer applications forCoriolis Meters in the petroleum industry today are:
Crude Oil Measurement in Lease Automatic Cus-tody Transfer (LACT) Systems – Coriolis meters aregenerally of non-intrusive design and have no movingparts to wear or foul and are thus ideally suited for LACTapplications where contaminants such as sand may bepresent.
Coriolis meters also have an added feature that hasbeen utilized in this application. Most LACT applicationshandle crude oil with up to 5% water content. Part of aLACT system is a water analyzer to determine the per-cent water in the crude oil, which is then subtracted fromthe total measurement to determine marketable crude.Since a Coriolis meter also can determine product den-sity, there are methods where if the oil and water densitycan be accurately established, the percent water can bedetermined from the Coriolis density output.
Transportation and Marketing Terminals for LPG,
LNG and NGL – Coriolis meters have two advantagesover turbine meters which are traditionally used in theseapplications:
• The volume of these products is highly affected byboth temperature and pressure. As such, the outputmust be pressure and temperature compensated toprovide accurate measurement. Coriolis mass metersare relatively insensitive to these parameters so theycan provide an accurate measurement over a widermeasurement range. If the custody transfer is in massunits, which is which is common for these fluids themeasurement accuracy may be further increased
8/12/2019 (TP0A014) a Comparison of Liquid Petroleum Meters for Custody Transfer Measurement
http://slidepdf.com/reader/full/tp0a014-a-comparison-of-liquid-petroleum-meters-for-custody-transfer-measurement 9/12
8/12/2019 (TP0A014) a Comparison of Liquid Petroleum Meters for Custody Transfer Measurement
http://slidepdf.com/reader/full/tp0a014-a-comparison-of-liquid-petroleum-meters-for-custody-transfer-measurement 10/12
Issue/Rev. 0.0 (3/05)Page 10 • TP0A014
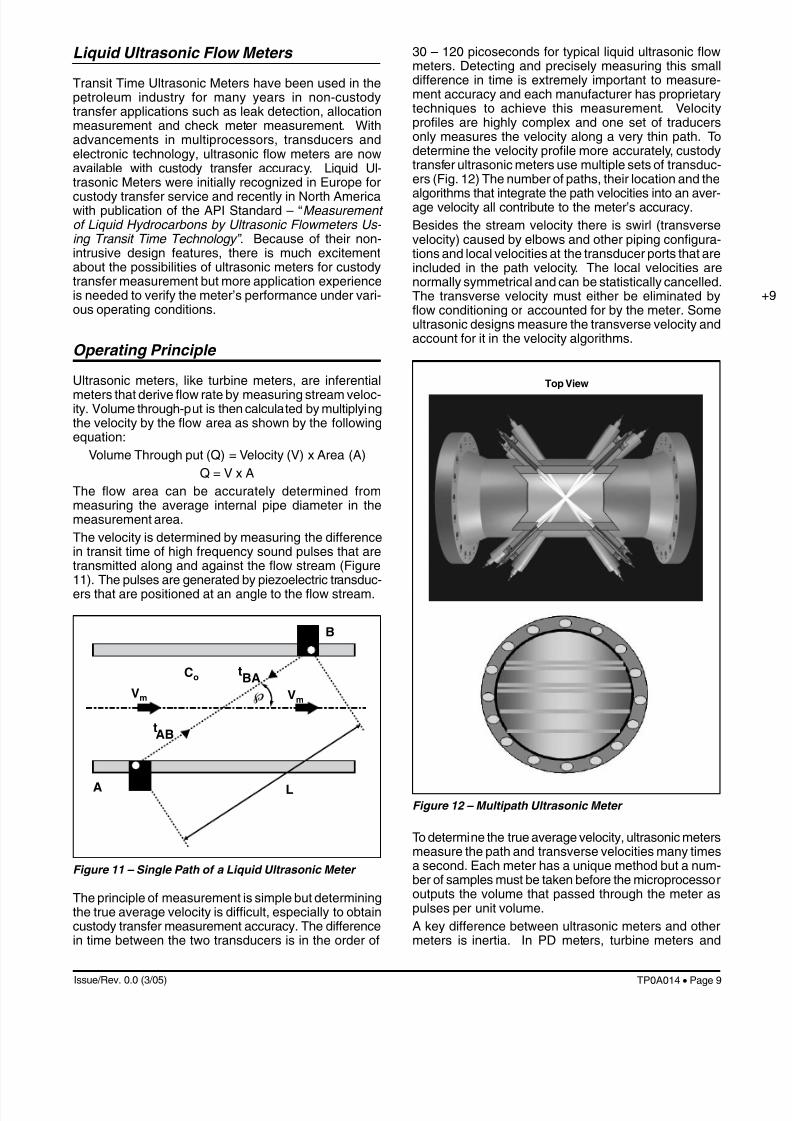
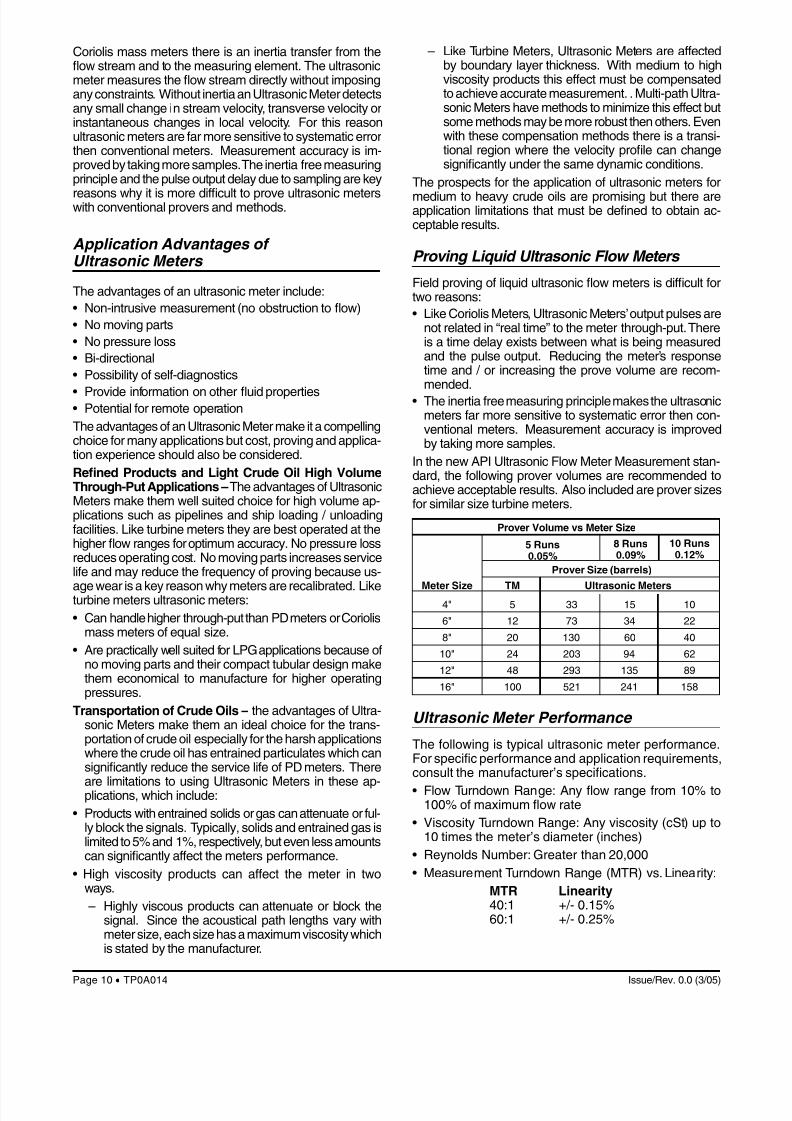
Coriolis mass meters there is an inertia transfer from theflow stream and to the measuring element. The ultrasonicmeter measures the flow stream directly without imposingany constraints. Without inertia an Ultrasonic Meter detectsany small change in stream velocity, transverse velocity orinstantaneous changes in local velocity. For this reasonultrasonic meters are far more sensitive to systematic errorthen conventional meters. Measurement accuracy is im-proved by taking more samples. The inertia free measuringprinciple and the pulse output delay due to sampling are key
reasons why it is more difficult to prove ultrasonic meterswith conventional provers and methods.
Application Advantages ofUltrasonic Meters
The advantages of an ultrasonic meter include:
• Non-intrusive measurement (no obstruction to flow)
• No moving parts
• No pressure loss
• Bi-directional
• Possibility of self-diagnostics
• Provide information on other fluid properties• Potential for remote operation
The advantages of an Ultrasonic Meter make it a compellingchoice for many applications but cost, proving and applica-tion experience should also be considered.
Refined Products and Light Crude Oil High VolumeThrough-Put Applications –The advantages of UltrasonicMeters make them well suited choice for high volume ap-plications such as pipelines and ship loading / unloadingfacilities. Like turbine meters they are best operated at thehigher flow ranges for optimum accuracy. No pressure lossreduces operating cost. No moving parts increases servicelife and may reduce the frequency of proving because us-
age wear is a key reason why meters are recalibrated. Liketurbine meters ultrasonic meters:
• Can handle higher through-put than PD meters or Coriolismass meters of equal size.
• Are practically well suited for LPG applications because ofno moving parts and their compact tubular design makethem economical to manufacture for higher operatingpressures.
Transportation of Crude Oils – the advantages of Ultra-sonic Meters make them an ideal choice for the trans-portation of crude oil especially for the harsh applicationswhere the crude oil has entrained particulates which cansignificantly reduce the service life of PD meters. There
are limitations to using Ultrasonic Meters in these ap-plications, which include:
• Products with entrained solids or gas can attenuate or ful-ly block the signals. Typically, solids and entrained gas islimited to 5% and 1%, respectively, but even less amountscan significantly affect the meters performance.
• High viscosity products can affect the meter in twoways.
– Highly viscous products can attenuate or block thesignal. Since the acoustical path lengths vary withmeter size, each size has a maximum viscosity whichis stated by the manufacturer.
– Like Turbine Meters, Ultrasonic Meters are affectedby boundary layer thickness. With medium to highviscosity products this effect must be compensatedto achieve accurate measurement. . Multi-path Ultra-sonic Meters have methods to minimize this effect butsome methods may be more robust then others. Evenwith these compensation methods there is a transi-tional region where the velocity profile can changesignificantly under the same dynamic conditions.
The prospects for the application of ultrasonic meters for
medium to heavy crude oils are promising but there areapplication limitations that must be defined to obtain ac-ceptable results.
Proving Liquid Ultrasonic Flow Meters
Field proving of liquid ultrasonic flow meters is difficult fortwo reasons:
• Like Coriolis Meters, Ultrasonic Meters’ output pulses arenot related in “real time” to the meter through-put. Thereis a time delay exists between what is being measuredand the pulse output. Reducing the meter’s responsetime and / or increasing the prove volume are recom-mended.
• The inertia free measuring principle makes the ultrasonicmeters far more sensitive to systematic error then con-ventional meters. Measurement accuracy is improvedby taking more samples.
In the new API Ultrasonic Flow Meter Measurement stan-dard, the following prover volumes are recommended toachieve acceptable results. Also included are prover sizesfor similar size turbine meters.
Prover Volume vs Meter Size
Meter Size TM Ultrasonic Meters 4" 5 33 15 10
6" 12 73 34 22
8" 20 130 60 40
10" 24 203 94 62
12" 48 293 135 89
16" 100 521 241 158
Ultrasonic Meter Performance
The following is typical ultrasonic meter performance.For specific performance and application requirements,consult the manufacturer’s specifications.
• Flow Turndown Range: Any flow range from 10% to100% of maximum flow rate
• Viscosity Turndown Range: Any viscosity (cSt) up to10 times the meter’s diameter (inches)
• Reynolds Number: Greater than 20,000
• Measurement Turndown Range (MTR) vs. Linearity:
MTR Linearity40:1 +/- 0.15%
60:1 +/- 0.25%
Prover Size (barrels)
5 Runs0.05%
8 Runs0.09%
10 Runs0.12%
8/12/2019 (TP0A014) a Comparison of Liquid Petroleum Meters for Custody Transfer Measurement
http://slidepdf.com/reader/full/tp0a014-a-comparison-of-liquid-petroleum-meters-for-custody-transfer-measurement 11/12
Issue/Rev. 0.0 (3/05) TP0A014 • Page 11
Summary
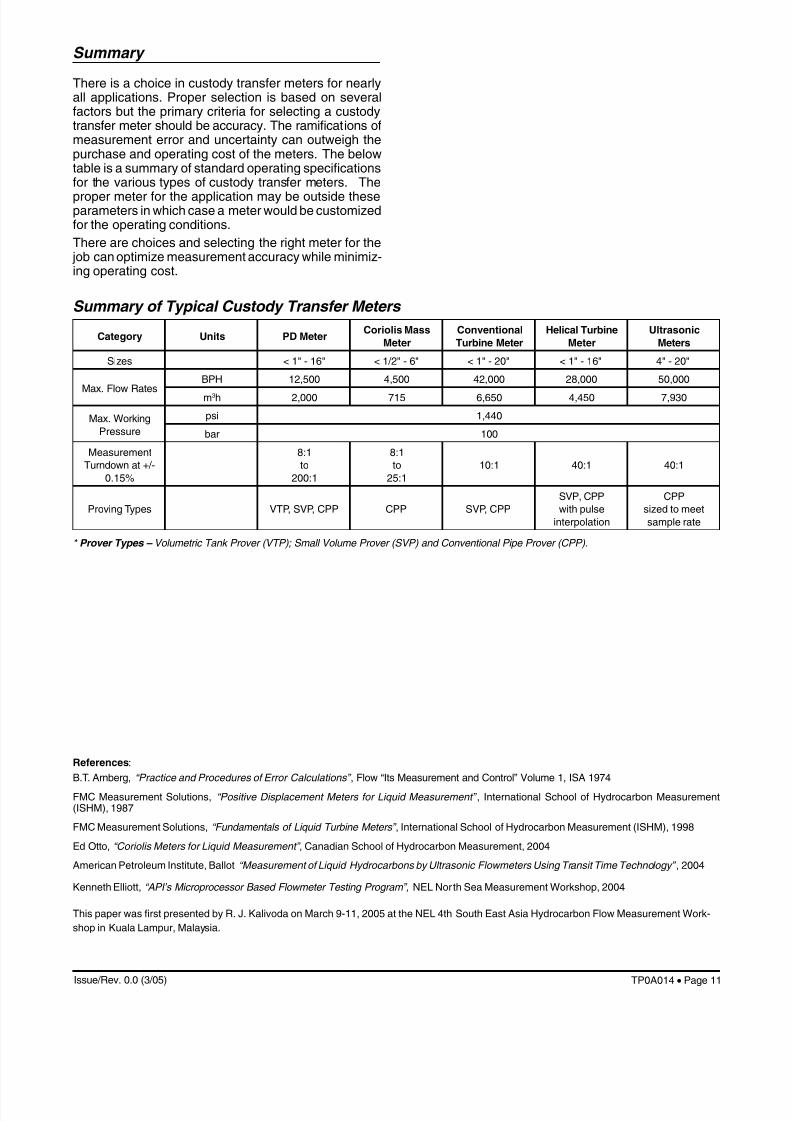
There is a choice in custody transfer meters for nearlyall applications. Proper selection is based on severalfactors but the primary criteria for selecting a custodytransfer meter should be accuracy. The ramifications ofmeasurement error and uncertainty can outweigh thepurchase and operating cost of the meters. The belowtable is a summary of standard operating specificationsfor the various types of custody transfer meters. The
proper meter for the application may be outside theseparameters in which case a meter would be customizedfor the operating conditions.
There are choices and selecting the right meter for the job can optimize measurement accuracy while minimiz-ing operating cost.
References:
B.T. Arnberg, “Practice and Procedures of Error Calculations” , Flow “Its Measurement and Control” Volume 1, ISA 1974
FMC Measurement Solutions, “Positive Displacement Meters for Liquid Measurement” , International School of Hydrocarbon Measurement(ISHM), 1987
FMC Measurement Solutions, “Fundamentals of Liquid Turbine Meters” , International School of Hydrocarbon Measurement (ISHM), 1998
Ed Otto, “Coriolis Meters for Liquid Measurement” , Canadian School of Hydrocarbon Measurement, 2004
American Petroleum Institute, Ballot “Measurement of Liquid Hydrocarbons by Ultrasonic Flowmeters Using Transit Time Technology” , 2004
Kenneth Elliott, “API’s Microprocessor Based Flowmeter Testing Program”, NEL North Sea Measurement Workshop, 2004
This paper was first presented by R. J. Kalivoda on March 9-11, 2005 at the NEL 4th South East Asia Hydrocarbon Flow Measurement Work-
shop in Kuala Lampur, Malaysia.
Summary of Typical Custody Transfer Meters
* Prover Types – Volumetric Tank Prover (VTP); Small Volume Prover (SVP) and Conventional Pipe Prover (CPP).
Category Units PD MeterCoriolis Mass
Meter
Conventional
Turbine Meter
Helical Turbine
Meter
Ultrasonic
Meters
Sizes < 1" - 16" < 1/2" - 6" < 1" - 20" < 1" - 16" 4" - 20"
Max. Flow Rates
BPH 12,500 4,500 42,000 28,000 50,000
m3h 2,000 715 6,650 4,450 7,930
Max. Working
Pressure
psi 1,440
bar 100
Measurement
Turndown at +/-
0.15%
8:1
to
200:1
8:1
to
25:1
10:1 40:1 40:1
Proving Types VTP, SVP, CPP CPP SVP, CPP
SVP, CPP
with pulse
interpolation
CPP
sized to meet
sample rate
8/12/2019 (TP0A014) a Comparison of Liquid Petroleum Meters for Custody Transfer Measurement
http://slidepdf.com/reader/full/tp0a014-a-comparison-of-liquid-petroleum-meters-for-custody-transfer-measurement 12/12
Printed in U S A © 3/05 FMC Technologies Measurement Solutions Inc All rights reserved TP0A014 Issue/Rev 0 0 (3/05)
Appendix A
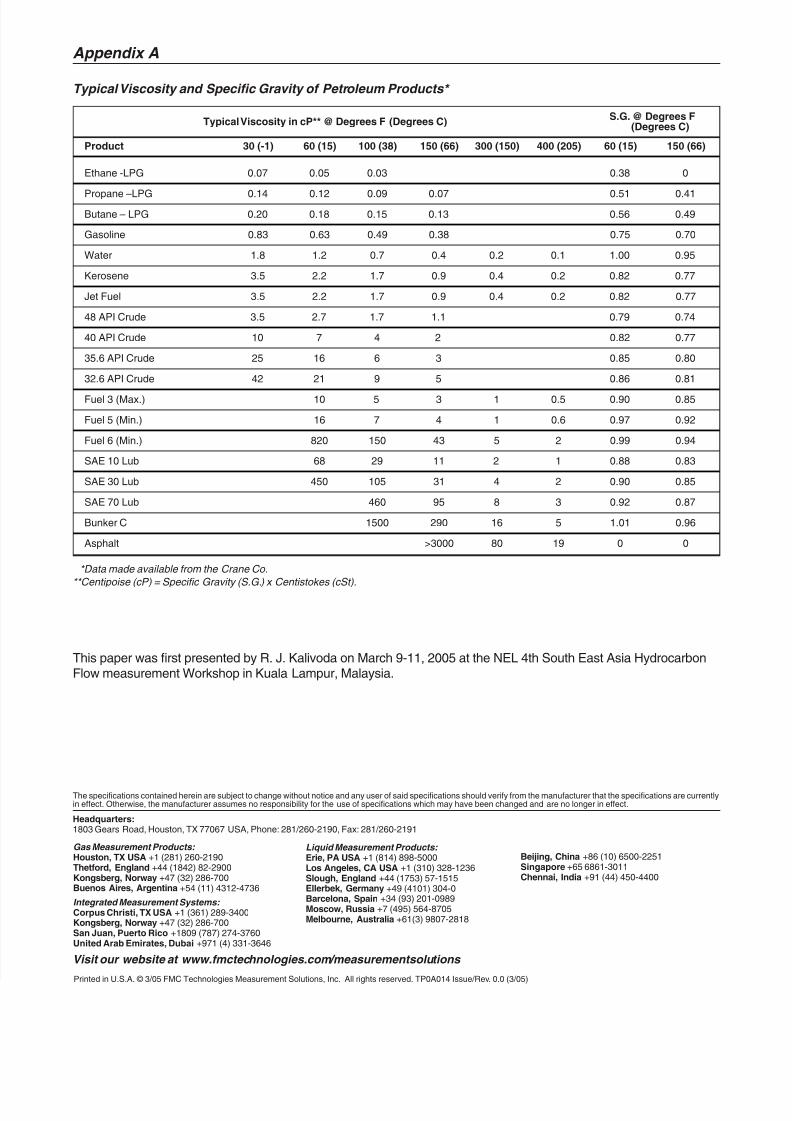
Typical Viscosity and Specific Gravity of Petroleum Products*
Typical Viscosity in cP** @ Degrees F (Degrees C)
S.G. @ Degrees F(Degrees C)
Product 30 (-1) 60 (15) 100 (38) 150 (66) 300 (150) 400 (205) 60 (15) 150 (66)
Ethane -LPG 0.07 0.05 0.03 0.38 0
Propane –LPG 0.14 0.12 0.09 0.07 0.51 0.41
Butane – LPG 0.20 0.18 0.15 0.13 0.56 0.49
Gasoline 0.83 0.63 0.49 0.38 0.75 0.70
Water 1.8 1.2 0.7 0.4 0.2 0.1 1.00 0.95
Kerosene 3.5 2.2 1.7 0.9 0.4 0.2 0.82 0.77
Jet Fuel 3.5 2.2 1.7 0.9 0.4 0.2 0.82 0.77
48 API Crude 3.5 2.7 1.7 1.1 0.79 0.74
40 API Crude 10 7 4 2 0.82 0.77
35.6 API Crude 25 16 6 3 0.85 0.80
32.6 API Crude 42 21 9 5 0.86 0.81
Fuel 3 (Max.) 10 5 3 1 0.5 0.90 0.85
Fuel 5 (Min.) 16 7 4 1 0.6 0.97 0.92
Fuel 6 (Min.) 820 150 43 5 2 0.99 0.94
SAE 10 Lub 68 29 11 2 1 0.88 0.83
SAE 30 Lub 450 105 31 4 2 0.90 0.85
SAE 70 Lub 460 95 8 3 0.92 0.87
Bunker C 1500 290 16 5 1.01 0.96
Asphalt >3000 80 19 0 0
*Data made available from the Crane Co.
**Centipoise (cP) = Specific Gravity (S.G.) x Centistokes (cSt).
This paper was first presented by R. J. Kalivoda on March 9-11, 2005 at the NEL 4th South East Asia HydrocarbonFlow measurement Workshop in Kuala Lampur, Malaysia.
Visit our website at www.fmctechnologies.com/measurementsolutions
The specifications contained herein are subject to change without notice and any user of said specifications should verify from the manufacturer that the specifications are currentlyin effect. Otherwise, the manufacturer assumes no responsibility for the use of specifications which may have been changed and are no longer in effect.
Headquarters:1803 Gears Road, Houston, TX 77067 USA, Phone: 281/260-2190, Fax: 281/260-2191
Gas Measurement Products:Houston, TX USA +1 (281) 260-2190Thetford, England +44 (1842) 82-2900Kongsberg, Norway +47 (32) 286-700Buenos Aires, Argentina +54 (11) 4312-4736
Integrated Measurement Systems: Corpus Christi, TX USA +1 (361) 289-3400Kongsberg, Norway +47 (32) 286-700San Juan, Puerto Rico +1809 (787) 274-3760United Arab Emirates, Dubai +971 (4) 331-3646
Liquid Measurement Products: Erie, PA USA +1 (814) 898-5000Los Angeles, CA USA +1 (310) 328-1236Slough, England +44 (1753) 57-1515Ellerbek, Germany +49 (4101) 304-0Barcelona, Spain +34 (93) 201-0989Moscow, Russia +7 (495) 564-8705Melbourne, Australia +61(3) 9807-2818
Beijing, China +86 (10) 6500-2251Singapore +65 6861-3011Chennai, India +91 (44) 450-4400