Embed Size (px)
Citation preview

Toxin Producing Blue-Green Algae at Recreational Sites in the St. Johns River, Florida
3 April 2006
by
Chris Williams, Mark Aubel, Andrew Chapman, and Peter D’aiuto GreenWater Laboratories/CyanoLab
205 Zeagler Drive, Suite 302 Palatka, FL. 32177
Dale Casamatta, Ph.D.
University of North Florida Department of Biology
4567 St. Johns Bluff Rd. Jacksonville, FL. 32224
and
Andrew Reich and Sharon Ketchen
Florida Department of Health Bureau of Community Environmental Health
Aquatic Toxins Program Tallahassee, FL.

INTRODUCTION Cyanobacteria, or blue-green algae, are a group of oxygenic-photosynthetic bacteria containing chlorophyll a and accounting for up to 40% of planetary oxygen production. Amongst the oldest and most diverse lineages of bacteria, they have radiated into nearly every aquatic and terrestrial ecosystem. However, it is their prevalence in freshwater ecosystems that has caused the greatest amount of interest and concern in recent years. As anthropological eutrophication escalates, cyanobacteria are an increasingly common component of freshwater systems, especially in southern, sub-tropical systems. Excellent competitors at high nutrient levels, they can rapidly form extensive blooms consisting often of a nearly unialgal assemblage, presenting a number of problems especially for potable waters. First, cyanobacteria tend to be inedible or noxious to other aquatic organisms. Second, as blooms senesce they contribute to large-scale anoxia as cells lyse and are degraded, often leading to extensive fish kills. Finally, many cyanobacteria produce secondary metabolites that can adversely impact aquatic ecosystems. One of the primary concerns with cyanobacteria stems from the production of cyanotoxins. Cyanotoxins are a class of chemical compounds typically released during lysis of mature colonies. While over 40 species have been documented to release toxic compounds, the most common genera are species or strains of Anabaena, Aphanizomenon, Cylindrospermopsis and Microcystis, with several new genera recently being confirmed as toxin producing. These toxins are typically differentiated into five major classes based on tissue or organ specificity: hepatotoxins, neurotoxins, cytotoxins, dermatotoxins and irritant toxins. Of these, the most common are hepatotoxic microcystins (MC), which tend to dominate most freshwaters. Produced primarily by Microcystis aeruginosa, several other genera including Anabaena, Anabaenopsis, Planktothrix and Nostoc have recently also been documented to produce these toxins which can lead to skin irritation, kidney problems and most significantly liver toxicity. Given the preponderance of eutrophic lentic and lotic water systems in Florida, coupled with the extensive recreation value of these systems, it is essential to monitor the cyanotoxin levels. However, at present there is no federal drinking water standard for these compounds. The purpose of this study was to monitor cyanotoxin levels in the St. Johns River.
1

METHODS Sample sites Sample sites were pre-determined and consisted of Doctors Lake, Eagle Point (Shands Bridge), the Palatka Pier, Crescent Lake, Lake George, Little Lake Harris at Hickory Pt., Lake Monroe, Lake Jesup, and Lake Washington. Geographical distribution of sample sites are shown in Figure 1. Sample sites were pre-determined based upon recreational use, previous historical occurrence of toxigenic blooms, and potential for being used as a resource for drinking water production. Algal Analyses Water samples were collected by using a horizontal Van Dorn (2.2 L) water sampler or by directly immersing sample containers in ambient water. Water samples that were analyzed for toxigenic cyanobacteria were preserved with 10% lugols solution and viewed microscopically using an inverted microscope equipped with phase contrast optics. Toxin Analyses Microcystins Enzyme Linked Immunosorbent Assay (ELISA) was utilized for the determination of the concentration of total microcystins (MCs) present. Antibody-coated plates, standards, and all reagents were supplied by Abraxis LLC (Product No. 520011). The level of sensitivity for microcystin(s) using this method was approximately 0.15 µg/L. Anatoxin-a and Cylindrospermopsin A liquid chromatographic/mass spectrometric (LC/MS/MS) system was utilized for the identification and quantification of cylindrospermopsin (CYN) and anatoxin-a (ANTX-A) for all water samples analyzed. RESULTS and OBSERVATIONS Potentially Toxigenic Cyanobacteria Currently, no guideline levels exist for the management (monitoring, testing, posting and/or closure) of surface waters for potentially toxigenic cyanobacteria and/or cyanotoxin content for water bodies that support recreational activities in the US. The World Health Organization, however, does suggest concentration levels for the increased monitoring and warning of recreational users that bloom conditions exist due to an increase in the probability of human health risks. These levels are 20,000 cells/ml (alert level 1) and 100,000 cells/ml (alert level 2) which is approximately equivalent to 2-4 ug/L and 20 ug/L of microcystin-LR, respectively (Falconer et al., 1999). Australia has recently developed recreational guidelines for adults and children of 45 ug/L and 15 ug/L for total cyanotoxins, respectively (Burch, 2005). The Florida Department of Health and the Public Health Technical Committee of the Florida Harmful Algal Bloom Task hopes to address these issues relevant to the state of Florida in the very near future.
2

In general, the St. Johns River maintains a strong population of potentially toxigenic cyanobacteria throughout the late spring (May) and continuing into the early fall months (October/November). Data collected during the sampling period (May-October) of this project shows that the concentration of potentially toxigenic cyanobacteria, on several occasions, increased to greater than 500,000 cells/ml (Table 1). Population densities were, however, site specific and not all sites were shown to maintain high concentration levels (> 20,000 cells/ml.). For example, the Hickory Pt. site in Little Lake Harris, a permitted bathing water location, exhibited concentration levels of greater than 100,000 cells/ml. throughout the sampling period (100%) while Lakes Washington and Monroe were never observed to have population levels above 100,000 cells/ml. and were only observed to have concentration levels above 20,000 cells/ml twice (Lake Monroe in mid/late May). Most water bodies showed typical “up and down” fluctuations in population levels as weather, nutrient input, and environmental conditions varied during the year, which emphasizes the need for continuous monitoring with short intervals between monitoring events. It should be noted, however, that patterns of occurrence are impossible to determine with such a limited time frame of monitoring and usually need multiple years (5-10) of frequency data before a true understanding can be extracted. Inter-annual variation in algal population dynamics and subsequently toxin production can be significant. During the term of this project, species of Microcystis and Cylindrospermopsis raciborskii were the dominant toxin producers observed. Cyanotoxins Microcystins and cylindrospermopsin, but not anatoxin-a, were positively identified at samples sites in the St. Johns River. Figures 2 and 3 provide monthly levels of MC and CYN, respectively. In most cases, the presence of toxin was indicative of a significant level of associated cyanobacteria. One exception to this correlation is with the MC data found for Lake Jesup. Moderate levels (2-4 μg/L) of MC were determined for July-Sept. without significant levels (> 50,000 cells/mL) of either Microcystis or Anabaena (MC sources) present. In September of 2005 a major Microcystis (primarily M. aeruginosa) bloom occurred in the St. Johns River between Jacksonville and Crescent City, Florida, a span of over 100 river miles. Microcystin concentrations ranged from non-detectable to over 1400 ug/L (70x greater than the World Health Organization alert level 2) indicating the patchiness of bloom events. Figure 3 shows the frequency of toxin levels reported for this event. This bloom event persisted from late August through the end of October and was concentrated on the eastern shore of the St. Johns River due to westerly winds. For the first time in the state of Florida, the St. Johns County Health Department issued a health advisory for the St. Johns River informing citizens to be aware of bloom scum formations and describing potential health risks. Also during this bloom event, the St. Johns River Water Management District sampled several times per week and issued weekly press releases to the media to alert the public as to where the bloom had concentrated and what stretches of the river may need to be avoided. Concurrent blooms of M. aeruginosa developed in the St. Lucie River, Lake Okeechobee, and the Caloosahatchee River. It
3

should also be noted that cylindrospermopsin was positively identified at sample sites located within this bloom area and shows the possibility of multiple toxins being produced simultaneously. Figures 4 and 5 show bloom accumulations at Governors’ Creek and Doctors Lake in the St. Johns River system. MCs are a family of liver toxins and potentially can act as tumor promoting agents (Falconer, 1991). MCs can be produced by numerous species of Microcystis as well as species of Planktothrix, and Anabaena. The most widely observed genus in Florida is, by far, Microcystis. MCs have been shown to cause animal mortalities during bloom events (as reviewed in Ressom et al. 1994) and were the causative agent responsible for the death of three dogs last year in Minnesota (unpublished data, Steve Heiskary; Environmental Outcomes Division, Minnesota Pollution Control Agency). As a rule, CYN is not observed nearly as often as MC in the St. Johns River and its basin and any detectable level (> 0.05 μg/L) is usually evidence for the presence of Cylindrospermopsis. As seen with MC, CYN was found more frequently during July-October. Lake Jesup had the highest (0.4 – 1.6 μg/L) levels of CYN (July-October) of any site monitored during this study. This data correlated well with the levels of Cylindrospermopsis observed during the same period . Palatka Pier , Lake Monroe, Lake George and Eagle Pt. were all found to have detectable levels (> 0.05 μg/L) of CYN present and significant levels (> 40,000 cells/mL) of Cylindrospermopsis. What was of particular interest was that Lake Jesup, with the highest CYN levels, did not have the highest Cylindrospermopsis cell count. Palatka Pier, Lake George, and Eagle Pt. all had cell counts higher than Lake Jesup and Drs. Lake not only had the highest Cylindrospermopsis cell count (> 375,000 cells/mL), but no detectable level of CYN. CYN is produced mainly by Cylindrospermopsis raciborskii. CYN is classified as a hepatotoxin but can affect other tissues such as the kidneys, adrenal glands, lungs, and intestines (Hawkins et al., 1985). CYN has also been shown to be genotoxic (Humpage et al., 2000) and, potentially, can act as a tumor promoter similar to that of MCs (Falconer and Humpage, 2001). The predominant cyanobacteria species responsible for the production of ANTX-A in northeast Florida is Anabaena circinalis but species of Aphanizomenon can also produce this compound. ANTX-A has been the least observed of the three toxins, but as a neurotoxin can be of greatest concern and has caused the only reported human death in the U.S. attributed to cyanotoxins. ANTX-A was not found at any detectable level (> 0.05 μg/L) for any of the sample sites included in this study, but species of Anabaena and other sources of ANTX-A continue to be documented. Palatka Pier , Lake George and Drs. Lake had Anabaena (primary ANTX-A source) cell counts > 50,000 cells/mL. This information, in addition to some of the Cylindrospermopsis data, reinforces the need for toxin monitoring as the only way of accurately determining the presence and level of cyanotoxins. CONCLUSIONS/RECOMMENDATIONS
4

Multiple hurricane events in the state of Florida complicated normal seasonal variation in 2004. The significance of those events to the severe Microcystis blooms of 2005 is uncertain, but given the occurrence of Microcystis blooms throughout Florida in 2005 and the precipitation levels associated with the hurricanes; the increased run-off may have significantly increased nutrient loads and coupled with the heat of the summer primed the middle and lower St Johns River Basin for the large blooms and toxin levels observed. As previously documented, populations of toxigenic cyanobacteria do persist in the St. Johns River. The effect that these toxins have on human health and the overall health of the river is not well understood. It is clear, based on the recent events, that the St. Johns River and its basin maintain the potential to experience significant toxin producing blooms when the necessary environmental conditions arise. A continuation of this sampling and monitoring study or something similar is recommended. If feasible, both an inshore and offshore sampling program should be implemented to cover the areas of greatest risk for human exposure. One way this might be performed is by the use of a public information system hotline that can accept phone calls from people who observe algal cell accumulations and instruct field personnel, for sampling purposes, as to where bloom events are occurring. GreenWater Laboratories does maintain a toll free number (1-877-TOX-ALGA) for such reports. The identification and quantification of dominant MC variants (i.e. LR, RR, etc.), particularly with Microcystis blooms of the size observed in 2005, would be highly recommended. In addition to providing further data it would also help in evaluating the level of toxicity and potential risk levels due to differences in toxicity among the different MC isomers. Production of β-N-methylamino-L-alanine (BMAA), a neurotoxic amino acid, has recently been associated with the majority of cyanobacteria genera. Microcystis, Anabaena, and Cylindrospermopsis raciborskii are certainly included in this group as well as any other cyanobacteria found in the St. Johns River and its basin. Cylindrospermopsis raciborskii actually produces some of the highest levels of BMAA. BMAA has been suggested as a possible cause of the amyotrophic lateral sclerosis/parkinsonism – dementia complex (ALS/PDC). BMAA was recently discovered in the brain tissues of nine Canadian Alzheimer’s patients, but was not detected in the brain tissues of 14 other Canadians who died of causes unrelated to neurodegeneration. (Cox et al., 2005). With the increased interest in BMAA due to its potential global human exposure, some preliminary determinations of BMAA levels in the St. Johns River should be of interest.
5

REFERENCES Burch, M. ISOC-HAB, 2005. Interagency International Symposium on Cyanobacterial harmful Algal Blooms. September 6-10, 2005, Research Triangle Park, NC. Cox, P., Banack, S., Murch, S., Rasmussen, U., Tien, G., Bidigare, R., Metcalf, J., Morrison, L., Codd, G., and Bergman, B. 2005 Diverse taxa of cyanobacteria produce β-N-methylamino-L-alanine, a neurotoxin amino acid. Proc. Natl. Acad. Sci. USA 102: 5074-5078. Falconer, I.R 1991 Tumor promotion and liver injury caused by oral consumption of cyanobacteria. Environ. Toxicol. Water Qual., 6(2), 177-184 Falconer, I., Bartram, J., Chorus, I., Kuiper-Goodman, T., Utkilen, H., Burch, M., and Codd, G. Safe levels and Safe Practices (Chapter 5) in Toxic Cyanobacteria in Water: a Guide to their Public health Consequences, Monitoring, and Management. Eds: I. Chorus and J. Bartram, E & FN Spon Publishers, London/New York, 1999. Falconer, I.R. and Humpage, A.R. 2001 Preliminary evidence for in vivo tumour initiation by oral administration of extracts of the blue-green alga Cylindrospermopsis raciborskii containing the toxin cylindrospermopsin. Environ. Toxicol. 16(2): 192-195. Hawkins, P. R., Runnegar, M. T. C., Jackson, A. R. B. and.Falconer, I. R. 1985 Severe hepatotoxicity caused by the tropical cyanobacterium (blue-green alga) Cylindrospermopsis raciborskii (Woloszynska) Seenaya and Subba Raju isolated from domestic water supply reservoir. Appl. Environ. Microbiol. 50, 1292-1295. Humpage, A.R., Fenech, M., Thomas, P. and Falconer, I.R. 2000 Micronucleus induction and chromosome loss in transformed human white cells indicate clastogenic and aneugenic action of the cyanobacterial toxin, cylindrospermopsin. Mutation Res., 472: 155-161. Ressom, R., Soong, F.S., Fitzgerald, J., Turczynowicz, L., El Saadi, O., Roder, D., Maynard, T. and Falconer, I. 1994 Health Effects of Toxic Cyanobacteria (Blue-Green Algae). Australian National Health and Medical Research Council, Looking Glass Press, 108 pp.

Figure 1: Cyanobacteria in Doctor's Lake (2005)
100
1,000
10,000
100,000
1,000,000
10,000,000
5/10/05 5/30/05 6/19/05 7/9/05 7/29/05 8/18/05 9/7/05 9/27/05 10/17/05 11/6/05
Date of Collection
Cel
ls/m
l
TotalCYANO
PtoxCYANO

Figure 2: Cyanobacteria in Eagle Harbor (2005)
100
1,000
10,000
100,000
1,000,000
5/10/05 5/30/05 6/19/05 7/9/05 7/29/05 8/18/05 9/7/05 9/27/05 10/17/05 11/6/05
Date of Collection
Cel
ls/m
l
TotalCYANO
PtoxCYANO

Figure 3: Cyanobacteria from Palatka Pier (2005)
100
1,000
10,000
100,000
1,000,000
5/10/05 5/30/05 6/19/05 7/9/05 7/29/05 8/18/05 9/7/05 9/27/05 10/17/05 11/6/05
Date of Collection
Cel
ls/m
l TotalCYANO
PtoxCYANO

Figure 4: Cyanobacteria in Crescent Lake (2005)
100
1,000
10,000
100,000
1,000,000
5/10/05 5/30/05 6/19/05 7/9/05 7/29/05 8/18/05 9/7/05 9/27/05 10/17/05 11/6/05
Date of Collection
Cel
ls/m
l
TotalCYANOPtoxCYANO

Figure 5: Cyanobacteria in Lake George (2005)
100
1,000
10,000
100,000
1,000,000
5/10/05 5/30/05 6/19/05 7/9/05 7/29/05 8/18/05 9/7/05 9/27/05 10/17/05 11/6/05
Date of Collection
Cel
ls/m
l
TotalCYANOPtox CYANO

Figure 6A: Cyanobacteria in Hickory Point (Bath) (2005)
100
1,000
10,000
100,000
1,000,000
10,000,000
5/10/05 5/30/05 6/19/05 7/9/05 7/29/05 8/18/05 9/7/05 9/27/05 10/17/05 11/6/05
Date of Collection
Cel
ls/m
l
TotalCYANOPtoxCYANO

Figure 6B: Cyanobacteria at Hickory Point (Dock) (2005)
100
1,000
10,000
100,000
1,000,000
10,000,000
5/10/05 5/30/05 6/19/05 7/9/05 7/29/05 8/18/05 9/7/05 9/27/05 10/17/05 11/6/05
Date of Collection
Cel
ls/m
l
TotalCYANO
PtoxCYANO

Figure 7: Cyanobacteria in Lake Monroe (2005)
100
1,000
10,000
100,000
1,000,000
5/10/05 5/30/05 6/19/05 7/9/05 7/29/05 8/18/05 9/7/05 9/27/05 10/17/05 11/6/05
Date of Collection
Cel
ls/m
l
TotalCYANOPtoxCYANO

Figure 8: Cyanobacteria in Lake Jesup (2005)
100
1,000
10,000
100,000
1,000,000
10,000,000
5/10/05 5/30/05 6/19/05 7/9/05 7/29/05 8/18/05 9/7/05 9/27/05 10/17/05 11/6/05
Date of Collection
Cel
ls/m
l
TotalCYANOPtoxCYANO

Figure 9: Cyanobacteria in Lake Washington (2005)
100
1,000
10,000
100,000
5/10/05 5/30/05 6/19/05 7/9/05 7/29/05 8/18/05 9/7/05 9/27/05 10/17/05 11/6/05
Date of Collection
Cel
ls/m
l
TotalCYANOPtoxCYANO

Figure 10: Potentially Toxigenic Algae at Palatka Pier (2005)
0
50,000
100,000
150,000
200,000
250,000
300,000
5/8/05 6/7/05 7/7/05 8/6/05 9/5/05 10/5/05 11/4/05
Date of Collection
Cel
ls/m
l
Anabaena
Aphanizomenon
Cylindrospermopsis
Microcystis
Planktothrix
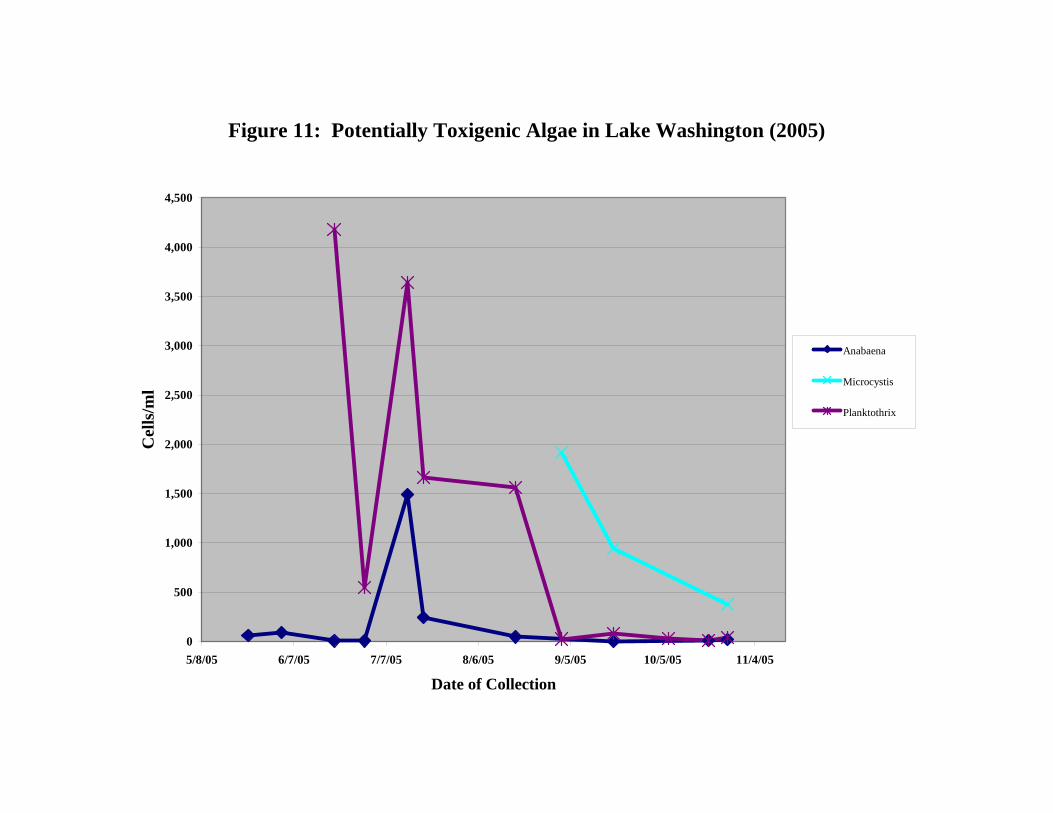
Figure 11: Potentially Toxigenic Algae in Lake Washington (2005)
0
500
1,000
1,500
2,000
2,500
3,000
3,500
4,000
4,500
5/8/05 6/7/05 7/7/05 8/6/05 9/5/05 10/5/05 11/4/05
Date of Collection
Cel
ls/m
l
Anabaena
Microcystis
Planktothrix

Figure 12: Potentially Toxigenic Algae in Lake Monroe (2005)
0
5,000
10,000
15,000
20,000
25,000
30,000
35,000
40,000
45,000
5/8/05 6/7/05 7/7/05 8/6/05 9/5/05 10/5/05 11/4/05
Date of Collection
Cel
ls/m
l
Anabaena
Aphanizomenon
Cylindrospermopsis
Microcystis
Planktothrix
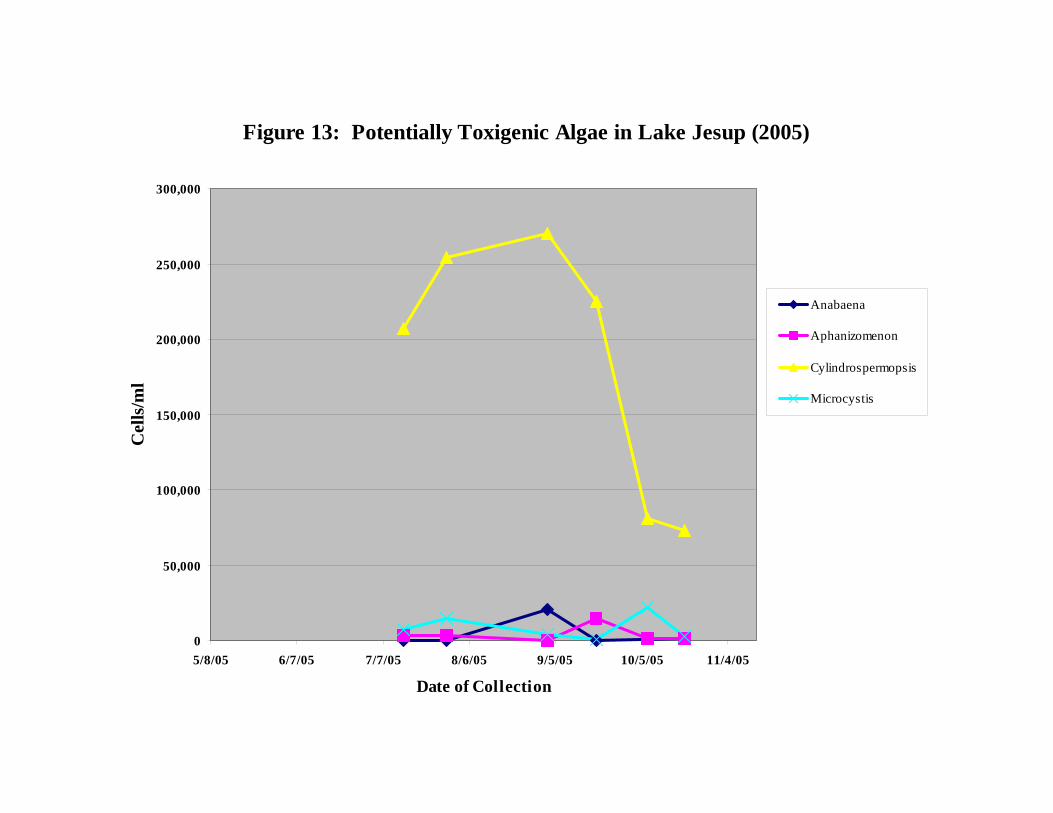
Figure 13: Potentially Toxigenic Algae in Lake Jesup (2005)
0
50,000
100,000
150,000
200,000
250,000
300,000
5/8/05 6/7/05 7/7/05 8/6/05 9/5/05 10/5/05 11/4/05
Date of Collection
Cel
ls/m
l
Anabaena
Aphanizomenon
Cylindrospermopsis
Microcystis
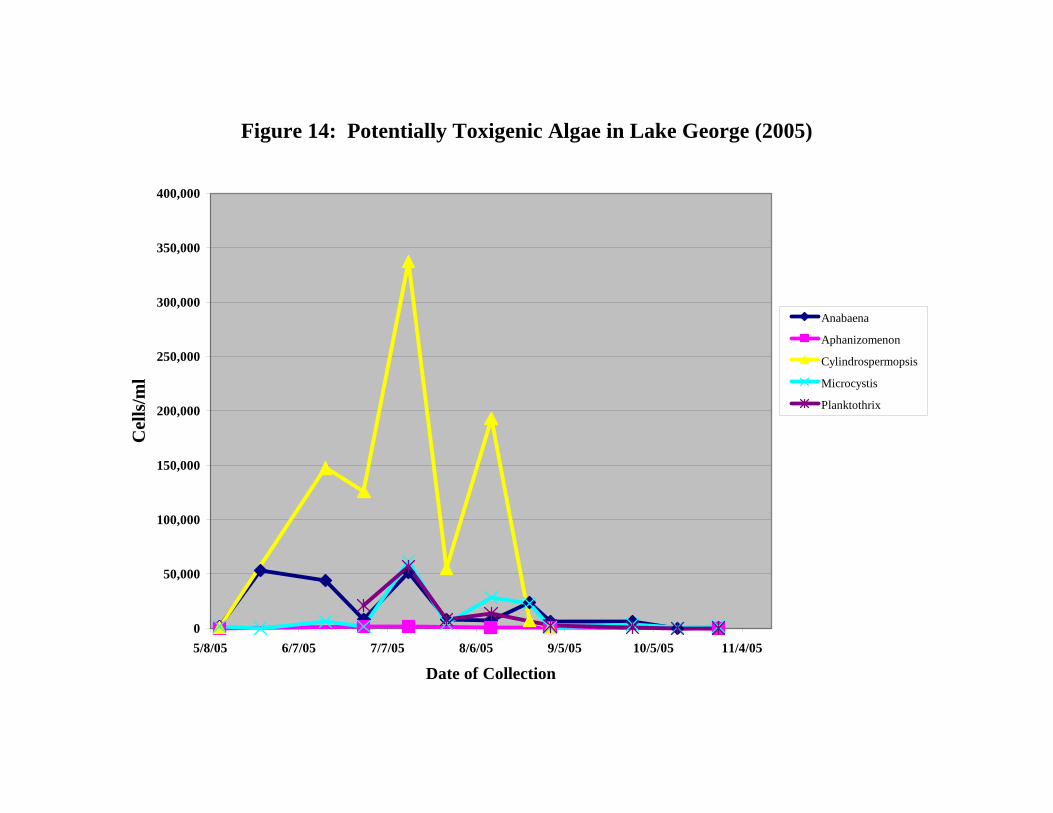
Figure 14: Potentially Toxigenic Algae in Lake George (2005)
0
50,000
100,000
150,000
200,000
250,000
300,000
350,000
400,000
5/8/05 6/7/05 7/7/05 8/6/05 9/5/05 10/5/05 11/4/05
Date of Collection
Cel
ls/m
l
Anabaena
Aphanizomenon
Cylindrospermopsis
Microcystis
Planktothrix

Figure 15A: Potentially Toxigenic Algae at Hickory Point (Bath) (2005)
0
100,000
200,000
300,000
400,000
500,000
600,000
5/8/05 6/7/05 7/7/05 8/6/05 9/5/05 10/5/05 11/4/05
Date of Collection
Cel
ls/m
l
Anabaena
Aphanizomenon
Cylindrospermopsis
Microcystis
Planktothrix
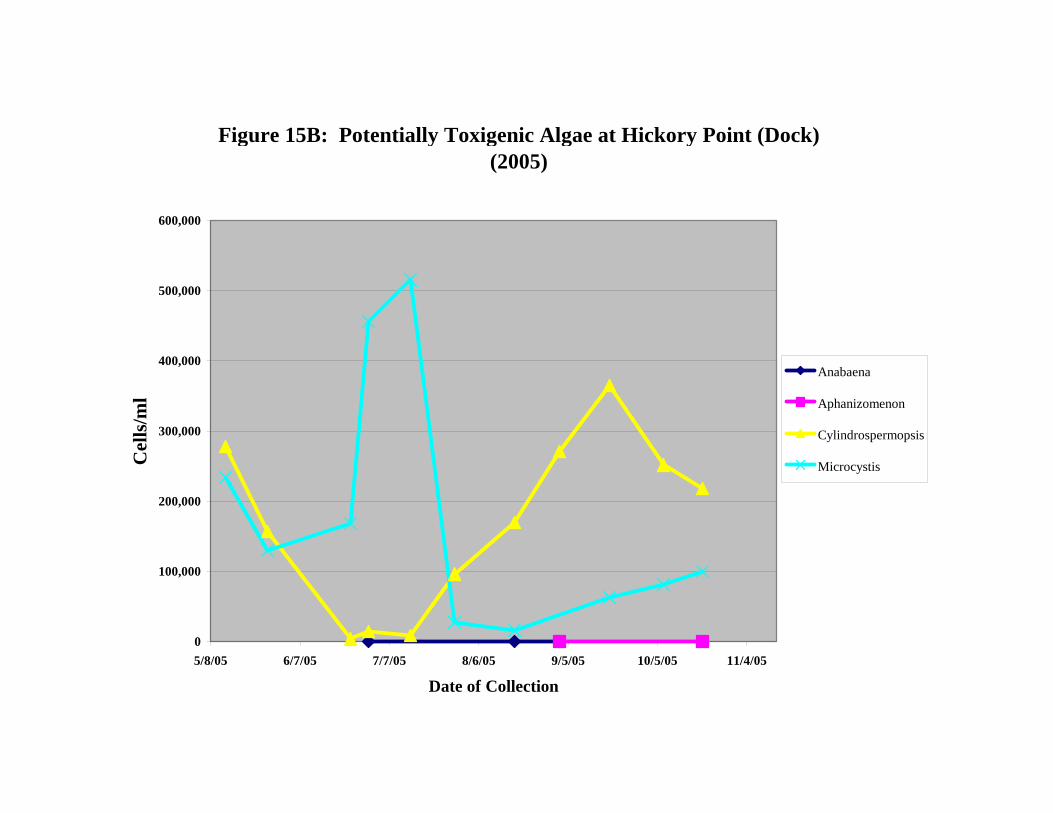
Figure 15B: Potentially Toxigenic Algae at Hickory Point (Dock) (2005)
0
100,000
200,000
300,000
400,000
500,000
600,000
5/8/05 6/7/05 7/7/05 8/6/05 9/5/05 10/5/05 11/4/05
Date of Collection
Cel
ls/m
l
Anabaena
Aphanizomenon
Cylindrospermopsis
Microcystis

Figure 16: Potentially Toxigenic Algae in Eagle Harbor (2005)
0
100,000
200,000
300,000
400,000
500,000
600,000
700,000
800,000
900,000
5/8/05 6/7/05 7/7/05 8/6/05 9/5/05 10/5/05 11/4/05
Date of Collection
Cel
ls/m
l
Anabaena
Aphanizomenon
Cylindrospermopsis
Microcystis
Planktothrix

Figure 17: Potentially Toxigenic Algae in Doctor's Lake (2005)
0
50,000
100,000
150,000
200,000
250,000
300,000
350,000
400,000
5/8/05 6/7/05 7/7/05 8/6/05 9/5/05 10/5/05 11/4/05
Date of Collection
Cel
ls/m
l
Anabaena
Aphanizomenon
Cylindrospermopsis
Microcystis
Planktothrix

Figure 18: Potentially Toxigenic Algae in Crescent Lake (2005)
0
50,000
100,000
150,000
200,000
250,000
5/8/05 6/7/05 7/7/05 8/6/05 9/5/05 10/5/05 11/4/05
Date of Collection
Cel
ls/m
l
Anabaena
Microcystis
Planktothrix
Cylindrospermopsis

Figure 19: Microcystin Concentration Levels
02468
101214161820
May '05 June '05 July '05 Aug '05 Sept '05 Oct '05
Date of Collection
Con
cent
ratio
n, (u
g/L
)
Drs LakeEagle PtPalatkaL GeorgeCrescent LL MonroeL Wash.Hickory PtL Jesup

Figure 20: Cylindrospermopsin Concentration Levels
0
0.5
1
1.5
2
May '05 June '05 July '05 Aug '05 Sept '05 Oct '05
Date of Collection
Con
cent
ratio
n, (u
g/L
) Drs LakeEagle PtPalatkaL GeorgeCrescent LL MonroeL Wash.L Jesup

Figure 21: Frequency of Microcystin Concentrations Analyzed from Water Samples Collected by the St. Johns River Water Management District from a Microcystis aeruginosa bloom in the St. Johns River, September - October 2005.
Note: Values on the X-axis are a range of values up to but not including the next higher number
Sample size (n) = 66 water samples
0
10
20
30
Perc
ent o
f Tot
alSa
mpl
es C
olle
cted
ND 1 10 50 100 500 1000
Concentration Level (ug/L)

Table 1: Sample Sites for Toxigenic Cyanobacterial Monitoring Project
Sample Sample Latitude Longitude SamplingNo. Site Name Agency
1 Doctors Lake 30-06-35 81-44-47 LSJRB/SJRWMD2 Eagle Pt. (Shands Bridge) 29-58-25 81-37-25 LSJRB/SJRWMD3 Palatka Pier 29-39-01.7 81-37-18.9 LSJRB/SJRWMD4 Crescent Lake 29-30-12 81-30-15 LSJRB/SJRWMD5 Lake George 29-22-42.3 81-39-03.8 LSJRB/SJRWMD6 Little Lake Harris (Hickory Pt. - 2) 28-44.596 81-46.046 GWL7 Lake Monroe 28-48.952 81-16.372 GWL8 Lake Jesup 28-42.941 81.14.481 GWL9 Lake Washington 28-08.825 80-44.043 GWL/USJRB-SJRWMD
LSJRB = Lower St. Johns River BasinUSJRB = Upper St. Johns River BasinSJRWMD = St. Johns River Water Management DistroctGWL = GreenWater laboratories/CyanoLab

Map of Samples Sites

Table 2: Frequency of Water Samples Above Suggested World Health Organization Guideline/Monitoring Levels
Sample Sample Frequency (%) > Frequency (%) > Maximum SamplingNo. Site Name 20,000 cells/ml 100,000 cells/ml Concentration Events
1 Doctors Lake 64 36 500,000 142 Eagle Pt. (Shands Bridge) 31 31 823,000 133 Palatka Pier 43 29 481,000 144 Crescent Lake 55 27 260,000 115 Lake George 58 33 507,000 126 Little Lake Harris (Hickory Pt. - Beach) 100 100 675,000 11
Little Lake Harris (Hickory Pt. - Docks) 100 100 527,000 117 Lake Monroe 18 0 44,000 118 Lake Jesup 100 83 295,000 69 Lake Washington 0 0 5,100 11