Embed Size (px)
Citation preview

Toxicity and Mode of Action of the Pharmaceutical
Fungicides Fluconazole and Terbinafine to Freshwater
Algae
Master of Science Thesis
ASHLEY CURRAN PALOMAKI
Department of Chemical and Biological Engineering
CHALMERS UNIVERSITY OF TECHNOLOGY
Göteborg, Sweden, 2010
Department of Plant and Environmental Sciences
UNIVERSITY OF GOTHENBURG
Göteborg, Sweden, 2010

Toxicity and Mode of Action of the Pharmaceutical
Fungicides Fluconazole and Terbinafine to Freshwater
Algae
Thesis work was performed at Gothenburg University in the department of Plant and Environmental Sciences
ASHLEY CURRAN PALOMAKI
Department of Chemical and Biological Engineering
CHALMERS UNIVERSITY OF TECHNOLOGY
Göteborg, Sweden 2010

Toxicity and Mode of Action of the Pharmaceutical Fungicides Fluconazole and Terbinafine to Freshwater
Algae
© ASHLEY CURRAN PALOMAKI, 2010
Department of Chemical and Biological Engineering
Chalmers University of Technology
S-412 96 Göteborg
Sweden
Telephone + 46(0)31-772 1000
Department of Chemical and Biological Engineering
Göteborg, Sweden 2010


ABSTRACT Several antimycotics (pharmaceutical fungicides) are currently registered for use in Sweden, and are used to
treat human and veterinary fungal infections perorally or topically. Fluconazole, which is an antimycotic from
the imidazole group, and terbinafine, which is an allylamine antimycotic, are among the compounds currently
registered. The toxicity of both terbinafine and fluconazole were studied first by conducting a single-species
algal assay with the green algae, Pseudokirchneriella subcapitata. Terbinafine was highly toxic to the algae,
with an EC50 (concentration required to lower growth rate by 50%) of 90 nM. The highest concentration at
which there was no statistical difference from the controls (NOEC) was 10 nM, and the lowest concentration
at which a statistically significant difference was observed (LOEC) was 20 nM. Fluconazole was much less
toxic to the algae compared to terbinafine. The LOEC for fluconazole was 64 µM, and even at such a high
concentration, the growth rate was inhibited by less than 10%. The NOEC for fluconazole was 50 µM. At the
highest concentration tested, 100 µM, the percent inhibition of growth rate was approximately 12%. Both
terbinafine and fluconazole inhibit fungal growth by blocking enzymes necessary for sterol biosynthesis.
Terbinafine inhibits squalene epoxidase, and fluconazole inhibits cytochrome P-450-dependent 14α
demethylase (P-450DM). To determine whether the growth inhibition observed in the assay was a result of
inhibition of sterol biosynthesis, sterols were extracted and analyzed using GC-MS. For terbinafine, an
accumulation of squalene was observed, starting at approximately 50 nM. For fluconazole, an accumulation
of 14α-sterols was observed, starting at approximately 10 µM, indicating that these drugs also influence sterol
biosynthesis in algae. The toxicity of the two pharmaceuticals to natural algal communities was also assessed.
Terbinafine was highly toxic to the green algae in the communities, with an EC50 of 20 nM. The diatoms were
less sensitive to terbinafine and no effects on this algal class could be noted, even in the highest treatment, of
100 nM. Due to its toxicity to both Pseudokirchneriella subcapitata and green algal communities, terbinafine
should be labeled as „very toxic to aquatic life.‟ Both the green algae and the diatoms did not appear to be
sensitive to the fluconazole treatments, even at the highest tested concentration, 100 µM. However, due to the
lack of replicates associated with this data, little can be said concerning whether any trends were observed.

TABLE OF CONTENTS
1.0 Introduction .................................................................................................................................................. 1
2.0 Theory .......................................................................................................................................................... 2
2.1 Pharmaceuticals in the Environment ....................................................................................................... 2
2.2 Terbinafine and Fluconazole in the Environment .................................................................................... 3
2.3 Single-Species Algal Assays ................................................................................................................... 4
2.4 Periphyton Communities and SWIFT Tests ........................................................................................... 6
2.5 Fungicide Classification and the Mode of Action of Terbinafine and Fluconazole ................................. 8
2.6 Sterol Synthesis and Function .................................................................................................................. 9
3.0 Materials and Experimentation/Method ..................................................................................................... 14
3.1 Test organisms and culture conditions ................................................................................................... 14
3.2 Growth inhibition test ............................................................................................................................ 14
3.3 Determination of cell count ................................................................................................................... 14
3.4 Extraction and GC/MS analysis of sterols ............................................................................................. 15
3.4 Extraction and HPLC analysis of pigments ........................................................................................... 16
3.5 SWIFT Tests .......................................................................................................................................... 16
4.0 Results ........................................................................................................................................................ 18
4.1 Single Species Assays – Biomass Measurements .................................................................................. 18
4.1.1 Range-Finding Experiments: Fall 2009 .......................................................................................... 18
4.1.2 Terbinafine Experiment: December 2009 ....................................................................................... 20
4.1.3 Control Experiments: January 2010 ................................................................................................ 21
4.1.4 Terbinafine Experiments: Spring 2010 ........................................................................................... 22
4.1.5 Fluconazole Experiments: Spring 2010 .......................................................................................... 24
4.2 Single-Species Assays – Pigment Measurements .................................................................................. 28
4.2.1 Effects on Pigments - Terbinafine .................................................................................................. 28
4.2.2 Effects on Pigments - Fluconazole ................................................................................................. 29
4.2 Single-Species Assays – Sterol Measurements ...................................................................................... 31
4.2.1 Effects on Sterols - Terbinafine ...................................................................................................... 31
4.2.2 Effects on Sterols - Fluconazole ..................................................................................................... 33
4.3 SWIFT Assay – Pigment Measurements ............................................................................................... 36
4.3.1 Effects on Periphyton Pigments in the SWIFT Test - Terbinafine ................................................. 36

4.3.2 Effects on Periphyton Pigments in the SWIFT Test - Fluconazole ................................................ 38
5.0 Discussion .................................................................................................................................................. 41
6.0 Conclusions ................................................................................................................................................ 46
6.1 Experimental Conclusions ..................................................................................................................... 46
6.1.1 Single Species Assays ..................................................................................................................... 46
6.1.2 SWIFT Assay ................................................................................................................................. 46
6.2 Overall Conclusions............................................................................................................................... 46
References and Sources .................................................................................................................................... 48
Appendix One .................................................................................................................................................. 51

LIST OF ABBREVIATIONS
Δ7-chondrillastenol 24-ethyl-5α-cholest-7-en-3β-ol
Chondrillasterol 24-ethyl-5α-cholest,22-dien-3β-ol
DD/(DD+DT) Measure of response of diatom light regulation pigments. Diadanoxanthin content,
divided by the sum of diadanoxanthin and diatoxanthin
EC50 The concentration at which 50% inhibition occurs
EC95 The concentration at which 95% inhibition occurs
Ergostenol 24-methyl-5α-cholest-7-en-3β-ol
EMA European Medicine‟s Agency
FSC Forward scatter
GC/MS Gas Chromatography Mass Spectroscopy
HPLC High performance liquid chromatography
LC-MS-MS Liquid chromatography coupled with tandem mass spectrometry
LOEC Lowest observed effect concentration
LOQ Limit of Quantification
MIC Minimum inhibitory concentration
NOEC No observed effect concentration
OECD Organization for Economic Cooperation and Development
PNEC Predicted no-effect concentration
P. Subcapitata Pseudokirchneriella subcapitata
SPE Solid-phase extraction
SSC Side scatter
V/VAZ Measure of response in green algal light regulation pigments. Violaxanthin content
divided by the sum of violaxanthin, antheraxanthin, and zeaxanthin
WWTP Wastewater Treatment Plant

1
1.0 INTRODUCTION
Several antimycotics (pharmaceutical fungicides) are currently registered for human and veterinary use in
Sweden, and are used to treat fungal infections orally or topically. Fluconazole, which is an antimycotic from
the imidazole group, and terbinafine, which is an allylamine antimycotic, are among the compounds currently
registered. Via multiple routes, including wastewater treatment plants and septic tanks, many pharmaceuticals
eventually make their way into the environment.[1]
Data on the occurrence of antimycotics in the environment is limited. Surveys of wastewater treatment plants
(WWTP) for these compounds have been conducted in Sweden and in Switzerland. In Sweden, five WWTPs
were surveyed. Fluconazole was detected at similar levels in the raw influent and in the treated effluent, at
concentrations ranging between <5 and 140 ng/L, indicating that sewage treatment does not remove this
compound. Terbinafine, was found to be effectively removed during treatment, and was detected in sewage
sludge.[2] In Switzerland, ten WWTPs were surveyed in 2007 for azole fungicides. Fluconazole was detected
in all of the WWTP influent streams studied, at concentrations ranging between 10 and 110 ng/L. Similarly to
the study conducted in Sweden, fluconazole was detected at similar concentrations in the effluent.[3]
Freshwater environmental surveys for these compounds have only been conducted in Switzerland. In 2007,
the presence of fluconazole was measured in nine lakes in Switzerland. Fluconazole was detected in the
majority of the lakes sampled, at concentrations below 10 ng/L.[3] Terbinafine was not included in the study.
The effects that low levels of pharmaceuticals might cause in freshwater ecosystems are not well understood.
In algae, the biosynthesis of sterols, which are lipids that help to form the cell membrane, is an essential
metabolic process. Azole fungicides block sterol synthesis by inhibiting cytochrome P450-dependent 14 -
demethylation.[4] Depletion of end-product sterols and accumulation of sterol intermediates, such as 14-
methylated sterols, is believed to result in ceased growth and at higher concentrations cell death, primarily
because of comprised cell wall integrity and function.[5,6] Terbinafine acts by inhibiting the early steps of
sterol biosynthesis. Allylamines inhibit squalene epoxidase, which catalyzes squalene epoxidation. In the
presence of terbinafine, squalene is accumulated and other sterol intermediates are absent.[7] In addition to a
compromised cell wall and function from a depletion of end-product sterols, fungal cell death is believed to
be due to the toxic effect of squalene.[8] Simply based on their mode of action, it can be hypothesized that
these pharmaceutical fungicides may be toxic to freshwater micro-algal communities.
The aim of this master‟s thesis was to determine whether one antimycotic from the imidazole group,
fluconazole, and one allylamine antimycotic, terbinafine, are toxic to freshwater algae, to compare their
toxicity and to evaluate their mode of action in algae. The toxicity was first measured to one species of green
algae, Pseudokirchneriella subcapitata (P. subcapitata), in the laboratory. A 72-hour assay was conducted for
each compound and toxicity to both the growth rate and the total biomass of the green algae was determined
by measuring the algal cell number daily using a flow cytometer. In addition, pigment samples were taken at
the end of the experiment. Sterol samples were also taken at the end of each experiment, to assess changes
occurring in the sterol composition. The goal was to determine whether the mode of inhibition for fluconazole
and terbinafine, which had previously only been described in fungi, also exists in algae. The results from the
single species algal assays were used to plan a toxicity test with natural algal communities. The natural
community was sampled from the stream Mölndalsån near the town of Landvetter. Changes in the community
structure were analyzed by sampling for pigments at the end of the test. Sterol samples were also taken so that
the mode of action on a community level could be analyzed.

2
2.0 THEORY
2.1 PHARMACEUTICALS IN THE ENVIRONMENT
Pharmaceuticals enter the environment via multiple routes, as shown in Figure 1. Pharmaceuticals used to
treat humans are applied topically or ingested, absorbed, metabolized, and then excreted, where they enter the
sewage stream and into wastewater treatment plants (WWTP). The physical chemical properties of the
compound largely determine its fate in the WWTP. Hydrophilic compounds are more likely to pass through
the WWTP, while hydrophobic compounds are more likely to partition to the sewage sludge. If the sewage
sludge is land-applied, these pharmaceuticals compounds may contaminate soil, and water bodies if there is
runoff.[1] Pharmaceuticals can also enter wastewater treatment from the manufacturing process.
In addition, there are more direct routes of entry for pharmaceuticals in the environment. A fraction of the
pharmaceuticals used to treat humans may contaminate soil and ground water if septic systems are used. If
pharmaceuticals, such as antibiotics, are used to prevent illness and disease to fish in aquaculture, a portion of
those compounds will be directly discharged to water bodies. In the USA, between approximately 92,500 and
196,400 kg of antibacterials per year are used in aquaculture.[1] Pharmaceuticals are used for similar purposes
with livestock. Livestock waste, which contains low-levels of pharmaceuticals or their degradation products,
is generally land-applied, and can contaminate both soil and fresh-water bodies. In the USA, between
approximately 8.5 and 11.2 million kg of antibacterials are used to treat livestock annually.[1] Lastly,
pharmaceuticals used to treat family pets, can contaminate the environment if pet waste is discharged to soil.
Figure 1. Illustration of different pathways, by which pharmaceuticals contaminate soil and water.[1]
The concentrations of pharmaceuticals in freshwater and saltwater bodies are not well quantified, due to an
insufficient number of surveys, and historically, due to poor analytical techniques. However, due to the
development of analytics such as liquid chromatography coupled with tandem mass spectrometry (LC-MS-
MS), detection limits are lower and a growing number of studies quantify concentrations of chemicals in
wastewater treatment plants, soils, surface waters, and ground water.[1]

3
2.2 TERBINAFINE AND FLUCONAZOLE IN THE ENVIRONMENT
The presence of terbinafine and fluconazole in both WWTP influent, effluent, and sewage sludge was
investigated at five Swedish WWTPs in 2007.[2] The WWTPs sampled were Stockholm (Henriksdal),
Gothenburg (Ryaverket), Umeå, Alingsås (Nolhaga), and Bollebygd. These WWTPs differ in both size and
catchment area. [2]
Terbinafine was detected below the limit of quantification (LOQ) in both the raw sewage water and the final
effluent at all five WWTPs. In the digested, dewatered sludge, terbinafine was detected at concentrations
ranging between 4 and 30 µg/kg at three of the WWTPs. At the other two WWTPs, terbinafine was detected
below the LOQ.[2]
Fluconazole was detected above the LOQ in the raw sewage water at one of the WWTPs tested, at a
concentration of 90 ng/L. Fluconazole was detected above the LOQ in the final effluent at two of the WWTPs
tested, at concentrations of 140 and 100 ng/L. Fluconazole was not detected above the LOQ in the digested
sewage sludge at any of the WWTPs tested. Sewage water was also collected from the Umeå County Hospital
during this time-period, and fluconazole was detected, at a concentration of 570 ng/L.[2]
In addition, raw sewage water, raw sewage water particles, raw sludge, and digested dewatered sludge was
collected from the Umeå WWTP in April 2008 to assess the fate of the chemicals during the treatment
process. Terbinafine was not detected in the raw sewage water or the final effluent; however, it was detected
in the raw sludge, at a concentration of 40 µg/kg. Terbinafine appears to be effectively removed from the
water during treatment. However, as discussed in Section 2.1, if the sewage sludge is land applied, terbinafine
may still enter the environment. Fluconazole was detected at similar levels in the influent and effluent, at
concentrations of 120 and 100 ng/L, respectively. Fluconazole was not detected above the LOQ in the raw
sewage particles, raw sludge, or the digested dewatered sludge. It was the only compound investigated that
passes directly through the WWTP. [2]
In Sweden, approximately 43 kg of terbinafine, and 121 kg of fluconazole is used per year. These figures are
based on Apoteket AB‟s sales during 2007.[2] Based on the Swedish sales, in combination with the daily
defined dose, the predicted environmental concentration in surface water was calculated to be 6 ng/L for
terbinafine according to the European Medicine‟s Agency (EMA) guidelines Phase I.[36] However, the EMA
guidelines assume that retention in sewage sludge does not occur, so based on the previously discussed
findings, this estimate is likely too high. If the mean mass flow values of terbinafine through the WWTPs are
normalized to the number of people connected to the WWTP, 1% of the terbinafine used appears in the
digested dewatered sewage sludge. This may be due to the fact that terbinafine is generally administered
topically and so only a small percentage of the drug is actually discharged to the WWTP.[2]
Based on the Swedish sales value for fluconazole, in combination with the daily defined dose, the predicted
environmental concentration in surface water was calculated to be 20 ng/L (0.065 nM), according to the
EMA. Fluconazole is believed to be persistent in the environment.[9] Approximately 80% of the dose taken
perorally is excreted in the urine. If the mean mass flow values of fluconazole through the WWTPs are
normalized to the number of people connected to the WWTP, 53% of the purchased fluconazole appears in
the final effluent.[2]
In Switzerland, wastewater samples were sampled for azole fungicides from ten WWTPs located in the
Canton of Zürich.[3] These WWTPs serve between 10,000 and 370,000 people. Fluconazole was detected in
all of the WWTP influents, at concentrations ranging from 32 to 109 ng/L. Fluconazole was detected at

4
similar levels in all of the WWTP effluents, at concentrations ranging from 28 to 83 ng/L. For a one week
period, influent and effluent concentrations were monitored at the WWTP in Zürich. Fluconazole
concentrations were consistent with those measured previously in both the influent and the effluent, providing
further evidence that fluconazole is not removed during wastewater treatment.[3]
In addition, surface water from nine Swiss Midland lakes (Walensee, Vierwaldstättersee, Zürichsee,
Sempachersee, Hallwilersee, Zugersee, Baldeggersee, Pfäffikersee, and Greifensee) was sampled, at the
outflow of each lake. Fluconazole was detected in six of the lakes, in the low ng/L range (<10 ng/L).[3]
A summary of the environmental data described in this section for fluconazole and terbinafine, converted to
nM concentrations (and nM/kg, where appropriate), is included in Table One.
Table 1
Summary of Data on the Occurrence of Fluconazole and
Terbinafine in the Environment
Location Concentration
Terbinafine
Sewage Sludge 31 nM/kg[2]
Fluconazole
Wastewater Treatment Plant Influent 0.1 - 0.39 nM[2,3]
Wastewater Treatment Plant Effluent 0.09 - 0.46 nM[2,3]
Hospital Sewage Water 1.9 nM[2,3]
Lake Surface Water <0.03 nM[3]
2.3 SINGLE-SPECIES ALGAL ASSAYS
Algae play an important role in primary production and energy-cycling worldwide. Algae grow in the
phototrophic zone, i.e. where the light is able to penetrate, in all of the world‟s oceans and seas, which cover
approximately two-thirds of the planet. They are also present on shores and coasts, and in freshwater bodies.
Algae account for approximately fifty percent of the primary production in the world. Especially aquatic
organisms depend upon the solar energy captured by algae.[9] Thus the functions of algal communities is
critical to the health of ecosystems.
When pollutants are introduced into an ecosystem the response by the organisms living within the ecosystem
is species-specific. There is no single species that can be considered representative of how all the organisms
in the ecosystem will respond. Toxicity results for invertebrates and fish were historically considered to be
representative for algae, but this is no longer considered valid. Algae have been found to be more sensitive
than invertebrates and fish to several heavy metals, pulp mill and industrial effluents, pesticides, and other
chemicals.[10] Thus, algal toxicity tests are necessary for the hazard and risk assessment of chemicals.
Single-species algal assays are relatively easy to perform in the laboratory and are inexpensive. Static tests are
conducted over a time-period ranging from 72 to 96 hours with an exponentially growing algal population.
Although these tests are considered acute (short-term) from a regulatory perspective[11], it can be argued that
they are chronic (long-term) because the effects are assessed over several generations. The tests are conducted
under conditions of controlled temperature, light and initial pH. Filtered oxygen and carbon dioxide are
bubbled through the test-medium. Species for testing are selected primarily on availability and ease of
culturing.

5
Pseudokirchneriella subcapitata (P. subcapitata), a green algae, is one of the most frequently used species. P.
subcapitata belongs to the algal class, Chlorophyceae. P. subcapita is kidney shaped, as shown in Figure 2.
This organism was first isolated from the river Nitelva in Norway in 1959.[12] The organism was originally
mischaracterized as a Selenastrum, and was named Selenastrum capricornutum. However, as the organism is
not actually a true Selenastrum, but is more closely related to Kirchneriella, it was renamed as
Pseudokirchneriella subcapitata.[12]
Figure 2. Picture of Pseudokirchneriella subcapitata, taken with a microscope.
Freshwater blue-green algae and diatoms are used less frequently than P. subcapitata and other species of
green algae because they are more difficult to culture. However, the difference in toxicity between these
species can vary by several orders of magnitude so the toxicity of compounds to blue-green algae and diatoms
should be measured as well.[10]
The sterol composition of P. subcapitata is reported to consist predominately of three sterols, all of which are
phytosterols (which, as opposed to e.g. cholesterol, contains a methyl or ethyl group in the side chain): 24-
methyl-5α-cholest-7-en-3β-ol (ergostenol), 24-ethyl-5α-cholest-7-en-3β-ol (Δ7-chondrillastenol), and 24-
ethyl-5α-cholest,22-dien-3β-ol (chondrillasterol). These three sterols comprise approximately 95% of the total
sterol composition of P. subcapitata. Δ7-chondrillastenol, has been reported to be the most dominant sterol,
accounting for approximately 65% of the sterol composition; ergostenol and chondrillaterol comprise
approximately 25% and 15%, respectively, of the total sterol content.[13]
Pollutants can have several effects on algae, including growth inhibition, growth stimulation, morphological
and physiological changes. The effects of growth inhibition and growth stimulation can be measured by
comparing either the growth rate or final biomass to that of the controls (see equations at the end of the
section). The algal cell number can be determined by counting the number of cells in a defined volume, using
for example a microscope, or flow-cytometer. The algal cell number and biomass can also be indirectly
estimated by monitoring cellular constituents such as chlorophyll a; however, if the toxicant induces
physiological or morphological changes such as increased cell-size, this may not be an accurate indicator of
the algal cell number.[10]
There are several ways to present the results of an algal toxicity test. The parameters most frequently used are
the concentration which causes 50% inhibition (EC50) and the lowest concentration in which no statistically
significant effect is observed (NOEC). The relevance of these parameters for predicting an environmentally
safe level (a so-called PNEC, predicted no effect concentration) is currently debated.[10] Reports of significant
inter- and intra-laboratory variation with reference toxicants are one of the reasons for the debate.[10,32,33] In
the new guidelines (OECD 2006 and ISO 8692), the use of growth rate, rather than biomass to calculate end-

6
point parameters is recommended as a means to reduce this variation.[31,32] Furthermore, a PNEC has to
consider the much higher biological, physical-chemical and spatiotemporal complexity of ecosystems
compared to laboratory single species toxicity assays. For estimating, the quality of single species toxicity
data available (number of species from different trophic levels, acute or chronic exposure, etc.), determines
the size of the extrapolation. As an example from the European Technical Guidance document, if only acute
toxicity data for one freshwater algal species is at hand, the observed EC50 is divided with a factor of 10,000
for establishing a PNEC for the marine environment. [14]
The average growth rate for a specific period during the test is calculated according to the following equation:
Where:
µi-j is the average specific growth rate from i to j;
Xi is the biomass at time i;
Xj is the biomass at time j
The percent inhibition of growth rate is calculated from each treatment replicate according to the following
equation:
Where:
%Ir is the percent inhibition of the average specific growth rate;
µC is the arithmetic mean for the average specific growth rate (µ) in the control group;
µT is the arithmetic mean for the specific growth rate for the treatment replicate
And finally, the percent inhibition of biomass (cell number multiplied by the volume of the media) is
calculated from each treatment replicate according to the following equation:
Where:
%Ib is the percent inhibition of cell number;
BC is the mean biomass value for the control group;
BT is the mean biomass value for the treatment replicate
2.4 PERIPHYTON COMMUNITIES AND SWIFT TESTS
In freshwater bodies, numerous species of algae coexist together, and also with other micro-organisms, such
as bacteria, fungi, protozoa, and metazoan. Microbial communities, consisting of a range of autotrophic and
heterotrophic species, which attach to submerged surfaces, together with the polysaccharides excreted from
the microalgae and other matter from the water column, are called periphyton.[15 and references therein] The
community is dynamic, and the number of species, and their relative abundance, may change depending upon
the season and other environmental factors. Periphyton communities contain many species which are not
traditionally used in laboratory toxicity assays; however, these communities are of importance due to their
primary production, cycling of nutrients, and removal of pollutants from the water column.[10] Hence, they

7
represent ecological entities of high environmental relevance for the environmental risk assessment of
chemicals.
It would be incorrect to assume that all of the species, or even all of the algal species, are sensitive at the same
concentration to a chemical. The testing of a chemical on a community level provides a more realistic picture
of the ecological consequences. Compared to a single species assay, the inclusion of a greater number of
species in the test provides a better representation of the natural distribution of species sensitivities.
Furthermore, the organisms are exposed under more realistic conditions and as they have to manage
additional, natural stressors such as predation and competition. This means that for example sublethal, but
ecologically important, effects from toxicant exposure have an influence on the outcome. Moreover, because
species are inter-dependant, the community structure will change when the most sensitive species is affected
by a toxicant. Thus, community structure can be used as an ecotoxicological endpoint which is overarching,
and independent of the biochemical mode of action of the toxicant. This in the sense that it responds to any
toxicant-induced change that affects the ecological performance of the different species in the community.[16]
Microorganisms can be studied on a community level relatively easily, due to their short generation times and
size. The succession in a periphyton community is similar to that of higher communities, with the favorable
exception that the succession occurs at a faster rate. The effects of toxicants on periphyton communities have
been tested in several different ways. In the field, assays have been conducted using experimental streams,
floating exposure units, and enclosures. In the laboratory, assays have been conducted using laboratory
microcosms, which is a small-scale ecosystem, and with a mixed flask culture, which uses multiple organisms
taken from a natural source.[10] In addition, periphyton has been tested with flow-through microcosms in the
laboratory. However, each of these setups are laborious, and it is difficult to feasibly test a range of
concentrations and have sufficient replicates.
The SWIFT periphyton test employs biofilms, which have been grown on an artificial substratum submerged
into the phototrophic zone of aquatic ecosystems. [16] The biofilms are introduced into a semi-static test
regime, which has been inoculated with the toxicant. During the course of the four day test, artificial nutrients
are added to ensure that the organisms have a high activity and a succession occurs. At the end of the four-day
exposure, several endpoints can be measured. While microscopic cell counts are a traditional way of
analyzing the change in community structure, identifying and counting species is very time-consuming and
requires an experienced taxonomist. One faster alternative is to extract the pigments from the whole
community and analyze them using high-performance liquid chromatography (HPLC). Chlorophyll a is often
used as an indicator of total biomass, but as all microalgal species contain chlorophyll a, it cannot be used as
an indicator for changes in community structure. However, the amount and ratios of „marker pigments‟, such
as chlorophyll b, fucoxanthin, and zeaxanthin provide a better resolution as they are limited to fewer algal
classes. The changes in pigment profile are indicative of changes in the species composition, biomass and the
physiological status of the community.[16] Xanthophylls are light protection pigments, the cellular
concentrations of which are modified in response to the light regime, but may also respond to toxicant
induced stress, particularly oxidative stress and/or if the photosynthetic apparatus is affected.[16] In green
algae, the xantophyll pigments are violaxanthin, antheraxanthin, and zeaxanthin, whereas diatoms have
diadinoxanthin and diatoxanthin. In addition, sterols can be extracted at the end of the test, to determine
whether the mode of action that was observed on a single-species level is also observed on a community level.

8
2.5 FUNGICIDE CLASSIFICATION AND THE MODE OF ACTION OF TERBINAFINE
AND FLUCONAZOLE
There are four major classes of antimycotic agents: polyene antibiotics, azole derivatives, morpholines, and
allylamines. [17]
Azole antimycotics were first developed in the 1960s.[17] Azoles are classified by the number of nitrogen
atoms located in the azole, nitrogen heterocyclic ring: the imidazoles have two nitrogens, and include
ketoconazole, miconazole, and clotrimazole; the triazoles have three nitrogens and include fluconazole.[7] The
structure of fluconazole is shown in Figure 3. Fluconazole is prescribed for certain systemic fungal infections,
and is administered perorally.[18] As of 1999, fluconazole had been used to treat over 16 million patients,
including more than 300,000 AIDS patients in the US alone. [7]
Figure 3. The molecular structure of fluconazole.
The mode of action of fluconazole is inhibition of cytochrome P-450-dependent 14α sterol demethylase (P-
450DM).[19] Fungi that have been exposed to fluconazole are depleted of ergosterol, and have an accumulation
of 14 α-methylated sterols, such as lanosterol. The presence of lanosterol likely disrupts membrane structure
and function, which results in inhibition of growth and morphogenesis.[19] One direct effect is that chitin
synthase activity is adversely affected, which causes abnormal deposition of chitin in the fungal cell wall. In
addition, ergosterol is believed to “spark” the cell by having a regulatory function in mitotic division. It is
believed that there is an ergosterol-dependent temporal stimulation of polyphosphoinositide metabolism and
phospholipid biosynthesis before yeast cells exit from phase G in the division cycle, which is disrupted in the
presence of fluconazole. Fluconazole-treated C. albicans cells are multinucleated and abnormally large.
Electron microscope studies have shown that this cell enlargement is mainly due to wall thickening, and
although there are not any effects on plasma membrane structure, lipid bodies accumulate in the cytoplasm.[19]
Allylamine antimycotics, are categorized by their mode of action. The structure of terbinafine, which is an
allylamine, is shown in Figure 4. Similar to azole antimycotics, allylamine antimycotics also inhibit sterol
biosynthesis, but much early in the synthesis pathway, as shown in Figure 5. Terbinafine is a reversible, non-
competitive inhibitor of squalene epoxidase, which together with (2,3)-oxidosqualene cyclase is responsible
for the cyclization of squalene to lanosterol.[18] In the presence of terbinafine, squalene is accumulated, and
sterol intermediates and end-product sterols are depleted.[7,34] Terbinafine is primarily fungicidal.[21,34] This
effect is believed to result from the accumulation of toxic, intracellular concentrations of squalene.[7,18,34] The
mechanism of the toxic effects of squalene are not well understood; however, it has been hypothesized that
intracellular squalene may dray lipids out of the membrane, thereby influencing membrane permeability.[7,34]
Terbinafine also has a fungistatic effect, which is believed to be due to the corresponding decrease in
ergosterol.[34]
Terbinafine was first synthesized in the 1990s,[17,20] and is used to treat both local, and certain systemic fungal
infections. [18,21]

9
Figure 4. The molecular structure of terbinafine.
Figure 5. In fungi, ergosterol is the end-product sterol. Allylamines and azoles inhibit sterol biosynthesis at
different steps in the biosynthesis chain, as shown.
2.6 STEROL SYNTHESIS AND FUNCTION
Sterols are found in all eukaryotic organisms, and are synthesized de novo by algae, most fungi, vertebrates,
and higher plants.[22] Animals synthesize one sterol, cholesterol, while plant cells synthesize several different
sterols, in genetically defined proportions. There is considerable variation in sterols between fungi, algae,
higher plants, and marine organisms, and approximately 200 different sterols have been identified.[23] In
addition, there are differences in the synthesis pathway between animals and plants.[24]
Sterols are primary metabolites, which are synthesized by the isoprenoid metabolism.[24] The basic sterol
structure and numbering system is shown in Figure 6. All naturally occurring sterols have structural
similarities; they all have between 27 and 30 carbon atoms, an oxygen atom at the C-3 position, and a side
chain, which consists of at least seven carbon atoms at the C-17 position. Sterols exhibit variation in the ring
structure, number of carbon atoms in the side chain, stereochemistry (particularly at the C-5 position), the
number and location of double bonds, and the presence of methyl groups (generally at the C-4, C-14 or C-19
positions).[25] Both the numbering system as recommended by IUPAC-IUB in 1976 and the revision to the
original numbering system in 1989, are provided in Figure 6. Many sterols have been given trivial names,
which generally derive from the name of the original source. The trivial names do not provide any

10
information about the sterol structure; however, this naming system is more commonly used than the IUPAC-
IUB numbering system.[23]
Figure 6. The basic sterol structure. The original numbering system, as recommended by IUPAC-IUB in
1976 is shown on the left. The revision to the original number system, as recommended by the IUPAC-IUB in
1989, is shown on the right.[23]
Squalene is a precursor to all sterols, and the biosynthesis of this compound is common to animals and plants.
Squalene is synthesized from acetyl CoA through the universal isoprenoid route in the endoplasmic reticulum. [26] The biosynthesis pathway of squalene is shown in Figure 7.
Figure 7. The biosynthetic pathway of squalene, starting from acetyl-CoA.
Squalene is then cyclized to form 3β-hydroxy-pentacyclic and tetracyclic triterpenols and sterols. With the
exception of some plants, squalene must be epoxidized to yield 2,3-oxidosqualene prior to cyclization in all
organisms. The first cyclised product in animals and fungi is lanosterol which is then modified to yield
cholesterol in animals and ergosterol in fungi, as shown in Figure 8. In photosynthetic eukaryotes, such as
algae and higher vascular plants, squalene can be cyclised into a wide variety of pentacyclic and tertracyclic
triterpenols.[23] The formation of plant sterols involves over 30 enzyme-catalysed reactions.[27] Figure 9 shows
the general pathway of sterol synthesis in photosynthetic eurkaryotes. As can be seen in the pathway, due to
modifications of the ring system and side chain during synthesis, many sterol structures can be produced, and
1500 sterol structures are theoretically possible.[23] Plant sterols can be divided into 4-desmethyl sterols, 4α-
monomethyl sterols, and 4,4-dimethyl sterols, where 4α-monomethyl sterols, and 4,4-dimethyl sterols are

11
sterol precursors.[27] Alkylation at the 24 position is specific to plants, and the substitution can have α or β
chirality. In addition, the 3-hydroxyl group of the free sterols can be esterified by a fatty acid or a phenolic
acid, yielding sterol esters.[27]
Figure 8. Simplified schematic of the synthesis pathway for sterols in mammals, fungi, and photosynthetic
organisms. [23]

12
Figure 9. Depiction of the synthesis pathway of sterols in photosynthetic organisms.[24] Reactions in boxes
are for both the 24-methyl(ene) and 24-ethyl(idene) segments of the pathyway.
In both plant and animal cells, sterols are an essential component of cell membranes. Sterols have
approximately the same length as the phospholipid monolayer, and serve to reinforce the membrane, by
restricting the motion of fatty acyl chains. Sterols are also believed to help membranes adapt to changes in

13
temperature, regulate the activity of membrane-associated proteins, and influence water permeability.[27]
Sterols also regulate the activity of membrane-associated proteins.[24,27] In plant cells, the plasma membrane
has the greatest sterol content (µg per mg protein) and the highest sterol:phospholipid ratio. Sterols are
essential for plant growth and development e.g., as precursors to steroids.[27] In addition, sterols are required
to form the membranes of dividing cells. Thus, if sterol production is inhibited, cell division will stop by this
mechanism as well.[23] Finally, sterols have also been shown to be substrates for secondary metabolites, such
as glycoalkaloids and saponins.[27]

14
3.0 MATERIALS AND EXPERIMENTATION/METHOD
3.1 TEST ORGANISMS AND CULTURE CONDITIONS
Liquid cultures of the unicellular green algae Pseudokirchneriella subcapitata, strain 61.81(Sammlung für
Algenkulturen (SAG) Göttingen, Germany) were grown in Organization for Economic Cooperation and
Development (OECD) medium, as outlined in the OECD Guidelines for the Testing of Chemicals 201 (2006)
(OECD Guideline 201). The algae were grown in an aquarium, with water temperature maintained at 22 ±
1°C. The algae received continuous light for 16 hours and complete darkness for 8 hours. Stock culture and
pre-culture were prepared as described in the OECD Guideline 201.
3.2 GROWTH INHIBITION TEST
The growth inhibition assays were prepared according to the OECD Guideline 201. Stock solutions of
terbinafine and fluconazole were prepared in acetone and methanol, respectively. The volume of stock
solution necessary to obtain the desired algal cell number in 65 ml of OECD media was pipetted into a 100 ml
glass jar (the amount pipetted was always between 20 and 100 µl), the solvent was allowed to evaporate, and
65 ml of OECD media was subsequently added. Each concentration was prepared in triplicate and each test
included three controls. The jars were shaken overnight. The OECD media, with dissolved pharmaceutical,
was transferred to 90 ml test tubes and algal culture was added to obtain the desired initial cell density. Other
incubation conditions were the same as was used for cultivation. The tests run in the fall 2009 were conducted
over 96 hours and the initial cell density was 10,000 cells/ml. The tests run in the spring 2009 were conducted
over 72 hours and the initial cell density was 20,000 cells/ml. The algal growth in each sample was
determined approximately every 24 hours by measuring the cell count.
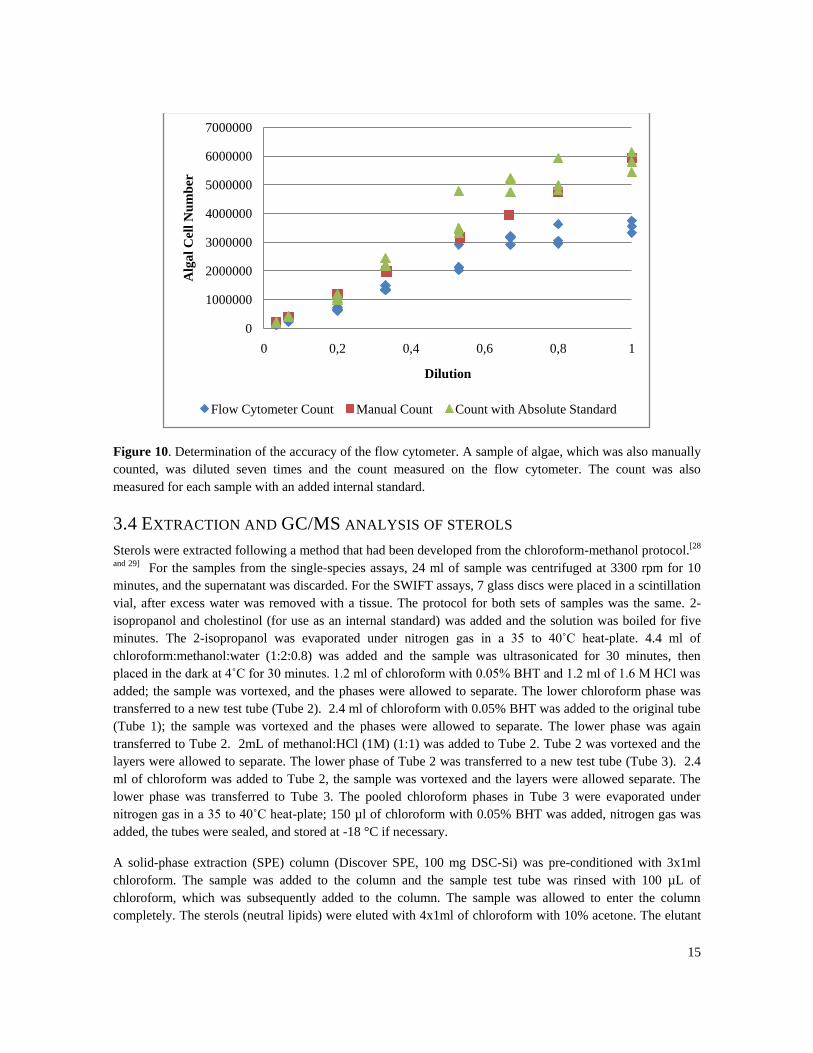
3.3 DETERMINATION OF CELL COUNT
The cell count was determined using a FACSCalibur flow cytometer (BD, Heidelberg, Germany) equipped
with two lasers, an argon ion laser emitting at 488 nm, and a red diode laser emitting at 635 nm, for detection
of forward-scatter (FSC), side-scatter (SSC) and three fluorescence parameters. Due to a variable flow-rate,
the count measured by the flow cytometer was found to be inaccurate when compared to a manual count
using a microscope (Figure 1). The count rate was therefore correlated to algal cell number by first correlating
the count rate of a standardized count standard (Flow Cytometry Absolute Count Standard – Full Spectrum
from Bangs Laboratories, Inc.) to a diluted sample (2,500x) of un-standardized fluorescent microspheres
(Flucresbrite™ Carboxylate YG1.5 Micron Microspheres (2.5% Solids-Latex) from Polysciences, Inc.). The
standardized count standard has a known concentration of 1,000,000 microspheres/mL. 100 µl of the diluted
un-standardized fluorescent microspheres was subsequently added to each sample prior to analysis. The flow
cytometer was found to have a low precision (measured variation as high as ~19%) at algal cell numbers
exceeding 3,000,000 (Figure 10). Any samples with algal cell numbers believed/measured to be above this
threshold were therefore diluted with OECD media prior to analysis. Each sample was run for 3 minutes on
low flow. A computer equipped with CellQuest Pro and Worklist Manager (BD, San Jose, USA) was used for
data acquisition.
15
Figure 10. Determination of the accuracy of the flow cytometer. A sample of algae, which was also manually
counted, was diluted seven times and the count measured on the flow cytometer. The count was also
measured for each sample with an added internal standard.
3.4 EXTRACTION AND GC/MS ANALYSIS OF STEROLS
Sterols were extracted following a method that had been developed from the chloroform-methanol protocol.[28
and 29] For the samples from the single-species assays, 24 ml of sample was centrifuged at 3300 rpm for 10
minutes, and the supernatant was discarded. For the SWIFT assays, 7 glass discs were placed in a scintillation
vial, after excess water was removed with a tissue. The protocol for both sets of samples was the same. 2-
isopropanol and cholestinol (for use as an internal standard) was added and the solution was boiled for five
minutes. The 2-isopropanol was evaporated under nitrogen gas in a 35 to 40˚C heat-plate. 4.4 ml of
chloroform:methanol:water (1:2:0.8) was added and the sample was ultrasonicated for 30 minutes, then
placed in the dark at 4˚C for 30 minutes. 1.2 ml of chloroform with 0.05% BHT and 1.2 ml of 1.6 M HCl was
added; the sample was vortexed, and the phases were allowed to separate. The lower chloroform phase was
transferred to a new test tube (Tube 2). 2.4 ml of chloroform with 0.05% BHT was added to the original tube
(Tube 1); the sample was vortexed and the phases were allowed to separate. The lower phase was again
transferred to Tube 2. 2mL of methanol:HCl (1M) (1:1) was added to Tube 2. Tube 2 was vortexed and the
layers were allowed to separate. The lower phase of Tube 2 was transferred to a new test tube (Tube 3). 2.4
ml of chloroform was added to Tube 2, the sample was vortexed and the layers were allowed separate. The
lower phase was transferred to Tube 3. The pooled chloroform phases in Tube 3 were evaporated under
nitrogen gas in a 35 to 40˚C heat-plate; 150 µl of chloroform with 0.05% BHT was added, nitrogen gas was
added, the tubes were sealed, and stored at -18 °C if necessary.
A solid-phase extraction (SPE) column (Discover SPE, 100 mg DSC-Si) was pre-conditioned with 3x1ml
chloroform. The sample was added to the column and the sample test tube was rinsed with 100 µL of
chloroform, which was subsequently added to the column. The sample was allowed to enter the column
completely. The sterols (neutral lipids) were eluted with 4x1ml of chloroform with 10% acetone. The elutant
0
1000000
2000000
3000000
4000000
5000000
6000000
7000000
0 0,2 0,4 0,6 0,8 1
Alg
al
Cel
l N
um
ber
Dilution
Flow Cytometer Count Manual Count Count with Absolute Standard

16
was evaporated under nitrogen gas in a 35 to 40°C heat-plate. 75 µL of chloroform was added and the
solution was transferred to an inset in a microvial. The sample was again evaporated under nitrogen gas in a
35 to 40°C heat-plate. The sample was reconstituted in 30 µL acetonitrile and 5 µL of BSTFA was added. The
samples were stored at -18 C until analysis.
Samples were analyzed in full scan mode (m/e 40-560) in a Hewlett Packard 5890 series II gas
chromatograph equipped with a Hewlett Packard 5970 series mass selective detector. A DB-5 capillary
column (30m x 0.25mm, J&W Scientific, Inc., Folsom, USA) was used with helium as carrier gas with a
constant flow of 2 ml/min. Both injector and detector were maintained at 300°C. The oven temperature was
increased from 200 to 300 C at 20°C/min. Final temperature was maintained for 15 minutes. [28,29]
Sterols were tentatively identified using the NIST98 library (Scientific Instrument Services, Inc., Ringoes,
USA) and/or comparisons with published data for fragmentation patterns and retention times[25,30].
3.4 EXTRACTION AND HPLC ANALYSIS OF PIGMENTS
Pigments were extracted in 2 mL of a mixture of methanol:acetone:dimethylformamide:water (30:30:30:10)
under -18 °C for 2 to 7 days. In addition, periphyton community samples from the SWIFT test were
ultrasonicated for 30 seconds in order to facilitate pigment extraction. Prior to injection (100 µL) in the HPLC
(ThermoQuest, Thermo Scientific, equipped with a diode-array detector) samples were filtered (0.45 micron)
and diluted with water (400 µL of sample + 100 µL of water). Pigments were separated using a Kinetex
Ultracarb 3u ODS (20) 150 x 3.2 mm column (Phenomenex). A gradient consisting of three mobile phases
was used: A: methanol:0.5 M ammonium acetate (80:20), B: acetonitrile:water (90:10), and C: ethylacetate.
Pigments were identified using wavelength spectra and relative retention times. Pigment peak areas in the
chromatograms were determined at 436 nm, and were used for effect assessments without further
transformation.
3.5 SWIFT TESTS
Glass discs (1.5 cm2) were mounted on both sides of polyethylene sampling racks holding 170 discs each. The
discs were disinfected using 70% ethanol immediately before being submerged at the sampling site. The
sampling racks were suspended at a depth of approximately 0.5 meters in an approximately 1 meter deep
stream (Mölndalsån) in Landvetter, Sweden. After nine days, a visible biofilm had established on the discs,
which were then transported to the laboratory in a container filled with river water and shielded from direct
sunlight. The discs were visually analyzed and those with atypical appearance or damage were discarded.
Twelve periphyton discs were placed in 10x15x5 cm glass containers each containing 200 mL of test medium.
The containers were covered with a transparent glass lid and placed on a shaker in a climate-controlled room
with continuous illumination from fluorescent tubes. The temperature in the room was set to correspond to the
temperature in the water at the sampling site (10 °C). The test medium was exchanged every 24-hours during
the four day test. At the end of the experiment, 5 discs were sampled for pigments and 7 discs were sampled
for sterols.
The test medium consisted of river water collected one day before the start of the test from a depth of
approximately 0.5 m. The water was filtered (GF/F) and stored in the climate controlled room. Solutions for
testing were prepared approximately 24 hours prior to each daily replacement. Macro-and micro-nutrients
were added (see Appendix One). Toxicant stock solutions were prepared in methanol. 20 µL of the toxicant
was pipetted into bottles, the solvent was allowed to evaporate, and the toxicant was re-dissolved in 200 mL

17
of the nutrient-enriched test medium. Six incubation vessels received no toxicants and were used as controls.
The bottles were stored overnight, on a shaker in the climate controlled room.

18
0
1000000
2000000
3000000
4000000
5000000
6000000
7000000
8000000
0 0,0001 0,001 0,01 0,1 1
Alg
al
Cel
l N
um
ber
(ce
lls/
mL
)
Terbinafine Concentration (µM)
Terbinafine Range-Finding
Manual Count versus Count Measured by Flow Cytometer
Flow Cytometer
Manual Count
4.0 RESULTS
4.1 SINGLE SPECIES ASSAYS – BIOMASS MEASUREMENTS
4.1.1 RANGE-FINDING EXPERIMENTS: FALL 2009
A range-finding experiment for terbinafine and fluconazole was conducted in October 2009. P. subcapitata
was exposed to eight concentrations, ranging from 32 to 0.0001 µM, of each drug, separately. As the purpose
of the experiment was only to estimate the toxicity range, only one replicate for each concentration was used.
Three controls were also included. The algal cell number was measured each day using the flow cytometer.
For this experiment, unlike as described in Section 3.0, an internal standard was not used. Instead, the mass of
the sample was weighed before and after analysis, to determine the rate of the flow of the sample through the
flow cytometer. The accuracy of the flow cytometer was measured at the end of the experiment by conducting
a manual cell count. For terbinafine, the 1, 10 and 32 µM treatments were not counted because the algal cell
number was too low. As the manual count was found to be significantly different (and not in a predictable
way) from the flow cytometer count, as shown in Figures 11 and 12, an internal standard was used in all
subsequent experiments.
Figure 11. Graph comparing the manual count that was conducted by microscope and the algal cell number,
as measured with a flow cytometer after an exposure of 72 hours. Error bars denote standard deviation.

19
0
1000000
2000000
3000000
4000000
5000000
6000000
7000000
8000000
0 0,0001 0,001 0,01 0,1 1 3,2 10 32
Alg
al
Cel
l N
um
ber
(ce
lls/
mL
)
Fluconazole Concentration (µM)
Fluconazole Range-Finding
Manual Count versus Count Measured by Flow Cytometer
Flow Cytometer
Manual Count
0
20
40
60
80
100
120
0,0001 0,001 0,01 0,1 1
Per
cen
t In
hib
itio
n
Terbinafine Concentration (µM)
Terbinafine Range-Finding - Percent Inhibition of Growth
Rate and Biomass
Inhibition of Biomass Inhibition of Growth
Figure 12. Graph comparing the manual count that was conducted by microscope and the algal cell number,
as measured with a flow cytometer after an exposure of 72 hours for the fluconazole treatments. Error bars
denote standard deviation.
As the counts measured by the flow cytometer were inaccurate, calculations were not conducted using the
daily measurements. However, the inhibition based on biomass and growth rate were calculated using the
manual count measurements. As can be seen in Figure 13, an approximately 50% and 100% reduction in
biomass was observed at terbinafine concentrations of 0.0001 µM and 0.1 µM, respectively. The inhibition
based on growth rate was lower; approximately 60% inhibition of growth rate is observed above 0.1 µM.
Figure 13. Percent inhibition of biomass and growth rate for the terbinafine treatments, based on a manual
cell count after an exposure of 72 hours.
The algae were much more resistant to the fluconazole than to the terbinafine. As can be seen in Figure 14,
there is practically zero, or even negative inhibition of the average growth rate, except in the highest treatment

20
-20
-10
0
10
20
30
40
50
60
70
80
0,0001 0,001 0,01 0,1 1 3,2 10 32
Per
cen
t In
hib
itio
n
Fluconazole Concentration (µM)
Fluconazole Range-Finding - Percent Inhibition of Growth
Rate and Biomass
Inhibition of Growth Inhibition of Biomass
(32 µM). In this treatment, over 70% of the biomass was inhibited and 20% inhibition of average growth rate
was measured. It was hypothesized that there was a steep growth inhibition curve between 10 and 32 µM.
Figure 14. Percent inhibition of biomass and growth rate for the fluconazole treatments, based on a manual
cell count after an exposure of 72 hours.
4.1.2 TERBINAFINE EXPERIMENT: DECEMBER 2009
Seven treatments, ranging from 0.1 to 100 nm were tested, in triplicate, together with three controls. The algal
cell number on each day of the experiment is shown in Figure 15.
Figure 15. Algal cell number measured on each day of the December 2009 terbinafine experiment. Error bars
denote standard deviation.
Terbinafine effects on P. subcapitata growth rate are shown in Figure 16 for each treatment. The curve, and
corresponding equation, in the figure depicts the growth rate of the controls. On the first day, there is little
variation in the growth, with the exception of one of the 100 nM treatments. On the second day, there is high
0
1000000
2000000
3000000
4000000
5000000
6000000
0 0,1 0,32 1 3,2 10 32 100
Alg
al
Cel
l N
um
ber
(ce
lls/
mL
)
Terbinafine Concentration (nM)
Terbinafine Single-Species Assay
Daily Biomass
December 2010
Day 1
Day 2
Day 3

21
variation in the growth rate, with the 100 nM treatments having the lowest biomass. On the third day, the 100
nM treatments are well below exponential growth, while the other treatments have similar, or even higher
biomass, than the controls.
Figure 16. Terbinafine effects on P. subcapitata growth. The curve and equation shown is a fit to the
controls. The biomass was calculated by multiplying the algal cell number by the volume of fluid in the test
tube.
As can be seen in Figure 15 and 16, the growth inhibition curve appears to be steep between 32 and 100 nM.
In addition, it is possible that growth stimulation is present at low concentrations (Figure 15). A third
terbinafine experiment was necessary, to describe the curve between 32 nM and 100 nM, and also to
hopefully decrease the variation in the controls. In this experiment, the percent variation between the controls
was approximately 8%, but should be less than 5%.
4.1.3 CONTROL EXPERIMENTS: JANUARY 2010
In an effort to reduce the variation between the controls, the test tubes used for the experiment were replaced.
These test tubes were previously used for a nano-particle experiment and it is possible that contamination was
still present. In addition, it is possible that algal residue was cross-contaminating experiments. A new washing
procedure was started: the test tubes were soaked in a solution of Mucasol® overnight, then scrubbed by
hand, then washed in a dishwasher, then rinsed with distilled water and left to air dry.
To determine whether the growth stimulation that was observed was real or an artifact of the experimental
setup, five tubes of algae were grown for three days, spaced evenly in the aquaria. The results are shown in
Figure 17. The test tubes are numbered according to their location in the aquaria, with number 1
corresponding to the test tube that was located in the far left of the aquaria, and number 5 corresponding to the
test tube that was located in the far right of the aquaria. At the end of the experiment, a higher biomass was
measured in the middle of the aquaria, which likely indicates that the algae were receiving more light in this
location. For all future experiments, the test tubes were rotated daily to decrease the impact of this effect. In
addition, any differences in bubbling rate between the test tubes (even though all efforts to avoid this were
taken) would hopefully be cancelled out due to the rotation.
y = 1E+06e0,066x
R² = 0,9773
1,00E+06
1,00E+07
1,00E+08
20
Nu
mb
er o
f A
lga
l C
ells
Time (Hours)
Terbinafine Single-Species Assay
Daily Biomass
December 2010
Control
0.1 nm
0.32 nm
1 nm
3.2 nm
10 nm
32 nm
100 nm

22
Figure 17. Algal cell number on the final day of a control experiment. The test tubes correspond to position in
the aquaria; test tube 1 was located in the far left of the aquaria, and test tube 5 in the far right. There are no
replicates.
4.1.4 TERBINAFINE EXPERIMENTS: SPRING 2010
In order to describe the growth inhibition of terbinafine between 10 and 100 nM, another experiment was
conducted in March 2010. Seven treatments, ranging from 10 to 100 nm were tested, in triplicate, together
with three controls.
The biomass as a function of the log of the time, in hours, is shown in Figure 18 for each treatment. The
curve, and corresponding equation, in the figure is a fit to the controls. On the first day, there was little
variation in the growth rate between the treatments. On the second day, there was a high variation in the
growth rate, with the 100 nm treatments having the lowest biomass. On the third day, the 100 nm treatments
were well below exponential growth (Fig. 18). A clear correlation between growth rate and terbinafine
concentration was observed (Fig. 18).
0
200000
400000
600000
800000
1000000
1200000
1400000
1600000
1800000
2000000
1 2 3 4 5
Alg
al
Cel
l N
um
ber
(ce
lls/
ml)
Test Tube Number

23
Figure 18. The daily biomass on a log time scale. The curve and equation shown is a fit to the controls. The
biomass was calculated by multiplying the algal cell number by the volume of fluid in the test tube.
The average percent inhibition for the terbinafine experiment is shown in Figure 19. The average percent
inhibition of biomass over the course of the experiment ranged from approximately 15 percent at 10 nM to
approximately 90 percent at 100 nM. The average percent inhibition of growth was lower. Less than 10
percent inhibition of growth was observed in the 10 nM treatments. In the 100 nM treatment, approximately
50 percent inhibition of growth was observed. The average percent inhibition of growth is plotted on a log
concentration scale in Figure 20. As can be seen in the figure, the curve is relatively flat in the range of the 10
to 32 nM treatments. The curve begins to increase exponentially started at 50 nM and does not appear to be
leveling off at the 100 nM treatment.
Figure 19. The average percent inhibition of biomass and of growth rate for the experiment. The error bars
represent standard deviation.
y = 2E+06e0,056x
R² = 0,9965
4,00E+06
4,00E+07
20
Bio
ma
ss (
Cel
l C
ou
nt)
Time (Hours)
Terbinafine Single-Species Assay
Daily Biomass
March 2010
Control
10 nM
20 nM
32 nM
50 nM
64 nM
80 nM
100 nM
0
20
40
60
80
100
10 20 32 50 64 80 100
Per
cen
t In
hib
itio
n
Terbinafine Concentration (nM)
Terbinafine Single-Species Assay
Percent Inhibition of Growth Rate and Biomass
March 2010
Inhibition of Biomass Inhibition of Growth

24
Figure 20. The average percent inhibition of growth rate, plotted on the log of the concentration in each
treatment.
4.1.5 FLUCONAZOLE EXPERIMENTS: SPRING 2010
Several experiments were conducted with fluconazole in the spring of 2010. Based on the range finding
experiment, seven treatments, ranging from 0.5 to 50 µM were tested, in triplicate, together with three
controls. After two days, no difference from the controls was observed so the experiment was discarded. The
algal cell numbers after two days are shown in Figure 21.
Figure 21. The algal cell numbers for each treatment for a fluconazole experiment conducted in March 2010.
The error bars are one standard deviation. As no difference from the controls was observed after two days, the
experiment was terminated.
The stock solutions that were used in the experiment were prepared in the fall of 2009. New stock solutions
were prepared and the experiment was repeated. The biomass as a function of the log of the time, in hours, is
y = 4,0523e0,0275x
R² = 0,9089
0
10
20
30
40
50
60
70
10 100
Per
cen
t In
hib
itio
m
Terbinafine Concentration (nM)
Average Growth Inhibition After 72 Hours Exposure to
Terbinafine
March 2010
0
50000
100000
150000
200000
250000
300000
350000
400000
450000
500000
0 0,5 1 3,2 10 20 32 50
Alg
al
Cell
Nu
mb
er
(cell
s/m
L)
Fluconazole Concentration (µM)
Algal Cell Number After 2 Days Exposure to Fluconazole
March 2010

25
shown in Figure 22 for each treatment. The curve, and corresponding equation, in the figure is a fit to the
controls. On the first day and second days, there was little variation in the growth pattern between the
treatments. The treatments were growing at the same rate, or even faster than the controls. On the third day,
the 100 µM treatments were deviating from exponential growth, although the difference is not large.
Figure 22. The daily biomass on a log time scale. The curve and equation shown is a fit to the controls. The
biomass was calculated by multiplying the algal cell number by the volume of fluid in the test tube.
The average percent inhibition for the fluconazole experiment is shown in Figure 23. A slight stimulation was
observed at 0.5 µM. A steady, but shallow increase in both inhibition of growth rate and inhibition of biomass
was observed with increasing concentration. At 50 µM, approximately 30 percent inhibition of biomass was
observed, while the growth rate was only inhibited by approximately 10 percent. The average percent
inhibition of growth is plotted on a log concentration scale in Figure 24. As can be seen in the figure, the
curve is very shallow and appears to begin to level off between 32 and 50 µM.
R² = 0,9744
5,00E+06
5,00E+07
20
Bio
ma
ss (
Cel
l C
ou
nt)
Time (Hours)
Fluconazole Single-Species Assay
Daily Biomass
March 2010
Control
0.5 uM
1 uM
3.2 uM
10 uM
20 uM
32 uM
50 uM

26
Figure 23. The average percent inhibition of biomass and of growth rate for the experiment. The error bars
shown are one standard deviation.
Figure 24. The average percent inhibition of growth rate at the end of the experiment, plotted on the log of
the concentration in each treatment.
In order to better describe fluconazole effects at concentrations ranging from 10 to 100 µM, an additional
experiment was conducted in April 2010. Seven treatments, ranging from 10 to 100 µM were tested in
triplicate, together with three controls. The biomass as a function of the log of the time, in hours, is shown in
Figure 25 for each treatment. The curve, and corresponding equation, in the figure is a fit to the controls. On
the first day, there was little variation in the growth pattern between the treatments. On the second day, there
again was little variation. The treatments were growing at the same rate, or even faster than the controls. On
the third day, an increasing deviation from exponential growth was observed, beginning with the 64 µM
treatment. The largest deviation from exponential growth was observed in the 100 µM treatment.
-20
-10
0
10
20
30
40
50
0,5 1 3,2 10 20 32 50
Per
cen
t Ih
ibit
ion
Fluconazole Concentration (µM)
Fluconazole Single-Species Assay
Percent Inhibition of Growth Rate and Biomass
March 2010
Inhibition of Biomass Inhibition of Growth
y = -0,0029x2 + 0,3314x - 0,1259
R² = 0,8739
-4
-2
0
2
4
6
8
10
12
14
0,1 1 10 100
Per
cen
t In
hib
itio
n
Fluconazole Concentration (µM)
Inhibition of Average Growth Rate in the Presence of Fluconazole
March 2010

27
Figure 25. The daily biomass on a log time scale. The curve and equation shown is a fit to the controls. The
biomass was calculated by multiplying the algal cell number by the volume of fluid in the test tube.
The average percent inhibition for the April 2010 fluconazole experiment is shown in Figure 26. A slight
stimulation was observed at 1 µM. A steady, but shallow increase in both inhibition of growth rate and
inhibition of biomass was observed with increasing concentration. At 100 µM, approximately 35 percent
inhibition of biomass was observed, while the growth rate was only inhibited by approximately 10 percent.
The average percent inhibition of growth is plotted on a log concentration scale in Figure 27. As can be seen
in the figure, the curve is very shallow but appears to begin increasing exponentially at 50 µM.
Figure 26. The average percent inhibition of biomass and of growth rate for the experiment. The error bars
shown are one standard deviation.
y = 3E+06e0,0477x
R² = 0,9823
5,00E+06
5,00E+07
20
Bio
ma
ss (
Cel
l C
ou
nt)
Time (Hours)
Fluconazole Single-Species Assay
Daily Biomass
April 2010Control
1 uM
10 uM
32 uM
50 uM
64 uM
80 uM
100 uM
-20
-10
0
10
20
30
40
50
1 10 32 50 64 80 100
Per
cen
t In
hib
itio
n
Fluconazole Concentration (µM)
Fluconazole Single-Species Assay
Inhibition of Growth Rate and Biomass
April 2010
Inhibition of Biomass Inhibition of Growth

28
Figure 27. The average percent inhibition of growth rate at the end of the experiment, plotted on the log of
the concentration in each treatment.
4.2 SINGLE-SPECIES ASSAYS – PIGMENT MEASUREMENTS
4.2.1 EFFECTS ON PIGMENTS - TERBINAFINE
At the end of the last terbinafine experiment, in March 2010, pigment samples were taken and analyzed using
HPLC. The sum of chlorophyll a and its degradation products (chlorophyll a), are shown in Figure 28, which
gives an indication of biomass. Overall, there is a trend that the content of chlorophyll a decreased, as the
concentration of terbinafine increased. The data did exhibit quite a large variation between the replicates. The
coefficient of variation was 21%. The violaxanthin content, divided by the sum of violaxanthin,
antheraxanthin, and zeaxanthin (V/VAZ) is shown in Figure 29. The V/VAZ content is a measure of oxidative
stress in green algae.[16] There was much less variation in the V/VAZ content. The standard deviation divided
by the mean for the controls was 0.018. The V/VAZ ratio showed little variation between the controls and all
the treatments, up to 64 µM. The ratio was approximately 0.8 for these samples. The V/VAZ ratio for the 80
µM sample was 0.76, and for the 100 µM sample, was 0.6. With a 95% confidence interval, a statistically
significant decrease was observed at 100 µM.
y = 0,0014x2 - 0,032x + 0,1016
R² = 0,7516
-4
-2
0
2
4
6
8
10
12
14
10 100
Per
cen
t In
hib
itio
n
Fluconazole Concentration (µM)
Fluconazole - Inhibition of Average Growth Rate
April 2010

29
Figure 28. The sum of the chlorophyll a content, and its degradation products for the March 2010 terbinafine
experiment. Pigments were analyzed using HPLC. There are three replicates for each data point, and the error
bars represent standard deviation.
Figure 29. The violaxanthin content, divided by the sum of the peak areas for violaxanthin, antheraxanthin,
and zeaxanthin. Samples were taken on the last day of the March 2010 terbinafine experiment. The error bars
represent standard deviation.
4.2.2 EFFECTS ON PIGMENTS - FLUCONAZOLE
At the end of the last fluconazole experiment, in April 2010, pigment samples were taken and analyzed using
HPLC. The sum of chlorophyll a and its degradation products (chlorophyll a), are shown in Figure 30.
Similar to the chlorophyll a content measured after the terbinafine experiment, there was quite a large
variation between the replicates. The standard deviation divided by the mean for the controls was 0.22. The
chlorophyll a content decreased with increasing concentration, to 50% of the control level at 64 µM. Above
80 µM, the chlorophyll a content was higher than at 64 µM; however, there was considerable variation
0
1000000
2000000
3000000
4000000
5000000
6000000
7000000
0 20 40 60 80 100
Pea
k A
rea
Terbinafine Concentration (nM)
Terbinafine Single-Species Assay
Chlorophyll a (and degradation products) Content
March 2010
0
0,1
0,2
0,3
0,4
0,5
0,6
0,7
0,8
0,9
1
0 10 20 30 40 50 60 70 80 90 100
V/V
AZ
Terbinafine Concentration (nM)
Terbinafine Single-Species Assay
V/VAZ Ratio
March 2010

30
between the replicates for this treatment. At 100 µM, the chlorophyll a content was above that of the controls.
The violaxanthin content is also shown in Figure 30, and a similar trend was observed. The violaxanthin
content decreased with increasing terbinafine concentration, to approximately 40% of the control level at 64
µM. Similar to chlorophyll a, an increasing trend was observed in the 80 and 100 µM treatments. A similar
trend was observed with antheraxanthin and zeaxanthin (data not shown), but at lower concentrations than
Chlorophyll a and violaxanthin. The V/VAZ ratio is shown in Figure 31. There was almost no variation in the
V/VAZ content, both between replicates, and between treatments. The standard deviation divided by the mean
for the controls was 0.021. The V/VAZ ratio was approximately 0.83 in the controls, and was 0.785 in the
highest treatment, 100 µM. A statistically significant change in the V/VAZ ratio was not observed.
Figure 30. The chlorophyll a (and its degradation products) and the violaxanthin content for the April 2010
fluconazole experiment. Pigments were analyzed using HPLC. The error bars represent standard deviation.
0
1000000
2000000
3000000
4000000
5000000
6000000
7000000
8000000
0 20 40 60 80 100
Pea
k A
rea
Fluconazole Concentration (µM)
Fluconazole Single-Species Assay
Chlorophyll a and Violaxanthin Content
April 2010
Chlorophyll a
Violaxanthin

31
Figure 31. The violaxanthin content, divided by the sum of the peak areas for violaxanthin, antheraxanthin,
and zeaxanthin. Samples were taken on the last day of the April 2010 fluconazole experiment. The error bars
represent standard deviation.
4.2 SINGLE-SPECIES ASSAYS – STEROL MEASUREMENTS
4.2.1 EFFECTS ON STEROLS - TERBINAFINE
Sterols were extracted after the last terbinafine experiment, in March 2010, as described in Section 3.3. The
peak areas were normalized to the internal standard and weighted for the biomass of the sample. Six end-
product sterols were identified in the controls. One of the chromatograms from the control samples is shown
in Figure 32. All of these sterols are phytosterols: Δ8,22-ergastadienol, Δ7,22-ergastadienol, ergostenol,
chondrillasterol, 24,5α-cholesta-5,7,22-trien-3β-ol, and Δ7-chondrillastenol. The percentage of each sterol in
the controls is shown in Table 2. The dose-response curves for each of these sterols are shown in Figure 33.
Figure 32. Chromatogram from one of the controls associated with the fluconazole experiment. The standard
used was cholestanol. The sterols identified are listed in Table 2.
0
0,1
0,2
0,3
0,4
0,5
0,6
0,7
0,8
0,9
0 10 20 30 40 50 60 70 80 90 100
V/V
AZ
Fluconazole Concentration (µM)
Fluconazole Single Species Assay
V/VAZ Ratio
April 2010

32
0
0,02
0,04
0,06
0,08
0,1
0,12
0,14
0 50 100
Δ8,22-ergostadienol
0
0,05
0,1
0,15
0,2
0 50 100
Δ7,22-ergostadienol
0
0,01
0,02
0,03
0,04
0,05
0,06
0,07
0 50 100
Ergostenol
0
0,01
0,02
0,03
0,04
0,05
0 50 100
Chondrillasterol
0
0,05
0,1
0,15
0,2
0,25
0 50 100
24-ethyl-5α-cholesta-5,7,22-
trien-3β-ol
0
0,05
0,1
0,15
0,2
0,25
0,3
0,35
0 50 100
Δ7-chondrillastenol
Table 2
Sterol Content of the Controls at the End of the March 2010
Terbinafine Experiment
Sterol Name Percent of the Total
Sterol Composition
Δ8,22-ergastadienol (A) 10%
Δ7,22-ergastadienol (B) 17%
Ergostenol (C) 7%
Chondrillasterol (D) 7%
24-ethyl-5α-cholesta-5,7,22-trien-3β-ol (E) 12%
Δ7-chondrillastenol (F) 46%
Figure 33. The dose response curves to terbinafine for the sterols in P. subcapitata after 72-hours of
exposure. For the controls, there were two replicates. There were three replicates for all of the treatments. The
error bars represent standard deviation.
For all of the end-product sterols, with the exception of chondrillasterol, there appeared to be a stimulation at
low concentrations. The concentration of Δ7,22-ergastadienol actually increased as terbinafine concentration
increased. Similarly, the concentration of Δ8,22-ergastadienol was above control levels for the majority of the
treatments; it is only the 100 nM treatment where the concentration was below control levels. The
concentration of ergostenol, 24,5α-cholesta-5,7,22-trien-3β-ol, and Δ7-chondrillastenol decreased to at least
half of the control content as the concentration of terbinafine increased to 100 nM. Chondrillasterol was not
detected in the 64, 80 and 100 nM treatments.
Terbinafine Concentration (nM)

33
As the concentration of terbinafine increased, the total sterol content also decreased, with the exception of the
10 and 20 nM treatments, for which there was a stimulation of sterol content, as shown in Figure 33.
The end-product sterols, and squalene, as a fraction of the sum of the sterol and squalene content, are shown
in Figure 34. As can be seen in the figure, the fraction of squalene increased as the concentration of
terbinafine increased. Squalene was 20% of the total at 50 nM, and increased to approximately 85% of the
total, at 100 nM.
Figure 34. The percentage of end product sterols and squalene, as a fraction of the sum of the sterol and
squalene content, at the end of the 72-hour treatment. Each bar is an average of three samples, with the
exception of the control, which is an average of two samples.
4.2.2 EFFECTS ON STEROLS - FLUCONAZOLE
Sterols were extracted after the last fluconazole experiment, in April 2010, as described in Section 3.3. The
peak areas were normalized to the internal standard and weighted for biomass. The same six end-product
sterols which were identified in the terbinafine controls, were also identified in the controls for the
fluconazole experiment. The percentage of each sterol in the control sample is shown in Table 3. As the
fluconazole concentration increased, the concentration of each of these sterols decreased, as shown in Figure
35. At 32 µM, the concentration of all six of the sterols was below half that of control levels. For the majority
of the sterols, the dose-response curve was flat above 50 µM. The only exception was chondrillasterol. The
concentration of chondrillasterol actually increased above 64 µM; however, even at 100 µM, the
concentration was still less than half of the control levels.
0
0,1
0,2
0,3
0,4
0,5
0,6
0,7
0,8
0,9
1
0 10 20 32 50 64 80 100
Fra
ctio
n o
f T
ota
l C
on
ten
t
Terbinafine Concentration (nM)
Terbinafine Single-Species Assay
Sterol Composition
March 2010
Squalene
Sterols

34
0
0,02
0,04
0,06
0,08
0,1
0 50 100
Δ8,22-ergostadienol
0
0,02
0,04
0,06
0,08
0,1
0,12
0,14
0 50 100
Δ7,22-ergostadienol
0
0,005
0,01
0,015
0,02
0,025
0 50 100
Ergostenol
0
0,005
0,01
0,015
0,02
0,025
0,03
0,035
0 50 100
Chondrillasterol
0
0,02
0,04
0,06
0,08
0,1
0,12
0,14
0 50 100
24 ethyl-5α-cholesta-5,7-22-
trien-3β-ol
0
0,05
0,1
0,15
0,2
0 50 100
Δ7-chondrillastenol
Table 3
Sterol Content of the Controls at the End of the April 2010
Fluconazole Experiment
Sterol Name Percent of the Total Sterol
Composition
Δ8,22-ergastadienol 15%
Δ7,22-ergastadienol 21%
Ergostenol 4%
Chondrillasterol 5%
24-ethyl-5α-cholesta-5,7,22-trien-3β-ol 24%
Δ7-chondrillastenol 30%
Figure 35. The dose response curves to fluconazole for the sterols in P. subcapitata after 72-hours of
exposure. The error bars represent standard deviation (n=3).
As the concentration of fluconazole increased in the treatments, the concentration of four 14α-methylated
sterols, which were not present in the controls, increased. The dose-response curves for these sterol
intermediates are shown in Figure 36.
Fluconazole Concentration (µM)

35
0
0,005
0,01
0,015
0,02
0,025
0 50 100
14α-methylergosta-8,24-
dien-3β-ol
0
0,02
0,04
0,06
0,08
0,1
0,12
0,14
0 50 100
Norlanosterol
0
0,02
0,04
0,06
0,08
0,1
0 50 100
Unidentified Sterol
Intermediate
0
0,05
0,1
0,15
0,2
0,25
0 50 100
Obtusifoliol
Figure 36. The dose response curves to fluconazole for 14α-sterol intermediates in P. subcapitata after 72-
hours of exposure. For the controls, and all of the treatments, there were three replicates. The error bars
represent one standard deviation.
The end-product sterols, and the 14α-sterol intermediates, as a fraction of the sum of both, are shown in
Figure 37. As can be seen in the figure, the fraction of 14α-sterol intermediates increased as the concentration
of fluconazole increased. 14α-sterol intermediates were present at a concentration 10 µM, and increased to
80% of the total sterol content, at 100 µM.
Figure 37. The fraction of sterols and 14-α sterol intermediates, in relation to the sum of both, at the end of
the 72-hour treatment. Each bar is an average of three replicates.
0
0,1
0,2
0,3
0,4
0,5
0,6
0,7
0,8
0,9
1
0 1 10 32 50 64 80 100
Fra
ctio
n o
f T
ota
l S
tero
l C
on
ten
t
Fluconazole Concentration (µM)
Fluconazole Single-Species Assay
Sterol Composition
April 2010
14-alpha sterols
All other sterols
Fluconazole Concentration (µM)

36
The concentration of squalene also increased as the concentration of fluconazole increased, as shown in
Figure 38. However, this only occurred at a fluconazole concentration of 100 µM. The relative content of
squalene in the 100 µM treatment was approximately 2%.
Figure 38. The squalene content for each treatment after 72-hours of exposure. Each data point represents the
average of three replicates. The error bars represent standard deviation.
4.3 SWIFT ASSAY – PIGMENT MEASUREMENTS
4.3.1 EFFECTS ON PERIPHYTON PIGMENTS IN THE SWIFT TEST - TERBINAFINE
Terbinafine effects on periphyton chlorophyll a content is shown in Figure 39. As can be seen in Figure 39,
the 10, 20 and 32 nM samples appeared to have chlorophyll a content above that of the controls, though it is
not statistically significant. The 50, 64, 80 and 100 nM samples had control levels of chlorophyll a.
0
0,001
0,002
0,003
0,004
0,005
0,006
0,007
0,008
0,009
0 10 20 30 40 50 60 70 80 90 100
Corr
ecte
d P
eak
Are
a/B
iom
ass
Fluconazole Concentration (µM)
Fluconazole Single-Species Assay
Squalene Content
April 2010

37
Figure 39. The sum of the chlorophyll a content, and its degradation products for the SWIFT terbinafine
experiment. Pigments were analyzed using HPLC. For the controls and the 10 nM data points, there were two
replicates. For the 64 nM data point, there was only one replicate. For the remainder of the data points, there
were three replicates. The error bars represent one standard deviation.
Terbinafine effects on lutein, which is a pigment specific to green algae, and the fluoxanthin content, which is
a pigment specific to diatoms, is shown in Figure 40. A clear reduction in lutein content was observed already
at low terbinafine concentrations. At 20 nM, the lutein content was reduced by 50%, and this decrease
continues at higher concentrations. Above 64 nM, the lutein content was relatively constant, at 20% of the
control level (Fig. 40).
The fluoxanthin content appeared to be stimulated compared to control levels, in the 10, 20 and 32 nM
treatments. At 50 nM and above, the fluoxanthin level was comparable to control levels (Fig. 40).
In Figure 41, the V/VAZ ratio and the ratio the diadanoxanthin content, divided by the sum of the peak areas
for diadanoxanthin and diatoxanthin (DD/DD+DT) are shown. The V/VAZ content is a measure of oxidative
stress in green algae.[16] The DD/DD+DT content is a measure of oxidative stress in diatoms.[16] The V/VAZ
content decreased from 0.8 to 0.6 as the concentration of terbinafine increased. The DD/DD+DT content
decreased from 0.9 to 0.8 as the concentration increased. There was also a higher standard deviation between
the replicates with increasing concentration.
0
200000
400000
600000
800000
1000000
1200000
1400000
1600000
0 20 40 60 80 100
Pea
k A
rea
Terbinafine Concentration (nM)
Chlorophyll a (and degradation products) Content
Terbifine SWIFT Test

38
Figure 40. The lutein and the fucoxanthin content in each of the terbinafine treatments at the end of the
SWIFT experiment. The pigment content in each replicate has been divided by the control average. There
were three replicates for each data point, with the exception of the 10 nM treatment, for which there were two
replicates, and the 64 nM treatment, for which there was only one replicate. The error bars denote standard
deviation.
Figure 41. The xanthophyll pigment ratios in each of the terbinafine treatments at the end of the SWIFT
experiment. The red line is the violaxanthin content, divided by the sum of the peak areas for violaxanthin,
antheraxanthin, and zeaxanthin (V/VAZ). The blue line is the diadanoxanthin content, divided by the sum of
the peak areas for diadanoxanthin and diatoxanthin (DD/(DD+DT)). There were three replicates for each data
point, with the exception of the 10 nM treatment, for which there were two replicates, and the 64 nM
treatment, for which there was only one replicate. The error bars denote standard deviation.
4.3.2 EFFECTS ON PERIPHYTON PIGMENTS IN THE SWIFT TEST - FLUCONAZOLE
The chlorophyll a content measured from the fluconazole treatments is shown in Figure 42. There were three
controls, and one replicate for each of the treatments. Without replicates, it is difficult to determine whether
0
0,2
0,4
0,6
0,8
1
1,2
1,4
1,6
1,8
10 20 30 40 50 60 70 80 90 100
Pea
k A
rea D
ivid
ed b
y C
on
tro
l A
ver
ag
e
Terbinafine Concentration (nM)
Comparison between Green Algal and Diatom Pigments
Terbinafine SWIFT Test
Fucoxanthin
Lutein
0
0,1
0,2
0,3
0,4
0,5
0,6
0,7
0,8
0,9
1
0 10 20 30 40 50 60 70 80 90 100
Terbinafine Concentration (nM)
Oxidative Pigment Ratios
Terbinafine SWIFT Test
V/VAZ
DD/(DD+DT)

39
there is a trend in the data. The 80 µM data point appears lower than control levels, but it is difficult to tell
whether there really was an effect. We did not visually observe a difference between the discs at the end of
the experiment; this observation correlates well with the chlorophyll a results.
Fucoxanthin followed a similar trend to the chlorophyll a content, as shown in Figure 43. The lutein content
was higher than the control average for the 10 and 32 µM treatments, after which the trend was similar to the
flucoxanthin pigment. Again, it was difficult to determine whether a trend is really present due to the lack of
replicates.
The V/VAZ and the DD/DD+DT content for the fluconazole treatments are shown in Figure 44. The two
ratios follow nearly an identical path. There was little variation as the fluconazole concentration increased,
indicating that there was little oxidative stress or direct effects on photosynthesis.
Figure 42. The sum of the chlorophyll a content, and its degradation products for the SWIFT fluconazole
experiment. Pigments were analyzed using HPLC. For the controls, there were three replicates. For the
treatments, there was one replicate. The error bars denote standard deviation.
0
200000
400000
600000
800000
1000000
1200000
1400000
1600000
0 20 40 60 80 100
Pea
k A
rea
Fluconazole Concentration (µM)
Chlorophyll a (and degradation products) Content
Fluconazole SWIFT Test

40
Figure 43. The lutein and the fucoxanthin content in fluconazole treatments at the end of the SWIFT
experiment. The pigment content in each treatment has been divided by the control average. There was only
one replicate for each data point.
Figure 44. The xanthophyll pigment ratios in each of the terbinafine treatments at the end of the SWIFT
experiment. The red line is the violaxanthin content, divided by the sum of the peak areas for violaxanthin,
antheraxanthin, and zeaxanthin (V/VAZ). The blue line is the diadanoxanthin content, divided by the sum of
the peak areas for diadanoxanthin and diatoxanthin (DD/(DD+DT)). There were three controls. For each
treatment there was only one replicate. The error bars denote standard deviation.
0
0,2
0,4
0,6
0,8
1
1,2
1,4
0 20 40 60 80 100
Pea
k A
rea D
ivid
ed b
y C
on
tro
l A
ver
ag
e
Fluconazole Concentration (µM)
Comparison between Green Algal and Diatom Pigments
Fluconazole SWIFT Test
Fucoxanthin
Lutein
0
0,1
0,2
0,3
0,4
0,5
0,6
0,7
0,8
0,9
0 10 20 30 40 50 60 70 80 90 100
Fluconazole Concentration (µM)
Oxidative Stress Pigments
Fluconazole SWIFT Test
V/VAZ
DD/(DD+DT)

41
5.0 DISCUSSION A substantial amount of time during this project was spent on method development. Experiments run in the
fall of 2009 were discarded either due to inaccuracies associated with cell counting or because the percent
difference between the controls was too high (greater than 10%). Several adjustments were made to improve
the system. First, it was recognized immediately that the flow rate in the flow cytometer (even with weighing
samples before and after each run) was too unstable to determine an algal cell number just based on flow rate.
An absolute count standard was used to calibrate fluorescent micro-beads, which were subsequently added to
each sample. As can be seen in Figure 10 (in the Methods section), this substantially improved the accuracy
and precision of the flow cytometer.
Several changes were also made to the setup of the single-species assay, in an effort to reduce the percent
variation between the controls. The test-tubes used in the experiments in the fall had previously been used for
a nano-particle experiment. Since it was possible that the test-tubes could still be contaminated, a new set of
test-tubes was purchased. In addition, soap had previously been used for washing. A new washing procedure
was started. The test-tubes were first soaked overnight in Mucasol®, which is a laboratory detergent, then
scrubbed by hand. Next, the test-tubes were washed in a dishwater, then rinsed with distilled water prior to
autoclaving. In addition, every effort was made to ensure that the air supply to each of the test-tubes was
equal. This had to be done by eye, and it is difficult to make fine-tune adjustments with the current setup,
which uses plastic stop-cocks to regulate the air flow. It is recommended that new stop-cocks be purchased,
which are easier to adjust. Lastly, a higher growth rate was measured in the middle of the aquaria, as shown in
Figure 17 (in the Results section). Subsequently, the test-tubes were rotated daily, so that over the course of
the 72-hour treatment, each test-tube was located on the left side of the aquaria for 24 hours, in the middle for
24-hours, and on the right side of the aquaria for 24 hours. In addition to evening out the light exposure,
differences in air flow between test tubes are hopefully cancelled out when the tubes are rotated, although this
cannot be guaranteed. After making these changes, the percent variation between the controls was
successfully reduced, in some experiments to as low as 5%.
During this project, the toxicity of fluconazole and terbinafine were tested singly on P. subcapitata.
Terbinafine was highly toxic to the algae, with an EC50 based on growth rate of 90 nM, and based on biomass
of 50 nM. The fact that there is a discrepancy in the values is normal. According to the OECD guidelines, the
EC50 based on growth rate is generally higher than the EC50 based on biomass. The difference between the
two values is not a measure of the sensitivity of this experiment, rather just that these two values are different.
The use of the average specific growth rate for the calculation of the EC50 is preferred because it is dependent
upon fewer variables. [31]
There is agreement between the data from the single-species assay and the SWIFT assay. In the SWIFT assay,
the green algal species were more sensitive to terbinafine than the diatoms, as evidenced by the reduction in
lutein content. In fact, the green algal species in SWIFT were slightly more sensitive to terbinafine than P.
subcapitata. Based on the lutein content, terbinafine had an EC50 of 20 nM to the green algae. In contrast, the
diatoms, as evidenced by the fucoxanthin content, were not affected in any of the treatments. There may have
even been a slight stimulation of the diatoms at low concentrations. It would be interesting to conduct a
single-species assay with a diatom to confirm this, and to determine if there is a range of concentrations at
which diatom growth is inhibited by terbinafine.
The first experiments with fluconazole gave different results. When it was tested in the fall of 2009, toxicity
was observed at 32 µM. While there was a very large discrepancy between the percent inhibition based on

42
biomass and growth rate at this concentration, inhibition was observed. Laboratory notes indicate that the 32
µM test tube was visually clearer, and less green, than the control test tubes. It is possible that nano-particles
were present in the test tubes, and the combination of the fluconazole and the nano-particles inhibited the
algal growth.
When the test was first repeated in the spring of 2010, no inhibition was observed, at concentrations ranging
from 0.5 to 50 µM. Due to a lack of another explanation, new stock solutions were made, although it is
unlikely that the fluconazole had degraded in the freezer in methanol over the course of approximately 5
months. The fluconazole experiment was repeated, first to a maximum concentration of 50 µM and then to
100 µM. The inhibition observed in both experiments was minimal, considering the high concentrations to
which the algae were exposed. A graph showing the inhibition of average growth rate for both experiments is
shown in Figure 45. For the March 2010 experiment, a statistically significant decrease in growth rate was
observed at concentrations above 10 µM. For the April 2010 experiment, a statistically significant decrease in
growth rate was observed at concentrations above 64 µM. At the highest concentration tested, 100 µM, the
percent inhibition of growth rate was approximately 12%.
Levels of chlorophyll a were differently affected across the range of tested fluconazole concentrations. At
intermediate exposure concentrations, levels of chlorophyll a were reduced, followed by an increase to higher
exposure concentrations. A similar response in the violaxanthin, antheraxanthin and zeaxanthin content was
also observed. This may be an artifact of the test methodology, for example the pigment extraction method,
since the same trend was observed for several pigments. However, it is interesting to note that such bi-phasic
responses of algae to exposure of azole-type fungicides have been reported previously.[18,37] The exact
mechanisms are however unclear, but could be related to, for example, interference with pigment synthesis or
growth-regulation systems.
Figure 45. Graph comparing the results from the March and April 2010 P. subcapitata assay. In both
experiments the algae were exposed to fluconazole. Each data point is an average of three replicates, with the
exception of the April 2010 50 µM data point, which is an average of two replicates. The error bars represent
one standard deviation.
-4
-2
0
2
4
6
8
10
12
14
0 10 20 30 40 50 60 70 80 90 100
Per
cen
t In
hib
itio
n
Fluconazole Concentration (µM)
Inhibition of the Average Growth Rate After a 72 Hour
Exposure to Fluconazole
March
April
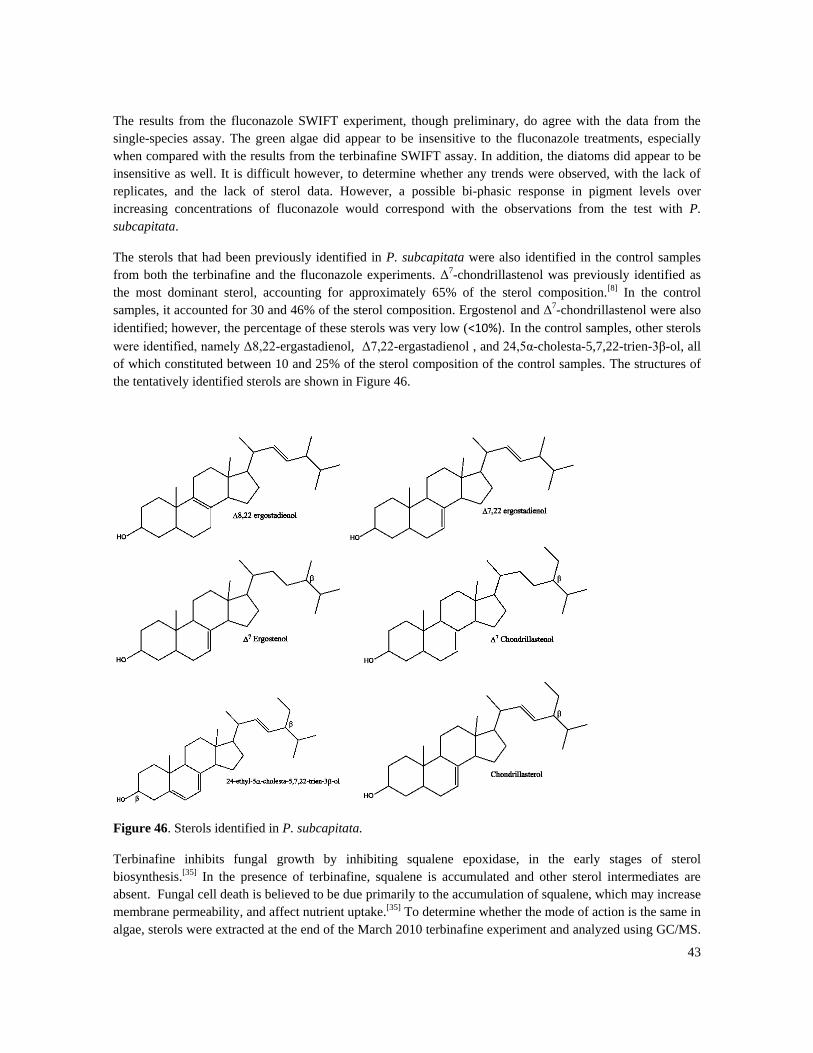
43
The results from the fluconazole SWIFT experiment, though preliminary, do agree with the data from the
single-species assay. The green algae did appear to be insensitive to the fluconazole treatments, especially
when compared with the results from the terbinafine SWIFT assay. In addition, the diatoms did appear to be
insensitive as well. It is difficult however, to determine whether any trends were observed, with the lack of
replicates, and the lack of sterol data. However, a possible bi-phasic response in pigment levels over
increasing concentrations of fluconazole would correspond with the observations from the test with P.
subcapitata.
The sterols that had been previously identified in P. subcapitata were also identified in the control samples
from both the terbinafine and the fluconazole experiments. Δ7-chondrillastenol was previously identified as
the most dominant sterol, accounting for approximately 65% of the sterol composition.[8] In the control
samples, it accounted for 30 and 46% of the sterol composition. Ergostenol and Δ7-chondrillastenol were also
identified; however, the percentage of these sterols was very low (<10%). In the control samples, other sterols
were identified, namely Δ8,22-ergastadienol, Δ7,22-ergastadienol , and 24,5α-cholesta-5,7,22-trien-3β-ol, all
of which constituted between 10 and 25% of the sterol composition of the control samples. The structures of
the tentatively identified sterols are shown in Figure 46.
Figure 46. Sterols identified in P. subcapitata.
Terbinafine inhibits fungal growth by inhibiting squalene epoxidase, in the early stages of sterol
biosynthesis.[35] In the presence of terbinafine, squalene is accumulated and other sterol intermediates are
absent. Fungal cell death is believed to be due primarily to the accumulation of squalene, which may increase
membrane permeability, and affect nutrient uptake.[35] To determine whether the mode of action is the same in
algae, sterols were extracted at the end of the March 2010 terbinafine experiment and analyzed using GC/MS.

44
At low concentrations (at 20 and 32 nM), the presence of terbinafine stimulated the total sterol content, by
over 40%. The reason for this occurrence is unclear; however, a stimulation at low concentrations in some
phytosterols was also observed when marine algal communities were exposed to clotrimazole.[28] This is
interesting because clotrimazole is an azole with the same mode of action as fluconazole,[28] but this response
was seen with terbinafine and not with fluconazole (discussed below). However, it should be noted that
changes in the sterol profile of a periphyton community can also result from changes in species composition,
because algal species differ in their sterol composition. From 50 to 100 nM, a dose-response curve was
observed, where increasing concentrations of terbinafine resulted in decreasing amounts of sterols. At 100
nM, the highest concentration tested, the total sterol content was reduced by over 40%. A dose-response curve
was also determined for squalene. Squalene was first detected in the 10 nM sample. In the 100 nM treatment,
squalene constituted over 80% of the sum of the squalene and sterol content. The decrease in normal sterols
and the coinciding accumulation of squalene shows that inhibition of squalene expoxidase was the mechanism
of action of terbinafine in P. subcapitata. Based on the coinciding effects on growth, it can be hypothesized
that squalene accumulation was the mode of action for the algal cell death observed in the assay. No
responses were detected in xanthophylls pigments ratios, which indicates that photosynthesis was not affected
and that oxidative stress was not induced.
Fluconazole inhibits fungal growth by inhibiting cytochrome P-450-dependent 14α sterol demethylase (P-
450DM).[19] Fungi that have been exposed to fluconazole are depleted of ergosterol, and have an accumulation
of 14α-methylated sterols, such as lanosterol.[19] The cyclization of squalene does not lead to lanosterol in
algae, but rather to obtusifoliol.[24] If the mode of inhibition in algae is the same as in fungi, an accumulation
of obtusifoliol and other 14α-methylated sterols would be expected. At 32 µM, the concentration of all six of
the normal sterols was lower than half that of control level. For the majority of the sterols, the dose-response
curve is flat above 50 µM. The only exception is chondrillasterol. The concentration of chondrillasterol
actually increased above 64 µM; however, even at 100 µM, the concentration was still less than half of
control level. As the concentration of the sterols decreased, with increasing fluconazole concentration, 14 α-
methylated sterols were detected. Hence, this shows that the function of 14α-demethylase in P. subcapitata
was inhibited in the presence of fluconazole. 14 α-methylated sterols were first detected in the 10 µM sample.
Four 14 α-methylated sterols were detected, and the concentration of each increased with increasing
fluconazole concentration. At the highest concentration tested, 100 µM, 14 α-methylated sterols represented
80% of the total sterol content. As would be expected based on the sterol biosynthesis pathway in algae,
obtusifoliol was one of the 14α-methylated sterols detected, which increased in concentration as the
fluconazole concentration increased. In addition, norlanosterol, which is a cholesterol precursor, was detected.
This is interesting because cholesterol or cholesterol-like sterols (which do not have a side-chain at C-24)
were not detected in the controls.
For terbinafine, the accumulation of squalene occurred simultaneously as the algal growth rate was inhibited.
For fluconazole, growth inhibition, even at 100 µM, was minimal (<15%), and yet a considerable
accumulation of 14 α-methylated sterols and a decrease in end-product sterols was observed. Hence,
inhibition of 14α demethylase did not lead to detrimental effects on P. subcapitata growth.
Terbinafine was similarly toxic to its target species (fungi) and to P. subcapitata and Chlorophyceae algal
species. Fungal inhibition is generally represented as the minimum inhibitory concentration (MIC), which is
approximately the EC95 (the concentration required to inhibit 95% of growth). For terbinafine, MICs range
from 9 nM to 300 µM for different fungal species.[34] In addition, the EC50 for ergosterol biosynthesis ranges
from 1.5 nM to 212 nM for different fungal species.[34] For P. subcapitata, the EC50 for phytosterols was in
the range of 64 to 80 nM. In contrast, fluconazole is more sensitive to its target species than to P. subcapitata

45
and freshwater algal species. MICs for fluconazole range from 0.13 µM to 326 µM for different fungal
species.[38] While the highest concentration tested was only 100 µM, it is unlikely that even at 300 µM, an
EC95 would be observed, especially for the Chlorophyceae communities.
According to the Swedish Chemical‟s Agency, the potential for a chemical to be hazardous in the
environment is measured by acute and chronic tests.[11] This system is based largely on the system adopted by
the European Union. Even though the 72-hour algal assay measures toxicity over several generations, it is
considered an acute test. A substance is labeled in the acute category 1 if the EC50 to fish, crustacea, algae, or
an aquatic plant is less than or equal to 1 mg/L. If a substance is part of acute category 1, it must be labeled as
„very toxic to aquatic life‟, it must be labeled with the word „warning‟, and the pictogram, as shown in Figure
47, must be included. If acute toxicity is present and the substance exhibits a lack of rapid degradation or it is
shown to bioaccumulate, then the substance is considered a chronic threat and is subject to a different set of
warning labels.[11]
Figure 47. The placard that must accompany any substance categorized in acute category 1, according to the
Swedish Chemical‟s Agency.[11]
An EC50 of 1 mg/L corresponds to an EC50 of 3µM for terbinafine. The EC50 for P. subcapitata based on
growth rate was 90 nM, and the EC50 for the green algae in the SWIFT experiment was 20 nM. As such,
terbinafine exhibits acute toxicity in the environment.
The placement of a chemical in Acute Category One does not depend on whether the chemical has been
observed in the environment. In fact, little is known about whether terbinafine is present in the environment.
Terbinafine concentrations have been measured at five WWTPs in Sweden, and while terbinafine was not
identified in any of the WWTP effluents tested, it was identified in the sludge.[2] If the sewage sludge is land-
applied, terbinafine may contaminate the environment. Toxicity data for terbinafine on terrestrial algal species
(or any other algal species) was not found.
In addition, data on the presence of terbinafine in surface waters could not be found. It can be hypothesized
that in locations where wastewater treatment is present, the concentrations of terbinafine in surface waters are
minimal. However, there haven‟t been any studies to indicate whether terbinafine is retained in septic
systems. In addition, if terbinafine were to be used in the future for veterinary use, a higher risk of
contamination would be present.
In contrast, while fluconazole has been detected at very low nanomolar concentrations (<0.03 nM) in surface
water,[3] and has been found to pass through WWTPs untreated,[2,3] it does not appear to be a risk to the
freshwater algal communities tested or to P. subcapitata.

46
6.0 CONCLUSIONS
6.1 EXPERIMENTAL CONCLUSIONS
6.1.1 SINGLE SPECIES ASSAYS
Terbinafine was very toxic to P. subcapitata, with an EC50 based on growth rate of 90 nM, and based
on biomass of 50 nM. With a 95% confidence interval, a statistically significant decrease in growth
rate was observed at concentrations above 20 nM.
Fluconazole was much less toxic to P. subcapitata. An LOEC of 64 µM was observed; however, at
64 µM the percent inhibition of growth rate was less than 10%.
Six sterols were identified in the P. subcapitata control samples, all of which are phytosterols:
Δ8,22-ergastadienol, Δ7,22-ergastadienol, ergostenol, chondrillasterol, 24,5α-cholesta-5,7,22-trien-
3β-ol, and Δ7-chondrillastenol.
Terbinafine stimulated the total sterol content at low concentrations (20 and 32 nM). Between 50 and
100 nM, a dose-response curve was observed, as the total sterol content decreased with increasing
concentration of terbinafine. Squalene was first observed in the 10 nM treatment. The percentage of
squalene increased as terbinafine increased, to 85% of the total content, at 100 nM.
Based on the results of both the assay and the sterol findings, terbinafine likely has the same mode of
action in P. subcapitata as in fungi, where an increased presence of squalene leads to cell death.
As the concentration of fluconazole increased, the concentration of all six end-product sterols
decreased. At 32 µM, the concentration of all six of the sterols was below half of the control levels.
Simultaneously, the concentration of four 14α-sterol intermediates increased. 14α-sterol
intermediates were first observed in the 10 µM treatment. The fraction of 14α-sterol intermediates
increased to a maximum of 0.8 in the 100 µM treatment.
In the presence of fluconazole, a decrease in sterol content and an increase in 14α-sterol
intermediates was seen at much lower concentrations compared to effects on growth. In fungi, the
presence of 14α-sterol intermediates influences membrane permeability and function and inhibits
cell growth. This does not appear to be the case with P. subcapitata.
6.1.2 SWIFT ASSAY
The green algal species were very sensitive to terbinafine, but the diatoms were not. The green algal
species had an EC50 based on lutein content, of 20 nM. The diatoms were stimulated at low
concentrations of terbinafine (namely at the 10, 20 and 32 nM treatments), and were at or above
control levels in the remainder of the treatments.
The diatoms and green algal species were much less sensitive to fluconazole than to terbinafine. This
observation is in agreement with the results from the P. subcapitata test.
6.2 OVERALL CONCLUSIONS
Based on the results from the single-species assay and the SWIFT assay, terbinafine should be
labeled as „very toxic to aquatic life‟ due to its toxicity to P. subcapitata and Chlorophyceae algal
communities.
P. subcapitata, green algal communities, and diatom communities do not appear to be sensitive to
fluconazole.

47
As in fungi, the mode of action of terbinafine and fluconazole in P. subcapitata is inhibition of sterol
biosynthesis at squalene epoxidase and 14α demethylase, respectively. It can be hypothesized that
the inhibition caused by terbinafine resulted in cell death, due to increased levels of squalene. The
inhibition of 14α demethylase did not inhibit the growth of P. subcapitata.

48
REFERENCES AND SOURCES [1] Boxall, Alistair B.A. (2004) The Environmental Side Effects of Medication. EMBO Reports 5(12):1110-
1116.
[2] Lindberg, Richard H. et al. (2010). „Screening of antimycotics in Swedish sewage treatment plants – water
and sludge.‟ Water Research. 44: 649-657.
[3] Kahle, Maren et al. (2008) Azole Fungicides: Occurrence and Fate in Wastewater and Surface Water.
Environmental Science and Technology 42(19): 7193-7200.
[4] Lamb, David et al. (1999) Molecular Aspects of Azole Antifungal Action and Resistance. Drug Resistance
Updates 2: 390-402.
[5] Cupp-Vickery, Jill R. et al. (2001) Ketoconazole-induced Conformational Changes in the Active Site of
Cytochrome P450eryF. Journal of Molecular Biology 311: 101-110.
[6] Sud, Inder J. and David S. Feingold (1985) Effect of Ketoconazole in Combination with Other Inhibitors of
Sterol Synthesis on Fungal Growth. Antimicrobial Agents and Chemotherapy 28(4): 532-534.
[7] Ghannoum, Mahmoud A. and Louis B. Rice (1999) Antifungal Agents: Mode of Action, Mechanisms of
Resistance, and Correlation of These Mechanism with Bacterial Resistance. Clinical Microbiology Reviews
12(4): 501-517.
[8] Lanyi, Janos K. et. al. (1974) Lipid Interactions in Membranes of Extremely Halophilic Bacteria. II.
Modification of the Bilayer Structure by Squalene. Biochemistry 13(24): 4914 – 4920.
[9] Van Den Hoek, C., D.G. Mann, and H.M. Jahns. Algae: An Introduction to Phycology. New York, NY:
Cambridge University Press, 1995.
[10] Lewis, MA. 2003. Algae and Vascular Plants. In Gary M. Rand PhD (ed.), Fundamentals of Aquatic
Toxicology: Effects, Environmental Fate, and Risk Assessment. Second Edition. Taylor and Francis, London,
England.
[11] Falck, Jonas. 2009. Criteria for Classification and Labelling of Substances and Mixtures – Environmental
Hazards. Swedish Chemicals Agency.
http://ec.europa.eu/enterprise/sectors/chemicals/files/reach/docs/events/clp_conf_falch_en.pdf
[12] Blaise, Christian and Paule Vasseur. 2005. Algal Micro-Plate Toxicity Test. In Christian Blaise and Jean-
Francois Ferard (ed), Small-Scale Freshwater Toxicity Investigations, Volume I: Toxicity Test Methods.
Springer, Netherlands.
[13] McLarnon-Riches, Christian J. et al. 1998. „Effects of Environmental Factors and Metals on Selenastrum
capricornutum Lipids.‟ Phytochemistry 49(5): 1241-1247.
[14] Institute for Health and Consumer Protection at the European Chemicals Bureau. 2003. Technical
Guidance Document on Risk Assessment, Part II. European Communities.
http://ecb.jrc.ec.europa.edu/documents/TECHNICAL_GUIDANCE_DOCUMENT/EDITION_2/tgdpart2_2e
d.pdf

49
[15] Porsbring, T. (2009) On Toxicant-Induced Succession in Periphyton Communities: Effects of
Single Chemicals and Chemical Mixtures. PhD thesis. University of Gothenburg.
[16] Porsbring, T. et al. (2007). „The SWIFT periphyton test for high-capacity assessments of toxicant effects
on microalgal community development.‟ Journal of Experimental Marine Biology and Ecology. 349: 299 –
312.
[17] Sheehan, Daniel J. (1999) Current and Emerging Azole Antifungal Agents. Clinical Microbiological
Reviews. 40 – 79.
[18] Georgopapadakou, Nafsika and Thomas J. Walsh (1996) Antimicrobial Agents. Chemotherapy 40(2): 279
– 291.
[19] Hitchcock, C., and P. T. Whittle. 1993. Chemistry and mode of action of fluconazole, p. 183–197. In J. W.
Rippon and R. A. Fromtling (ed.), Cutaneous antifungal agents: selected compounds in clinical practice and
development. Marcel Dekker, Inc., New York, N.Y.
[20] Kazakov, PV and SN Golosov (2004) A Simple Method for Obtaining Terbinafine Hydrochloride.
Pharmaceutical Chemistry Journal 34(4): 34-36.
[21] Bastert, J. et al. (2000). Current and future approaches to antimycotic treatment in the era
of resistant fungi and immunocompromised hosts. International Journal of Antimicrobial Agents. 17: 81–91
[22] Benveniste, Pierre. (2004). „Biosynthesis and Accumulation of Sterols.‟ Annual Review of Plant Biology.
55: 429 - 457.
[23] Charlwood, BV and DV Banthorpe (ed). 1991. Terpenoids, Vol. 7. In P.M. Dey and J.B. Harborne (ed),
Methods in Plant Biochemistry. Academic Press.
[24] Schaller, Hubert. (2004). „New Aspects of Sterol Biosynthesis in Growth and Development of Higher
Plants.‟ Plant Physiology and Biochemistry. 42: 465 – 476.
[25] Rahier, A., Benveniste, P. (1989) Mass Spectral Identification of Phytosterols. In: Nes, W.D., Parish, E.J.
(Eds.), Analysis of Sterols and Other Biologically Significant Lipids. Academic Press, Inc., San Diego, USA,
pp. 223-250.
[26] Wentzinger, Laurent F. et al. (2002) „Inhibition of Squalene Synthase and Squalene Epoxidase in Tobacco
Cells Triggers and Up-Regulation of 3-Hydroxy-3-Methylglutaryl Coenzyme A Reductase.‟ Plant
Physiology. 130: 334-346.
[27] Piironen, V. et al. (2000). „Plant Sterols: Biosynthesis, biological function, and their importance to human
nutrition.‟ Journal of the Science of Food and Agriculture. 80:939-966.
[28] Porsbring, Tobias et al. (2009) Toxicity of the pharmaceutical clotrimazole to marine microalgal
communities. Aquatic Toxicology 91: 203-211.
[29] Bligh, E.G. and W.J. Dyer (1959) A rapid method for total lipid extraction and purification. Canadian
Journal of Biochemistry and Physiology 37: 911-917.

50
[30] Mühlebach, A., Weber, K. (1998) Origins and fate of dissolved sterols in the Weddell Sea, Antartica.
Organic Geochemistry. 29: 1595-1607.
[31] Organization for Economic Cooperation and Development (OECD) Guidelines for the Testing of
Chemicals – Fresh water Alga and Cyanobacteria, Growth Inhibition Test. Number 201. Adopted March 23,
2006.
[32] Altenburger, Rolf et al. (2008). Bioassays with unicellular algae: deviations from exponential growth and
its implications for toxicity tests. Journal of Environmental Quality. 37:16-21.
[33] USEPA (2002). Short-term Methods for Estimating the Chronic Toxicity of Effluents and Receiving
Waters to Freshwater Organisms. Fourth Edition. October. EPA-821-R-02-013.
http://www.dep.state.fl.us/Water/wastewater/docs/ctf.pdf
[34] Ryder, N.S. (1992). Terbinafine: Mode of action and properties of the squalene epoxidase inhibition.
British Journal of Dermatology. 126, Supplement 39, 2-7.
[35] Hartmann, Marie-Andree (1998). Plant Sterols and the membrane environment. Trends in Plant Science
Reviews. 3(5): 170-175.
[36] European Medicines Agency. (2006). Pre-authorization Evaluation of Medicines for Human Use.
http://www.emea.europa.int/pdfs/human/swp/444700en.pdf
[37] Prokhotskaya, V. Yu. et al. (2000). On the Nature of the Three-Phase Response of Scenedesmus
quadricauda Populations to the Action of Imazalil Sulfate. Russian Journal of Plant Physiology. 47(6): 772-
778.
[38] Vincent-Ballereau, Francoise N. et al. (1991). Fluconazole: Review and situation among antifungal drugs
in the treatment of opportunistic mycoses of human immune-deficiency virus infections. Pharmaceutisch
Weekblad Scientific Edition. 13(2): 45 – 57.

51
APPENDIX ONE
Nutrient Stocks for Filtered River Water
Stock One:
9.34 grams NaNO3
7.12 mL 0.5 M K2HPO4
Fill to 100-mL with MQ-H2O
Stock Two:
4.057 mL 0.5 M MgSO4
10 mL 0.5 M Ca(NO3)2
Fill to 100-mL with MQ-H2O
Add to Filtered River Water
0.5 mL Stock One per liter filtered river water
0.5 mL Stock Two per liter filtered river water
40 µL 0.5 M NaCO3 solution per liter filtered river water
1 mL Fe-EDTA solution per liter filtered river water
8 µL micronutrient solution per liter filtered river water