Embed Size (px)
Citation preview

TOWN OF ROYALSTON
FINANCIAL FORECAST | A COMMUNITY COMPACT CABINET INITIATIVE
AUGUST 2016

PREPARED BY:
DLS | Technical Assistance Bureau
100 Cambridge Street, Boston, MA 02114
www.mass.gov/dls
Zack Blake, Chief, Technical Assistance Bureau
Marcia Bohinc, Project Manager, Technical Assistance Bureau

Michael J. Heffernan Commissioner of Revenue Sean R. Cronin Senior Deputy Commissioner
Supporting a Commonwealth of Communities mass.gov/DLS | P.O. Box 9569 Boston, MA 02114-9569 | (617) 626-2300
August 24, 2016 Board of Selectmen Town Hall 13 On the Common Royalston, MA 01368 Dear Board Members, I am pleased to present the enclosed financial forecast for the Town of Royalston as part of the Baker-Polito Administration’s Community Compact Cabinet initiative. This collaborative program strives to create clear mutual standards, expectations, and accountability for both the state and municipalities. It is my hope that our guidance provides direction and serves as a resource for local officials as we build better government for our citizens. Sincerely,
Sean R. Cronin Senior Deputy Commissioner

Table of Contents
Introduction ................................................................................................................................ 1
Community Profile ....................................................................................................................... 1
Financial Forecast ........................................................................................................................ 4
Revenues ..................................................................................................................................... 5
Tax Levy .............................................................................................................................................. 5
State Aid ............................................................................................................................................. 7
Local Receipts ..................................................................................................................................... 8
Available Funds/Other Financing Sources ....................................................................................... 10
Expenditures ............................................................................................................................. 13
Municipal Departments ................................................................................................................... 13
Education .......................................................................................................................................... 15
State Assessments ............................................................................................................................ 18
Risk Management ............................................................................................................................. 18
Employee Benefits ............................................................................................................................ 18
Other Amounts Raised ..................................................................................................................... 20
Miscellaneous/Other Financing Uses ............................................................................................... 21
Forecast Assumptions Table ....................................................................................................... 22
Updating the Forecast ................................................................................................................ 23
Other Observations ................................................................................................................... 24
Appendix: Structural Changes ................................................................................................... 25
Appendix: Amortization Schedules ............................................................................................ 27
Appendix: Forecast Tables......................................................................................................... 29

1
INTRODUCTION
Through the Community Compact Cabinet initiative (www.mass.gov/CCC), the Technical Assistance
Bureau for the Division of Local Services developed a financial forecast for the Town of Royalston.
The goal of the program is to encourage the implementation of municipal best practices that
promote good governance by fostering efficiency, accountability, and transparency in local
government.
As a best practice, a forecast is an essential financial planning and policymaking tool that
conservatively projects revenues and expenditures over a multiyear period. It is designed to allow a
municipality to evaluate the impact of various decisions and policy choices over time (e.g.,
development and growth, collective bargaining, capital planning, long-term obligations, etc.). As a
living document, the forecast includes reasonable assumptions that must be continually evaluated
and updated to reflect changing circumstances and events. By doing so, the forecast provides a fair
representation of the community’s fiscal future built to help guide the budget process and strategic
planning.
To develop Royalston’s forecast, a team from the Division of Local Services (DLS) Technical
Assistance Bureau met with local officials, reviewed budget related documents, and analyzed
financial data. The forecast offers a comprehensive look into the various revenue and expenditure
components and the assumptions used to construct a five-year financial forecast for the town.
Provided also is a detail financial forecasting tool for local use.
COMMUNITY PROFILE
The Town of Royalston (population 1,263) is a rural community located in the northwestern corner
of Worcester County. Operating under a selectmen-open town meeting form of government, the
three-member, elected board of selectmen serves as the chief executive, overseeing day-to-day
operations, and ultimately responsible for the fiscal well-being of the town.
Royalston’s modest FY2016 total budget of $2.4 million is a product of a small population, low property
values, and low tax rate. Because of this, the town struggles to formulate its annual budget to provide a
reasonable level of services using available recurring revenues of property tax levy, state aid, local
receipts, and other available sources. There has been a growing reliance on the taxpayers as
evidenced by an increase in the tax levy of almost 32 percent over the previous 10-year period, with

2
a budget growth of only 22 percent. State aid is not keeping pace; FY2017 state aid is $2,747 less
than the amount received in FY2007.
FY2016 TOTAL BUDGET REVENUE
Source: Division of Local Services
The $2.1 million general fund operating budget provides Royalston with part-time financial officers,
education, part-time police, on-call fire department, highway department, public library, health
department and sewer services. Public education is provided through the Athol-Royalston Regional
School District and through the Montachusett Regional Vocational Technical School.
Royalston’s education-related costs represent less than 29 percent of operating budget, although
education is still the largest single budget item. The assessment from the Athol-Royalston Regional
School District, based on student enrollment, is 80.8 percent of the total education budget. As
reported by the district, Royalston represents just 6.3 percent of the total FY2016 school enrollment
(equaling 86 students). This does not provide Royalston much of a voice in district spending and
resulting assessment. The remaining 19.2 percent of the education budget is the assessment from
the Montachusett Regional Vocational Technical School for another 18 students, or 1.3 percent of
that school enrollment.
Royalston’s budget for the department of public works, including that for snow and ice, almost
equals the education appropriation. The third largest appropriation is for debt, including the
Royalston Community School, and other fixed costs such as insurances and the retirement system
Tax Levy, 66.4%
State Aid, 11.2%
Local Receipts, 10.2%
Other, 12.2%

3
obligation. Emergency services dispatch, veteran’s services and animal control are all shared with
neighboring communities. Royalston is also one of the 11 communities belonging to the
Montachusett Public Health Network.
FY2016 GENERAL FUND OPERATING BUDGET Source: Royalston May 2015 Annual Town Meeting

4
FINANCIAL FORECAST
In the attached Excel workbook, we provide a five-year forecast, which contains summary pages
and detailed revenue and expense worksheets. The summary page shown below displays the
general fund and indicates either the amount of discretionary funds available (surplus) or the
existing revenue gap (shortfall). On the following pages, each major revenue and expenditure
category is defined in greater detail along with the assumptions used to build the forecasting tool.
FIVE-YEAR FINANCIAL FORECAST Source: Division of Local Services
With a current and credible forecast, Royalston’s officials will be able to evaluate the fiscal impact
of any contemplated spending choices or revenue raising options. However, a requirement of a
highly reliable forecast is accurate historical data, which unfortunately was not available. For this
forecast, revenue information is as reported on the tax recapitulation sheet and expenditure detail
as approved at town meetings.
FY2016 FY2017 FY2018 FY2019 FY2020 FY2021
Revenues
Property Tax Levy 1,609,956 1,708,226 1,756,568 1,768,252 1,825,997 1,878,627
State Aid Cherry Sheet 270,802 267,957 274,954 278,015 281,118 284,264
Estimated Local & Offset Receipts 316,098 303,197 300,364 297,194 297,218 296,296
Available Funds/Other Financing Sources 226,674 191,300 116,510 25,000 25,000 25,000
Total Revenues 2,423,530 2,470,680 2,448,396 2,368,462 2,429,333 2,484,187
Expenditures
General Government 225,175 226,998 230,495 234,076 237,744 241,502
Public Safety 223,025 228,209 230,852 233,560 236,337 239,183
Education 593,290 637,811 665,742 695,030 725,742 757,949
Public Works/Cemetery 666,216 583,780 592,080 600,587 609,306 618,244
Human Services 87,617 88,401 90,117 91,877 93,680 95,528
Culture & Recreation 56,183 59,529 60,193 60,874 61,572 62,288
Debt Service/Capital Plan 120,362 164,833 161,035 123,556 128,871 127,773
Intergovernmental 13,545 13,553 13,568 13,583 13,598 13,613
Fixed Costs/Benefits 125,578 129,567 133,101 136,822 140,741 144,870
Risk Management 51,274 52,280 53,848 55,464 57,128 58,842
Other Amounts Raised 29,157 28,615 29,018 29,427 29,842 30,263
Free Cash/Other Fin. Uses 232,107 274,821 210,083 190,899 191,679 188,860
Total Expenditures 2,423,530 2,488,397 2,470,132 2,465,755 2,526,240 2,578,915
Grand Total Revenues 2,423,530 2,470,680 2,448,396 2,368,462 2,429,333 2,484,187
Grand Total Expenditures 2,423,530 2,488,397 2,470,132 2,465,755 2,526,240 2,578,915Total Surplus/(Shortfall) 0 (17,717) (21,736) (97,294) (96,908) (94,728)
Financial Impact of COLA Increase 0 0 9,842 19,880 30,119 40,563Total Surplus/(Shortfall) after COLA 2,423,530 2,488,397 (31,578) (117,174) (127,027) (135,292)

5
REVENUES
A moderately conservative approach for forecasting revenues is recommended. Upon review of
historical information, conservative assumptions should be made about dollar or percentage
adjustments to the current year’s revenues in order to arrive at projections for the first forecast year.
The same analysis should be made for each successive year in the forecast. As new information becomes
available or circumstances change, the forecast is revised. With this approach, if projected revenues
increase (e.g., Governor’s budget, new growth, user fees, and free cash), then a corresponding
expenditure increase may be made to the recommended operating or capital budget. Alternatively, the
potential revenue gain could be diverted to reserve, or left unexpended and allowed to close at year-
end to free cash.
Tax Levy
The property tax levy is the revenue a community can raise through real and personal property
taxes. Proposition 2½ places constraints on how much the property tax levy can be increased from
year to year. The annual growth in the tax levy limit increases automatically by 2.5 percent over the
previous year’s levy limit, plus an allowance for certain new construction and other additions to the
tax rolls or new growth. In addition, a community may permanently increase its levy limit through a
voter approved override or temporarily through a debt exclusion or capital outlay expenditure
exclusion.
Since FY2005, Royalston’s property tax levy has grown from almost $1.1 to $1.6 million. This 48
percent increase is driven by the regional school assessments and debt exclusions for the Royalston
Community School, the Athol-Royalston Middle School, and a new fire engine. FY2017 will reflect
the first year of levy increases for the excluded debt service on the wastewater treatment plant. A
chart on the following page illustrates Royalston’s levy components.
6
TAX LEVY Source: Division of Local Services
New Growth: New growth is a dollar increase in the annual levy limit that reflects additions to the
tax base since the previous fiscal year, and is attributable to new construction, renovation, and any
other growth in the tax base that is not the result of property revaluation. With 94 percent of
Royalston’s tax base classified as residential, primarily single family homes or vacant land, its new
growth amount is driven mainly by renovations to single family homes. Trends in new growth follow
the general economy, and as with most communities, Royalston saw a sharp decline after FY2007.
An update of all personal property accounts, resulting in increased values, mitigated the drop for
FY2009, but growth has not returned to the pre-2008 activity. This translates into smaller annual
new growth dollars applied to the levy limit (see New Growth By Class worksheet).
Consequently, in this forecast, new growth is projected conservatively. Taking into account the
town’s three-year average for new growth dollars by property class, new growth for FY2017 and
FY2018 is projected to be $10,000 each year and then increase to $10,500. The assessors submit
new growth and property value information to the DLS on Schedule LA-13, typically in the fall. Once
approved, the forecast should be updated to reflect the certified new growth.
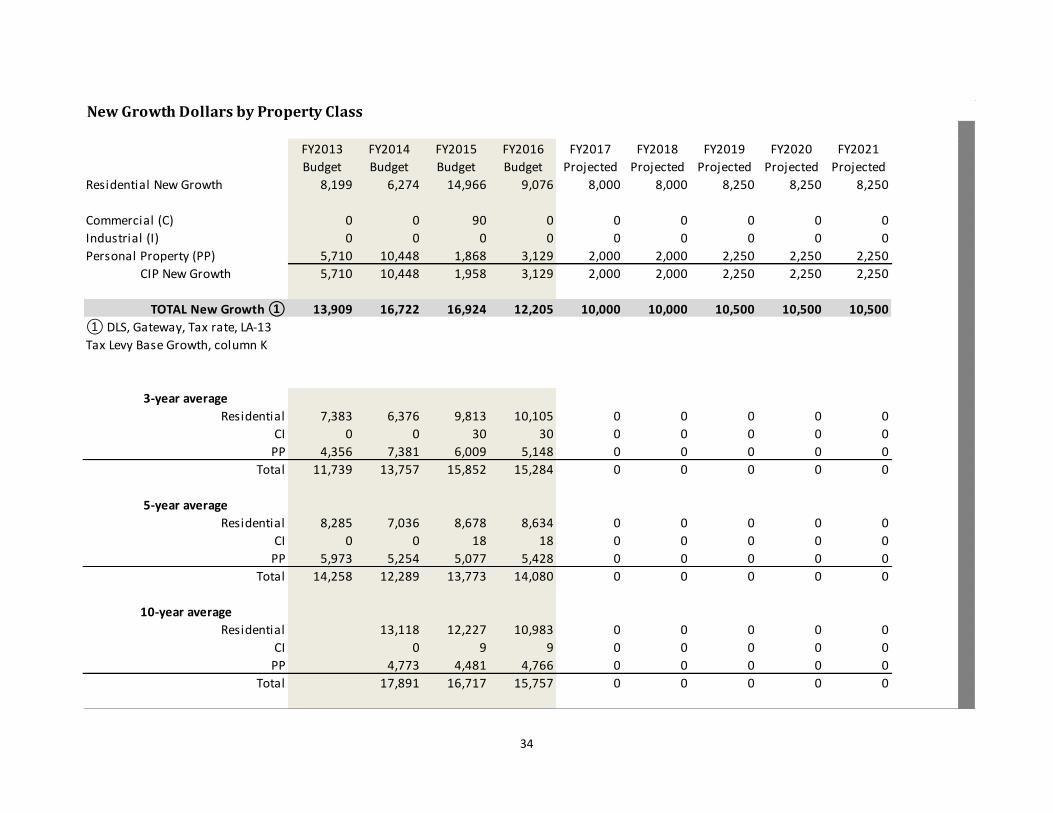
NEW GROWTH AVERAGES Source: Division of Local Services
0
2
4
6
8
10
12
14
16
18
2005 2006 2007 2008 2009 2010 2011 2012 2013 2014 2015 2016
Do
llars
(in
$1
00
,00
0) Debt Exclusion(s)
Override
Certified New Growth
2.5% Increase
Prior Year Tax Levy
New Growth
3-Year
Average
5-Year
Average
10-Year
Average
Residential 10,105 8,634 10,983
Commercial/Industrial 30 18 9
Personal Property 5,148 5,428 4,766
Total 15,284 14,080 15,757
7
NEW GROWTH BY CLASS Source: Division of Local Services
Debt Exclusions: Recently there have been three debt excluded projects: the Royalston Community
School, to be retired in FY2018, a fire engine/pumper for seven years expiring in FY2021, and a 36-
year loan for the wastewater treatment plant with the first payment due in FY2017. We projected
debt exclusion amounts for the fire engine and wastewater treatment plant based on received debt
amortization schedules. (APPENDIX: AMORTIZATION SCHEDULES) Debt for the Royalston Community
School is shared between Athol and Royalston depending on the enrollment numbers and is
forecast for FY2018 in the same amount as FY2017 (see Revenues and Debt worksheet). Any
additional excluded debt or any changes should be added to the worksheet to update the total tax
levy. Debt exclusion information is entered on Schedule DE-1 on the tax rate.
State Aid
State aid is a combination of programs and reimbursements the community receives from the
Commonwealth as reported on the Cherry Sheet, which is the official notification from DLS of
estimated state aid to be paid and charges to be assessed. As the state budget process unfolds,
updated state aid proposals are posted on the DLS website. Cherry Sheets are issued once the state
budget is enacted by the Legislature and approved by the Governor. The figures used in this
forecast are based on the final state 2017 budget signed by the Governor in July. Current and
historical Cherry Sheets may be found on the DLS Municipal Databank/Local Aid Section webpage,
www.mass.gov/dls.
$0
$5,000
$10,000
$15,000
$20,000
$25,000
$30,000
$35,000
2005 2006 2007 2008 2009 2010 2011 2012 2013 2014 2015 2016
Personal Property (PP)
Industrial (I)
Commercial (C)
Residential

8
Chapter 70: Using complex formulas, the Department of Elementary and Secondary Education
(DESE) annually determines the total school foundation budget, minimum local contributions, and
allocation of foundation budget between the local and regional school districts. DESE then
calculates the distribution of Chapter 70 educational aid and determines required net school
spending figures. A community’s required local contribution is a historical figure that takes into
account an estimate of the percentage change in revenue growth (municipal revenue growth factor
or MRGF), enrollment trends, and inflation levels from the previous year. Royalston being a part of
the Athol-Royalston School District does not receive any direct school funding. Understanding this
calculation is still important as it is a driving factor, along with student population, in the annual
assessment amount from the school district. More information on school finance may be found on
at DESE/School Finance/Chapter 70 webpage, (www.doe.mass.edu/finance/chapter70/).
Unrestricted General Government Aid (UGGA): The FY2017 figure is based on the final state 2017
budget, and future projections reflect a 1.5 percent annual increase.
Other Local Aid Accounts: Royalston receives reimbursements for veterans’ benefits, certain local
property exemptions, and state-owned land. The final state 2017 budget figures are included in the
forecast and level funded annually. Aid for public libraries offsets a corresponding appropriation
and is level funded.
Local Receipts
Local and offset receipts are locally generated revenues other than real and personal property
taxes.
9
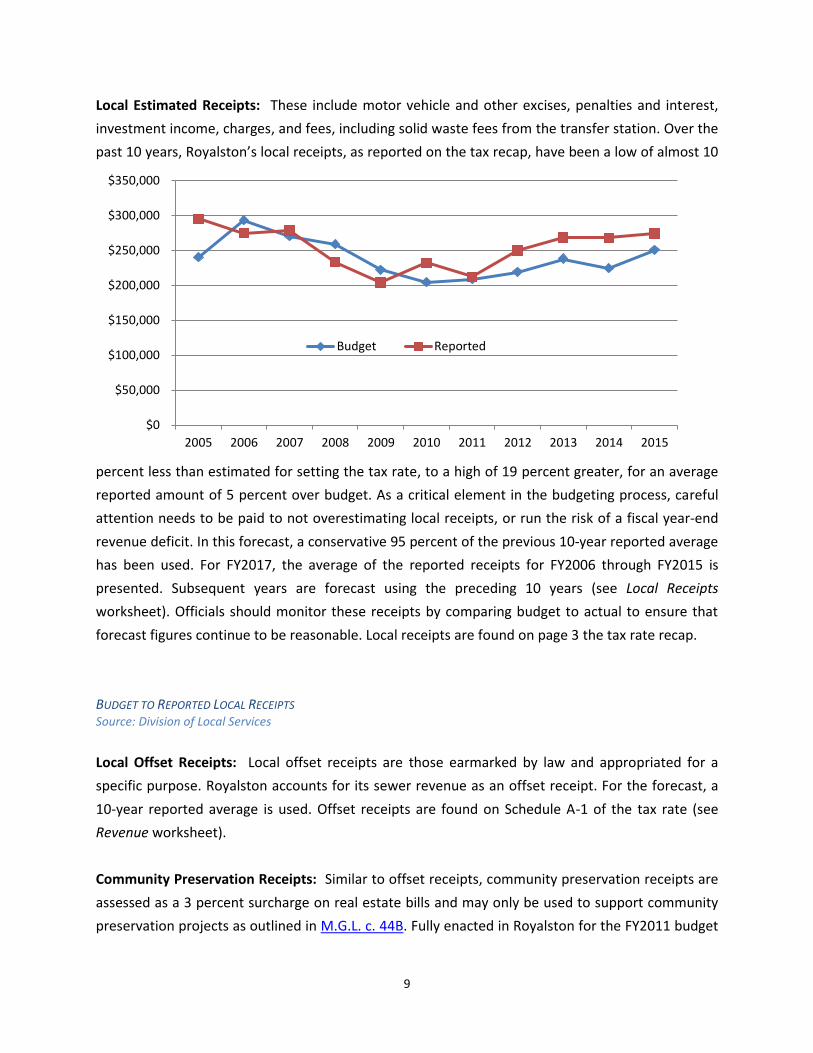
Local Estimated Receipts: These include motor vehicle and other excises, penalties and interest,
investment income, charges, and fees, including solid waste fees from the transfer station. Over the
past 10 years, Royalston’s local receipts, as reported on the tax recap, have been a low of almost 10
percent less than estimated for setting the tax rate, to a high of 19 percent greater, for an average
reported amount of 5 percent over budget. As a critical element in the budgeting process, careful
attention needs to be paid to not overestimating local receipts, or run the risk of a fiscal year-end
revenue deficit. In this forecast, a conservative 95 percent of the previous 10-year reported average
has been used. For FY2017, the average of the reported receipts for FY2006 through FY2015 is
presented. Subsequent years are forecast using the preceding 10 years (see Local Receipts
worksheet). Officials should monitor these receipts by comparing budget to actual to ensure that
forecast figures continue to be reasonable. Local receipts are found on page 3 the tax rate recap.
BUDGET TO REPORTED LOCAL RECEIPTS Source: Division of Local Services
Local Offset Receipts: Local offset receipts are those earmarked by law and appropriated for a
specific purpose. Royalston accounts for its sewer revenue as an offset receipt. For the forecast, a
10-year reported average is used. Offset receipts are found on Schedule A-1 of the tax rate (see
Revenue worksheet).
Community Preservation Receipts: Similar to offset receipts, community preservation receipts are
assessed as a 3 percent surcharge on real estate bills and may only be used to support community
preservation projects as outlined in M.G.L. c. 44B. Fully enacted in Royalston for the FY2011 budget
$0
$50,000
$100,000
$150,000
$200,000
$250,000
$300,000
$350,000
2005 2006 2007 2008 2009 2010 2011 2012 2013 2014 2015
Budget Reported
10
cycle, a five-year reported average is used in the forecast. Community preservation receipts are
found on Schedule A-4 of the tax rate (see Revenue worksheet).
Available Funds/Other Financing Sources
This group of revenues includes reserves (i.e., free cash and stabilization funds) and special revenue
sources (e.g., Chapter 90 highway funds, overlay surplus, and receipts reserved for appropriation). It
also includes other financing sources that the town has created through line-item transfers in
recent years. Once the property tax rate is set, these available funding sources may be used to fund
any lawful current or prior year expenditure.
Free Cash: A community’s free cash represents the amount of unrestricted funds available for
appropriation that have been certified by DLS as of July 1st. The Available Funds worksheet contains
historical free cash amounts and uses. Royalston has certified free cash in only three of the last 10
years and twice used the full amount to fund the subsequent year’s budget.
Stabilization Funds: Royalston has one general stabilization fund. As provided in M.G.L. c. 40, §5B,
one or more stabilization funds may be established for different purposes. Royalston has tried with
three unsuccessful votes at town elections to establish a capital project stabilization fund. Unlike
free cash, the monies accumulated in a stabilization fund automatically carry forward from one
fiscal year to the next including earned interest.
In lieu of the certification process, Royalston has established a year-end practice of transferring
anticipated unused appropriations from the general fund to the stabilization fund at June special
town meetings. On paper, this provides a ready funding source for snow and ice deficits, cash
purchases of capital equipment, building maintenance, and other one-time expenses. But we
caution that, if the anticipated revenue as reported on the tax rate recap used to set the tax rate for
that year is not received (tax revenues, local receipts, or state aid), making transfers of perceived
excess appropriations may cause revenue deficits. Until the year-end close is completed and all
revenues counted, any town meeting actions using current year balances are not fiscally sound.
The Available Funds worksheet shows the historical available stabilization fund balances, including
the FY2016 fund balance addition based on the transfer approved at the June 2016 special town
meeting, and the reduction of the 2017 fund balance based on the May 2016 annual town meeting.

11
FREE CASH AND STABILIZATION BALANCES AND USES Source: Division of Local Services
After FY2017, no balance is forecast. This account will need to be updated as the actual balance is
known. It is important to note, because unverified unused general fund appropriations have been
transferred to create the stabilization fund balance prior to the certification of the balance sheet
and free cash for several years, there could very well be a general fund revenue deficit. Any
remaining unappropriated stabilization fund balance may be needed to fund any such deficit.
As a best practice, neither free cash, the stabilization fund, nor any nonrecurring revenue source
should be used to support the operating budget, reduce the tax rate or pay any recurring
expenditures. This forecast has no projections of free cash, so it will not be available for any uses
until certified.
Chapter 90/Highway Funds: Annually, the Massachusetts Department of Transportation notifies
the town of awarded Chapter 90/Highway grant funds to which the town may be entitled. Because
the grant amount is offset by an appropriation and subject to annual notification, the forecast does
not include projections beyond the FY2017 grant amount of $284,356.
Overlay Surplus: Each year, any balance in the overlay reserve accounts in excess of the remaining
amount of the warrant to be collected or abated in that year may be certified by the assessors as
0.0%
5.0%
10.0%
15.0%
20.0%
25.0%
30.0%
35.0%
40.0%
$0
$100,000
$200,000
$300,000
$400,000
$500,000
$600,000
$700,000
2005 2006 2007 2008 2009 2010 2011 2012 2013 2014 2015 2016
Free Cash Certified Amount
General Stabilization Fund
Free Cash and Stab Fund as %of Total Budget
12
surplus and appropriated for any lawful purpose. The forecast does not project the availability or
use of overlay surplus over the next five years. As of the setting of the FY2016 tax rate, there was a
balance of over $88,000 in the overlay account. This should be investigated for possible surplus and
could be appropriated at a subsequent town meeting. Any unappropriated overlay declared surplus
at the end of the fiscal year becomes free cash. This account should be reviewed annually as part of
the budget process. Overlay amounts can be found Schedule OL-1 of the tax rate.
The Revenues worksheet has formula links to the New Growth, Local Receipts, and Available Funds
worksheets and from them calculates a grand total.

13
EXPENDITURES
As a policy decision, Royalston should determine a particular approach for forecasting expenditures.
The options to consider include a maintenance (level service) budget, a level funded budget, or a
budget that be adjusts expenditures by a specified percentage increase or decrease (either across
the board or by department).
A maintenance budget projects what it costs to maintain the current level of staffing and mix of
services into the future. In this approach, it is helpful to assume that all current laws and regulations
remain in effect during the forecast period. Negotiated collective bargaining cost increases, salary
step increases, and longevity pay can all be projected to the year a contract ends. Possible
personnel costs associated with future contracts should not be included because the purpose of the
forecast is to determine what revenue is left after the maintenance budget is funded. Because of
contractual obligations and the impact of inflation on expenses, a maintenance budget will almost
always be greater than the prior year appropriation.
A level funded budget appropriates the same amount of money to each municipal department and
is tantamount to a budget cut from the prior-year appropriation. Inflation in mandated costs and
other fixed expenses still must be covered, usually at the expense of the general government
operating budget.
The following expenditure discussion is based on a maintenance budget with increases forecast
based on historical appropriations. As previously noted, accurate historical data is needed for a
reliable forecast. Actual expenditures for prior fiscal years were not available and, therefore all
expenditure information is based on appropriations as approved at town meetings.
Municipal Departments
Departments are grouped by major categories consistent with town and state expenditure
reporting (see Expenditure worksheet). Categories include: General Government, Public Safety,
Education, Public Works, Human Services, and Culture/Recreation. Broken out separately are
Personal Services, Expenses, and Capital Outlay/Special Articles.
Personnel Services: The town has three categories of appointed employees:
Employees covered by a collectively bargained contract (expiring on June 30, 2017). These
are all full-time and permanent part-time, non-uniformed employees, including the library

14
director, the clerk to the Board of Assessors, and all full-time employees of the Department
of Public Works (DPW)
Non-union police and fire personnel subject to a classification and compensation plan
All other employees
All personnel service costs for FY2017 are taken from the May 2016 annual town meeting warrant,
and are level funded for the projected years. Proposed changes in personnel costs are captured
separately in the cost-of-living adjustment (COLA) worksheet. The COLA worksheet estimates the
impact of future contract settlements and compensation plan increases for approval by town
meeting. Not including personnel cost changes enables the forecast to determine any remaining
revenue, and with the COLA information, provides policymakers data to support decisions regarding
any changes.
For illustration and based on consistent historical appropriations, subsequent years (FY2018
through FY2021) are presented with a 2 percent COLA for all employees. Because the ‘all other
employees’ group has received increases in appropriations each year, they have been included at
the same percentage on the COLA worksheet. To consider different scenarios, percentage increases
can be entered for each year to generate the estimated impacts. No increases have been estimated
for elected officials. The COLA impact is presented on the summary page.
FINANCIAL IMPACT OF COLA Source: Division of Local Services
Financial Impact Analysis
2% 2% 2% 2%
FY2017 FY2018 FY2019 FY2020 FY2021
Budgeted Projected Projected Projected Projected
Town Compensation Plan (effective 7/1/2016)
General Government 66,534 67,865 69,222 70,606 72,019
Public Safety 122,501 124,951 127,450 129,999 132,599
Human Services 19,746 20,141 20,544 20,955 21,374
Culture/Recreation 32,953 33,612 34,284 34,970 35,669
Town Compensation Plan Personal Services 241,734 246,569 251,500 256,530 261,661
Financial Impact of COLA 4,835 9,766 14,796 19,927
DPW Contract (expires 6/30/17)
DPW Personal Services 250,349 255,356 260,463 265,672 270,986
Financial Impact of COLA 5,007 10,114 15,323 20,637
TOTAL Financial Impact of COLA 9,842 19,880 30,119 40,563

15
Expenses and Capital Outlay: Expenses are projected to increase by 2.5 percent per year based on
historical appropriations. Capital outlay does not follow a documented capital plan, rather these
costs are voted as separate articles at the annual town meeting. With the exception of the sewer
department, which has had small capital outlays for the last several years, the approved capital
expenditures are captured in the Miscellaneous/Other Financing Uses section.
Education
As stated in the revenue assumptions, DESE annually determines required net school spending
(NSS), which is the sum of the Chapter 70 aid plus a required district contribution. The required
contribution is allocated by DESE to the district’s members based on foundation enrollment (the
number of pupils for whom a school district is financially responsible). The Athol-Royalston Regional
District’s budget has been exceeding DESE’s NSS requirement, therefore requiring its member
towns to make supplemental contributions based on the actual district student enrollment. Two
additional components make up the annual assessment, which are not part of the NSS calculation:
the debt payment for the Royalston Community School allocated on enrollment in that school, and
transportation apportioned on district enrollment. In addition, Royalston is a member the
Montachusett Regional Vocational Technical School, whose assessment is also calculated based on
a NSS requirement and required district contribution. The DESE enrollment amounts are higher than
those provided by the district calculation for the supplemental amounts; however, the DESE
numbers used for the Athol portion also are higher and the proportion is the same.
EDUCATION ASSESSMENTS Source: Division of Local Services
Education Assessments
2014 2015 2016 2017
Athol-Royalston Regional
Student Enrollment (DESE) 122 108 107 131
Required Minimum Contribution (DESE) 325,953 337,236 372,514 419,140
Supplemental & Transporation 127,281 110,321 106,617 119,677
Debt 54,370 44,575 36,667 31,970
Total Assessment 507,726 492,240 515,905 570,918
Montachusett Regional Vocational Technical
Student Enrollment (DESE) 24 23 20 19
Required Minimum Contribution (DESE) 94,098 106,464 101,757 87,950
Supplemental & Transporation 9,464 9,009 12,402 11,044
Total Assessment 103,562 115,473 114,159 98,994

16
Changes in student enrollment at Athol-Royalston Regional over the past few years have resulted in
a fluctuating assessment trend, including a FY2017 enrollment spike that increased the assessment,
not including the debt component, over 12 percent. Not expecting additional large increases in
student enrollment, this forecast projects an increase of 6 percent. Declining enrollment at
Montachusett Regional has offset budgetary increases, and the projection used is 1 percent. For
this forecast, the debt portion of the Athol-Royalston Regional assessment is shown in the debt
section and not considered with the education appropriation.
Debt Service/Capital Plan
Debt service is projected based on the existing general fund payment schedules (see Debt
worksheet). The retirement of the debt for the Royalston Community School results in a drop in
debt service beginning in FY2018. Because the debt is excluded, no additional funds become
available in the budget; however the retirement will have a positive effect on the tax rate. The
current lease information is also reported in this section of the forecast. The DLS opinion on lease
purchases is consistent with that of debt issuance in requiring a two-thirds vote at town meeting for
multiyear authorizations. The town budget has various amounts to cover interest costs on
temporary borrowing, so a small amount of this is also included. For planning purposes, debt is
often looked at as a percentage of revenues or of operating budget. A recommended policy is to
identify a debt service target, typically between five and ten percent of either, and as the debt is
paid down, to maintain that target level through new capital investment. Debt service as a
percentage of the full budget is provided.

17
DEBT SERVICE AS PERCENT OF BUDGET Source: Division of Local Services
Incurring additional debt is anticipated in the next 12 to 24 months as part of the Last Mile wireless
broadband project currently being piloted. Royalston has received grant funding for the initial
phase, but it will need to borrow to complete the project. When the town issues the bonds, the
forecast will need to be revised by adding the new debt payment schedule in the Debt worksheet.
The town has issued debt in excess of the tax levy limit (excluded) and pays cash for other capital
purchases as articles at the annual town meeting. The capital committee, although dedicated, is not
effective from a planning perspective. Only on an informal basis, the committee solicits input on
capital needs from the departments, and does not report at town meeting. Any capital articles are
put forth by the departments. A capital planning policy would provide a means for planning the
maintenance and improvement of Royalston’s capital assets and infrastructure. It would also
outline guidance for reviewing, planning, and coordinating capital improvements so as to promote a
systematic acquisition and replacement schedule and ensure that, given limited resources, the
town’s capital needs are met. The capital policy would also strengthen the capital committee’s role
in checking departmental spending at town meeting and making long-term decisions.
A debt policy would support the capital planning policy to responsibly address the capital needs,
provide flexibility in current and future operating budgets, control borrowing, and maintain capital
$2
7,5
53
$5
4,3
70
$1
11
,870
$1
11
,162
$1
55
,633
1.31%
2.24%
4.77%4.59%
6.25%
0.00%
1.00%
2.00%
3.00%
4.00%
5.00%
6.00%
7.00%
$-
$20,000
$40,000
$60,000
$80,000
$100,000
$120,000
$140,000
$160,000
$180,000
2013 2014 2015 2016 2017Total Debt Service Debt Service as % of Budget

18
investment capacity. Also to be explored with the debt policy should be the financing of large
purchases over several years instead of full cash purchases. That would allow the stabilization fund
to not be depleted each annual town meeting and better position Royalston for emergency needs.
State Assessments
Royalston pays various state assessments for participating in state and regional programs that are
reported on the Cherry Sheet. The small town road assistance program (STRAP) assessment is the
largest and reimburses the state for a portion of the road assistance program grant made for
certain capital construction projects. The state finances 100 percent of the cost of these projects in
advance. Royalston must then repay 30 percent of the total state grant over a 10-year period.
Because these payments are fixed at the time the grant agreement is finalized and no interest is
charged, there is no increase in this forecast.
Other state assessments that Royalston pays are air pollution and Registry of Motor Vehicles
surcharges. With very little difference year to year, these forecast projects the assessments to
increase by 0.5 percent annually.
Risk Management
Risk management comprises the town’s casualty and liability insurances, including police and fire
accident insurance, property and auto coverage, and public official bonds. The police and fire
accident insurance is provided as a three-year policy from VFIS. Based on previous appropriations,
the insurances are all projected to increase 3 percent annually. The public official bonds are
budgeted with the treasurer’s expenses.
Employee Benefits
Employee benefits include retirement, Medicare/Federal Insurance Contributions Act (FICA),
workers’ and unemployment compensations, and group health and life insurances. Combined,
these expenditures are $130,000, or 6.3 percent of the total general fund budget of $2,063,720
approved for FY2017.

19
FY2017 EMPLOYEE BENEFIT APPROPRIATION Source: Division of Local Services
Retirement: Royalston is a member of the Worcester Regional Retirement System (WRRS). This
system has a funding schedule that increases each year and is estimated to be fully funded in 2035.
Every other year an actuarial valuation is prepared that takes into account system activity and
investment return, so the numbers will change and should be revised accordingly. Based on
Royalston’s portion of the retirement system, the town’s contributions are projected to increase 6
percent annually from the FY2017 requirement. As Royalston has experienced, this line item can
fluctuate wildly and should be monitored in the forecast as amounts become known.
Medicare/FICA: For all employees hired after April 1, 1986, a 1.45 percent Medicare tax is withheld
from their paychecks and matching amounts paid by the community. Because no wage increases
are included in this forecast, this line has been forecast with level funding. The forecast will need to
be revised with any personnel cost changes.
Part-time, seasonal or temporary employees who are not eligible to participate in the WRRS must
be placed in Social Security or an equivalent retirement plan as permitted by the federal Omnibus
Budget Reconciliation Act of 1990 (OBRA). A deferred compensation plan, which has a contribution
level of at least 7.5 percent of an employee’s gross compensation per pay period, is considered a
qualifying retirement plan and an appropriate vehicle for providing necessary benefits to employees
not eligible for the WRRS. An advantage is that the town may avoid including employees in the
Social Security system, which requires both employers and employees to contribute in excess of 7
Retirement, $50,567 , 39%
Medicare/FICA, $10,000 , 8%
Workers' Compensation, $15,000 , 11%
Unemployment Compensation,
$4,000 , 3%
Group Health/Life Insurance,
$50,000 , 39%

20
percent of compensation by funding or requiring employees to contribute a total of at least 7.5
percent of compensation to the plan. All Royalston employees not eligible for the WRRS are
contributing to an OBRA plan.
Workers’ Compensation: This program is in place to make sure workers are protected by insurance
if they are injured on the job or contract work-related illnesses. Royalston participates in the
Massachusetts Education and Government Association (MEGA) pool. Based on recent appropriation
history, this line has been forecast with level funding.
Unemployment Compensation: Unemployment compensation is designed to pay benefits to
workers who lose their jobs through no fault of their own, and it is funded based on employees’
salaries and claims filed. Based on the recent appropriation history and anticipating no reduction in
staff, this line has been forecast with level funding.
Group Health & Life Insurance: Royalston offers medical insurance and group life insurance through
Massachusetts Interlocal Insurance Association (MIIA) for employees regularly scheduled for 20
hours or more. Employees enrolled as of July 1, 2011 pay 25 percent of the premium with the town
paying the remaining 75 percent. For employees hired after July 1, 2011, the town’s portion decreases
to 70 percent and the employee’s increases to 30 percent of the premium. Additionally, full-time
employees who choose not to enroll in the town’s insurance because they are enrolled in another plan
will receive an “opt-out” benefit of $1,800 in lieu of a single plan or $7,000 in lieu of a family plan.
OPEB: Other post-employment benefits (OPEB) are benefits other than pensions that are earned
during the employee’s active working career but not actually paid until after the employee retires. By
far, the most significant of these is health insurance, but they may also include life insurance, dental or
other benefits. With so few full-time employees eligible for these benefits, Royalston has not adopted
M.G.L. c. 32B, §20 to establish an OPEB trust fund and has not designated any funds for OPEB. OPEB
has been excluded from this forecast; however, the liability for OPEB is required to be reported on
the audited financial statements of the town’s finances.
Other Amounts Raised
This includes amounts typically raised on the tax recap sheet rather than through operating
budgets, which would include prior-year deficits, court judgments, Cherry Sheet offsets,
intergovernmental charges, and allowance for property abatements and exemptions (overlay).
Deficits and court judgments are not forecasted and would need to be included in the forecast in
the event something materializes. The Cherry Sheet offsets are expenses that correspond to state

21
aid figures, which for Royalston is for the Newton Library. The overlay is projected to increase 1.5
percent annually, keeping pace with the growth in the levy net of the debt exclusion.
Although not included on the town meeting warrant, it is important to provide for the other
amounts raised when budgeting. In this projection, using the forecast revenue as described, the
expenditures approved at town meeting plus the required other amounts raised result in a revenue
gap of $17,717.
Miscellaneous/Other Financing Uses
These include the advisory committee’s reserve fund, community preservation fund, special
articles, transfers out of the general fund, and prior-year expenditures. The advisory reserve fund
has been historically budgeted at $20,000, and it has been continued. The community preservation
is based on a five-year average, and the expenditures are set to equal the anticipated revenue. The
special articles are capital outlay expenses for equipment purchases, building maintenance, and
departmental requests, and they also include any snow and ice deficits. In FY2017, $214,400 was
appropriated for these as separate articles, including $20,000 for snow and ice. For this forecast
$150,000 is entered as an initial discussion point.
Once the tax rate is set, a community may use available funds to supplement the current year’s
budget through June 30th, which would be reported on the subsequent tax recap. In the current
budget year, the prior-year expenditures are reported in this group, making sure that the budgeted
revenues balance with gross appropriations as reported on the tax recap. When the fiscal year-end
closing is completed, expenses would be reflected in the appropriate department from the prior
year.

22
FORECAST ASSUMPTIONS TABLE
FY2017 FY2018 FY2019 FY2020 FY2021
REVENUES:
Levy Conservative new growth estimates
Levy to the maximum allowable amount
Debt exclusion based on provided schedules figures
State Aid Chapter 70: payments made directly to the Athol-Royalston School District
UGGA increased 1.5 percent annually
State owned land and the library offset increased 0.5 percent annually
Other local aid accounts are level funded
Local & Offset Receipts
Conservative projections – rolling 10-year averages
Available Funds/ Other Financing Resources
Free cash certifications are not projected
General stabilization fund shows available balances as calculated on activity thru June 2016. Not included as funding sources
Chapter 90/Highway Funds are not projected beyond FY2017
Overlay surplus is not projected
EXPENDITURES:
Personnel Services Based on existing contracts and the town’s compensation plan
COLA adjustment worksheet provided to estimate future potential settlements/increases
Future increases are included at 2percent
Expenses and Capital Outlay
Expenses are projected to increase 2.5 percent annually
No capital outlay is projected
Education Regional school assessment is projected to increase 5 percent annually
Vocational technical school at 1 percent
Debt Service Based on existing general fund payment schedules
Temporary interest is projected to be $2,000 annually
Capital Plan No projections for a capital plan
State Assessments Other state assessments are projected to increase 0.5 percent annually
Risk Management Police & fire accident and property & auto insurances are all projected to increase 3 percent
Employee Benefits Retirement is projected to increase 6 percent annually
Medicare/FICA are projected to increase 2 percent annually
Workers’ compensation is forecast as level
Unemployment compensation is level
Group health and life insurance are projected to increase 1 percent annually
Other Amounts To Be Raised
Cherry sheet offsets expenses are equal to the estimated revenues
Overlay is forecast to increase 1.5 percent annually
Miscellaneous Local offset receipts expense is equal to the estimated revenue
Transfers to stabilization funds are not included
Special articles is forecast at $150,000 each year
Reserve fund is level at $20,000

23
UPDATING THE FORECAST
Annually, the town should update the forecast after the end of the fiscal year. The budget fiscal
year should be updated to reflect actual expenditures, the current year’s budget entered, and
another column added to maintain the five-year forecast model. The process of making these
changes is straightforward, but great care should be taken to preserve the spreadsheets and
formulas. For these reasons, Royalston should create a copy of the forecast in an Excel workbook
before proceeding.
First: Insert a column after the last displayed year to each worksheet.
Second: Highlight the last projected column from the fiscal year to the bottom, and then from the
bottom (a + will be in the corner) drag it to the right, creating a copy of the content and all links
under a new fiscal year. Repeat this process in each worksheet. There should always be a blank
column between the last projected year and the dark gray column preceding the Average Percent
Change and/or Projection Percent columns.
Third: Enter actual expenditures for the recently closed fiscal year and the new budget as adopted.
The Projection Percent will carry forward to columns added in the above step, although the
historical average percentage should be updated to include the recently closed fiscal year.
Particular attention should be paid to:
State Aid – Enter final estimates.
Local Receipts – Enter the actual collections on the lower part of the worksheet.
Available funds – At the close of the fiscal year, the 6/30 available balances for the
stabilization funds should be entered. Enter the free cash amount when certified by DLS.
Debt — Enter from debt service payment schedules.
Fourth: When the new tax recap is approved by DLS, review and balance the current year’s
budgeted revenues (Revenues worksheet) to the recap figures and the budgeted expenditures to
the revenues on the Summary worksheet (the total surplus/(shortfall) should be zero). It is at this
time that the new growth, levy limit, total tax levy, estimated receipts, and other amounts to be
raised will be finalized.
Average
FY2021 Percent Projection
Projected Change Percent
24
OTHER OBSERVATIONS
It is recognized by DLS and Royalston that the town is challenged by several financial management
problems, including setting the tax rate timely, having a formal budget process, and maintaining
complete, reliable financial records. The selectmen applied through the Community Compact Cabinet
for this financial forecast as well as a financial management structure review as a separate project.
Those management problems and others are addressed in detail in the financial management structure
report. Additionally, we make the following observations:
Royalston should consider creating classification and compensation plans for all employees.
Based on the current written job descriptions, all town positions (other than those filled by
election) doing similar work or having equal responsibilities should be arranged accordingly
into grouped classifications. A classification plan generally is organized by level reflective of
increasing areas of responsibility. The compensation plan should have minimum salaries or
wage rates and provide periodic step increases based on length of service up to the
maximum compensation allowed and should be adopted by town meeting.
A warrant article should be voted to appropriate an amount not to exceed the annual
amount of Chapter 90 funds available. Currently Royalston votes an annual article for the
treasurer to pay for projects using Chapter 90 funds and proceeds from STRAP grants, but
funds are not appropriated and reported on the tax rate recap. Appropriation of Chapter 90
funds and full expenditure is reported on Schedule B2 of the tax rate.
According to the Uniform Massachusetts Accounting System (UMAS), all assets and long
term obligations for governmental funds should be accounted for in a general long term
obligations account group (GLTOAG). In order for Royalston to maintain accurate records to
account for its current long term obligations, the chart of accounts should be modified to
include this group.

25
APPENDIX: STRUCTURAL CHANGES
For illustrative purposes, as discussed in our report for Royalston on financial management
structure, the forecast below incorporates the following possible changes beginning with FY2018:
Town coordinator budgeted at 24 hours per week with family insurance and retirement
Finance director/town accountant budgeted at 12 hours per week
Collector/treasurer budgeted at 16 hours per week
Collector/treasurer staff personnel budgeted at 5 hours per week
FIVE-YEAR FINANCIAL FORECAST WITH STRUCTURAL CHANGES Source: Division of Local Services
This illustration is found in the Summary New Structure worksheet.
The changes are found in the New Structure Cost worksheet and linked to the New Structure
Expenditure worksheet, and modify the General Government and Employee Benefits sections. The
FY2016 FY2017 FY2018 FY2019 FY2020 FY2021
Revenues
Property Tax Levy 1,609,956 1,708,226 1,756,568 1,768,252 1,825,997 1,878,627
State Aid Cherry Sheet 270,802 267,957 274,954 278,015 281,118 284,264
Estimated Local & Offset Receipts 316,098 303,197 300,364 297,194 297,218 296,296
Available Funds/Other Financing Sources 226,674 191,300 116,510 25,000 25,000 25,000
Total Revenues 2,423,530 2,470,680 2,448,396 2,368,462 2,429,333 2,484,187
Expenditures
General Government 225,175 226,998 289,653 293,235 296,903 300,661
Public Safety 223,025 228,209 230,852 233,560 236,337 239,183
Education 593,290 637,811 665,742 695,030 725,742 757,949
Public Works/Cemetery 666,216 583,780 592,080 600,587 609,306 618,244
Human Services 87,617 88,401 90,117 91,877 93,680 95,528
Culture & Recreation 56,183 59,529 60,193 60,874 61,572 62,288
Debt Service/Capital Plan 120,362 164,833 161,035 123,556 128,871 127,773
Intergovernmental 13,545 13,553 13,568 13,583 13,598 13,613
Fixed Costs/Benefits 125,578 129,567 181,959 187,360 193,048 199,039
Risk Management 51,274 52,280 53,848 55,464 57,128 58,842
Other Amounts Raised 29,157 28,615 29,018 29,427 29,842 30,263
Free Cash/Other Fin. Uses 232,107 274,821 210,083 190,899 191,679 188,860
Total Expenditures 2,423,530 2,488,397 2,578,149 2,575,452 2,637,706 2,692,243
Grand Total Revenues 2,423,530 2,470,680 2,448,396 2,368,462 2,429,333 2,484,187
Grand Total Expenditures 2,423,530 2,488,397 2,578,149 2,575,452 2,637,706 2,692,243Total Surplus/(Shortfall) 0 (17,717) (129,753) (206,990) (208,373) (208,057)
Financial Impact of COLA Increase 0 0 9,842 21,063 32,509 44,184Total Surplus/(Shortfall) after COLA 2,423,530 2,488,397 (139,594) (228,054) (240,882) (252,241)

26
forecast did not take into account any other changes, but policy decisions, analysis of expenditures
and a comprehensive budget plan most likely would provide funding for future structural changes.
PROPOSED STRUCTURAL COSTS Source: Division of Local Services
Current Title2017
Budget
2018
Budget
Average
Hours
Average
FY18
Rate
New TitleProjected
Hours
Projected
Rate
Projected
SalaryInsurance Retirement
Medicare/
FICA
Administrative Assistant 15,675 15,989 19 16.18 Town Coordinator 24 45 56,160 24,000 15,000 582
Town Accountant 12,497 12,747 6 40.86 Finance Director/Town Accountant 12 41 25,584 0 0 186
Tax Collector 13,489 13,759 8 33.07 Collector/Treasurer 16 33 27,456 0 0 199
Treasurer 12,497 12,747 10 24.51 Staff/Clerk 5 20 5,200 0 0 (109)
Total 54,158 55,241 114,400 24,000 15,000 858
Fiscal 2018 Increase Projected over Budget 59,159 24,000 15,000 858
Projected Structural Costs

27
APPENDIX: AMORTIZATION SCHEDULES
PUMPER AMORTIZATION SCHEDULE Source: Royalston
Town of Royalston
KME Pumper
Republic First National Corporation
Principal 400,000.00
Interest 3.450%
7 Year Loan First Payment Due October 1, 2014
Level Payments
Balance Principal Interest Total
Payment Payment Payment
1 2015 400,000.00 52,130.96 13,164.39 65,295.35
2 2016 347,869.04 53,101.46 12,193.89 65,295.35
3 2017 294,767.58 54,962.83 10,332.52 65,295.35
4 2018 239,804.75 56,889.45 8,405.90 65,295.35
5 2019 182,915.30 58,883.60 6,411.75 65,295.35
6 2020 124,031.70 60,947.65 4,347.70 65,295.35
7 2021 63,084.05 63,084.05 2,211.30 65,295.35
400,000.00 57,067.45 457,067.45

28
WASTEWATER TREATMENT PLANT AMORTIZATION SCHEDULE Source: Royalston
Town of Royalston
Wastewater Treatment Plant Loan
USDA Loan
Principal 1,147,000.00
Interest 1.875%
36 Year Loan
Level Principal
Balance Principal Interest Total
Payment Payment Payment
1 2017 1,147,000.00 31,861.12 21,506.25 53,367.37
2 2018 1,115,138.88 31,861.12 20,908.85 52,769.97
3 2019 1,083,277.76 31,861.12 20,311.46 52,172.58
4 2020 1,051,416.64 31,861.12 19,714.06 51,575.18
5 2021 1,019,555.52 31,861.12 19,116.67 50,977.79
6 2022 987,694.40 31,861.12 18,519.27 50,380.39
7 2023 955,833.28 31,861.12 17,921.87 49,782.99
8 2024 923,972.16 31,861.12 17,324.48 49,185.60
9 2025 892,111.04 31,861.12 16,727.08 48,588.20
10 2026 860,249.92 31,861.12 16,129.69 47,990.81
11 2027 828,388.80 31,861.12 15,532.29 47,393.41
12 2028 796,527.68 31,861.12 14,934.89 46,796.01
13 2029 764,666.56 31,861.12 14,337.50 46,198.62
14 2030 732,805.44 31,861.12 13,740.10 45,601.22
15 2031 700,944.32 31,861.12 13,142.71 45,003.83
16 2032 669,083.20 31,861.12 12,545.31 44,406.43
17 2033 637,222.08 31,861.12 11,947.91 43,809.03
18 2034 605,360.96 31,861.12 11,350.52 43,211.64
19 2035 573,499.84 31,861.12 10,753.12 42,614.24
20 2036 541,638.72 31,861.12 10,155.73 42,016.85
21 2037 509,777.60 31,861.12 9,558.33 41,419.45
22 2038 477,916.48 31,861.12 8,960.93 40,822.05
23 2039 446,055.36 31,861.12 8,363.54 40,224.66
24 2040 414,194.24 31,861.12 7,766.14 39,627.26
25 2041 382,333.12 31,861.12 7,168.75 39,029.87
26 2042 350,472.00 31,861.12 6,571.35 38,432.47
27 2043 318,610.88 31,861.12 5,973.95 37,835.07
28 2044 286,749.76 31,861.12 5,376.56 37,237.68
29 2045 254,888.64 31,861.12 4,779.16 36,640.28
30 2046 223,027.52 31,861.12 4,181.77 36,042.89
31 2047 191,166.40 31,861.12 3,584.37 35,445.49
32 2048 159,305.28 31,861.12 2,986.97 34,848.09
33 2049 127,444.16 31,861.12 2,389.58 34,250.70
34 2050 95,583.04 31,861.12 1,792.18 33,653.30
35 2051 63,721.92 31,861.12 1,194.79 33,055.91
36 2052 31,860.80 31,860.80 597.39 32,458.19
Total Payments 1,147,000.00 397,865.52 1,544,865.52
29
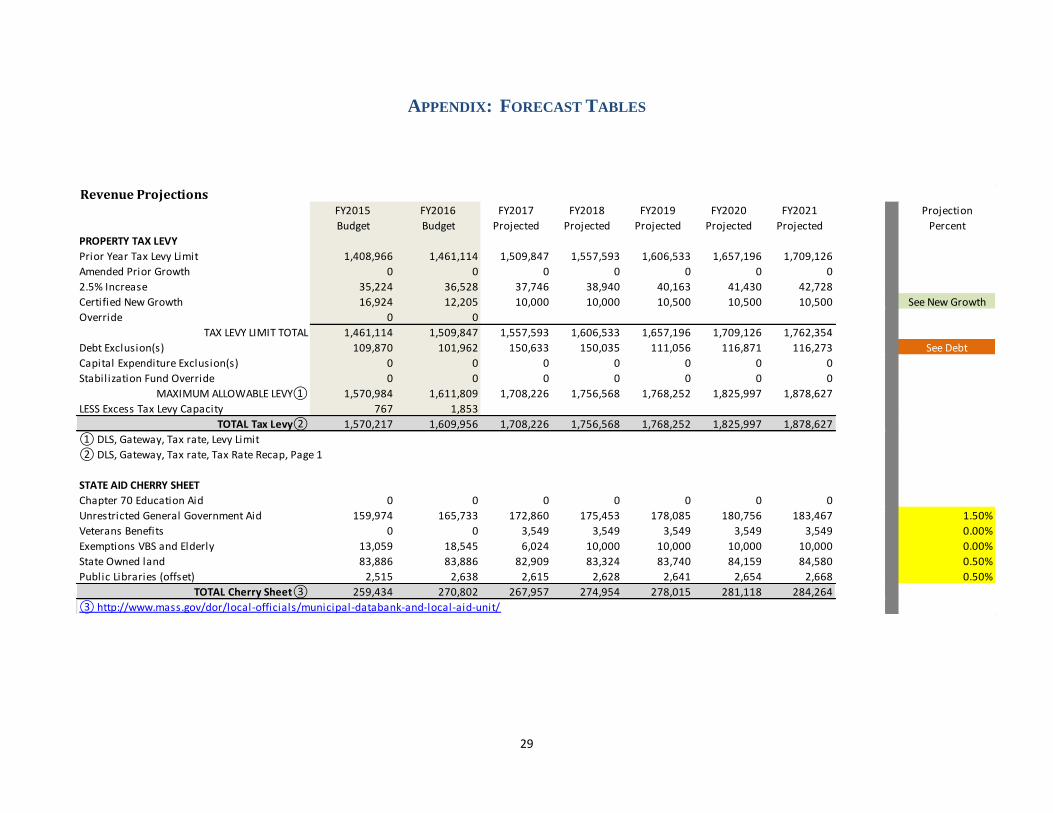
APPENDIX: FORECAST TABLES
Revenue Projections FY2015 FY2016 FY2017 FY2018 FY2019 FY2020 FY2021 Projection
Budget Budget Projected Projected Projected Projected Projected Percent
PROPERTY TAX LEVY
Prior Year Tax Levy Limit 1,408,966 1,461,114 1,509,847 1,557,593 1,606,533 1,657,196 1,709,126
Amended Prior Growth 0 0 0 0 0 0 0
2.5% Increase 35,224 36,528 37,746 38,940 40,163 41,430 42,728
Certified New Growth 16,924 12,205 10,000 10,000 10,500 10,500 10,500 See New Growth
Override 0 0
TAX LEVY LIMIT TOTAL 1,461,114 1,509,847 1,557,593 1,606,533 1,657,196 1,709,126 1,762,354
Debt Exclusion(s) 109,870 101,962 150,633 150,035 111,056 116,871 116,273 See Debt
Capital Expenditure Exclusion(s) 0 0 0 0 0 0 0
Stabilization Fund Override 0 0 0 0 0 0 0
MAXIMUM ALLOWABLE LEVY① 1,570,984 1,611,809 1,708,226 1,756,568 1,768,252 1,825,997 1,878,627
LESS Excess Tax Levy Capacity 767 1,853
TOTAL Tax Levy② 1,570,217 1,609,956 1,708,226 1,756,568 1,768,252 1,825,997 1,878,627
① DLS, Gateway, Tax rate, Levy Limit
② DLS, Gateway, Tax rate, Tax Rate Recap, Page 1
STATE AID CHERRY SHEET
Chapter 70 Education Aid 0 0 0 0 0 0 0
Unrestricted General Government Aid 159,974 165,733 172,860 175,453 178,085 180,756 183,467 1.50%
Veterans Benefits 0 0 3,549 3,549 3,549 3,549 3,549 0.00%
Exemptions VBS and Elderly 13,059 18,545 6,024 10,000 10,000 10,000 10,000 0.00%
State Owned land 83,886 83,886 82,909 83,324 83,740 84,159 84,580 0.50%
Public Libraries (offset) 2,515 2,638 2,615 2,628 2,641 2,654 2,668 0.50%
TOTAL Cherry Sheet③ 259,434 270,802 267,957 274,954 278,015 281,118 284,264
③ http://www.mass.gov/dor/local-officials/municipal-databank-and-local-aid-unit/

30
Revenue Projections ContinuedFY2015 FY2016 FY2017 FY2018 FY2019 FY2020 FY2021 Projection
Budget Budget Projected Projected Projected Projected Projected Percent
ESTIMATED LOCAL RECEIPTS
1. Motor Vehicle Excise 132,500 135,000 114,851 112,867 111,358 110,702 111,535 See Receipts
2a. Meals Excise 0 0 0 0 0 0 0 See Receipts
2b. Room Excise 0 0 0 0 0 0 0 See Receipts
2c. Other Excise 0 0 0 0 0 0 0 See Receipts
3. Penalties/Interest on Taxes and Excises 31,500 32,500 21,301 21,409 20,794 21,311 21,982 See Receipts
4. Payment In Lieu of Taxes 0 0 0 0 0 0 0 See Receipts
5. Charges for Services-Water 0 0 0 0 0 0 0 See Receipts
6. Charges for Services-Sewer 0 0 0 0 0 0 0 See Receipts
7. Charges for Services-Hospital 0 0 0 0 0 0 0 See Receipts
8. Charges for Services-Solid Waste Fees 38,000 35,000 42,828 41,778 39,916 38,518 38,152 See Receipts
9. Other Charges for Services 0 3,000 0 0 0 0 0 See Receipts
10. Fees 2,750 2,500 3,946 3,607 3,597 3,647 3,631 See Receipts
11. Rentals 17,000 17,500 15,050 15,045 15,030 15,017 15,096 See Receipts
12. Dept. Revenue-Schools 0 0 0 0 0 0 0 See Receipts
13. Dept. Revenue-Libraries 0 0 0 0 0 0 0 See Receipts
14. Dept. Revenue-Cemeteries 0 0 0 0 0 0 0 See Receipts
15. Dept. Revenue-Recreation 0 0 0 0 0 0 0 See Receipts
16. Other Departmental Revenue 5,100 7,000 5,876 6,130 6,460 6,603 6,796 See Receipts
17. Licenses/Permits 10,000 10,000 10,227 9,509 8,850 8,893 8,852 See Receipts
18. Special Assessments 0 0 0 0 0 0 0 See Receipts
19. Fines and Forfeits 13,500 5,000 8,326 8,621 8,620 8,973 9,432 See Receipts
20. Investment Income 200 0 4,081 3,707 3,622 3,409 3,350 See Receipts
21. Medicaid Reimbursement 0 0 0 0 0 0 0 See Receipts
22. Misc. Recurring 0 0 0 0 0 0 0 See Receipts
23. Misc. Non-Recurring 0 0 0 0 0 0 0 See Receipts
TOTAL Local Receipts 250,550 247,500 226,486 222,672 218,246 217,073 218,825
OFFSET/CPF RECEIPTS
Sewer 36,410 36,598 37,072 37,609 38,049 38,466 38,611 10-year average
Community Preservation 55,775 32,000 39,639 40,083 40,899 41,679 38,860 5-year average
TOTAL Offset/CPF Receipts 92,185 68,598 76,711 77,692 78,948 80,145 77,471
AVAILABLE FUNDS/OTHER FINANCING
Free Cash 0 0 0 0 0 0 0 Available Funds
Other Available Funds 171,334 226,674 191,300 116,510 25,000 25,000 25,000 Available Funds
Other - Stabilization 0 0 0 0 0 0 0
Other - MSBA Payoff 0 0 0 0 0 0 0
TOTAL Available Funds 171,334 226,674 191,300 116,510 25,000 25,000 25,000
TOTAL GENERAL FUND REVENUES 2,343,720 2,423,530 2,470,680 2,448,396 2,368,462 2,429,333 2,484,187
Ties to Recap Total 2,343,720 2,423,530

31
Available FundsFY2013 FY2014 FY2015 FY2016 FY2017 FY2018 FY2019 FY2020 FY2021
Budget Budget Budget Budget Budget Projected Projected Projected Projected
Free Cash-Appropriated
Prior Year Purposes 0 0 0 0 0 0 0 0 0
General Stabilization Fund (SF) 0 0 0 0 0 0 0 0 0
Capital Equipment Needs SF 0 0 0 0 0 0 0 0 0
Current Year Purposes 0 53,020 0 0 0 0 0 0 0
Reduce Tax Rate 0 0 0 0 0 0 0 0 0
Total Free Cash Appropriated ① 0 53,020 0 0 0 0 0 0 0
Other Available Funds
General stabilization fund (SF) 37,500 122,800 79,300 98,600 151,300 91,510 0 0 0
Capital Equipment Needs SF 0 0 0 0 0 0 0 0 0
Chapter 90/Highway funds 0 0 0 0 0 0 0 0 0
Overlay Surplus 0 0 0 0 0 0 0 0 0
Other 121,870 231,211 92,034 128,074 40,000 25,000 25,000 25,000 25,000
Total Other Available Funds ② 159,370 354,011 171,334 226,674 191,300 116,510 25,000 25,000 25,000
TOTAL Available Funds 159,370 407,031 171,334 226,674 191,300 116,510 25,000 25,000 25,000① DLS, Gateway, Tax rate, Tax Rate Recap, pages
2 and 4 and town meeting minutes.
② DLS, Gateway, Tax rate, B2 Other Funds.
Fiscal Year 2013 2014 2015 2016 2017 2018 2019 2020 2021
7/1/2012 7/1/2013 7/1/2014 7/1/2015 7/1/2016 7/1/2017 7/1/2018 7/1/2019 7/1/2020
Total Budget③ 2,107,796 2,422,402 2,343,720 2,423,530
Free Cash Certified Amount ④ 53,020 0 0 0
Free Cash as % of Total Budget 2.52 - - -
③ DLS, Gateway, Tax rate, Tax Rate Recap, page 1, 1a
④ DLS, Gateway, Tax rate, B1 Free Cash
Available Balance as of: 6/30/2012 6/30/2013 6/30/2014 6/30/2015 6/30/2016 6/30/2017 6/30/2018 6/30/2019 6/30/2020
General Stabilization Fund (SF) Available Balance ⑤ 168,895 117,268 125,345 171,047 242,810 91,510 0 0 0
Capital Equipment Needs SF Available Balance 0 0 0 0
Free Cash and SF as % of Total Budget 10.53% 4.84% 5.35% 7.06%
Projected SF Balances:
General Stabilization Fund (SF) Amount 0 0 91,510 91,510 91,510
Capital Equipment Needs SF Amount 0 0 0 0 0

32
Local Receipts - Budget/ProjectedAverage
FY2013 FY2014 FY2015 FY2016 FY2017 FY2018 FY2019 FY2020 FY2021 Percent Projection
Budget Budget Budget Budget Projected Projected Projected Projected Projected Change Percent
1. Motor Vehicle Excise 115,000 115,000 132,500 135,000 114,851 112,867 111,358 110,702 111,535 3.22% 95% of 10 year average
2a. Meals Excise 0 0 0 0 0 0 0 0 0
2b. Room Excise 0 0 0 0 0 0 0 0 0
2c. Other Excise 0 0 0 0 0 0 0 0 0
3. Penalties/Interest on Taxes and Excises 19,500 19,500 31,500 32,500 21,301 21,409 20,794 21,311 21,982 4.93% 95% of 10 year average
4. Payment In Lieu of Taxes 3,800 0 0 0 0 0 0 0 0
5. Charges for Services-Water 0 0 0 0 0 0 0 0 0
6. Charges for Services-Sewer 0 0 0 0 0 0 0 0 0
7. Charges for Services-Hospital 0 0 0 0 0 0 0 0 0
8. Charges for Services-Solid Waste Fees 41,000 37,000 38,000 35,000 42,828 41,778 39,916 38,518 38,152 1.74% 95% of 10 year average
9. Other Charges for Services 0 0 0 3,000 0 0 0 0 0
10. Fees 4,200 4,400 2,750 2,500 3,946 3,607 3,597 3,647 3,631 38.60% 95% of 10 year average
11. Rentals 15,900 16,800 17,000 17,500 15,050 15,045 15,030 15,017 15,096 1.88% 95% of 10 year average
12. Dept. Revenue-Schools 0 0 0 0 0 0 0 0 0
13. Dept. Revenue-Libraries 0 0 0 0 0 0 0 0 0
14. Dept. Revenue-Cemeteries 0 0 0 0 0 0 0 0 0
15. Dept. Revenue-Recreation 0 0 0 0 0 0 0 0 0
16. Other Departmental Revenue 7,500 9,500 5,100 7,000 5,876 6,130 6,460 6,603 6,796 81.22% 95% of 10 year average
17. Licenses/Permits 13,000 6,300 10,000 10,000 10,227 9,509 8,850 8,893 8,852 -0.15% 95% of 10 year average
18. Special Assessments 0 0 0 0 0 0 0 0 0
19. Fines and Forfeits 12,000 11,500 13,500 5,000 8,326 8,621 8,620 8,973 9,432 17.80% 95% of 10 year average
20. Investment Income 4,500 2,000 200 0 4,081 3,707 3,622 3,409 3,350 -22.09% 95% of 10 year average
21. Medicaid Reimbursement 0 0 0 0 0 0 0 0 0
22. Misc. Recurring 0 2,500 0 0 0 0 0 0 0
23. Misc. Non-Recurring 1,500 0 0 0 0 0 0 0 0
TOTAL Local Receipts-Budget ① 237,900 224,500 250,550 247,500 226,486 222,672 218,246 217,073 218,825 0.94%

33
Local Receipts - Reported Average
FY2013 FY2014 FY2015 FY2016 FY2017 FY2018 FY2019 FY2020 FY2021 Percent
Reported Reported Reported Reported Reported Reported Reported Reported Reported Change
1. Motor Vehicle Excise 122,384 137,051 137,052 0 0 0 0 0 0 0.24%
2a. Meals Excise 0 0 0 0 0 0 0 0 0
2b. Room Excise 0 0 0 0 0 0 0 0 0
2c. Other Excise 0 0 0 0 0 0 0 0 0
3. Penalties/Interest on Taxes and Excises 19,028 42,422 34,601 0 0 0 0 0 0 7.79%
4. Payment In Lieu of Taxes 0 0 0 0 0 0 0 0 0
5. Charges for Services-Water 0 0 0 0 0 0 0 0 0
6. Charges for Services-Sewer 0 0 0 0 0 0 0 0 0
7. Charges for Services-Hospital 0 0 0 0 0 0 0 0 0
8. Charges for Services-Solid Waste Fees 36,576 39,256 37,298 0 0 0 0 0 0 -2.18%
9. Other Charges for Services 0 0 3,440 0 0 0 0 0 0
10. Fees 4,304 2,716 2,882 0 0 0 0 0 0 47.22%
11. Rentals 16,725 16,975 18,100 0 0 0 0 0 0 5.28%
12. Dept. Revenue-Schools 0 0 0 0 0 0 0 0 0
13. Dept. Revenue-Libraries 0 0 0 0 0 0 0 0 0
14. Dept. Revenue-Cemeteries 0 0 0 0 0 0 0 0 0
15. Dept. Revenue-Recreation 0 0 0 0 0 0 0 0 0
16. Other Departmental Revenue 9,478 5,132 7,385 0 0 0 0 0 0 11.98%
17. Licenses/Permits 6,208 10,438 10,213 0 0 0 0 0 0 2.21%
18. Special Assessments 0 0 0 0 0 0 0 0 0
19. Fines and Forfeits 11,626 13,985 5,895 0 0 0 0 0 0 15.02%
20. Investment Income 1,797 184 0 0 0 0 0 0 0 -29.16%
21. Medicaid Reimbursement 0 0 0 0 0 0 0 0 0
22. Misc. Recurring 2,791 0 0 0 0 0 0 0 0
23. Misc. Non-Recurring 37,674 0 17,415 0 0 0 0 0 0
TOTAL Local Receipts-Actual ① 268,591 268,159 274,281 0 0 0 0 0 0 -0.18%
Difference: Actual over Budget 30,691 43,659 23,731 -247,500 -226,486 -222,672 -218,246 -217,073 -218,825
Percent budget to actual 12.90% 19.45% 9.47% -100.00% -100.00% -100.00% -100.00% -100.00% -100.00%
① DLS, Gateway, Tax rate, Tax Rate Recap,
page 3
34
New Growth Dollars by Property Class
FY2013 FY2014 FY2015 FY2016 FY2017 FY2018 FY2019 FY2020 FY2021
Budget Budget Budget Budget Projected Projected Projected Projected Projected
Residential New Growth 8,199 6,274 14,966 9,076 8,000 8,000 8,250 8,250 8,250
Commercial (C) 0 0 90 0 0 0 0 0 0
Industrial (I) 0 0 0 0 0 0 0 0 0
Personal Property (PP) 5,710 10,448 1,868 3,129 2,000 2,000 2,250 2,250 2,250
CIP New Growth 5,710 10,448 1,958 3,129 2,000 2,000 2,250 2,250 2,250
TOTAL New Growth ① 13,909 16,722 16,924 12,205 10,000 10,000 10,500 10,500 10,500
3-year average
Residential 7,383 6,376 9,813 10,105 0 0 0 0 0
CI 0 0 30 30 0 0 0 0 0
PP 4,356 7,381 6,009 5,148 0 0 0 0 0
Total 11,739 13,757 15,852 15,284 0 0 0 0 0
5-year average
Residential 8,285 7,036 8,678 8,634 0 0 0 0 0
CI 0 0 18 18 0 0 0 0 0
PP 5,973 5,254 5,077 5,428 0 0 0 0 0
Total 14,258 12,289 13,773 14,080 0 0 0 0 0
10-year average
Residential 13,118 12,227 10,983 0 0 0 0 0
CI 0 9 9 0 0 0 0 0
PP 4,773 4,481 4,766 0 0 0 0 0
Total 17,891 16,717 15,757 0 0 0 0 0
① DLS, Gateway, Tax rate, LA-13
Tax Levy Base Growth, column K

35
Expenditure ProjectionsAverage
FY2015 FY2016 FY2017 FY2018 FY2019 FY2020 FY2021 Percent Projection
Budget Budget Budget/ATM Projected Projected Projected Projected Change Percent
GENERAL GOVERNMENT
Elected Officials 22,932 23,511 25,752 25,881 26,010 26,140 26,271 6.03% 0.50%
Personal Services 62,919 65,489 66,534 66,534 66,534 66,534 66,534 2.84% COLA/not included
Expenses 139,555 136,175 134,712 138,080 141,532 145,070 148,697 -1.75% 2.50%
Capital Outlay 0 0 0 0 0 0 0 0.00%
Reserve Fund 0 0 0 0 0 0 0 0.00%
TOTAL General Government 225,406 225,175 226,998 230,495 234,076 237,744 241,502
PUBLIC SAFETY
Police Personal Services (Dispatch) 72,999 71,823 72,893 72,893 72,893 72,893 72,893 -0.06% COLA/not included
Police Expenses 41,273 43,585 45,854 47,000 48,175 49,380 50,614 5.40% 2.50%
Police Capital Outlay/Special Articles 4,300 0 0 0 0 0 0 0.00%
Total Police 118,572 115,408 118,747 119,893 121,068 122,273 123,507
Fire Personal Services 34,660 35,600 37,000 37,000 37,000 37,000 37,000 3.32% COLA/not included
Fire Expenses (EMS) 53,062 54,256 54,256 55,612 57,003 58,428 59,888 1.13% 2.50%
Fire Capital Outlay/Special Articles 6,100 0 0 0 0 0 0 0.00%
Total Fire 93,822 89,856 91,256 92,612 94,003 95,428 96,888
Inspectional Services Personal Services 12,300 12,300 12,608 12,608 12,608 12,608 12,608 1.25% COLA/not included
Inspectional Services Expenses 3,461 5,461 5,598 5,738 5,881 6,028 6,179 30.15% 2.50%
Total Inspectional Services 15,761 17,761 18,206 18,346 18,489 18,636 18,787
TOTAL Public Safety 228,155 223,025 228,209 230,852 233,560 236,337 239,183
EDUCATION
Athol-Royalston Regional 448,000 479,131 538,817 565,758 594,046 623,748 654,935 6.08% 5.00%
Montachusett Regional Vocational Technical 115,473 114,159 98,994 99,984 100,984 101,994 103,014 -7.21% 1.00%
TOTAL Education 563,473 593,290 637,811 665,742 695,030 725,742 757,949

36
Expenditure ProjectionsAverage
FY2015 FY2016 FY2017 FY2018 FY2019 FY2020 FY2021 Percent Projection
Budget Budget Budget/ATM Projected Projected Projected Projected Change Percent
PUBLIC WORKS
Cemetery Elected Officials 650 650 650 650 650 650 650 0.00% 0.00%
DPW/Cemetery Personal Services 239,420 246,000 250,349 250,349 250,349 250,349 250,349 2.26% COLA/not included
DPW/Cemetery Expenses/Snow&Ice Transfer 344,234 347,618 259,530 266,018 272,669 279,485 286,473 -12.18% 2.50%
DPW/Cemetery Maintenance 33,000 33,250 33,250 34,081 34,933 35,807 36,702 2.50%
Total DPW/Cemetery 617,304 627,518 543,779 551,099 558,601 566,291 574,173
Waste Water Treatment Elected Officials 822 800 800 800 800 800 800 -1.34% 0.00%
Waste Water Treatment Expenses 36,410 36,598 37,901 38,849 39,820 40,815 41,836 2.04% 2.50%
Waste Water Treatment Capital Outlay 1,300 1,300 1,300 1,333 1,366 1,400 1,435 0.00% 2.50%
Total Waste Water Treatment 38,532 38,698 40,001 40,981 41,986 43,015 44,071
TOTAL Public Works 655,836 666,216 583,780 592,080 600,587 609,306 618,244
HUMAN SERVICES
Personal Services 16,544 18,647 19,746 19,746 19,746 19,746 19,746 9.30% COLA/not included
Expenses 67,040 68,970 68,655 70,371 72,131 73,934 75,782 1.21% 2.50%
Capital Outlay 0 0 0 0 0 0 0
TOTAL Human Services 83,584 87,617 88,401 90,117 91,877 93,680 95,528
CULTURE/RECREATION
Personal Services 29,794 31,342 32,953 32,953 32,953 32,953 32,953 5.17% COLA/not included
Expenses 23,510 24,191 25,426 26,062 26,713 27,381 28,066 4.00% 2.50%
Events 2,650 650 1,150 1,179 1,208 1,238 1,269 0.73% 2.50%
TOTAL Culture/Recreation 55,954 56,183 59,529 60,193 60,874 61,572 62,288
DEBT SERVICE/CAPITAL PLAN
Debt Service 0 0 0 0 0 0 0
Debt Excluded Debt Service 109,870 101,962 150,633 150,035 111,056 116,871 116,273
Temporary Interest 2,000 9,200 5,000 2,000 2,000 2,000 2,000
Lease Payments 12,200 9,200 9,200 9,000 10,500 10,000 9,500
Proposed Debt Excluded Debt Service 0 0 0 0 0 0 0
Capital/Special Articles 0 0 0 0 0 0 0
Chapter 90 Projects 0 0 0 0 0 0 0
TOTAL Debt Service & Capital 124,070 120,362 164,833 161,035 123,556 128,871 127,773

37
Expenditure ProjectionsAverage
FY2015 FY2016 FY2017 FY2018 FY2019 FY2020 FY2021 Percent Projection
Budget Budget Budget/ATM Projected Projected Projected Projected Change Percent
STATE ASSESSMENTS
County Tax 0 0 0 0 0 0 0
Air Pollution 356 334 342 344 345 347 349 -1.89% 0.50%
RMV Non-Renewal Surcharge 2,660 2,660 2,660 2,673 2,687 2,700 2,714 0.00% 0.50%
STRAP 10,551 10,551 10,551 10,551 10,551 10,551 10,551 0.00% 0.00%
TOTAL State Assessments 13,567 13,545 13,553 13,568 13,583 13,598 13,613
RISK MANAGEMENT 0 0 0 0
Police & Fire Insurance 10,200 13,000 13,080 13,472 13,877 14,293 14,722 14.03% 3.00%
Property & Auto Insurance 35,974 38,274 39,200 40,376 41,587 42,835 44,120 4.41% 3.00%
Public Officials Bonds 0 0 0 0 0 0 0
TOTAL Risk Management 46,174 51,274 52,280 53,848 55,464 57,128 58,842
EMPLOYEE BENEFITS
Retirement 25,333 46,578 50,567 53,601 56,817 60,226 63,840 46.21% 6.00%
Medicare/FICA 10,000 10,000 10,000 10,000 10,000 10,000 10,000 0.00% 0.00%
Workers' Compensation 20,000 14,000 15,000 15,000 15,000 15,000 15,000 -11.43% 0.00%
Unemployment Compensation 9,000 5,000 4,000 4,000 4,000 4,000 4,000 -32.22% 0.00%
Group Health/Life Insurance 50,000 50,000 50,000 50,500 51,005 51,515 52,030 0.00% 1.00%
TOTAL Employee Benefits 114,333 125,578 129,567 133,101 136,822 140,741 144,870
OTHER AMOUNTS TO BE RAISED
Deficits/Judgements/Tax title 0 0 0 0 0 0 0
Cherry Sheet Offsets 2,515 2,638 2,615 2,628 2,641 2,654 2,668 2.01% See Revenues
Intergovernmental 0 0 0 0 0 0 0
Abatements & Exemptions (Overlay) 25,233 26,519 26,000 26,390 26,786 27,188 27,595 1.57% 1.50%
TOTAL Other Amounts Raised 27,748 29,157 28,615 29,018 29,427 29,842 30,263
MISC./ OTHER FINANCING USES
Reserve Fund 32,000 20,000 28,421 20,000 20,000 20,000 20,000 0.00%
Special Articles 63,790 62,400 214,400 150,000 150,000 150,000 150,000
Community Preservation 55,775 32,000 32,000 40,083 40,899 41,679 38,860 See Revenues
Transfer to Special Revenue Funds 0 0 0 0 0 0 0
Transfer to Capital Project Funds 0 0 0 0 0 0 0
Transfer to OBEP Fund 0 0 0 0 0 0 0
Transfer to Stabilization Funds 53,855 117,707 0 0 0 0 0 See Available Funds
TOTAL Misc. Appropriations 205,420 232,107 274,821 210,083 190,899 191,679 188,860
TOTAL GENERAL FUND 2,343,720 2,423,530 2,488,397 2,470,132 2,465,755 2,526,240 2,578,915

TownofRoyalstonSummaryofProjectedRevenuesandExpenditures
FY2016 FY2017 FY2018 FY2019 FY2020 FY2021RevenuesPropertyTaxLevy 1,609,956 1,708,226 1,756,568 1,768,252 1,825,997 1,878,627StateAidCherrySheet 270,802 267,957 274,954 278,015 281,118 284,264EstimatedLocal&OffsetReceipts 316,098 303,197 300,364 297,194 297,218 296,296AvailableFunds/OtherFinancingSources 226,674 191,300 116,510 25,000 25,000 25,000
TotalRevenues 2,423,530 2,470,680 2,448,396 2,368,462 2,429,333 2,484,187
ExpendituresGeneralGovernment 225,175 226,998 230,495 234,076 237,744 241,502PublicSafety 223,025 228,209 230,852 233,560 236,337 239,183Education 593,290 637,811 665,742 695,030 725,742 757,949PublicWorks/Cemetery 666,216 583,780 592,080 600,587 609,306 618,244HumanServices 87,617 88,401 90,117 91,877 93,680 95,528Culture&Recreation 56,183 59,529 60,193 60,874 61,572 62,288DebtService/CapitalPlan 120,362 164,833 161,035 123,556 128,871 127,773Intergovernmental 13,545 13,553 13,568 13,583 13,598 13,613FixedCosts/Benefits 125,578 129,567 133,101 136,822 140,741 144,870RiskManagement 51,274 52,280 53,848 55,464 57,128 58,842OtherAmountsRaised 29,157 28,615 29,018 29,427 29,842 30,263FreeCash/OtherFin.Uses 232,107 274,821 210,083 190,899 191,679 188,860
TotalExpenditures 2,423,530 2,488,397 2,470,132 2,465,755 2,526,240 2,578,915
GrandTotalRevenues 2,423,530 2,470,680 2,448,396 2,368,462 2,429,333 2,484,187GrandTotalExpenditures 2,423,530 2,488,397 2,470,132 2,465,755 2,526,240 2,578,915
TotalSurplus/(Shortfall) 0 (17,717) (21,736) (97,294) (96,908) (94,728)

2of31
TownofRoyalstonRevenueProjections
FY2005 FY2006 FY2007 FY2008 FY2009Budget Budget Budget Budget Budget
PROPERTYTAXLEVYPriorYearTaxLevyLimit 822,730 871,971 915,568 1,093,352 1,133,723AmendedPriorGrowth 0 0 0 0 02.5%Increase 20,568 21,799 22,889 27,334 28,343CertifiedNewGrowth 28,673 21,798 27,395 13,037 26,564Override 0 0 127,500 0 0
TAXLEVYLIMITTOTAL 871,971 915,568 1,093,352 1,133,723 1,188,630DebtExclusion(s) 213,952 140,118 131,857 123,648 82,444CapitalExpenditureExclusion(s) 0 0 0 0 0StabilizationFundOverride 0 0 0 0 0
MAXIMUMALLOWABLELEVY① 1,085,923 1,055,686 1,225,209 1,257,371 1,271,074LESSExcessTaxLevyCapacity 515 625 1,273 1,048 916
TOTALTaxLevy② 1,085,408 1,055,061 1,223,936 1,256,323 1,270,158①DLS,Gateway,Taxrate,LevyLimit①DLS,Gateway,Taxrate,TaxRateRecap,Page1
STATEAIDCHERRYSHEETChapter70EducationAidUnrestrictedGeneralGovernmentAidVeteransBenefitsExemptionsVBSandElderlyStateOwnedlandPublicLibraries(offset)
TOTALCherrySheet③ 175,619 215,541 270,704 286,448 274,329③http://www.mass.gov/dor/local-officials/municipal-databank-and-local-aid-unit/

3of31
TownofRoyalstonRevenueProjections
FY2005 FY2006 FY2007 FY2008 FY2009Budget Budget Budget Budget Budget
ESTIMATEDLOCALRECEIPTS1.MotorVehicleExcise 103,871 140,000 135,000 126,000 115,0002a.MealsExcise 0 0 0 0 02b.RoomExcise 0 0 0 0 02c.OtherExcise 500 2,000 5,000 3,000 1,0003.Penalties/InterestonTaxesandExcises 35,000 45,000 20,000 22,000 14,0004.PaymentInLieuofTaxes 2,000 2,000 2,000 2,000 2,0005.ChargesforServices-Water 0 0 0 0 06.ChargesforServices-Sewer 0 0 0 0 07.ChargesforServices-Hospital 0 0 0 0 08.ChargesforServices-SolidWasteFees 36,000 50,000 53,000 60,000 45,7009.OtherChargesforServices 0 0 0 0 010.Fees 8,000 1,200 7,500 4,000 3,00011.Rentals 15,000 12,000 15,000 15,000 15,00012.Dept.Revenue-Schools 0 0 0 0 013.Dept.Revenue-Libraries 0 0 0 0 014.Dept.Revenue-Cemeteries 0 0 0 0 015.Dept.Revenue-Recreation 0 0 0 0 016.OtherDepartmentalRevenue 1,000 7,500 3,000 2,800 9,00017.Licenses/Permits 19,000 17,000 17,000 12,000 8,50018.SpecialAssessments 0 0 0 0 019.FinesandForfeits 5,000 4,500 5,000 8,000 5,00020.InvestmentIncome 15,000 12,000 8,000 4,000 4,00021.MedicaidReimbursement 0 0 0 0 022.Misc.Recurring 0 0 0 0 023.Misc.Non-Recurring 0 0 0 0 0
TOTALLocalReceipts 240,371 293,200 270,500 258,800 222,200
OFFSET/CPFRECEIPTSSewer 28,216 30,760 31,700 33,215 33,880CommunityPreservation 0 0 0 0 0
TOTALOffset/CPFReceipts 28,216 30,760 31,700 33,215 33,880
AVAILABLEFUNDS/OTHERFINANCINGFreeCash 403,755 221,622 0 10,179 0OtherAvailableFunds 132,855 216,843 187,285 224,949 370,711Other-Stabilization 0 0 0 0 48,000Other-MSBAPayoff 0 0 0 0 0
TOTALAvailableFunds 536,610 438,465 187,285 235,128 418,711
TOTALGENERALFUNDREVENUES 2,066,224 2,033,027 1,984,125 2,069,914 2,219,278TiestoRecapTotal 2,066,224 2,033,027 1,984,125 2,069,914 2,219,278

4of31
TownofRoyalstonRevenueProjections
PROPERTYTAXLEVYPriorYearTaxLevyLimitAmendedPriorGrowth2.5%IncreaseCertifiedNewGrowthOverride
TAXLEVYLIMITTOTALDebtExclusion(s)CapitalExpenditureExclusion(s)StabilizationFundOverride
MAXIMUMALLOWABLELEVY①LESSExcessTaxLevyCapacity
TOTALTaxLevy②①DLS,Gateway,Taxrate,LevyLimit①DLS,Gateway,Taxrate,TaxRateRecap,Page1
STATEAIDCHERRYSHEETChapter70EducationAidUnrestrictedGeneralGovernmentAidVeteransBenefitsExemptionsVBSandElderlyStateOwnedlandPublicLibraries(offset)
TOTALCherrySheet③③http://www.mass.gov/dor/local-officials/municipal-databank-and-local-aid-unit/
FY2010 FY2011 FY2012 FY2013Budget Budget Budget Budget
1,188,630 1,227,853 1,269,217 1,311,5880 0 0 0
29,716 30,696 31,730 32,7909,507 10,668 10,641 13,909
0 0 0 01,227,853 1,269,217 1,311,588 1,358,287
72,377 68,946 54,746 27,5530 0 0 00 0 0 0
1,300,230 1,338,163 1,366,334 1,385,840867 1,531 19 35,493
1,299,363 1,336,632 1,366,315 1,350,347
0 0 0 0158,399 152,063 141,068 152,063
5159 4597 0 58615248 15225 14,308 13,82264356 76225 78,951 78,9762046 1929 1,930 1,801
245,208 250,039 236,257 247,248
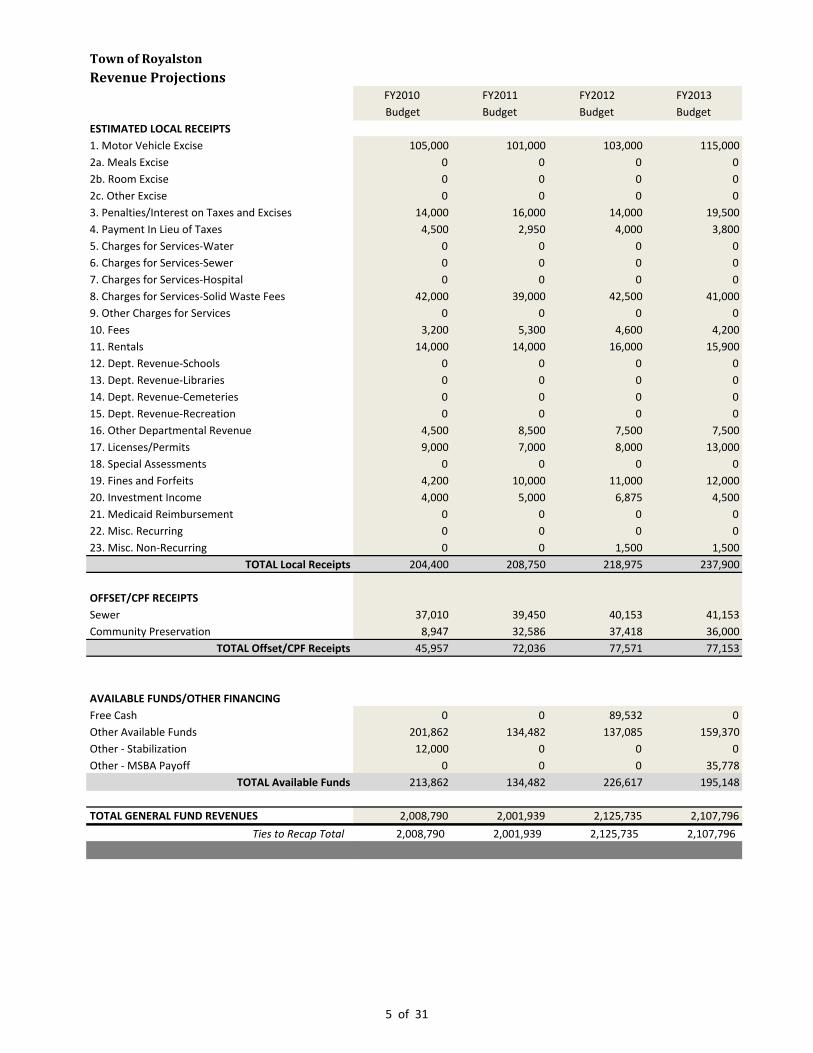
5of31
TownofRoyalstonRevenueProjections
ESTIMATEDLOCALRECEIPTS1.MotorVehicleExcise2a.MealsExcise2b.RoomExcise2c.OtherExcise3.Penalties/InterestonTaxesandExcises4.PaymentInLieuofTaxes5.ChargesforServices-Water6.ChargesforServices-Sewer7.ChargesforServices-Hospital8.ChargesforServices-SolidWasteFees9.OtherChargesforServices10.Fees11.Rentals12.Dept.Revenue-Schools13.Dept.Revenue-Libraries14.Dept.Revenue-Cemeteries15.Dept.Revenue-Recreation16.OtherDepartmentalRevenue17.Licenses/Permits18.SpecialAssessments19.FinesandForfeits20.InvestmentIncome21.MedicaidReimbursement22.Misc.Recurring23.Misc.Non-Recurring
TOTALLocalReceipts
OFFSET/CPFRECEIPTSSewerCommunityPreservation
TOTALOffset/CPFReceipts
AVAILABLEFUNDS/OTHERFINANCINGFreeCashOtherAvailableFundsOther-StabilizationOther-MSBAPayoff
TOTALAvailableFunds
TOTALGENERALFUNDREVENUESTiestoRecapTotal
FY2010 FY2011 FY2012 FY2013Budget Budget Budget Budget
105,000 101,000 103,000 115,0000 0 0 00 0 0 00 0 0 0
14,000 16,000 14,000 19,5004,500 2,950 4,000 3,800
0 0 0 00 0 0 00 0 0 0
42,000 39,000 42,500 41,0000 0 0 0
3,200 5,300 4,600 4,20014,000 14,000 16,000 15,900
0 0 0 00 0 0 00 0 0 00 0 0 0
4,500 8,500 7,500 7,5009,000 7,000 8,000 13,000
0 0 0 04,200 10,000 11,000 12,0004,000 5,000 6,875 4,500
0 0 0 00 0 0 00 0 1,500 1,500
204,400 208,750 218,975 237,900
37,010 39,450 40,153 41,1538,947 32,586 37,418 36,00045,957 72,036 77,571 77,153
0 0 89,532 0201,862 134,482 137,085 159,37012,000 0 0 0
0 0 0 35,778213,862 134,482 226,617 195,148
2,008,790 2,001,939 2,125,735 2,107,7962,008,790 2,001,939 2,125,735 2,107,796
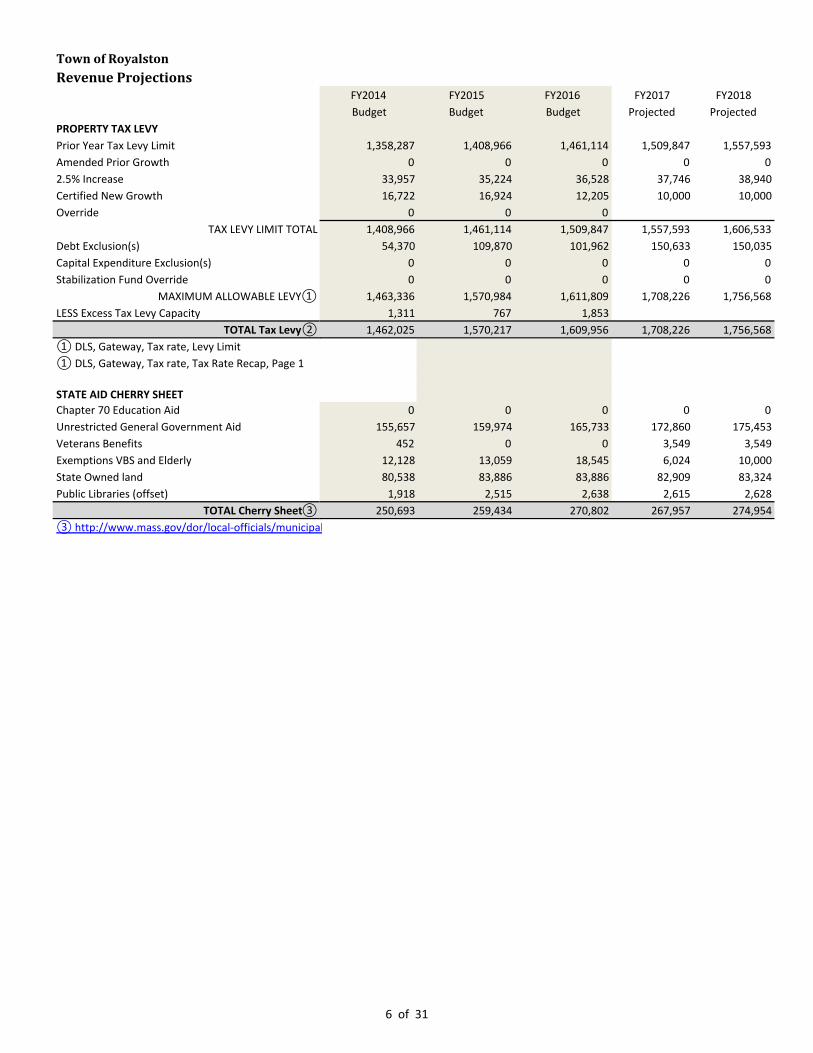
6of31
TownofRoyalstonRevenueProjections
PROPERTYTAXLEVYPriorYearTaxLevyLimitAmendedPriorGrowth2.5%IncreaseCertifiedNewGrowthOverride
TAXLEVYLIMITTOTALDebtExclusion(s)CapitalExpenditureExclusion(s)StabilizationFundOverride
MAXIMUMALLOWABLELEVY①LESSExcessTaxLevyCapacity
TOTALTaxLevy②①DLS,Gateway,Taxrate,LevyLimit①DLS,Gateway,Taxrate,TaxRateRecap,Page1
STATEAIDCHERRYSHEETChapter70EducationAidUnrestrictedGeneralGovernmentAidVeteransBenefitsExemptionsVBSandElderlyStateOwnedlandPublicLibraries(offset)
TOTALCherrySheet③③http://www.mass.gov/dor/local-officials/municipal-databank-and-local-aid-unit/
FY2014 FY2015 FY2016 FY2017 FY2018Budget Budget Budget Projected Projected
1,358,287 1,408,966 1,461,114 1,509,847 1,557,5930 0 0 0 0
33,957 35,224 36,528 37,746 38,94016,722 16,924 12,205 10,000 10,000
0 0 01,408,966 1,461,114 1,509,847 1,557,593 1,606,533
54,370 109,870 101,962 150,633 150,0350 0 0 0 00 0 0 0 0
1,463,336 1,570,984 1,611,809 1,708,226 1,756,5681,311 767 1,853
1,462,025 1,570,217 1,609,956 1,708,226 1,756,568
0 0 0 0 0155,657 159,974 165,733 172,860 175,453
452 0 0 3,549 3,54912,128 13,059 18,545 6,024 10,00080,538 83,886 83,886 82,909 83,3241,918 2,515 2,638 2,615 2,628
250,693 259,434 270,802 267,957 274,954

7of31
TownofRoyalstonRevenueProjections
ESTIMATEDLOCALRECEIPTS1.MotorVehicleExcise2a.MealsExcise2b.RoomExcise2c.OtherExcise3.Penalties/InterestonTaxesandExcises4.PaymentInLieuofTaxes5.ChargesforServices-Water6.ChargesforServices-Sewer7.ChargesforServices-Hospital8.ChargesforServices-SolidWasteFees9.OtherChargesforServices10.Fees11.Rentals12.Dept.Revenue-Schools13.Dept.Revenue-Libraries14.Dept.Revenue-Cemeteries15.Dept.Revenue-Recreation16.OtherDepartmentalRevenue17.Licenses/Permits18.SpecialAssessments19.FinesandForfeits20.InvestmentIncome21.MedicaidReimbursement22.Misc.Recurring23.Misc.Non-Recurring
TOTALLocalReceipts
OFFSET/CPFRECEIPTSSewerCommunityPreservation
TOTALOffset/CPFReceipts
AVAILABLEFUNDS/OTHERFINANCINGFreeCashOtherAvailableFundsOther-StabilizationOther-MSBAPayoff
TOTALAvailableFunds
TOTALGENERALFUNDREVENUESTiestoRecapTotal
FY2014 FY2015 FY2016 FY2017 FY2018Budget Budget Budget Projected Projected
115,000 132,500 135,000 114,851 112,8670 0 0 0 00 0 0 0 00 0 0 0 0
19,500 31,500 32,500 21,301 21,4090 0 0 0 00 0 0 0 00 0 0 0 00 0 0 0 0
37,000 38,000 35,000 42,828 41,7780 0 3,000 0 0
4,400 2,750 2,500 3,946 3,60716,800 17,000 17,500 15,050 15,045
0 0 0 0 00 0 0 0 00 0 0 0 00 0 0 0 0
9,500 5,100 7,000 5,876 6,1306,300 10,000 10,000 10,227 9,509
0 0 0 0 011,500 13,500 5,000 8,326 8,6212,000 200 0 4,081 3,707
0 0 0 0 02,500 0 0 0 0
0 0 0 0 0224,500 250,550 247,500 226,486 222,672
41,153 36,410 36,598 37,072 37,60937,000 55,775 32,000 39,639 40,08378,153 92,185 68,598 76,711 77,692
53,020 0 0 0 0354,011 171,334 226,674 191,300 116,510
0 0 0 0 00 0 0 0 0
407,031 171,334 226,674 191,300 116,510
2,422,402 2,343,720 2,423,530 2,470,680 2,448,3962,422,402 2,343,720 2,423,530

8of31
TownofRoyalstonRevenueProjections
PROPERTYTAXLEVYPriorYearTaxLevyLimitAmendedPriorGrowth2.5%IncreaseCertifiedNewGrowthOverride
TAXLEVYLIMITTOTALDebtExclusion(s)CapitalExpenditureExclusion(s)StabilizationFundOverride
MAXIMUMALLOWABLELEVY①LESSExcessTaxLevyCapacity
TOTALTaxLevy②①DLS,Gateway,Taxrate,LevyLimit①DLS,Gateway,Taxrate,TaxRateRecap,Page1
STATEAIDCHERRYSHEETChapter70EducationAidUnrestrictedGeneralGovernmentAidVeteransBenefitsExemptionsVBSandElderlyStateOwnedlandPublicLibraries(offset)
TOTALCherrySheet③③http://www.mass.gov/dor/local-officials/municipal-databank-and-local-aid-unit/
FY2019 FY2020 FY2021 ProjectionProjected Projected Projected Percent
1,606,533 1,657,196 1,709,1260 0 0
40,163 41,430 42,72810,500 10,500 10,500 SeeNewGrowth
1,657,196 1,709,126 1,762,354111,056 116,871 116,273 SeeDebt
0 0 00 0 0
1,768,252 1,825,997 1,878,627
1,768,252 1,825,997 1,878,627
0 0 0178,085 180,756 183,467 1.50%3,549 3,549 3,549 0.00%10,000 10,000 10,000 0.00%83,740 84,159 84,580 0.50%2,641 2,654 2,668 0.50%
278,015 281,118 284,264

9of31
TownofRoyalstonRevenueProjections
ESTIMATEDLOCALRECEIPTS1.MotorVehicleExcise2a.MealsExcise2b.RoomExcise2c.OtherExcise3.Penalties/InterestonTaxesandExcises4.PaymentInLieuofTaxes5.ChargesforServices-Water6.ChargesforServices-Sewer7.ChargesforServices-Hospital8.ChargesforServices-SolidWasteFees9.OtherChargesforServices10.Fees11.Rentals12.Dept.Revenue-Schools13.Dept.Revenue-Libraries14.Dept.Revenue-Cemeteries15.Dept.Revenue-Recreation16.OtherDepartmentalRevenue17.Licenses/Permits18.SpecialAssessments19.FinesandForfeits20.InvestmentIncome21.MedicaidReimbursement22.Misc.Recurring23.Misc.Non-Recurring
TOTALLocalReceipts
OFFSET/CPFRECEIPTSSewerCommunityPreservation
TOTALOffset/CPFReceipts
AVAILABLEFUNDS/OTHERFINANCINGFreeCashOtherAvailableFundsOther-StabilizationOther-MSBAPayoff
TOTALAvailableFunds
TOTALGENERALFUNDREVENUESTiestoRecapTotal
FY2019 FY2020 FY2021 ProjectionProjected Projected Projected Percent
111,358 110,702 111,535 SeeReceipts0 0 0 SeeReceipts0 0 0 SeeReceipts0 0 0 SeeReceipts
20,794 21,311 21,982 SeeReceipts0 0 0 SeeReceipts0 0 0 SeeReceipts0 0 0 SeeReceipts0 0 0 SeeReceipts
39,916 38,518 38,152 SeeReceipts0 0 0 SeeReceipts
3,597 3,647 3,631 SeeReceipts15,030 15,017 15,096 SeeReceipts
0 0 0 SeeReceipts0 0 0 SeeReceipts0 0 0 SeeReceipts0 0 0 SeeReceipts
6,460 6,603 6,796 SeeReceipts8,850 8,893 8,852 SeeReceipts
0 0 0 SeeReceipts8,620 8,973 9,432 SeeReceipts3,622 3,409 3,350 SeeReceipts
0 0 0 SeeReceipts0 0 0 SeeReceipts0 0 0 SeeReceipts
218,246 217,073 218,825
38,049 38,466 38,611 10-yearaverage40,899 41,679 38,860 5-yearaverage78,948 80,145 77,471
0 0 0 AvailableFunds25,000 25,000 25,000 AvailableFunds
0 0 00 0 0
25,000 25,000 25,000
2,368,462 2,429,333 2,484,187

10of31
TownofRoyalstonRevenueProjections
FreeCash-AppropriatedPriorYearPurposesGeneralStabilizationFund(SF)CapitalEquipmentNeedsSFCurrentYearPurposesReduceTaxRateTotalFreeCashAppropriated①
OtherAvailableFundsGeneralstabilizationfund(SF)CapitalEquipmentNeedsSFChapter90/HighwayfundsOverlaySurplusOtherTotalOtherAvailableFunds②
TOTALAvailableFunds①DLS,Gateway,Taxrate,TaxRateRecap,pages2and4andtownmeetingminutes.②DLS,Gateway,Taxrate,B2OtherFunds.
FiscalYear
TotalBudget③FreeCashCertifiedAmount④
FreeCashas%ofTotalBudget③DLS,Gateway,Taxrate,TaxRateRecap,page1,1a④DLS,Gateway,Taxrate,B1FreeCash
AvailableBalanceasof:GeneralStabilizationFund(SF)AvailableBalance⑤CapitalEquipmentNeedsSFAvailableBalance
FreeCashandSFas%ofTotalBudget
ProjectedSFBalances:GeneralStabilizationFund(SF)AmountCapitalEquipmentNeedsSFAmount
FY2013 FY2014 FY2015 FY2016 FY2017Budget Budget Budget Budget Budget
0 0 0 0 00 0 0 0 00 0 0 0 00 53,020 0 0 00 0 0 0 00 53,020 0 0 0
37,500 122,800 79,300 98,600 151,3000 0 0 0 00 0 0 0 00 0 0 0 0
121,870 231,211 92,034 128,074 40,000159,370 354,011 171,334 226,674 191,300
159,370 407,031 171,334 226,674 191,300
2013 2014 2015 2016 20177/1/2012 7/1/2013 7/1/2014 7/1/2015 7/1/20162,107,796 2,422,402 2,343,720 2,423,530
53,020 0 0 02.52 - - -
6/30/2012 6/30/2013 6/30/2014 6/30/2015 6/30/2016168,895 117,268 125,345 171,047 242,810
0 0 0 010.53% 4.84% 5.35% 7.06%
00

11of31
TownofRoyalstonRevenueProjections
FreeCash-AppropriatedPriorYearPurposesGeneralStabilizationFund(SF)CapitalEquipmentNeedsSFCurrentYearPurposesReduceTaxRateTotalFreeCashAppropriated①
OtherAvailableFundsGeneralstabilizationfund(SF)CapitalEquipmentNeedsSFChapter90/HighwayfundsOverlaySurplusOtherTotalOtherAvailableFunds②
TOTALAvailableFunds①DLS,Gateway,Taxrate,TaxRateRecap,pages2and4andtownmeetingminutes.②DLS,Gateway,Taxrate,B2OtherFunds.
FiscalYear
TotalBudget③FreeCashCertifiedAmount④
FreeCashas%ofTotalBudget③DLS,Gateway,Taxrate,TaxRateRecap,page1,1a④DLS,Gateway,Taxrate,B1FreeCash
AvailableBalanceasof:GeneralStabilizationFund(SF)AvailableBalance⑤CapitalEquipmentNeedsSFAvailableBalance
FreeCashandSFas%ofTotalBudget
ProjectedSFBalances:GeneralStabilizationFund(SF)AmountCapitalEquipmentNeedsSFAmount
FY2018 FY2019 FY2020 FY2021Projected Projected Projected Projected
0 0 0 00 0 0 00 0 0 00 0 0 00 0 0 00 0 0 0
91,510 0 0 00 0 0 00 0 0 00 0 0 0
25,000 25,000 25,000 25,000116,510 25,000 25,000 25,000
116,510 25,000 25,000 25,000
2018 2019 2020 20217/1/2017 7/1/2018 7/1/2019 7/1/2020
6/30/2017 6/30/2018 6/30/2019 6/30/202091,510 0 0 0
0 91,510 91,510 91,5100 0 0 0

TownofRoyalstonLocalReceipts
BudgetandProjected FY2005 FY2006 FY2007 FY2008 FY2009Budget Budget Budget Budget Budget
1.MotorVehicleExcise 103,871 140,000 135,000 126,000 115,0002a.MealsExcise 0 0 0 0 02b.RoomExcise 0 0 0 0 02c.OtherExcise 500 2,000 5,000 3,000 1,0003.Penalties/InterestonTaxesandExcises 35,000 45,000 20,000 22,000 14,0004.PaymentInLieuofTaxes 2,000 2,000 2,000 2,000 2,0005.ChargesforServices-Water 0 0 0 0 06.ChargesforServices-Sewer 0 0 0 0 07.ChargesforServices-Hospital 0 0 0 0 08.ChargesforServices-SolidWasteFees 36,000 50,000 53,000 60,000 45,7009.OtherChargesforServices 0 0 0 0 010.Fees 8,000 1,200 7,500 4,000 3,00011.Rentals 15,000 12,000 15,000 15,000 15,00012.Dept.Revenue-Schools 0 0 0 0 013.Dept.Revenue-Libraries 0 0 0 0 014.Dept.Revenue-Cemeteries 0 0 0 0 015.Dept.Revenue-Recreation 0 0 0 0 016.OtherDepartmentalRevenue 1,000 7,500 3,000 2,800 9,00017.Licenses/Permits 19,000 17,000 17,000 12,000 8,50018.SpecialAssessments 0 0 0 0 019.FinesandForfeits 5,000 4,500 5,000 8,000 5,00020.InvestmentIncome 15,000 12,000 8,000 4,000 4,00021.MedicaidReimbursement 0 0 0 0 022.Misc.Recurring 0 0 0 0 023.Misc.Non-Recurring 0 0 0 0 0
TOTALLocalReceipts-Budget① 240,371 293,200 270,500 258,800 222,200
Actual FY2005 FY2006 FY2007 FY2008 FY2009Actual Actual Actual Actual Actual
1.MotorVehicleExcise 139,708 135,738 128,754 118,254 101,9352a.MealsExcise 0 0 0 0 02b.RoomExcise 0 0 0 0 02c.OtherExcise 2,262 4,929 3,148 0 03.Penalties/InterestonTaxesandExcises 47,737 20,162 27,878 15,359 14,2474.PaymentInLieuofTaxes 2,202 2,239 2,228 2,201 4,9545.ChargesforServices-Water 0 0 0 0 06.ChargesforServices-Sewer 0 0 0 0 07.ChargesforServices-Hospital 0 0 0 0 08.ChargesforServices-SolidWasteFees 49,266 53,882 61,373 54,635 42,3689.OtherChargesforServices 0 0 0 0 010.Fees 1,204 7,525 3,707 3,066 3,825

11.Rentals 11,300 15,102 15,200 15,175 14,18112.Dept.Revenue-Schools 0 0 0 0 013.Dept.Revenue-Libraries 0 0 0 0 014.Dept.Revenue-Cemeteries 0 0 0 0 015.Dept.Revenue-Recreation 0 0 0 0 016.OtherDepartmentalRevenue 7,761 3,211 2,656 4,946 4,57617.Licenses/Permits 17,167 17,777 16,447 8,402 9,32418.SpecialAssessments 0 0 0 0 019.FinesandForfeits 4,618 5,223 8,640 4,900 4,14520.InvestmentIncome 12,029 8,016 4,603 5,856 4,03721.MedicaidReimbursement 0 0 0 0 022.Misc.Recurring 0 0 0 0 023.Misc.Non-Recurring 0 1,292 4,001 605 504
TOTALLocalReceipts-Actual① 295,254 275,096 278,637 233,399 204,096Difference:ActualoverBudget 54,883 -18,104 8,137 -25,401 -18,104
Percentbudgettoactual 22.83% -6.17% 3.01% -9.82% -8.15%
①DLS,Gateway,Taxrate,TaxRateRecap,page3

FY2010 FY2011 FY2012 FY2013 FY2014 FY2015 FY2016 FY2017 FY2018Budget Budget Budget Budget Budget Budget Budget Projected Projected105,000 101,000 103,000 115,000 115,000 132,500 135,000 114,851 112,867
0 0 0 0 0 0 0 0 00 0 0 0 0 0 0 0 00 0 0 0 0 0 0 0 0
14,000 16,000 14,000 19,500 19,500 31,500 32,500 21,301 21,4094,500 2,950 4,000 3,800 0 0 0 0 0
0 0 0 0 0 0 0 0 00 0 0 0 0 0 0 0 00 0 0 0 0 0 0 0 0
42,000 39,000 42,500 41,000 37,000 38,000 35,000 42,828 41,7780 0 0 0 0 0 3,000 0 0
3,200 5,300 4,600 4,200 4,400 2,750 2,500 3,946 3,60714,000 14,000 16,000 15,900 16,800 17,000 17,500 15,050 15,045
0 0 0 0 0 0 0 0 00 0 0 0 0 0 0 0 00 0 0 0 0 0 0 0 00 0 0 0 0 0 0 0 0
4,500 8,500 7,500 7,500 9,500 5,100 7,000 5,876 6,1309,000 7,000 8,000 13,000 6,300 10,000 10,000 10,227 9,509
0 0 0 0 0 0 0 0 04,200 10,000 11,000 12,000 11,500 13,500 5,000 8,326 8,6214,000 5,000 6,875 4,500 2,000 200 0 4,081 3,707
0 0 0 0 0 0 0 0 00 0 0 0 2,500 0 0 0 00 0 1,500 1,500 0 0 0 0 0
204,400 208,750 218,975 237,900 224,500 250,550 247,500 226,486 222,672
FY2010 FY2011 FY2012 FY2013 FY2014 FY2015 FY2016 FY2017 FY2018Actual Actual Actual Actual Actual Actual Actual Actual Actual111,035 100,587 116,169 122,384 137,051 137,052 0 0 0
0 0 0 0 0 0 0 0 00 0 0 0 0 0 0 0 00 0 0 0 0 0 0 0 0
18,165 13,143 19,212 19,028 42,422 34,601 0 0 03,702 3,732 3,810 0 0 0 0 0 0
0 0 0 0 0 0 0 0 00 0 0 0 0 0 0 0 00 0 0 0 0 0 0 0 0
42,676 41,577 41,177 36,576 39,256 37,298 0 0 00 0 0 0 0 3,440 0 0 0
5,307 4,035 4,175 4,304 2,716 2,882 0 0 0

15,475 15,663 15,825 16,725 16,975 18,100 0 0 00 0 0 0 0 0 0 0 00 0 0 0 0 0 0 0 00 0 0 0 0 0 0 0 00 0 0 0 0 0 0 0 0
9,832 7,132 7,509 9,478 5,132 7,385 0 0 07,931 7,846 13,064 6,208 10,438 10,213 0 0 0
0 0 0 0 0 0 0 0 010,753 10,595 11,885 11,626 13,985 5,895 0 0 06,316 6,516 5,628 1,797 184 0 0 0 0
0 0 0 0 0 0 0 0 00 0 0 2,791 0 0 0 0 0
977 1,433 11,259 37,674 0 17,415 0 0 0232,169 212,259 249,713 268,591 268,159 274,281 0 0 027,769 3,509 30,738 30,691 43,659 23,731 -247,500 -226,486 -222,672
13.59% 1.68% 14.04% 12.90% 19.45% 9.47% -100.00% -100.00% -100.00%

AverageFY2019 FY2020 FY2021 Percent ProjectionProjected Projected Projected Change Percent111,358 110,702 111,535 3.22% 95%of10yearaverage
0 0 00 0 00 0 0
20,794 21,311 21,982 4.93% 95%of10yearaverage0 0 0 0 0 00 0 00 0 0
39,916 38,518 38,152 1.74% 95%of10yearaverage0 0 0
3,597 3,647 3,631 38.60% 95%of10yearaverage15,030 15,017 15,096 1.88% 95%of10yearaverage
0 0 0 0 0 00 0 0 0 0 0
6,460 6,603 6,796 81.22% 95%of10yearaverage8,850 8,893 8,852 -0.15% 95%of10yearaverage
0 0 08,620 8,973 9,432 17.80% 95%of10yearaverage3,622 3,409 3,350 -22.09% 95%of10yearaverage
0 0 00 0 00 0 0
218,246 217,073 218,825 0.94%
AverageFY2019 FY2020 FY2021 PercentActual Actual Actual Change
0 0 0 0.24%0 0 00 0 00 0 00 0 0 7.79%0 0 00 0 00 0 00 0 00 0 0 -2.18%0 0 00 0 0 47.22%

0 0 0 5.28%0 0 00 0 00 0 00 0 00 0 0 11.98%0 0 0 2.21%0 0 00 0 0 15.02%0 0 0 -29.16%0 0 00 0 00 0 00 0 0 -0.18%
-218,246 -217,073 -218,825
-100.00% -100.00% -100.00%

TownofRoyalstonNewGrowthDollarsbyPropertyClass
FY2005 FY2006 FY2007 FY2008 FY2009 FY2010Budget Budget Budget Budget Budget Budget
ResidentialNewGrowth 23,878 21,520 27,134 10,949 12,522 6,755
Commercial(C) 0 0 0 0 0 0Industrial(I) 0 0 0 0 0 0PersonalProperty(PP) 4,795 278 261 2,088 14,042 2,752
CIPNewGrowth 4,795 278 261 2,088 14,042 2,752
TOTALNewGrowth① 28,673 21,798 27,395 13,037 26,564 9,507
3-yearaverageResidential 24,177 19,868 16,868 10,075
CI 0 0 0 0PP 1,778 876 5,464 6,294
Total 25,955 20,743 22,332 16,369
5-yearaverageResidential 19,201 15,776
CI 0 0PP 4,293 3,884
Total 23,493 19,660
10-yearaverageResidential
CIPP
Total
①DLS,Gateway,Taxrate,LA-13TaxLevyBaseGrowth,columnK
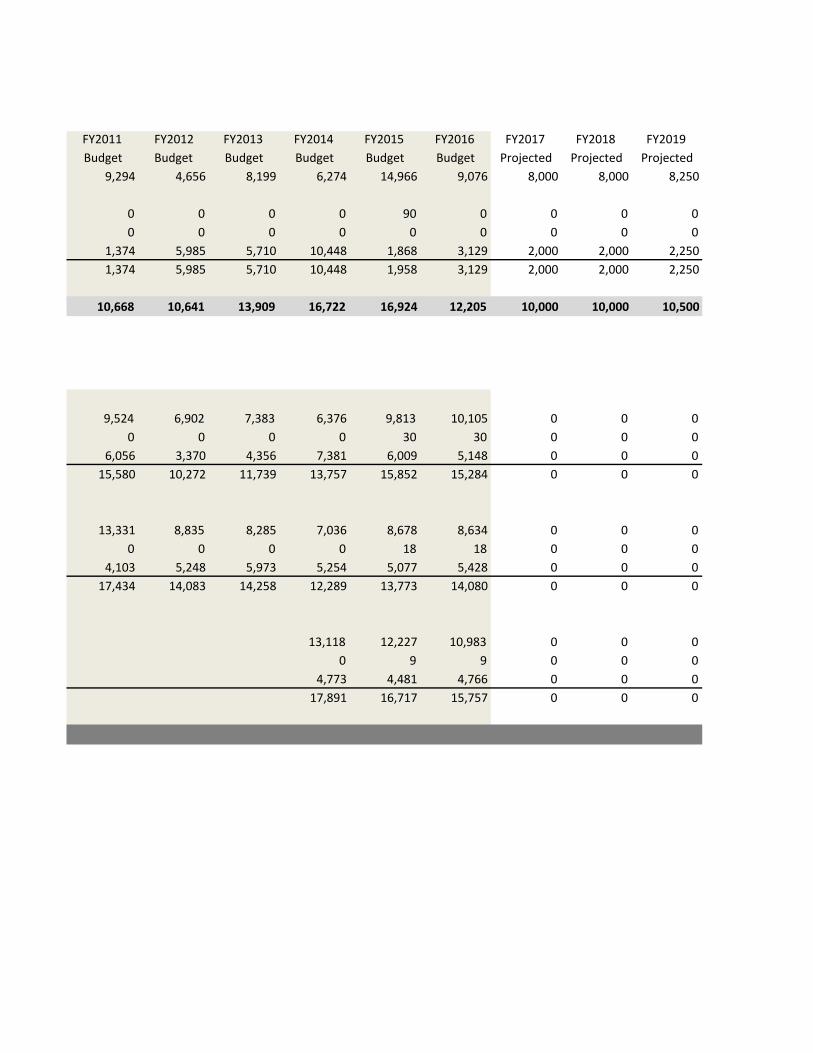
FY2011 FY2012 FY2013 FY2014 FY2015 FY2016 FY2017 FY2018 FY2019Budget Budget Budget Budget Budget Budget Projected Projected Projected
9,294 4,656 8,199 6,274 14,966 9,076 8,000 8,000 8,250
0 0 0 0 90 0 0 0 00 0 0 0 0 0 0 0 0
1,374 5,985 5,710 10,448 1,868 3,129 2,000 2,000 2,2501,374 5,985 5,710 10,448 1,958 3,129 2,000 2,000 2,250
10,668 10,641 13,909 16,722 16,924 12,205 10,000 10,000 10,500
9,524 6,902 7,383 6,376 9,813 10,105 0 0 00 0 0 0 30 30 0 0 0
6,056 3,370 4,356 7,381 6,009 5,148 0 0 015,580 10,272 11,739 13,757 15,852 15,284 0 0 0
13,331 8,835 8,285 7,036 8,678 8,634 0 0 00 0 0 0 18 18 0 0 0
4,103 5,248 5,973 5,254 5,077 5,428 0 0 017,434 14,083 14,258 12,289 13,773 14,080 0 0 0
13,118 12,227 10,983 0 0 00 9 9 0 0 0
4,773 4,481 4,766 0 0 017,891 16,717 15,757 0 0 0

FY2020 FY2021Projected Projected
8,250 8,250
0 00 0
2,250 2,2502,250 2,250
10,500 10,500
0 00 00 00 0
0 00 00 00 0
0 00 00 00 0

TownofRoyalstonExpenditureProjections
GENERALGOVERNMENTElectedOfficialsPersonalServicesExpensesCapitalOutlayReserveFund
TOTALGeneralGovernment
PUBLICSAFETYPolicePersonalServices(Dispatch)PoliceExpensesPoliceCapitalOutlay/SpecialArticlesTotalPolice
FirePersonalServicesFireExpenses(EMS)FireCapitalOutlay/SpecialArticlesTotalFire
InspectionalServicesPersonalServicesInspectionalServicesExpensesTotalInspectionalServices
TOTALPublicSafety
EDUCATIONAthol-RoyalstonRegionalMontachusettRegionalVocationalTechnical
TOTALEducation
PUBLICWORKSCemeteryElectedOfficialsDPW/CemeteryPersonalServicesDPW/CemeteryExpenses/Snow&IceTransferDPW/CemeteryMaintenanceTotalDPW/Cemetery
WasteWaterTreatmentElectedOfficialsWasteWaterTreatmentExpensesWasteWaterTreatmentCapitalOutlayTotalWasteWaterTreatment
TOTALPublicWorks
HUMANSERVICESPersonalServicesExpensesCapitalOutlay
TOTALHumanServices
CULTURE/RECREATIONPersonalServicesExpensesEvents
TOTALCulture/Recreation
DEBTSERVICE/CAPITALPLANDebtServiceDebtExcludedDebtServiceTemporaryInterestLeasePaymentsProposedDebtExcludedDebtServiceCapital/SpecialArticlesChapter90Projects
TOTALDebtService&Capital
STATEASSESSMENTSCountyTaxAirPollutionRMVNon-RenewalSurchargeSTRAP
TOTALStateAssessments
RISKMANAGEMENTPolice&FireInsuranceProperty&AutoInsurancePublicOfficialsBonds
TOTALRiskManagement
EMPLOYEEBENEFITSRetirement
AverageFY2013 FY2014 FY2015 FY2016 FY2017 FY2018 FY2019 FY2020 FY2021 Percent ProjectionActual Actual Budget Budget Budget/ATM Projected Projected Projected Projected Change Percent
0 0 22,932 23,511 25,752 25,881 26,010 26,140 26,271 6.03% 0.50%0 0 62,919 65,489 66,534 66,534 66,534 66,534 66,534 2.84% COLA/notincluded0 0 139,555 136,175 134,712 138,080 141,532 145,070 148,697 -1.75% 2.50%0 0 0 0 0 0 0 0 0 0.00%0 0 0 0 0 0 0 0 0 0.00%0 0 225,406 225,175 226,998 230,495 234,076 237,744 241,502
0 0 72,999 71,823 72,893 72,893 72,893 72,893 72,893 -0.06% COLA/notincluded0 0 41,273 43,585 45,854 47,000 48,175 49,380 50,614 5.40% 2.50%0 0 4,300 0 0 0 0 0 0 0.00%0 0 118,572 115,408 118,747 119,893 121,068 122,273 123,507
0 0 34,660 35,600 37,000 37,000 37,000 37,000 37,000 3.32% COLA/notincluded0 0 53,062 54,256 54,256 55,612 57,003 58,428 59,888 1.13% 2.50%0 0 6,100 0 0 0 0 0 0 0.00%0 0 93,822 89,856 91,256 92,612 94,003 95,428 96,888
0 0 12,300 12,300 12,608 12,608 12,608 12,608 12,608 1.25% COLA/notincluded0 0 3,461 5,461 5,598 5,738 5,881 6,028 6,179 30.15% 2.50%0 0 15,761 17,761 18,206 18,346 18,489 18,636 18,7870 0 228,155 223,025 228,209 230,852 233,560 236,337 239,183
0 453,234 448,000 479,131 538,817 565,758 594,046 623,748 654,935 6.08% 5.00%0 103,562 115,473 114,159 98,994 99,984 100,984 101,994 103,014 -7.21% 1.00%
584,340 556,796 563,473 593,290 637,811 665,742 695,030 725,742 757,949
0 0 650 650 650 650 650 650 650 0.00% 0.00%0 0 239,420 246,000 250,349 250,349 250,349 250,349 250,349 2.26% COLA/notincluded0 0 344,234 347,618 259,530 266,018 272,669 279,485 286,473 -12.18% 2.50%0 0 33,000 33,250 33,250 34,081 34,933 35,807 36,702 2.50%0 0 617,304 627,518 543,779 551,099 558,601 566,291 574,173
0 0 822 800 800 800 800 800 800 -1.34% 0.00%0 0 36,410 36,598 37,901 38,849 39,820 40,815 41,836 2.04% 2.50%0 0 1,300 1,300 1,300 1,333 1,366 1,400 1,435 0.00% 2.50%0 0 38,532 38,698 40,001 40,981 41,986 43,015 44,0710 0 655,836 666,216 583,780 592,080 600,587 609,306 618,244
0 0 16,544 18,647 19,746 19,746 19,746 19,746 19,746 9.30% COLA/notincluded0 0 67,040 68,970 68,655 70,371 72,131 73,934 75,782 1.21% 2.50%0 0 0 0 0 0 0 0 00 0 83,584 87,617 88,401 90,117 91,877 93,680 95,528
0 0 29,794 31,342 32,953 32,953 32,953 32,953 32,953 5.17% COLA/notincluded0 0 23,510 24,191 25,426 26,062 26,713 27,381 28,066 4.00% 2.50%0 0 2,650 650 1,150 1,179 1,208 1,238 1,269 0.73% 2.50%0 0 55,954 56,183 59,529 60,193 60,874 61,572 62,288
0 0 0 0 0 0 0 0 00 0 109,870 101,962 150,633 150,035 111,056 116,871 116,2730 0 2,000 9,200 5,000 2,000 2,000 2,000 2,0000 0 12,200 9,200 9,200 9,000 10,500 10,000 9,5000 0 0 0 0 0 0 0 00 0 0 0 0 0 0 0 00 0 0 0 0 0 0 0 00 0 124,070 120,362 164,833 161,035 123,556 128,871 127,773
0 0 0 0 0 0 0 0 00 0 356 334 342 344 345 347 349 -1.89% 0.50%0 0 2,660 2,660 2,660 2,673 2,687 2,700 2,714 0.00% 0.50%0 0 10,551 10,551 10,551 10,551 10,551 10,551 10,551 0.00% 0.00%0 0 13,567 13,545 13,553 13,568 13,583 13,598 13,613
0 0 0 00 0 10,200 13,000 13,080 13,472 13,877 14,293 14,722 14.03% 3.00%0 0 35,974 38,274 39,200 40,376 41,587 42,835 44,120 4.41% 3.00%0 0 0 0 0 0 0 0 00 0 46,174 51,274 52,280 53,848 55,464 57,128 58,842
0 0 25,333 46,578 50,567 53,601 56,817 60,226 63,840 46.21% 6.00%

TownofRoyalstonExpenditureProjections
Medicare/FICAWorkers'CompensationUnemploymentCompensationGroupHealth/LifeInsurance
TOTALEmployeeBenefits
OTHERAMOUNTSTOBERAISEDDeficits/Judgements/TaxtitleCherrySheetOffsetsIntergovernmentalAbatements&Exemptions(Overlay)
TOTALOtherAmountsRaised
MISC./OTHERFINANCINGUSESReserveFundSpecialArticlesCommunityPreservationTransfertoSpecialRevenueFundsTransfertoCapitalProjectFundsTransfertoOBEPFundTransfertoStabilizationFunds
TOTALMisc.Appropriations
TOTALGENERALFUND
AverageFY2013 FY2014 FY2015 FY2016 FY2017 FY2018 FY2019 FY2020 FY2021 Percent ProjectionActual Actual Budget Budget Budget/ATM Projected Projected Projected Projected Change Percent
0 0 10,000 10,000 10,000 10,000 10,000 10,000 10,000 0.00% 0.00%0 0 20,000 14,000 15,000 15,000 15,000 15,000 15,000 -11.43% 0.00%0 0 9,000 5,000 4,000 4,000 4,000 4,000 4,000 -32.22% 0.00%0 0 50,000 50,000 50,000 50,500 51,005 51,515 52,030 0.00% 1.00%0 0 114,333 125,578 129,567 133,101 136,822 140,741 144,870
0 0 0 0 0 0 0 0 00 0 2,515 2,638 2,615 2,628 2,641 2,654 2,668 2.01% SeeRevenues0 0 0 0 0 0 0 0 00 0 25,233 26,519 26,000 26,390 26,786 27,188 27,595 1.57% 1.50%0 0 27,748 29,157 28,615 29,018 29,427 29,842 30,263
0 0 32,000 20,000 28,421 20,000 20,000 20,000 20,000 0.00%0 0 63,790 62,400 214,400 150,000 150,000 150,000 150,0000 0 55,775 32,000 32,000 40,083 40,899 41,679 38,860 SeeRevenues0 0 0 0 0 0 0 0 00 0 0 0 0 0 0 0 00 0 0 0 0 0 0 0 00 0 53,855 117,707 0 0 0 0 0 SeeAvailableFunds0 0 205,420 232,107 274,821 210,083 190,899 191,679 188,860
584,340 556,796 2,343,720 2,423,530 2,488,397 2,470,132 2,465,755 2,526,240 2,578,915

TownofRoyalstonFinancialImpactAnalysis 2% 2% 2% 2%
FY2017 FY2018 FY2019 FY2020 FY2021Budgeted Projected Projected Projected Projected
TownCompensationPlan(effective7/1/2016)GeneralGovernment 66,534 67,865 69,222 70,606 72,019PublicSafetyPolice 72,893 74,351 75,838 77,355 78,902Fire 37,000 37,740 38,495 39,265 40,050InspectionalServices 12,608 12,860 13,117 13,380 13,647
HumanServices 19,746 20,141 20,544 20,955 21,374Culture/Recreation 32,953 33,612 34,284 34,970 35,669TownCompensationPlanPersonalServices 241,734 246,569 251,500 256,530 261,661FinancialImpactofCOLA 4,835 9,766 14,796 19,927
DPWContract(expires6/30/2017)DPWPersonalServices 250,349 255,356 260,463 265,672 270,986FinancialImpactofCOLA 5,007 10,114 15,323 20,637
TOTALFinancialImpactofCOLA 9,842 19,880 30,119 40,563

TownofRoyalstonDebt
DebtService①ExcludedDebtService①TemporaryInterest②
TotalDebt①Frombankdebtserviceschedules
②Budgeted
FY2013 FY2014 FY2015 FY2016 FY2017 FY2018Actual Actual Actual Budget Projected Projected
0 0 0 0 0 027,553 54,370 109,870 101,962 150,633 150,035
0 0 2,000 9,200 5,000 2,00027,553 54,370 111,870 111,162 155,633 152,035

TownofRoyalstonDebt
DebtService①ExcludedDebtService①TemporaryInterest②
TotalDebt①Frombankdebtserviceschedules
②Budgeted
FY2019 FY2020 FY2021Projected Projected Projected
0 0 0111,056 116,871 116,273
2,000 2,000 2,000113,056 118,871 118,273

TownofRoyalstonSummaryofProjectedRevenuesandExpenditures
FY2016 FY2017 FY2018 FY2019 FY2020 FY2021RevenuesPropertyTaxLevy 1,609,956 1,708,226 1,756,568 1,768,252 1,825,997 1,878,627StateAidCherrySheet 270,802 267,957 274,954 278,015 281,118 284,264EstimatedLocal&OffsetReceipts 316,098 303,197 300,364 297,194 297,218 296,296AvailableFunds/OtherFinancingSources 226,674 191,300 116,510 25,000 25,000 25,000
TotalRevenues 2,423,530 2,470,680 2,448,396 2,368,462 2,429,333 2,484,187
ExpendituresGeneralGovernment 225,175 226,998 289,653 293,235 296,903 300,661PublicSafety 223,025 228,209 230,852 233,560 236,337 239,183Education 593,290 637,811 665,742 695,030 725,742 757,949PublicWorks/Cemetery 666,216 583,780 592,080 600,587 609,306 618,244HumanServices 87,617 88,401 90,117 91,877 93,680 95,528Culture&Recreation 56,183 59,529 60,193 60,874 61,572 62,288DebtService/CapitalPlan 120,362 164,833 161,035 123,556 128,871 127,773Intergovernmental 13,545 13,553 13,568 13,583 13,598 13,613FixedCosts/Benefits 125,578 129,567 181,959 187,360 193,048 199,039RiskManagement 51,274 52,280 53,848 55,464 57,128 58,842OtherAmountsRaised 29,157 28,615 29,018 29,427 29,842 30,263FreeCash/OtherFin.Uses 232,107 274,821 210,083 190,899 191,679 188,860
TotalExpenditures 2,423,530 2,488,397 2,578,149 2,575,452 2,637,706 2,692,243
GrandTotalRevenues 2,423,530 2,470,680 2,448,396 2,368,462 2,429,333 2,484,187GrandTotalExpenditures 2,423,530 2,488,397 2,578,149 2,575,452 2,637,706 2,692,243
TotalSurplus/(Shortfall) 0 (17,717) (129,753) (206,990) (208,373) (208,057)

TownofRoyalstonExpenditureProjections
GENERALGOVERNMENTElectedOfficialsPersonalServicesExpensesCapitalOutlayReserveFund
TOTALGeneralGovernment
PUBLICSAFETYPolicePersonalServices(Dispatch)PoliceExpensesPoliceCapitalOutlay/SpecialArticlesTotalPolice
FirePersonalServicesFireExpenses(EMS)FireCapitalOutlay/SpecialArticlesTotalFire
InspectionalServicesPersonalServicesInspectionalServicesExpensesTotalInspectionalServices
TOTALPublicSafety
EDUCATIONAthol-RoyalstonRegionalMontachusettRegionalVocationalTechnical
TOTALEducation
PUBLICWORKSCemeteryElectedOfficialsDPW/CemeteryPersonalServicesDPW/CemeteryExpenses/Snow&IceTransferDPW/CemeteryMaintenanceTotalDPW/Cemetery
WasteWaterTreatmentElectedOfficialsWasteWaterTreatmentExpensesWasteWaterTreatmentCapitalOutlayTotalWasteWaterTreatment
TOTALPublicWorks
HUMANSERVICESPersonalServicesExpensesCapitalOutlay
TOTALHumanServices
CULTURE/RECREATIONPersonalServicesExpensesEvents
TOTALCulture/Recreation
DEBTSERVICE/CAPITALPLANDebtServiceDebtExcludedDebtServiceTemporaryInterestLeasePaymentsProposedDebtExcludedDebtServiceCapital/SpecialArticlesChapter90Projects
TOTALDebtService&Capital
STATEASSESSMENTSCountyTaxAirPollutionRMVNon-RenewalSurchargeSTRAP
TOTALStateAssessments
RISKMANAGEMENTPolice&FireInsuranceProperty&AutoInsurancePublicOfficialsBonds
TOTALRiskManagement
EMPLOYEEBENEFITSRetirement
AverageFY2013 FY2014 FY2015 FY2016 FY2017 FY2018 FY2019 FY2020 FY2021 Percent ProjectionActual Actual Budget Budget Budget/ATM Projected Projected Projected Projected Change Percent
0 0 22,932 23,511 25,752 25,881 26,010 26,140 26,271 6.03% 0.50%0 0 62,919 65,489 66,534 125,693 125,693 125,693 125,693 2.84% COLA/notincluded0 0 139,555 136,175 134,712 138,080 141,532 145,070 148,697 -1.75% 2.50%0 0 0 0 0 0 0 0 0 0.00%0 0 0 0 0 0 0 0 0 0.00%0 0 225,406 225,175 226,998 289,653 293,235 296,903 300,661
0 0 72,999 71,823 72,893 72,893 72,893 72,893 72,893 -0.06% COLA/notincluded0 0 41,273 43,585 45,854 47,000 48,175 49,380 50,614 5.40% 2.50%0 0 4,300 0 0 0 0 0 0 0.00%0 0 118,572 115,408 118,747 119,893 121,068 122,273 123,507
0 0 34,660 35,600 37,000 37,000 37,000 37,000 37,000 3.32% COLA/notincluded0 0 53,062 54,256 54,256 55,612 57,003 58,428 59,888 1.13% 2.50%0 0 6,100 0 0 0 0 0 0 0.00%0 0 93,822 89,856 91,256 92,612 94,003 95,428 96,888
0 0 12,300 12,300 12,608 12,608 12,608 12,608 12,608 1.25% COLA/notincluded0 0 3,461 5,461 5,598 5,738 5,881 6,028 6,179 30.15% 2.50%0 0 15,761 17,761 18,206 18,346 18,489 18,636 18,7870 0 228,155 223,025 228,209 230,852 233,560 236,337 239,183
0 453,234 448,000 479,131 538,817 565,758 594,046 623,748 654,935 6.08% 5.00%0 103,562 115,473 114,159 98,994 99,984 100,984 101,994 103,014 -7.21% 1.00%
584,340 556,796 563,473 593,290 637,811 665,742 695,030 725,742 757,949
0 0 650 650 650 650 650 650 650 0.00% 0.00%0 0 239,420 246,000 250,349 250,349 250,349 250,349 250,349 2.26% COLA/notincluded0 0 344,234 347,618 259,530 266,018 272,669 279,485 286,473 -12.18% 2.50%0 0 33,000 33,250 33,250 34,081 34,933 35,807 36,702 2.50%0 0 617,304 627,518 543,779 551,099 558,601 566,291 574,173
0 0 822 800 800 800 800 800 800 -1.34% 0.00%0 0 36,410 36,598 37,901 38,849 39,820 40,815 41,836 2.04% 2.50%0 0 1,300 1,300 1,300 1,333 1,366 1,400 1,435 0.00% 2.50%0 0 38,532 38,698 40,001 40,981 41,986 43,015 44,0710 0 655,836 666,216 583,780 592,080 600,587 609,306 618,244
0 0 16,544 18,647 19,746 19,746 19,746 19,746 19,746 9.30% COLA/notincluded0 0 67,040 68,970 68,655 70,371 72,131 73,934 75,782 1.21% 2.50%0 0 0 0 0 0 0 0 00 0 83,584 87,617 88,401 90,117 91,877 93,680 95,528
0 0 29,794 31,342 32,953 32,953 32,953 32,953 32,953 5.17% COLA/notincluded0 0 23,510 24,191 25,426 26,062 26,713 27,381 28,066 4.00% 2.50%0 0 2,650 650 1,150 1,179 1,208 1,238 1,269 0.73% 2.50%0 0 55,954 56,183 59,529 60,193 60,874 61,572 62,288
0 0 0 0 0 0 0 0 00 0 109,870 101,962 150,633 150,035 111,056 116,871 116,2730 0 2,000 9,200 5,000 2,000 2,000 2,000 2,0000 0 12,200 9,200 9,200 9,000 10,500 10,000 9,5000 0 0 0 0 0 0 0 00 0 0 0 0 0 0 0 00 0 0 0 0 0 0 0 00 0 124,070 120,362 164,833 161,035 123,556 128,871 127,773
0 0 0 0 0 0 0 0 00 0 356 334 342 344 345 347 349 -1.89% 0.50%0 0 2,660 2,660 2,660 2,673 2,687 2,700 2,714 0.00% 0.50%0 0 10,551 10,551 10,551 10,551 10,551 10,551 10,551 0.00% 0.00%0 0 13,567 13,545 13,553 13,568 13,583 13,598 13,613
0 0 0 00 0 10,200 13,000 13,080 13,472 13,877 14,293 14,722 14.03% 3.00%0 0 35,974 38,274 39,200 40,376 41,587 42,835 44,120 4.41% 3.00%0 0 0 0 0 0 0 0 00 0 46,174 51,274 52,280 53,848 55,464 57,128 58,842
0 0 25,333 46,578 50,567 77,601 82,257 87,193 92,424 46.21% 6.00%
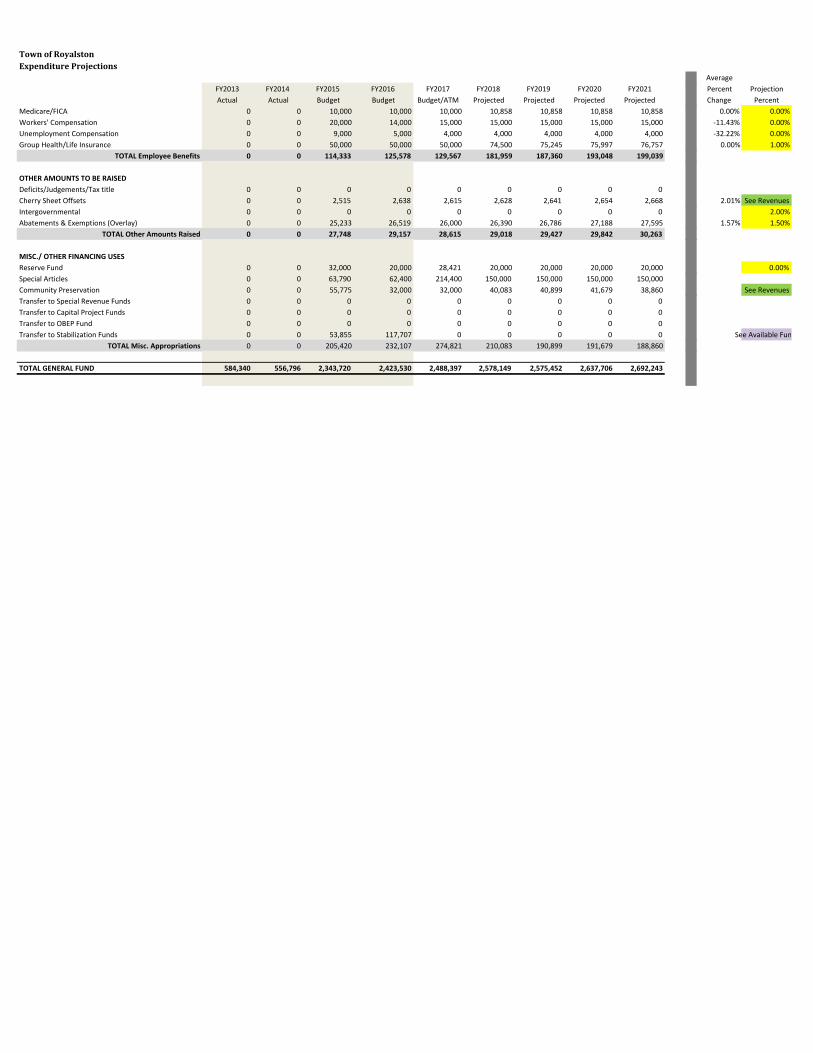
TownofRoyalstonExpenditureProjections
Medicare/FICAWorkers'CompensationUnemploymentCompensationGroupHealth/LifeInsurance
TOTALEmployeeBenefits
OTHERAMOUNTSTOBERAISEDDeficits/Judgements/TaxtitleCherrySheetOffsetsIntergovernmentalAbatements&Exemptions(Overlay)
TOTALOtherAmountsRaised
MISC./OTHERFINANCINGUSESReserveFundSpecialArticlesCommunityPreservationTransfertoSpecialRevenueFundsTransfertoCapitalProjectFundsTransfertoOBEPFundTransfertoStabilizationFunds
TOTALMisc.Appropriations
TOTALGENERALFUND
AverageFY2013 FY2014 FY2015 FY2016 FY2017 FY2018 FY2019 FY2020 FY2021 Percent ProjectionActual Actual Budget Budget Budget/ATM Projected Projected Projected Projected Change Percent
0 0 10,000 10,000 10,000 10,858 10,858 10,858 10,858 0.00% 0.00%0 0 20,000 14,000 15,000 15,000 15,000 15,000 15,000 -11.43% 0.00%0 0 9,000 5,000 4,000 4,000 4,000 4,000 4,000 -32.22% 0.00%0 0 50,000 50,000 50,000 74,500 75,245 75,997 76,757 0.00% 1.00%0 0 114,333 125,578 129,567 181,959 187,360 193,048 199,039
0 0 0 0 0 0 0 0 00 0 2,515 2,638 2,615 2,628 2,641 2,654 2,668 2.01% SeeRevenues0 0 0 0 0 0 0 0 0 2.00%0 0 25,233 26,519 26,000 26,390 26,786 27,188 27,595 1.57% 1.50%0 0 27,748 29,157 28,615 29,018 29,427 29,842 30,263
0 0 32,000 20,000 28,421 20,000 20,000 20,000 20,000 0.00%0 0 63,790 62,400 214,400 150,000 150,000 150,000 150,0000 0 55,775 32,000 32,000 40,083 40,899 41,679 38,860 SeeRevenues0 0 0 0 0 0 0 0 00 0 0 0 0 0 0 0 00 0 0 0 0 0 0 0 00 0 53,855 117,707 0 0 0 0 0 SeeAvailableFunds0 0 205,420 232,107 274,821 210,083 190,899 191,679 188,860
584,340 556,796 2,343,720 2,423,530 2,488,397 2,578,149 2,575,452 2,637,706 2,692,243

TownofRoyalstonFinancialImpactAnalysis
CurrentTitle2017Budget
2018Budget
AverageHours
AverageFY18Rate
NewTitle
AdministrativeAssistant 15,675 15,989 19 16.18 TownCoordinatorTownAccountant 12,497 12,747 6 40.86 FinanceDirector/TownAccountantTaxCollector 13,489 13,759 8 33.07 Collector/TreasurerTreasurer 12,497 12,747 10 24.51 Staff/ClerkTotal 54,158 55,241
Fiscal2018IncreaseProjectedoverBudget

ProjectedHours
ProjectedRate
ProjectedSalary
Insurance RetirementMedicare/
FICA
24 45 56,160 24,000 15,000 58212 41 25,584 0 0 18616 33 27,456 0 0 1995 20 5,200 0 0 (109)
114,400 24,000 15,000 858
59,159 24,000 15,000 858

TownofRoyalstonFinancialImpactAnalysis 2% 2% 2% 2%
FY2017 FY2018 FY2019 FY2020 FY2021Budgeted Projected Projected Projected Projected
TownCompensationPlan(effective7/1/2016)GeneralGovernment 66,534 127,024 129,564 132,155 134,798PublicSafetyPolice 72,893 74,351 75,838 77,355 78,902Fire 37,000 37,740 38,495 39,265 40,050InspectionalServices 12,608 12,860 13,117 13,380 13,647
HumanServices 19,746 20,141 20,544 20,955 21,374Culture/Recreation 32,953 33,612 34,284 34,970 35,669TownCompensationPlanPersonalServices 241,734 305,728 311,842 318,079 324,440FinancialImpactofCOLA 4,835 10,949 17,186 23,548
DPWContract(expires6/30/2017)DPWPersonalServices 250,349 255,356 260,463 265,672 270,986FinancialImpactofCOLA 5,007 10,114 15,323 20,637
TOTALFinancialImpactofCOLA 9,842 21,063 32,509 44,184


![REVISED AGENDA - southboroughtown.com€¦ · [RECEIVED 1 By Town ClerWamb at 3:37pm, Sep 17, 2020] Town of Southborough, MA Meeting of the Board of Selectmen September 22, 2020,](https://img.dokumen.tips/doc/110x75/601a8878fe2cc116ff45dada/revised-agenda-received-1-by-town-clerwamb-at-337pm-sep-17-2020-town-of-southborough.jpg)