Embed Size (px)
Citation preview

1
2008 Arizona Youth Survey
Town of Gilbert, AZ
REPORT PROVIDED BY:
Arizona Criminal Justice Commission

2
2008 Arizona Youth Survey
Shining Light on Arizona Youth
Arizona Criminal Justice Commission
IN PARTNERSHIP WITH:
Arizona Department of Gaming’s Office of Problem Gambling
Arizona Juvenile Justice Commission
Arizona Parent’s Commission on Drug Education and Prevention
Governor’s Division for Substance Abuse Policy
Governor’s Office for Children, Youth, and Families
Tobacco Education and Prevention Program, Arizona Department of Health Services

3
Acknowledgements
The Arizona Criminal Justice Commission’s Statistical Analysis Center thanks Bach Harrison, L.L.C. for their professionalism and contributions during the administration of the 2008 Arizona Youth Survey. We also benefited from the expertise, guidance, and assistance provided by our colleagues at the Arizona Criminal Justice Commission and from input received from many individuals working for agencies throughout the state including:
Jean Ajamie, Arizona Department of Education Michelle Anderson, Arizona Department of Juvenile Corrections
Steve Ballance, Maricopa County Carisa Dwyer, Governor’s Office for Children, Youth, and Families
Charles Katz, Arizona State University Dr. Manuel Medina, TERROS, Inc.
Kim O’Connor, Governor’s Office for Children, Youth, and Families
Holly Orozco, Governor’s Office for Children, Youth, and Families Catherine Osborn, Arizona Department of Education
Richard Porter, Arizona Department of Health Services Gowri Shetty, Arizona Department of Health Services
Lisa Shumaker, Arizona Department of Health Services Wendy Wolfersteig, Arizona State University
Nicole Yancey Johnson, Arizona Early Childhood Development and Health Board
Governor’s Youth Commission
Additionally, the success of the 2008 Arizona Youth Survey could not have been achieved without the support and participation of school superintendents, principals, prevention coordinators, and teachers throughout the state. Finally, we extend our thanks to the students who responded to the survey. Their thoughtful participation resulted in a wealth of information that can be used to improve the circumstances in which they live and learn.

4
of the questions, the number of students in the gender and ethnicity categories often will be less than the total number of students. Whenever data is obtained from a sample of students instead of the entire population, it is important to recognize the strengths and weaknesses of the data. One quick and easy way to investigate the quality of the sample is to look at the basic demographic characteristics of the students who participated in the survey and compare them to what is known about the entire population of students. This will give the user of these data a basic understanding of the degree to which the sample data can be generalized to the entire population. It is important to note that even when the characteristics of the sample do not match well to the characteristics of the population this does not mean the data lose their usefulness. The data included in this report describes the level of risk and protective factors, substance use, anti-social behavior, and delinquency of those youth who participated in the survey, which can be used to inform the development of school and community-based prevention and intervention activities that may benefit both the youth who participated in the survey and those that did not.
Changes to the AYS Survey for 2008 In an effort to shorten the AYS and make it more responsive to local priorities, the following changes were made for 2008: 1) some of the substance use questions were refined and the use of over-the-counter drugs was added, 2) some risk and protective factor scales were removed where the data could easily be obtained from other sources or the scales measured similar constructs (scales removed are Transitions and Mobility, Community Disorganization, Intention to Use
2008 Arizona Youth Survey Summary for
Town of Gilbert, AZ
This report summarizes some of the findings from the 2008 Arizona Youth Survey (AYS) administered to 8th, 10th and 12th grade students during the spring of 2008. The results for your city are presented along with comparisons to the results for the state. The survey was designed to assess school safety, adolescent substance use, anti-social behavior and the risk and protective factors that predict these adolescent problem behaviors.
All schools in Arizona are eligible to participate in the survey, and recruitment efforts were successful in obtaining participation by schools in all of the 15 counties. Careful planning and uniform administration of the survey have resulted in survey data that are valid and representative of the students in 8th, 10th, and 12th grades in Arizona.
Table 1 contains the characteristics of the students who completed the survey from your municipality and the state. Because not every student answered all
Student TotalsTown 2004 Town 2006 Town 2008 State 2008
Number Percent Number Percent Number Percent Number Percent
3,100 100 2,802 100 3,272 100 54,734 100
Grade
8 1,408 45.4 1,184 42.3 1,285 39.3 25,695 46.9
10 993 32.0 855 30.5 1,144 35.0 16,089 29.4
12 699 22.5 763 27.2 843 25.8 12,950 23.7
Gender
Male 1,401 46.0 1,293 47.9 1,575 49.1 26,213 48.8
Female 1,643 54.0 1,408 52.1 1,635 50.9 27,514 51.2
Ethnicity*
Native American 45 1.5 41 1.5 176 4.5 4,812 7.4
African American 103 3.3 100 3.7 249 6.4 3,915 6.0
Hispanic 365 11.9 386 14.2 653 16.7 21,525 32.9
White 2,256 73.3 1,875 68.9 2,525 64.7 31,887 48.8
Asian 137 4.5 141 5.2 218 5.6 2,117 3.2
Pacific Islander 35 1.1 36 1.3 80 2.1 1,115 1.7 *In 2008, students could mark more than one ethnic category and the 'other' category was removed.
Table 1. Characteristics of Participants
Total Students
CONTENTS:
Introduction The Risk and Protective Factor Model of Prevention The Arizona Substance Abuse Partnership How to Read the Charts Practical Implications of the Assessment Assessment and Planning Data Charts: • Substance Use • Antisocial Behavior
and Gambling • Risk & Protective
Factor Profiles • Where Youth
Obtained Alcohol • School Safety
Risk and Protective Factor Scale Definitions Data Tables Contacts for Prevention Appendix
Introduction

5
Risk and Protective Factors
Drugs, and Social Skills), 3) questions about where students get the alcohol they drink were added, 4) an 8-State Norm was added that can be used to compare the AYS results on risk, protection, and antisocial behavior to a more national sample (see the description of the 8-State Norm later in this report), and 5) National Outcome Measures that are needed for measuring the performance of federally funded programs in Arizona such as talking to parents about the dangers of substance use were added. The Risk and Protective Factor Model of Substance Abuse Prevention Many states, school districts and local agencies have adopted the Risk and Protective Factor Model to guide their prevention efforts. The Risk and Protective Factor Model of Prevention is based on the simple premise that to prevent a problem from happening, we need to identify the factors that increase the risk of that problem developing and then find ways to reduce the risks. Just as medical researchers have found risk factors for heart disease such as diets high in fat, lack of exercise and smoking, a team of researchers at the University of Washington have identified a set of risk factors for youth problem behaviors. Risk factors are characteristics of school, community, and family environments, as well as characteristics of students and their peer groups that are known to predict increased likelihood of drug use, delinquency, school dropout, teen pregnancy, and violent behavior among youth. Dr. J. David Hawkins, Dr. Richard F. Catalano, and their colleagues at the University of Washington, Social Development Research Group have investigated the relationship between risk and
protective factors and youth problem behavior. They have found, for example, that children who live in families with high levels of conflict are more likely to become involved in problem behaviors such as delinquency and drug use than children who live in families with low levels of family conflict. Protective factors exert a positive influence or buffer against the negative influence of risk, thus reducing the likelihood that adolescents will engage in problem behaviors. Protective factors identified through research include social bonding to family, school, community, and peers; healthy beliefs and clear standards for behavior; and individual characteristics. For bonding to serve as a protective influence, it must occur through involvement with peers and adults who communicate healthy values and set clear standards for behavior. By measuring both risk and protective factors in a population, prevention programs can be implemented that are designed to reduce the elevated risk factors and increase the protective factors. For example, if academic failure is identified as an elevated risk factor in a community, then mentoring, tutoring, and increased opportunities and rewards for classroom participation can be provided to improve academic performance. The chart below shows the links between the 19 risk factors and the five problem behaviors. The check marks have been placed in the chart to indicate where at least two well designed, published research studies have shown a link between the risk factor and the problem behavior.
SOURCE: COMMUNITIES THAT CARE (CTC) PREVENTION MODEL, CENTER FOR SUBSTANCE ABUSE PREVENTION (CSAP), SUBSTANCE ABUSE AND MENTAL HEALTH SERVICES ADMINISTRATION (SAMSHA)
Community Family School Peer / Individual
Com
mun
ity L
aws
& N
orm
s F
avor
able
Tow
ard
Dru
g U
se,
Fire
arm
s &
Crim
e
Ava
ilabi
lity
of D
rugs
& F
irear
ms
Tra
nsiti
ons
& M
obili
ty
Low
Nei
ghbo
rhoo
d A
ttach
men
t
Com
mun
ity D
isor
gani
zatio
n
Ext
rem
e Ec
onom
ic &
Soc
ial D
epriv
atio
n
Fam
ily H
isto
ry o
f the
Pro
blem
Beh
avio
r
Fam
ily C
onfli
ct
Fam
ily M
anag
emen
t Pro
blem
s
Fav
orab
le P
aren
t Atti
tude
s &
Invo
lvem
ent i
n th
e P
robl
em B
ehav
ior
Aca
dem
ic F
ailu
re
Lac
k of
Com
mitm
ent t
o S
choo
l
Ear
ly In
itiat
ion
of D
rug
Use
& O
ther
Pro
blem
Beh
avio
r
Ear
ly &
Per
sist
ent
Ant
isoc
ial B
ehav
ior
Alie
natio
n &
Reb
ellio
usne
ss
Frie
nds
Who
Use
Dru
gs &
Eng
age
in a
Pro
blem
Beh
avio
r
Fav
orab
le A
ttitu
des
Tow
ard
Dru
g U
se &
Oth
er P
robl
em B
ehav
iors
Gan
g In
volv
emen
t
Con
stitu
tiona
l Fac
tors
T T T T T T T T T T T T T T T T T T T
T T T T T T T T T T T T T T T T T T T
T T T T T T T T T T
T T T T T T T T T T T T
T T T T T T T T T T T T T T T T
School Drop-Out Violence
RiskFactors
Substance Abuse Delinquency Teen Pregnancy

6
The Arizona Substance Abuse Partnership
The Arizona Substance Abuse Partnership (ASAP) was established by Governor Napolitano’s Executive Order 2007-12 in June 2007. Chaired by the Governor’s Chief of Staff, ASAP is composed of representatives from state government entities, federal entities, and community organizations. ASAP serves as the single statewide council on substance abuse prevention, enforcement, and treatment. It is ASAP’s mission to ensure community driven, agency supported outcomes to prevent and reduce the negative impacts of alcohol, tobacco and other drugs by building and sustaining partnerships between prevention, treatment, and enforcement. Through coordination among its members and their agencies and organizations ASAP strives to ensure that substance abuse funding is spent in the most efficient and efficacious manner. ASAP has identified four strategic focus areas for 2008: 1) child welfare and substance abuse; 2) law enforcement and drug trafficking; 3) emerging trends and the state’s capacity to respond; and 4) data-driven decisions and policy development. There are currently six sub-committees that assist ASAP in meeting their goals:
• Arizona Underage Drinking Committee - The purpose of this subcommittee is to develop a statewide underage drinking initiative to prevent and reduce underage drinking in Arizona. Their activities include state-level infrastructure change to improve cross coordination/collaboration between state agencies; developing a comprehensive statewide prevention system focused on preventing underage drinking; and collaborative projects to more effectively utilize resources and support local efforts.
• Substance Abuse Epidemiology Work Group – The purpose of this work group is to continuously evaluate data related to substance abuse to move the state system through a data-driven process. This is achieved through the completion of a statewide Substance Abuse Epidemiology Profile. This profile will be updated every two years, with specific analyses completed each year.
• Emerging Issues Sub-Committee of the Substance Abuse Epidemiology Work Group – The purpose of this sub-committee is to provide understanding of emerging substance abuse consumption and consequence trends in Arizona to state agencies, Boards, Commissions and Committees, and ASAP and its sub-committees.
• Methamphetamine Task Force – The purpose of this task force is to bring together representatives from state agencies, local government, businesses, and community groups to develop collaborative efforts among treatment, prevention, and law enforcement systems to assess and address the impact of methamphetamine statewide through information sharing, resource allocation, service coordination, and the development of statewide policy recommendations sensitive to the needs of local and tribal communities.
• Co-Occurring Policy Advisory Team – The Co-Occurring Policy Advisory Team serves as the advisory body and policy-making entity for the Arizona Co-Occurring State Incentive Grant. Team members represent a number of state agencies and community-based organizations.
• Workforce Development Committee – This committee was formed specifically to identify and address substance abuse prevention training and technical assistance needs across Arizona. This will, in turn, help strengthen instruction for prevention professionals and volunteers in community coalitions.

7
There are five types of charts presented in this report: 1) substance use, 2) antisocial behavior and youth gambling, 3) risk factors, 4) protective factors, and 5) where youth obtained alcohol. When available, data from the 2004 and 2006 administrations will be included in the charts. The actual percentages from the charts are presented in tables at the end of this report. Substance Use Charts This report contains information about alcohol, tobacco, and other drug use (referred to as ATOD use throughout this report) and other problem behaviors of students. The bars on each chart represent the percentage of students in that grade who reported the behavior. The three sections in the charts represent different types of problem behaviors. The definitions of each of the types of behavior are provided below. • Lifetime use is a measure of the percentage of
students who tried the particular substance at least once in their lifetime and is used to show the percentage of students who have had experience with a particular substance.
• 30-day use is a measure of the percentage of
students who used the substance at least once in the 30 days prior to taking the survey and is a more sensitive indicator of the level of current use of the substance.
• Heavy use includes binge drinking (having five
or more drinks in a row during the two weeks prior to the survey) and use of one-half a pack or more of cigarettes per day.
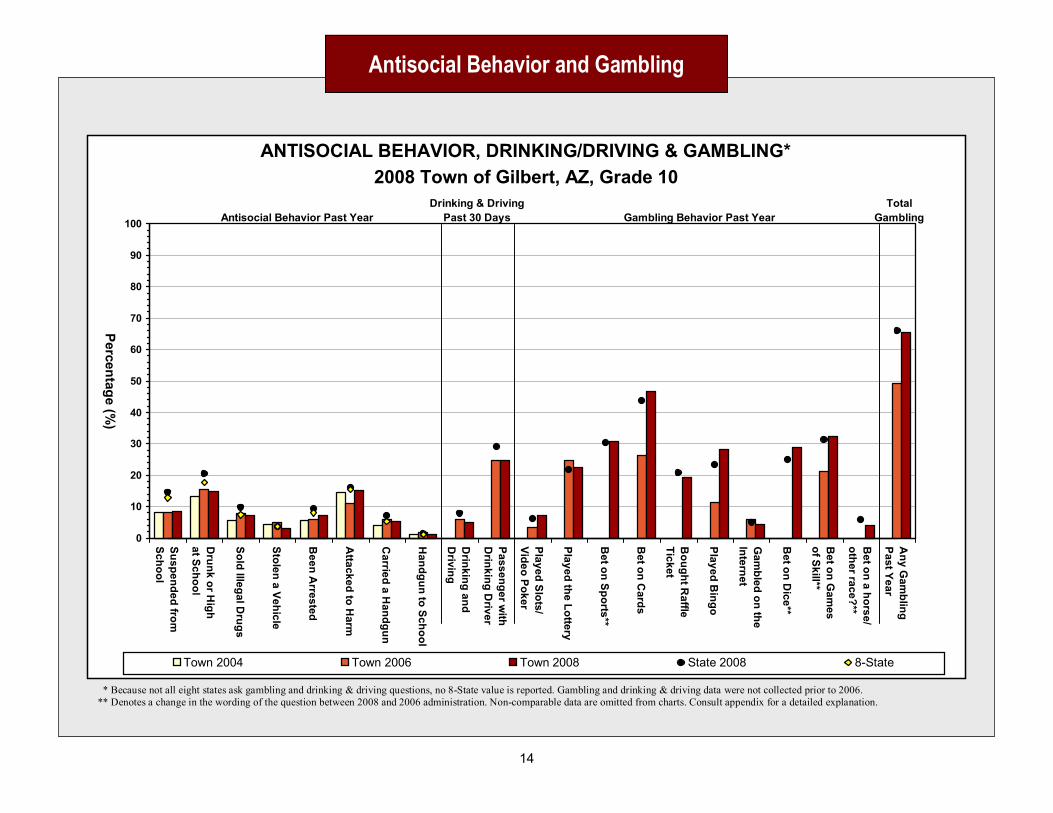
Antisocial Behavior and Gambling Charts • Antisocial behavior (ASB) is a measure of
the percentage of students who report any involvement during the past year with eight antisocial behaviors: suspended from school, drunk or high at school, sold illegal drugs, stolen a vehicle, been arrested, attacked someone to harm them, carried a handgun, taken a handgun to school. The chart also displays any incidents in the past 30 days of drinking and driving or riding in a car with a drinking driver.
How to Read the Charts in this Report
• Gambling behavior charts show the percentage of students who engaged in each of the 10 types of gambling “for money, possessions, or anything of value” during the past year: played gambling machines, played the lottery, bet on sports, played cards, bought a raffle ticket, played bingo, gambled on the internet, bet on a dice game, bet on a game of personal skill and bet on horse or animal races. The chart also shows the percentage of students who engaged in any gambling behavior during the past year.
Risk and Protective Factor Charts
The risk and protective factor charts show the percentage of students at high risk and with high protection for each of the risk and protective factor scales. The risk and protective factor scales measure specific aspects of youths’ life experiences that are predictive of whether they will engage in problem behaviors. A definition of each risk and protective factor scale is contained in Table 2. The factors are grouped into four domains: community, family, school, and peer/individual. The bars on the risk and protective factor charts, represent the percentage of students whose answers reflect significant risk or protection. There are bars for the last three administrations of the AYS: 2004, 2006, and 2008. By looking at the percentage of youth at risk and with protection over time, it is possible to determine whether the percentage of students at risk or with protection is increasing, decreasing, or staying the same. This information is important when deciding which risk and protective factors warrant attention and when assessing risk reduction and protective factor enhancement efforts. Where Youth Obtained Alcohol Charts
This chart displays data regarding the ways that students obtained alcohol in the past 30 days. The data focus on a subgroup of students who indicated at least one means of obtaining alcohol. (Students reporting no alcohol use are not represented.) It is important to note that the charts represent a subgroup of users and not the entire survey population. Additionally, the smaller the sample, the more dramatic the influence of a student's responses. For example, if only one student in a particular grade reported where he/she obtained alcohol, each category would show up as either 0% or 100%. The chart legend indicates the sample size for each grade surveyed to help clarify the value of the data.

8
School Safety Charts
The school safety profile charts contain the percentages of students who felt unsafe at school or on the way to school, were threatened or injured with a weapon at school, were in a physical fight at school, carried a weapon to school or were picked on or bullied at school. The complete questions and values for each response option can be seen in Table 11. Dots and Diamonds
The dots on the charts represent the percentage of all of the youth surveyed across Arizona who reported substance use, problem behavior, elevated risk, or elevated protection. The diamonds represent national data from either the Monitoring the Future Survey or the 8-State Norm (described below). A comparison to the state-wide and national results provides additional information for your community in determining the relative significance of levels of ATOD use, antisocial behavior, risk, and protection. Information about other students in the state and the nation can be helpful in determining the seriousness of a given level of problem behavior. The 8-State Norm
The diamonds on the charts allow a comparison between the levels of risk and protection in your
community and a more national sample. The 8-State Norm value for each risk and protective factor scale represents the percentage of youth at risk or with protection for eight states across the country (Arizona, Arkansas, Louisiana, Michigan, Montana, Nebraska, Oklahoma and Utah). In developing the 8-State Norm, the contribution of each of eight states was proportional to its percentage of the national population, which helps to make the results more representative of youth nation-wide. A comparison between the ATOD use rates from the 8-State norm and those from the national Monitoring the Future Survey showed the rates to be very similar, which provides added confidence in the validity of the 8-State Norm. Brief definitions of the risk and protective factors scales are provided in Table 2 following the profile charts. For more information about risk and protective factors, please refer to the resources listed on the last page of this report under Contacts for Prevention. Drug Free Communities Reports
Table 12 contains the information that is reported by communities with Drug Free Communities Grants, such as the perception of the risk of ATOD use, perception of parent and peer disapproval of ATOD use, past 30-day use, and average age of first use.
How to Read the Charts in this Report (cont’d)
No Child Left Behind The Safe and Drug-Free Schools and Communities section of the No Child Left Behind Act (NCLB) requires that schools and communities use six Principles of Effectiveness to guide their decisions and spending on federally funded prevention and intervention programs. First introduced in 1998 by the Department of Education, the Principles of Effectiveness outline a data-driven process for ensuring that prevention programs achieve the desired results. The Principles of Effectiveness stipulate that local prevention programs and activities must:
1. be based on a needs assessment using objective data regarding the incidence of drug use and violence, 2. target specific performance objectives, 3. be based on scientific research and be proven to reduce violence or drug use, 4. be based on the analysis of predictor variables such as risk and protective factors, 5. include meaningful and ongoing parental input in program implementation, and 6. have periodic evaluations of established performance measures.
The results of the AYS presented in this report can help your school and community comply with the NCLB Act. The Substance Use and Antisocial Behavior charts provide information related to Principle 1 and the Risk and Protective Factor charts provide information related to Principle 4. Overall, using the risk and protective factor framework helps schools meet all of the Principles of Effectiveness, and thereby assists schools in complying with the NCLB Act.
Practical Implications of the Assessment

9
What are the numbers telling you? Review the charts and data tables presented in this report. Using the table below, note your findings as you discuss the following questions. • Which 3-5 risk factors are of the greatest concern? • Which 3-5 protective factors are your community’s highest priority? • Which levels of 30-day drug use are of greatest concern?
º Which substances are your students using the most? º At which grades do you see unacceptable usage levels?
• Which levels of antisocial behaviors are of greatest concern? º Which behaviors are your students exhibiting the most? º At which grades do you see unacceptable behavior levels?
How to decide if a rate is “unacceptable.” • Look across the charts – which items stand out as either much
higher or much lower than the others? • Compare your data with statewide and national data –
differences of five percent between local and other data are probably significant.
Use these data for program and policy development. • Substance use and antisocial behavior data – identify issues, raise
awareness about the problems, and promote school and community dialogue.
• Risk and protective factor data – identify key objectives that will help your school or community achieve its prevention goals.
Use the resources listed on the last page of this report, Contacts for Prevention, for ideas about prevention programs that have proven effective in addressing the risk factors that are high in your community and improving the protective factors that are low.
Why Conduct the Arizona Youth Survey? Data from the Arizona Youth Survey can be used to help schools and communities assess current conditions and identify and prioritize local prevention issues. Each risk and protective factor can be linked to specific types of interventions that have been shown to be effective in either reducing risk(s) or enhancing protection(s). The steps outlined here will help your municipality make key decisions regarding allocation of resources, how and when to address specific needs, and which strategies are most effective and known to produce results.
School and Community Improvement Using Survey Data
MEASURE Unacceptable Rate #1
Unacceptable Rate #2
Unacceptable Rate #3
Unacceptable Rate #4
Risk FactorsProtective Factors
Substance UseAntisocial Behaviors
Assessment and Planning

10
** Substance categories that were not measured and reported in one or more survey administrations prior to 2008. ** Denotes a change in the wording of the question between 2008 and prior administrations. Non-comparable data are omitted from charts. Consult appendix for a detailed explanation. † No equivalent category for these substances in the Monitoring the Future survey.
Substance Use
LIFETIME, 30 DAY & HEAVY ATOD USE
Alcohol
Cigarettes
Chew
ing Tobacco
Marijuana
Hallucinogens**
Cocaine
Inhalants
Metham
phetamines**
Heroin or O
ther O
piates
Ecstasy**
Steroids
Prescription Pain R
elievers*†
Prescription Stim
ulants**
Prescription Sedatives**†
Prescription D
rugs**†
Alcohol
Cigarettes
Chew
ing Tobacco
Marijuana
Hallucinogens**
Cocaine
Inhalants
Metham
phetamines**
Heroin or O
ther O
piates
Ecstasy**
Steroids
Prescription Pain R
elievers*†
Prescription Stim
ulants**
Prescription Sedatives**†
Prescription D
rugs**†
Over-the-C
ounter D
rugs*†
Binge D
rinking
1/2 Pack (or More)
Cigarettes/D
ay
Over-the-C
ounter D
rugs*†0
10
20
30
40
50
60
70
80
90
100
Percentage (%)
Town 2004 Town 2006 Town 2008 State 2008 MTF
2008 Town of Gilbert, AZ, Grade 8Lifetime Use Heavy Use30-Day Use

11
LIFETIME, 30 DAY & HEAVY ATOD USE
Alcohol
Cigarettes
Chew
ing Tobacco
Marijuana
Hallucinogens**
Cocaine
Inhalants
Metham
phetamines**
Heroin or O
ther O
piates
Ecstasy**
Steroids
Prescription Pain R
elievers*†
Prescription Stim
ulants**
Prescription Sedatives**†
Prescription D
rugs**†
Alcohol
Cigarettes
Chew
ing Tobacco
Marijuana
Hallucinogens**
Cocaine
Inhalants
Metham
phetamines**
Heroin or O
ther O
piates
Ecstasy**
Steroids
Prescription Pain R
elievers*†
Prescription Stim
ulants**
Prescription Sedatives**†
Prescription D
rugs**†
Over-the-C
ounter D
rugs*†
Binge D
rinking
1/2 Pack (or More)
Cigarettes/D
ay
Over-the-C
ounter D
rugs*†0
10
20
30
40
50
60
70
80
90
100
Percentage (%)
Town 2004 Town 2006 Town 2008 State 2008 MTF
2008 Town of Gilbert, AZ, Grade 10Lifetime Use Heavy Use30-Day Use
** Substance categories that were not measured and reported in one or more survey administrations prior to 2008. ** Denotes a change in the wording of the question between 2008 and prior administrations. Non-comparable data are omitted from charts. Consult appendix for a detailed explanation. † No equivalent category for these substances in the Monitoring the Future survey.
Substance Use

12
LIFETIME, 30 DAY & HEAVY ATOD USE
Alcohol
Cigarettes
Chew
ing Tobacco
Marijuana
Hallucinogens**
Cocaine
Inhalants
Metham
phetamines**
Heroin or O
ther O
piates
Ecstasy**
Steroids
Prescription Pain R
elievers*†
Prescription Stim
ulants**
Prescription Sedatives**†
Prescription D
rugs**†
Alcohol
Cigarettes
Chew
ing Tobacco
Marijuana
Hallucinogens**
Cocaine
Inhalants
Metham
phetamines**
Heroin or O
ther O
piates
Ecstasy**
Steroids
Prescription Pain R
elievers*†
Prescription Stim
ulants**
Prescription Sedatives**†
Prescription D
rugs**†
Over-the-C
ounter D
rugs*†
Binge D
rinking
1/2 Pack (or More)
Cigarettes/D
ay
Over-the-C
ounter D
rugs*†0
10
20
30
40
50
60
70
80
90
100
Percentage (%)
Town 2004 Town 2006 Town 2008 State 2008 MTF
2008 Town of Gilbert, AZ, Grade 12Lifetime Use Heavy Use30-Day Use
** Substance categories that were not measured and reported in one or more survey administrations prior to 2008. ** Denotes a change in the wording of the question between 2008 and prior administrations. Non-comparable data are omitted from charts. Consult appendix for a detailed explanation. † No equivalent category for these substances in the Monitoring the Future survey.
Substance Use

13
Antisocial Behavior and Gambling
ANTISOCIAL BEHAVIOR, DRINKING/DRIVING & GAMBLING*
Suspended from
School
Drunk or H
igh at School
Sold Illegal Drugs
Stolen a Vehicle
Been A
rrested
Attacked to H
arm
Carried a H
andgun
Handgun to School
Drinking and
Driving
Passenger with
Drinking D
river
Played Slots/Video Poker
Played the Lottery
Bet on Sports**
Bet on C
ards
Bought R
affle Ticket
Played Bingo
Gam
bled on the lnternet
Bet on D
ice**
Bet on G
ames
of Skill**
Bet on a horse/
other race?**
Any G
ambling
Past Year
0
10
20
30
40
50
60
70
80
90
100
Percentage (%)
Town 2004 Town 2006 Town 2008 State 2008 8-State
2008 Town of Gilbert, AZ, Grade 8
Antisocial Behavior Past Year Gambling Behavior Past YearTotal
GamblingDrinking & Driving
Past 30 Days
** Because not all eight states ask gambling and drinking & driving questions, no 8-State value is reported. Gambling and drinking & driving data were not collected prior to 2006. ** Denotes a change in the wording of the question between 2008 and 2006 administration. Non-comparable data are omitted from charts. Consult appendix for a detailed explanation.
14
Antisocial Behavior and Gambling
ANTISOCIAL BEHAVIOR, DRINKING/DRIVING & GAMBLING*
Suspended from
School
Drunk or H
igh at School
Sold Illegal Drugs
Stolen a Vehicle
Been A
rrested
Attacked to H
arm
Carried a H
andgun
Handgun to School
Drinking and
Driving
Passenger with
Drinking D
river
Played Slots/Video Poker
Played the Lottery
Bet on Sports**
Bet on C
ards
Bought R
affle Ticket
Played Bingo
Gam
bled on the lnternet
Bet on D
ice**
Bet on G
ames
of Skill**
Bet on a horse/
other race?**
Any G
ambling
Past Year
0
10
20
30
40
50
60
70
80
90
100
Percentage (%)
Town 2004 Town 2006 Town 2008 State 2008 8-State
2008 Town of Gilbert, AZ, Grade 10
Antisocial Behavior Past Year Gambling Behavior Past YearTotal
GamblingDrinking & Driving
Past 30 Days
** Because not all eight states ask gambling and drinking & driving questions, no 8-State value is reported. Gambling and drinking & driving data were not collected prior to 2006. ** Denotes a change in the wording of the question between 2008 and 2006 administration. Non-comparable data are omitted from charts. Consult appendix for a detailed explanation.

15
Antisocial Behavior and Gambling
ANTISOCIAL BEHAVIOR, DRINKING/DRIVING & GAMBLING*
Suspended from
School
Drunk or H
igh at School
Sold Illegal Drugs
Stolen a Vehicle
Been A
rrested
Attacked to H
arm
Carried a H
andgun
Handgun to School
Drinking and
Driving
Passenger with
Drinking D
river
Played Slots/Video Poker
Played the Lottery
Bet on Sports**
Bet on C
ards
Bought R
affle Ticket
Played Bingo
Gam
bled on the lnternet
Bet on D
ice**
Bet on G
ames
of Skill**
Bet on a horse/
other race?**
Any G
ambling
Past Year
0
10
20
30
40
50
60
70
80
90
100
Percentage (%)
Town 2004 Town 2006 Town 2008 State 2008 8-State
2008 Town of Gilbert, AZ, Grade 12
Antisocial Behavior Past Year Gambling Behavior Past YearTotal
GamblingDrinking & Driving
Past 30 Days
** Because not all eight states ask gambling and drinking & driving questions, no 8-State value is reported. Gambling and drinking & driving data were not collected prior to 2006. ** Denotes a change in the wording of the question between 2008 and 2006 administration. Non-comparable data are omitted from charts. Consult appendix for a detailed explanation.

16
RISK PROFILE
Low N
eighborhood A
ttachment
Laws &
Norm
s Favor D
rug Use
Perceived Availability
of Drugs
Perceived Availability
of Handguns
Poor Family
Managem
ent
Family C
onflict
Family H
istory of A
ntisocial Behavior
Parent Attitudes
Favorable to ASB
Parent Attitudes
Favor Drug U
se
Academ
ic Failure
Low C
omm
itment
to School
Rebelliousness
Early Initiation of A
SB
Early Initiation of D
rug Use
Attitudes Favorable
to ASB
Attitudes Favorable
to Drug U
se
Perceived Risk
of Drug U
se
Interaction with
Antisocial Peers
Friend's Use of D
rugs
Rew
ards for ASB
Gang Involvem
ent
Students at High R
isk*
0
10
20
30
40
50
60
70
80
90
100
Percentage (%) of youth at risk
Town 2004 Town 2006 Town 2008 State 2008 8-State
2008 Town of Gilbert, AZ, Grade 8Community SchoolFamily Peer / Individual Total
* High Risk youth are defined as the percentage of students who have more than a specified number of risk factors operating in their lives. (8th grade: eight or more risk factors, 10th & 12th grades: nine or more risk factors.)
Risk and Protective Factor Profiles

17
PROTECTIVE PROFILE
Opportunities
for Prosocial Involvem
ent
Rew
ards for Prosocial Involvem
ent
Family
Attachm
ent
Opportunities
for Prosocial Involvem
ent
Rew
ards for Prosocial Involvem
ent
Opportunities
for Prosocial Involvem
ent
Rew
ards for Prosocial Involvem
ent
Belief in the
Moral O
rder
Interaction with
Prosocial Peers**
Prosocial Involvem
ent
Rew
ards for Prosocial Involvem
ent
Students with
High Protection*
0
10
20
30
40
50
60
70
80
90
100
Percentage (%) of youth w
ith protection
Town 2004 Town 2006 Town 2008 State 2008 8-State
2008 Town of Gilbert, AZ, Grade 8Community SchoolFamily Peer / Individual Total
Risk and Protective Factor Profiles
** High Protection youth are defined as the percentage of students who have five or more protective factors operating in their lives. ** Denotes a change in the wording of the question between 2008 and prior administrations. Consult appendix for a detailed explanation.

18
RISK PROFILE
Low N
eighborhood A
ttachment
Laws &
Norm
s Favor D
rug Use
Perceived Availability
of Drugs
Perceived Availability
of Handguns
Poor Family
Managem
ent
Family C
onflict
Family H
istory of A
ntisocial Behavior
Parent Attitudes
Favorable to ASB
Parent Attitudes
Favor Drug U
se
Academ
ic Failure
Low C
omm
itment
to School
Rebelliousness
Early Initiation of A
SB
Early Initiation of D
rug Use
Attitudes Favorable
to ASB
Attitudes Favorable
to Drug U
se
Perceived Risk
of Drug U
se
Interaction with
Antisocial Peers
Friend's Use of D
rugs
Rew
ards for ASB
Gang Involvem
ent
Students at High R
isk*
0
10
20
30
40
50
60
70
80
90
100
Percentage (%) of youth at risk
Town 2004 Town 2006 Town 2008 State 2008 8-State
2008 Town of Gilbert, AZ, Grade 10Community SchoolFamily Peer / Individual Total
* High Risk youth are defined as the percentage of students who have more than a specified number of risk factors operating in their lives. (8th grade: eight or more risk factors, 10th & 12th grades: nine or more risk factors.)
Risk and Protective Factor Profiles

19
PROTECTIVE PROFILE
Opportunities
for Prosocial Involvem
ent
Rew
ards for Prosocial Involvem
ent
Family
Attachm
ent
Opportunities
for Prosocial Involvem
ent
Rew
ards for Prosocial Involvem
ent
Opportunities
for Prosocial Involvem
ent
Rew
ards for Prosocial Involvem
ent
Belief in the
Moral O
rder
Interaction with
Prosocial Peers**
Prosocial Involvem
ent
Rew
ards for Prosocial Involvem
ent
Students with
High Protection*
0
10
20
30
40
50
60
70
80
90
100
Percentage (%) of youth w
ith protection
Town 2004 Town 2006 Town 2008 State 2008 8-State
2008 Town of Gilbert, AZ, Grade 10Community SchoolFamily Peer / Individual Total
** High Protection youth are defined as the percentage of students who have five or more protective factors operating in their lives. ** Denotes a change in the wording of the question between 2008 and prior administrations. Consult appendix for a detailed explanation.
Risk and Protective Factor Profiles

20
RISK PROFILE
Low N
eighborhood A
ttachment
Laws &
Norm
s Favor D
rug Use
Perceived Availability
of Drugs
Perceived Availability
of Handguns
Poor Family
Managem
ent
Family C
onflict
Family H
istory of A
ntisocial Behavior
Parent Attitudes
Favorable to ASB
Parent Attitudes
Favor Drug U
se
Academ
ic Failure
Low C
omm
itment
to School
Rebelliousness
Early Initiation of A
SB
Early Initiation of D
rug Use
Attitudes Favorable
to ASB
Attitudes Favorable
to Drug U
se
Perceived Risk
of Drug U
se
Interaction with
Antisocial Peers
Friend's Use of D
rugs
Rew
ards for ASB
Gang Involvem
ent
Students at High R
isk*
0
10
20
30
40
50
60
70
80
90
100
Percentage (%) of youth at risk
Town 2004 Town 2006 Town 2008 State 2008 8-State
2008 Town of Gilbert, AZ, Grade 12Community SchoolFamily Peer / Individual Total
* High Risk youth are defined as the percentage of students who have more than a specified number of risk factors operating in their lives. (8th grade: eight or more risk factors, 10th & 12th grades: nine or more risk factors.)
Risk and Protective Factor Profiles

21
PROTECTIVE PROFILE
Opportunities
for Prosocial Involvem
ent
Rew
ards for Prosocial Involvem
ent
Family
Attachm
ent
Opportunities
for Prosocial Involvem
ent
Rew
ards for Prosocial Involvem
ent
Opportunities
for Prosocial Involvem
ent
Rew
ards for Prosocial Involvem
ent
Belief in the
Moral O
rder
Interaction with
Prosocial Peers**
Prosocial Involvem
ent
Rew
ards for Prosocial Involvem
ent
Students with
High Protection*
0
10
20
30
40
50
60
70
80
90
100
Percentage (%) of youth w
ith protection
Town 2004 Town 2006 Town 2008 State 2008 8-State
2008 Town of Gilbert, AZ, Grade 12Community SchoolFamily Peer / Individual Total
** High Protection youth are defined as the percentage of students who have five or more protective factors operating in their lives. ** Denotes a change in the wording of the question between 2008 and prior administrations. Consult appendix for a detailed explanation.
Risk and Protective Factor Profiles

22
* Prior to 2008, the AYS did not survey where youth obtained alcohol. Also, because not all eight states ask where youth obtained alcohol, no 8-State value is reported. ** Sample size represents the number of students who indicated at least one means of obtaining alcohol. (Students reporting no alcohol use are not represented.) In the case of smaller sample sizes, caution should be exercised before generalizing results to the entire community.
Where Youth Obtained Alcohol
WHERE YOUTH OBTAINED ALCOHOL*
0
10
20
30
40
50
60
70
80
90
100
a storeB
ought it in
bar or clubat a restaurant,B
ought it
public eventB
ought it at a
money to buy it
Gave som
eone else
Parent or guardian
mem
ber, 21+A
nother family
related, 21+Som
eone not
21 yearsSom
eone under
Got at a party
Took it from hom
e
else's home
store or someone
Took it from a
other way
Got it som
e
Percentages (%)
Town 2008, Grade 8Sample: 174 students**
Town 2008, Grade 10Sample: 347 students**
Town 2008, Grade 12Sample: 300 students**
State 2008
2008 Town of Gilbert, AZ Student Survey, Grades 8, 10 & 12 If during the past 30 days you drank alcohol, how did you get it?
(Mark all that apply)

23
SCHOOL SAFETY PROFILE*
Carried a W
eapon on School Property
Threatened or Injured on School Property
In a Physical Fight on School Property
Picked On or
Bullied on
School Property**
Felt Unsafe
at School
0
10
20
30
40
50
60
70
Percent (%) of Students
Town 2004 Town 2006 Town 2008 State 2008
2008 Town of Gilbert, AZ, Grade 8Percentage of students reporting any experiencewith the indicated safety issue in the past year
School Safety
** Because not all eight states ask school safety questions, no 8-State value is reported. ** Bullying on school property was not measured in the 2004 survey administration.

24
SCHOOL SAFETY PROFILE*
Carried a W
eapon on School Property
Threatened or Injured on School Property
In a Physical Fight on School Property
Picked On or
Bullied on
School Property**
Felt Unsafe
at School
0
10
20
30
40
50
60
70
Percent (%) of Students
Town 2004 Town 2006 Town 2008 State 2008
2008 Town of Gilbert, AZ, Grade 10Percentage of students reporting any experiencewith the indicated safety issue in the past year
School Safety
** Because not all eight states ask school safety questions, no 8-State value is reported. ** Bullying on school property was not measured in the 2004 survey administration.

25
SCHOOL SAFETY PROFILE*
Carried a W
eapon on School Property
Threatened or Injured on School Property
In a Physical Fight on School Property
Picked On or
Bullied on
School Property**
Felt Unsafe
at School
0
10
20
30
40
50
60
70
Percent (%) of Students
Town 2004 Town 2006 Town 2008 State 2008
2008 Town of Gilbert, AZ, Grade 12Percentage of students reporting any experiencewith the indicated safety issue in the past year
School Safety
** Because not all eight states ask school safety questions, no 8-State value is reported. ** Bullying on school property was not measured in the 2004 survey administration.

26
Risk and Protective Scale Definitions
Low Neighborhood Attachment Low neighborhood bonding is related to higher levels of juvenile crime and drug selling.
Laws and Norms Favorable Toward Drug Use
Research has shown that legal restrictions on alcohol and tobacco use, such as raising the legal drinking age, restricting smoking in public places, and increased taxation have been followed by decreases in consumption. Moreover, national surveys of high school seniors have shown that shifts in normative attitudes toward drug use have preceded changes in prevalence of use.
Perceived Availability of Drugs and Handguns
The availability of cigarettes, alcohol, marijuana, and other illegal drugs has been related to the use of these substances by adolescents. The availability of handguns is also related to a higher risk of crime and substance use by adolescents.
Opportunities for Prosocial Involvement
When opportunities are available in a community for positive participation, children are less likely to engage in substance use and other problem behaviors.
Rewards for Prosocial Involvement
Rewards for positive participation in activities helps youth bond to the community, thus lowering their risk for substance use.
Poor Family Management Parents’ use of inconsistent and/or unusually harsh or severe punishment with their children places them at higher risk for substance use and other problem behaviors. Also, parents’ failure to provide clear expectations and to monitor their children’s behavior makes it more likely that they will engage in drug abuse whether or not there are family drug problems.
Family Conflict Children raised in families high in conflict, whether or not the child is directly involved in the conflict, appear at risk for both delinquency and drug use.
Family History of Antisocial Behavior
When children are raised in a family with a history of problem behaviors (e.g., violence or ATOD use), the children are more likely to engage in these behaviors.
Parental Attitudes Favorable Toward Antisocial Behavior & Drugs
In families where parents use illegal drugs, are heavy users of alcohol, or are tolerant of children’s use, children are more likely to become drug abusers during adolescence. The risk is further increased if parents involve children in their own drug (or alcohol) using behavior, for example, asking the child to light the parent’s cigarette or get the parent a beer from the refrigerator.
Family Attachment Young people who feel that they are a valued part of their family are less likely to engage in substance use and other problem behaviors.
Opportunities for Prosocial Involvement
Young people who are exposed to more opportunities to participate meaningfully in the responsibilities and activities of the family are less likely to engage in drug use and other problem behaviors.
Rewards for Prosocial Involvement
When parents, siblings, and other family members praise, encourage, and attend to things done well by their child, children are less likely to engage in substance use and problem behaviors.
Academic Failure Beginning in the late elementary grades (grades 4-6) academic failure increases the risk of both drug abuse and delinquency. It appears that the experience of failure itself, for whatever reasons, increases the risk of problem behaviors.
Low Commitment to School Surveys of high school seniors have shown that the use of drugs is significantly lower among students who expect to attend college than among those who do not. Factors such as liking school, spending time on homework, and perceiving the coursework as relevant are also negatively related to drug use.
Table 2. Scales that Measure the Risk and Protective Factors Shown in the Profiles
Community Domain Protective Factors
Family Domain Risk Factors
Family Domain Protective Factors
Community Domain Risk Factors
School Domain Risk Factors

27
Risk and Protective Scale Definitions
Opportunities for Prosocial Involvement
When young people are given more opportunities to participate meaningfully in important activities at school, they are less likely to engage in drug use and other problem behaviors.
Rewards for Prosocial Involvement
When young people are recognized and rewarded for their contributions at school, they are less likely to be involved in substance use and other problem behaviors.
Rebelliousness Young people who do not feel part of society, are not bound by rules, don’t believe in trying to be successful or responsible, or who take an active rebellious stance toward society, are at higher risk of abusing drugs. In addition, high tolerance for deviance, a strong need for independence and normlessness have all been linked with drug use.
Early Initiation of Antisocial Behavior and Drug Use
Early onset of drug use predicts the misuse of drugs. The earlier the onset of any drug use, the greater the involvement in other drug use and the greater frequency of use. Onset of drug use prior to the age of 15 is a consistent predictor of drug abuse, and a later age of onset of drug use has been shown to predict lower drug involvement and a greater probability of discontinuation of use.
Attitudes Favorable Toward Antisocial Behavior and Drug Use
During the elementary school years, most children express anti-drug, anti-crime, and pro-social attitudes and have difficulty imagining why people use drugs or engage in antisocial behaviors. However, in middle school, as more youth are exposed to others who use drugs and engage in antisocial behavior, their attitudes often shift toward greater acceptance of these behaviors. Youth who express positive attitudes toward drug use and antisocial behavior are more likely to engage in a variety of problem behaviors, including drug use.
Perceived Risk of Drug Use Young people who do not perceive drug use to be risky are far more likely to engage in drug use.
Interaction with Antisocial Peers Young people who associate with peers who engage in problem behaviors are at higher risk for engaging in antisocial behavior themselves.
Friends' Use of Drugs Young people who associate with peers who engage in alcohol or substance abuse are much more likely to engage in the same behavior. Peer drug use has consistently been found to be among the strongest predictors of substance use among youth. Even when young people come from well-managed families and do not experience other risk factors, spending time with friends who use drugs greatly increases the risk of that problem developing.
Rewards for Antisocial Behavior Young people who receive rewards for their antisocial behavior are at higher risk for engaging further in antisocial behavior and substance use.
Gang Involvement Youth who belong to gangs are more at risk for antisocial behavior and drug use.
Belief in the Moral Order Young people who have a belief in what is “right” or “wrong” are less likely to use drugs.
Interaction with Prosocial Peers Young people who associate with peers who engage in prosocial behavior are more protected from engaging in antisocial behavior and substance use.
Prosocial Involvement Participation in positive school and community activities helps provide protection for youth.
Rewards for Prosocial Involvement
Young people who are rewarded for working hard in school and the community are less likely to engage in problem behavior.
Table 2. Scales that Measure the Risk and Protective Factors Shown in the Profiles (cont'd)
School Domain Protective Factors
Peer-Individual Protective Factors
Peer-Individual Risk Factors

28
Data Tables
Table 3. Percentage of Students Who Used ATODs During Their Lifetime
Town2004
Town2006
Town2008
State2008
Town2004
Town2006
Town2008
State2008
Town2004
Town2006
Town2008
State2008
Alcohol had alcoholic beverages (beer, wine or hard liquor) to drink - more than just a few sips? 41.9 45.2 37.7 47.8 60.2 60.4 58.6 66.2 61.4 66.5 67.2 74.8
Cigarettes smoked cigarettes? 21.1 23.2 18.1 25.9 34.9 35.0 33.8 39.9 36.5 43.7 42.0 50.8
Chewing Tobacco used smokeless tobacco (chew, snuff, plug, dipping tobacco, chewing tobacco)? 4.3 7.1 5.5 7.1 9.5 12.0 11.4 12.9 12.4 14.8 13.6 17.7
Marijuana used marijuana? 10.6 11.0 7.7 16.2 26.1 23.6 26.0 32.5 31.0 35.5 35.8 43.1
Hallucinogens** used LSD or other hallucinogens? 1.5 2.1 2.1 1.9 4.3 4.0 4.2 5.2 3.9 5.0 5.7 7.9
Cocaine used cocaine or crack? 2.1 2.1 1.8 2.7 4.4 7.3 4.7 6.8 5.1 8.7 7.3 11.2
Inhalantssniffed glue, breathed the contents of an aerosol spray can, or inhaled other gases or sprays, in order to get high?
10.3 15.9 12.0 14.3 9.2 13.9 16.0 12.6 7.8 10.1 6.2 9.2
Methamphetamines** used methamphetamines (meth, crystal, crank)? n/a 2.5 0.9 1.2 n/a 5.4 1.3 2.4 n/a 4.6 2.8 4.0
Heroin or Other Opiates used heroin or other opiates? 1.2 1.2 1.1 1.0 2.4 4.0 2.5 2.0 1.8 4.0 3.5 3.1
Ecstasy** used Ecstasy (‘X’, ‘E’, or MDMA)? 1.5 0.9 1.2 2.2 3.0 3.1 4.1 4.9 4.2 4.7 5.6 7.0
Steroidsused steroids or anabolic steroids (suchas Anadrol, Oxandrin, Durabolin, Equipoise or Depotesterone)?
n/a 2.2 1.7 1.7 n/a 3.1 2.7 2.3 n/a 3.2 2.6 2.4
Prescription Pain Relievers*
used prescription pain relievers (suchas Vicodin, OxyContin, Percocet or Codeine) without a doctor telling you to take them?
n/a n/a 9.2 12.2 n/a n/a 19.8 20.5 n/a n/a 19.5 24.6
Stimulants (2004 only)**
used stimulants (“amphetamines”, “meth”, “crystal”, “crank”) without a doctor telling you to take them? 2.2 n/a n/a n/a 5.1 n/a n/a n/a 4.4 n/a n/a n/a
Prescription Stimulants**
used prescription stimulants (such as Ritalin, Adderall, or Dexedrine) without a doctor telling you to take them? n/a 2.7 3.8 3.8 n/a 7.9 8.5 7.6 n/a 8.4 7.7 7.9
Prescription Sedatives**
used prescription sedatives (tranquilizers, such as Valium or Xanax, barbiturates, or sleeping pills)? 8.1 9.7 7.0 8.3 15.6 15.0 12.4 12.0 18.5 17.3 11.3 13.2
Prescription Drugs** combined results of 2008 prescription stimulant, sedative and pain reliever questions (see appendix for details)
n/a 13.8 13.4 17.1 n/a 22.1 25.2 25.7 n/a 22.6 24.0 28.7
Over-the-Counter Drugs*
used over-the-counter drugs (suchas cough syrup, cold medicine, or dietpills) for the purposes of getting high?
n/a n/a 8.0 9.7 n/a n/a 12.8 12.9 n/a n/a 11.9 13.4
Grade 8 Grade 10
* Substance categories that were not measured and reported in one or more survey administrations prior to 2008 (also denoted by 'n/a' in the data column).** Denotes a change in the wording of the question between 2008 and prior administrations. Consult appendix for a detailed explanation.
In your lifetime, on how many occasions (if any) have you: (One or more occasions)
Grade 12

29
Data Tables
Table 4. Percentage of Students Who Used ATODs During the Past 30 Days
Town2004
Town2006
Town2008
State2008
Town2004
Town2006
Town2008
State2008
Town2004
Town2006
Town2008
State2008
Alcohol had alcoholic beverages (beer, wine or hard liquor) to drink - more than just a few sips? 19.3 20.4 15.5 23.2 35.3 33.5 33.3 37.7 40.7 42.3 38.3 46.8
Cigarettes smoked cigarettes? 7.1 7.9 7.2 8.7 15.2 16.3 14.5 16.6 13.8 21.4 21.4 23.9
Chewing Tobacco used smokeless tobacco (chew, snuff, plug, dipping tobacco, chewing tobacco)? 1.0 2.4 2.2 2.6 3.1 4.0 4.6 4.6 3.0 5.5 4.6 6.8
Marijuana used marijuana? 5.3 5.0 4.3 7.6 11.9 10.5 12.2 15.1 11.7 14.9 14.8 18.7
Hallucinogens** used LSD or other hallucinogens? 1.1 0.9 0.9 0.8 2.0 1.2 1.7 1.9 1.2 1.6 1.2 2.4
Cocaine used cocaine or crack? 1.0 1.7 0.9 1.0 2.2 2.5 1.6 2.2 1.6 1.8 2.1 3.2
Inhalantssniffed glue, breathed the contents of an aerosol spray can, or inhaled other gases or sprays, in order to get high?
5.0 7.7 4.9 5.4 2.2 4.3 4.7 3.0 1.5 2.0 0.6 1.6
Methamphetamines** used methamphetamines (meth, crystal, crank)? n/a 1.3 0.2 0.4 n/a 2.6 0.3 0.6 n/a 0.9 0.6 0.8
Heroin or Other Opiates used heroin or other opiates? 0.4 0.7 0.5 0.4 1.0 1.6 0.9 0.7 0.7 0.8 1.0 1.0
Ecstasy** used Ecstasy (‘X’, ‘E’, or MDMA)? 0.7 0.5 0.3 0.8 1.3 1.8 1.4 1.5 0.4 1.1 1.0 2.0
Steroidsused steroids or anabolic steroids (suchas Anadrol, Oxandrin, Durabolin, Equipoise or Depotesterone)?
n/a 1.2 0.8 0.7 n/a 2.2 1.4 1.0 n/a 2.5 1.0 1.0
Prescription Pain Relievers*
used prescription pain relievers (suchas Vicodin, OxyContin, Percocet or Codeine) without a doctor telling you to take them?
n/a n/a 4.4 6.0 n/a n/a 9.5 9.4 n/a n/a 6.9 10.5
Stimulants (2004 only)**
used stimulants (“amphetamines”, “meth”, “crystal”, “crank”) without a doctor telling you to take them? 1.0 n/a n/a n/a 2.7 n/a n/a n/a 1.9 n/a n/a n/a
Prescription Stimulants**
used prescription stimulants (such as Ritalin, Adderall, or Dexedrine) without a doctor telling you to take them? n/a 1.4 2.3 1.6 n/a 2.8 2.2 2.9 n/a 2.9 1.6 2.1
Prescription Sedatives**
used prescription sedatives (tranquilizers, such as Valium or Xanax, barbiturates, or sleeping pills)? 4.2 5.1 3.6 3.4 8.1 7.2 5.5 4.5 8.6 6.4 5.0 5.0
Prescription Drugs** combined results of prescription stimulant, sedative and pain reliever questions (see appendix for details)
n/a 7.4 7.2 8.6 n/a 10.8 12.6 12.2 n/a 9.8 9.9 13.1
Over-the-Counter Drugs*
used over-the-counter drugs (suchas cough syrup, cold medicine, or dietpills) for the purposes of getting high?
n/a n/a 5.4 5.6 n/a n/a 5.4 6.4 n/a n/a 4.0 5.9
* Substance categories that were not measured and reported in one or more survey administrations prior to 2008 (also denoted by 'n/a' in the data column).** Denotes a change in the wording of the question between 2008 and prior administrations. Consult appendix for a detailed explanation.
In the past 30 days, on how many occasions (if any) have you: (One or more occasions)
Grade 12Grade 8 Grade 10

30
z
Data Tables
Table 5. Percentage of Students Reporting Heavy ATOD Use
Town2004
Town2006
Town2008
State2008
Town2004
Town2006
Town2008
State2008
Town2004
Town2006
Town2008
State2008
Binge Drinking
How many times have you had 5 or more alcoholic drinks in a row in the past 2 weeks?
10.4 10.6 7.6 13.1 19.9 17.3 18.9 22.4 25.0 22.3 22.2 30.2
1/2 Pack (or more) of Cigarettes/Day
During the past 30 days, how many cigarettes did you smoke per day? (11 to 20 cigarettes, More than 20 cigarettes)
0.7 1.1 0.9 0.7 1.9 2.1 2.1 2.1 3.1 5.3 4.2 4.2
Table 6. Percentage of Students Reporting Antisocial Behavior
Town2004
Town2006
Town2008
State2008
Town2004
Town2006
Town2008
State2008
Town2004
Town2006
Town2008
State2008
8.2 11.4 12.7 20.2 8.1 8.0 8.6 14.6 3.9 6.4 5.7 10.2 7.6 7.6 5.9 12.0 13.3 15.5 14.7 20.5 13.9 14.6 17.1 22.2 3.5 3.8 2.5 4.6 5.7 7.8 7.1 9.8 5.5 7.3 8.0 10.4 3.6 3.6 2.6 3.6 4.4 4.9 3.0 3.7 0.7 1.6 1.8 2.7 5.8 4.1 6.1 7.5 5.6 5.8 7.1 9.2 5.5 5.1 6.0 8.7
13.6 15.2 13.5 18.1 14.4 11.1 15.1 16.1 7.9 11.2 9.4 12.9
4.6 6.9 6.7 7.7 4.0 6.1 5.3 7.2 3.3 5.5 5.1 8.1 0.9 1.7 0.7 1.2 1.1 1.9 1.2 1.3 0.4 1.0 1.1 1.4
Town2004
Town2006
Town2008
State2008
Town2004
Town2006
Town2008
State2008
Town2004
Town2006
Town2008
State2008
n/a 4.1 2.8 5.6 n/a 5.8 5.0 7.9 n/a 14.5 10.4 16.1
n/a 27.1 18.8 29.1 n/a 24.6 24.6 29.1 n/a 23.2 19.5 29.7
* These categories were not measured the in 2004 survey administration (also denoted by 'n/a' in the data column).
Grade 8 Grade 10 Grade 12 Carried a Handgun to School
DRIVE a car or other vehicle when you had been drinking alcohol?*
Stolen or Tried to Steal a Motor Vehicle
Attacked Someone with the Idea of Seriously Hurting Them
Been Arrested
Carried a Handgun
During the past 30 days, how many times did you: (One or more times)
Suspended from School Drunk or High at School Sold Illegal Drugs
How many times in the past year (12 months) have you: (One or more times)
Grade 8 Grade 10 Grade 12
Grade 8 Grade 10 Grade 12
RIDE in a car or other vehicle driven by someone who had been drinking alcohol?*

31
Data Tables
Table 7. Percentage of Students Gambling in the Past Year
Town2004
Town2006
Town2008
State2008
Town2004
Town2006
Town2008
State2008
Town2004
Town2006
Town2008
State2008
n/a 48.2 63.5 69.1 n/a 49.1 65.5 65.9 n/a 44.6 56.1 60.6
n/a 1.9 5.5 6.4 n/a 3.3 7.3 6.1 n/a 3.6 6.2 5.8
n/a 22.5 20.4 24.8 n/a 24.5 22.3 21.8 n/a 17.0 16.9 19.0 n/a n/a 24.8 31.8 n/a n/a 30.7 30.2 n/a n/a 21.9 25.6 n/a 21.6 41.4 43.7 n/a 26.2 46.9 43.7 n/a 26.5 39.4 40.6 n/a n/a 17.9 20.4 n/a n/a 19.2 20.7 n/a n/a 15.4 18.9 n/a 14.2 30.8 32.6 n/a 11.4 28.3 23.2 n/a 6.1 15.0 14.7 n/a 4.6 4.6 6.3 n/a 5.9 4.3 5.1 n/a 4.8 4.1 4.7 n/a n/a 30.5 31.5 n/a n/a 28.9 25.1 n/a n/a 18.8 19.2
n/a 15.5 29.5 32.7 n/a 21.3 32.1 31.3 n/a 18.0 24.5 27.0
n/a n/a 4.5 6.4 n/a n/a 4.2 5.8 n/a n/a 3.3 5.1 Table 8. Percentage of Students Reporting Protection
Town2004
Town2006
Town2008
State2008
Town2004
Town2006
Town2008
State2008
Town2004
Town2006
Town2008
State2008
Community Domain Opportunities for Prosocial Involvement 55.2 47.8 48.7 39.3 47.2 44.3 41.9 37.1 51.8 43.8 45.7 36.1 Rewards for Prosocial Involvement 39.1 34.1 36.4 31.3 40.0 35.4 37.2 35.4 42.1 33.9 34.3 33.2 Family Domain Family Attachment 60.5 54.8 54.7 51.5 50.6 47.8 49.3 46.1 61.6 61.1 58.3 56.2 Opportunities for Prosocial Involvement 66.5 62.4 62.0 59.7 58.6 56.9 56.1 54.0 59.9 58.6 56.7 55.2 Rewards for Prosocial Involvement 68.1 67.0 64.9 61.4 58.1 58.9 58.1 55.1 61.9 58.8 57.9 55.8 School Domain Opportunities for Prosocial Involvement 69.7 62.2 65.5 60.3 69.1 72.0 70.0 62.4 69.1 69.1 71.2 64.3 Rewards for Prosocial Involvement 52.0 45.4 51.6 51.2 61.5 66.9 63.6 59.8 47.6 48.0 48.4 45.4 Peer-Individual Domain Belief in the Moral Order 63.3 55.9 66.7 59.4 68.6 66.0 66.6 66.5 60.0 55.2 56.9 53.6 Interaction with Prosocial Peers* 59.2 60.0 61.5 53.1 56.1 58.1 59.2 55.3 59.7 53.7 52.3 52.5 Prosocial Involvement 43.2 41.7 41.1 39.0 50.3 46.4 47.0 41.2 51.0 40.6 39.7 36.4 Rewards for Prosocial Involvement 59.4 54.6 58.3 59.4 60.2 60.6 58.2 59.7 57.2 52.5 52.3 52.2 Total Protection Students with High Protection** 51.9 42.1 53.7 43.8 47.6 48.9 53.2 46.7 45.1 46.6 48.5 43.3
How often have you done the following for money, possessions, or anything of value: (At least once in the past 12 months or more)
Grade 8
Grade 8
Protective Factor
Grade 10
Grade 10
Played a slot machine, poker machine or other gambling machine?
*Denotes a change in the wording of the question between 2008 and prior administrations. Consult appendix for a detailed explanation.**High Protection youth are defined as the percentage of students who have five or more protective factors operating in their lives.
Played the lottery or scratch-off tickets? Bet on sports?* Played cards?
Bet on a game of personal skill such as pool or a video game?* Bet on a horse or other animal race?*
Bought a raffle ticket? Played bingo? Gambled on the Internet? Played a dice game?*
Grade 12
Grade 12
Any Gambling

32
Data Tables
Table 9. Percentage of Students Reporting Risk
Town2004
Town2006
Town2008
State2008
Town2004
Town2006
Town2008
State2008
Town2004
Town2006
Town2008
State2008
Community Domain Low Neighborhood Attachment 33.3 33.4 32.3 38.5 39.7 43.7 42.1 46.2 42.5 46.8 45.7 51.0 Laws & Norms Favor Drug Use 26.7 31.1 26.4 36.6 29.9 28.4 34.8 42.1 24.7 25.9 23.1 36.3 Perceived Availability of Drugs 32.1 32.2 32.2 38.2 45.0 45.5 46.0 49.6 44.3 48.2 49.0 52.2 Perceived Availability of Handguns 34.1 33.9 35.8 37.8 23.9 23.1 23.6 26.7 27.8 31.3 27.5 33.1 Family Domain Poor Family Management 36.7 45.4 39.9 45.5 35.2 37.6 39.3 42.8 36.2 42.9 41.0 44.3 Family Conflict 49.2 49.5 51.9 53.5 39.9 40.1 43.6 42.8 36.1 37.5 38.5 38.3 Family History of Antisocial Behavior 27.5 29.7 29.4 40.3 32.1 29.7 32.5 41.1 27.0 27.2 26.8 37.3 Parent Attitudes Favorable to ASB 33.6 44.5 42.7 49.3 41.7 44.5 53.2 53.4 34.4 41.0 45.4 50.2 Parent Attitudes Favor Drug Use 22.6 27.7 21.3 26.8 37.0 37.1 38.0 41.1 31.4 38.2 36.2 41.2 School Domain Academic Failure 34.6 39.0 39.7 47.3 46.2 42.7 45.1 49.5 34.8 40.7 36.6 44.4 Low Commitment to School 36.5 41.8 40.3 41.0 48.9 39.4 43.3 43.7 45.1 49.8 45.9 45.6 Peer-Individual Domain Rebelliousness 30.8 40.8 37.6 43.1 35.5 42.4 46.6 46.8 29.8 43.2 38.7 44.0 Early Initiation of ASB 25.6 30.0 30.1 39.4 30.3 31.3 33.1 42.0 27.1 31.6 28.7 41.2 Early Initiation of Drug Use 26.4 25.9 18.3 30.3 28.2 26.9 25.0 32.7 22.3 27.5 23.5 33.1 Attitudes Favorable to ASB 37.5 42.2 38.7 44.6 46.8 45.1 50.4 50.7 41.1 43.5 44.1 46.9 Attitudes Favorable to Drug Use 24.1 26.5 21.3 29.1 34.1 33.5 34.5 37.4 28.7 34.6 33.7 36.3 Perceived Risk of Drug Use 36.2 39.1 34.3 44.5 32.8 34.8 36.7 42.3 35.3 37.4 42.8 46.5 Interaction with Antisocial Peers 42.3 44.1 49.2 58.2 47.0 42.2 49.3 57.3 35.5 40.9 42.4 53.2 Friend's Use of Drugs 33.5 32.8 28.7 39.4 37.0 35.6 37.1 41.9 26.8 33.2 31.9 37.3 Rewards for ASB 42.9 47.3 39.5 45.6 38.4 44.3 42.1 44.0 43.9 53.1 51.6 54.6 Gang Involvement 13.9 19.7 18.6 26.9 17.0 19.2 18.8 23.2 14.1 11.4 11.2 16.8 Total Risk Students at High Risk* 28.0 29.6 31.7 38.7 27.1 28.9 32.7 37.5 20.6 29.6 30.0 35.7 * High Risk youth are defined as the percentage of students who have more than a specified number of risk factors operating in their lives. (8th grade: eight or more risk factors, 10th & 12th grades: nine or more risk factors)
Risk Factor
Grade 8 Grade 10 Grade 12

33
Data Tables
Table 10. Where Youth Obtained Alcohol
Town2008
State2008
Town2008
State2008
Town2008
State2008
Sample size* 174 4,418 347 4,872 300 5,065 I bought it in a store such as a liquor store, convenience store, supermarket, discount store, or gas station
4.0 5.0 5.8 6.9 9.3 12.3
I bought it at a restaurant, bar, or club 2.3 3.0 3.5 3.0 4.7 7.0 I bought it at a public event such as a concert or sporting event 2.3 2.9 3.7 2.9 3.7 3.9
I gave someone else money to buy it for me 19.5 21.4 31.7 34.4 41.0 43.7
My parent or guardian gave it to me 17.2 18.7 22.8 14.8 11.0 13.0 Another family member who is 21 or older gave it to me 15.5 19.7 17.0 18.7 17.7 18.2 Someone not related to me who is 21 or older gave it to me 15.5 19.2 27.1 28.7 38.3 39.5 Someone under the age of 21 gave it to me 28.2 23.8 27.4 24.8 21.7 22.0 I got it at a party 28.7 41.5 49.6 53.1 53.7 57.6 I took it from home 41.4 31.4 33.1 23.2 16.7 13.8 I took it from a store or someone else's home 14.9 11.7 13.5 11.3 8.0 8.0
I got it some other way 31.6 28.7 23.9 23.6 12.3 17.9 * Sample size represents the number of students who indicated at least one means of obtaining alcohol. (Students reporting no alcohol use are not represented.) In the case
of smaller sample sizes, caution should be exercised before generalizing results to the entire community.
Grade 10 Grade 12 If during the past 30 days you drank alcohol, how did you get it? (Mark all that apply)
Grade 8

34
Data Tables
Table 11. Percentage of Students Reporting School Safety Issues
Town2004
Town2006
Town2008
State2008
Town2004
Town2006
Town2008
State2008
Town2004
Town2006
Town2008
State2008
0 times 86.3 85.0 89.3 87.1 89.1 87.8 89.1 88.4 91.0 92.9 94.4 92.4 1 time 8.0 7.6 6.0 6.6 5.1 6.0 5.8 5.9 4.4 3.7 2.3 3.9 2-3 times 2.5 3.9 3.1 3.5 2.9 3.5 2.5 3.0 2.2 2.1 1.6 2.0 4-5 times 1.2 1.0 0.6 1.0 0.9 0.8 1.1 0.8 1.2 0.4 0.6 0.6 6-7 times 0.6 0.8 0.4 0.4 0.2 0.7 0.2 0.4 0.1 0.4 0.2 0.2 8-9 times 0.3 0.1 0.2 0.3 0.3 0.1 0.3 0.3 0.0 0.4 0.1 0.2 10-11 times 0.1 0.3 0.1 0.1 0.2 0.4 0.2 0.2 0.0 0.0 0.0 0.1 12 or more times 0.9 1.2 0.4 0.9 1.2 0.7 0.9 1.1 1.2 0.1 0.7 0.7
0 times 80.8 80.8 83.2 76.5 85.7 89.3 87.2 85.2 95.5 95.2 93.8 91.5 1 time 10.7 11.8 10.5 12.9 8.9 6.3 8.6 8.8 2.3 2.8 3.4 5.0 2-3 times 5.6 5.1 4.1 6.9 3.4 2.5 2.8 3.9 1.0 1.4 1.5 2.1 4-5 times 1.4 1.1 1.3 1.7 0.9 0.7 0.4 0.7 0.3 0.3 0.4 0.4 6-7 times 0.1 0.2 0.4 0.6 0.2 0.2 0.3 0.4 0.3 0.0 0.2 0.3 8-9 times 0.4 0.0 0.4 0.4 0.1 0.1 0.2 0.2 0.1 0.3 0.4 0.2 10-11 times 0.1 0.3 0.0 0.3 0.1 0.1 0.0 0.1 0.3 0.0 0.0 0.1 12 or more times 0.9 0.8 0.2 0.7 0.7 0.7 0.6 0.7 0.1 0.1 0.4 0.4
0 times n/a 58.7 58.4 59.4 n/a 79.1 67.9 69.1 n/a 88.7 85.8 82.3 1 time n/a 21.0 12.7 13.2 n/a 11.3 10.9 10.3 n/a 6.8 6.2 6.6 2-3 times n/a 12.4 11.5 n/a 9.9 9.6 n/a 4.6 5.7 4-5 times n/a 3.9 4.3 n/a 3.1 3.2 n/a 0.9 1.5 6-7 times n/a 2.1 1.9 n/a 1.4 1.4 n/a 0.5 0.8 8-9 times n/a 1.5 1.2 n/a 1.2 1.1 n/a 0.1 0.5 10-11 times n/a 0.7 0.8 n/a 0.9 0.6 n/a 0.2 0.3 12 or more times n/a 5.2 8.2 7.7 n/a 2.5 4.6 4.6 n/a 0.6 1.7 2.4
0 days 92.6 91.9 93.7 89.9 96.0 95.1 95.1 91.1 97.4 97.9 96.1 93.8 1 day 4.6 4.5 3.9 5.8 2.3 3.2 3.1 5.1 1.6 1.4 1.6 3.3 2-3 days 2.2 2.0 1.4 2.7 0.7 0.8 1.0 2.2 0.4 0.0 1.2 1.8 4-5 days 0.1 0.3 0.6 0.6 0.3 0.1 0.1 0.6 0.0 0.0 0.2 0.4 6 or more days 0.5 1.3 0.4 1.0 0.6 0.7 0.7 1.0 0.6 0.7 0.9 0.7
0 days 96.7 95.0 96.4 93.9 97.5 95.2 95.8 93.8 97.2 96.7 96.5 94.4 1 day 2.2 2.5 1.8 3.1 1.0 1.3 2.0 2.2 1.0 0.3 0.7 1.5 2-3 days 0.6 0.8 0.7 1.3 0.3 1.3 1.2 1.2 0.4 0.4 0.7 1.1 4-5 days 0.1 0.5 0.2 0.5 0.3 0.7 0.4 0.5 0.1 0.6 0.4 0.5 6 or more days 0.5 1.1 0.9 1.2 0.9 1.4 0.6 2.2 1.2 2.1 1.7 2.6
*
Grade 12
15.1 7.0 4.0
In 2006 the choices for this question were Never , Once , Several Times and Very Often. This category was not measured the in 2004 survey administration (also denoted by 'n/a' in the data column).
During the past 12 months, how often have you been picked on or bullied by a student ON SCHOOL PROPERTY?*
During the past 12 months, how many times were you in a physical fight on school property?
During the past 30 days, on how many days did you carry a weapon such as a gun, knife, or club ON SCHOOL PROPERTY?
During the past 30 days, on how many days did you not go to school because you felt you would be unsafe at school or on your way to or from school?
During the past 12 months, how many times has someone threatened or injured you with a weapon such as a gun, knife, or club on school property?
Question
Grade 8 Grade 10

35
Data Tables
Percent Sample Percent Sample Percent Sample Percent Sample Percent Sample
drink 1 or two drinks nearly every day Alcohol 64.1 1,207 65.6 1,101 70.0 807 59.3 1,471 72.6 1,589
smoke 1 or more packs or cigarettes per day Cigarettes 87.5 1,208 91.4 1,106 92.9 805 87.5 1,470 93.0 1,593
smoke marijuana regularly Marijuana 86.3 1,182 77.9 1,078 72.3 791 73.2 1,437 85.9 1,560
drink beer, wine, or hard liquor regularly Alcohol 92.8 1,148 84.7 1,058 79.4 785 83.8 1,407 88.6 1,531
smoke cigarettes Cigarettes 97.4 1,155 94.6 1,063 88.5 788 93.0 1,415 95.2 1,537
smoke marijuana Marijuana 97.9 1,146 94.6 1,051 91.5 779 94.1 1,401 95.9 1,521
drink beer, wine, or hard liquor regularly Alcohol 84.3 1,268 65.2 1,136 62.7 830 71.2 1,549 73.0 1,625
smoke cigarettes Cigarettes 89.2 1,268 75.0 1,138 64.7 828 77.8 1,549 78.2 1,625
smoke marijuana Marijuana 91.0 1,269 76.8 1,136 73.4 826 79.3 1,548 83.7 1,623
Alcohol 15.5 1,251 33.3 1,118 38.3 813 26.5 1,513 28.4 1,609
Cigarettes 7.2 1,218 14.5 1,109 21.4 810 14.0 1,481 12.8 1,600
Marijuana 4.3 1,243 12.2 1,108 14.8 805 11.6 1,495 7.9 1,601
Percent Sample Percent Sample Percent Sample Percent Sample Percent Sample
Alcohol 40.2 1,266 63.3 1,138 68.7 833 55.0 1,550 56.3 1,627 Average age:
Cigarettes 18.9 1,269 35.0 1,135 43.6 831 32.1 1,547 29.4 1,628 Average age:
Marijuana 7.9 1,272 27.0 1,139 37.4 834 24.6 1,555 19.9 1,630 Average age:
*
**
†
14.2 years 12.9 years
13.9 years
13.3 years 13 years
smoked marijuana?12.4 years
11.8 years
13.8 years 14.3 years
Definition Substance
13.3 years 13 years
14.9 years
Table 12. Drug Free Communities Report*
Male† Female†Grade 8Town 2008Grade 12
For Average Age of Onset, “Sample” represents the number of youth who answered the question (including students responding that they never used). The "Percent" column represents the percentage of youth in the sample reporting any age of first use for the specified substance. "Average age" is calculated by averaging the ages of first use of students reporting any use.
The male and female values allow a gender comparison for youth who completed the survey. However, unless the percentage of students who participated from each grade is similar, the gender results are not necessarily representative of males and females in the community.
Past 30-Day Use
Grade 10Outcome
Perception of Peer Disapproval(I think it is Wrong or Very Wrong for someone my age to...)
Perception of Risk (People are at Moderate or Great Risk of harming themselves if they... )
Perception of Parent Disapproval (Parents feel it would be Wrong or Very Wrong to... )
had more than a sip or two of beer, wine or hard liquor?
at least one use in the Past 30 Days
The “Sample” column represents the sample size (the number of youth who answered the question). The "Percent" column represents the percentage of youth in the sample answering the question as defined.
11.8 years
Average Age of Onset**(How old were you when you first…) smoked a cigarette, even just a puff?
14.5 years 13 years

36
Appendix
Appendix - Comparability of survey administratonsIssue 2004 AYS 2006 AYS 2008 AYS Notes regarding changes
Drug Category On how many occasions (if any) have you: On how many occasions (if any) have you: On how many occasions (if any) have you:
Hallucinogens Used LSD or other psychedelics during the past 30 days?
Used LSD or other psychedelics during the past 30 days?
Used LSD or other hallucinogens during the past 30 days?
Substituted "hallucinogens" for "psychedelics" in 2008. Comparable across all years.
Meth- amphetamines
Not applicable, no methamphetamine-specific item on 2004 AYS
Used methamphetamines (meth, speed, crank, crystal meth)?
Used methamphetamines (meth, crystal, crank)?
2006 and 2008 provide slightly different examples, but are cautiously comparable.
Prescription stimulants
Used stimulants (“amphetamines”, “meth”, “crystal”, “crank”) without a doctor telling you to take them?
Used stimulants, other than methamphetamines (such as amphetamines, Ritalin, or Dexedrine) without a doctor telling you to take them?
Used prescription stimulants (such as Ritalin, Adderal, or Dexedrine) without a doctor telling you to take them?
2004 is not comparable to any other years, data are presented for archival interest. 2006 and 2008 data are cautiously comparable.
Prescription sedatives
Used sedatives (tranquilizers, such as Valium or Xanax, barbiturates, or sleeping pills) without a doctor telling you to take them?
Used sedatives (tranquilizers, such as Valium or Xanax, barbiturates, or sleeping pills) without a doctor telling you to take them?
Used prescription sedatives (tranquilizers, such as Valium or Xanax, barbiturates, or sleeping pills)?
2008 AYS added descriptor "prescription" and removed qualifier "without a doctor telling you to take them." 2008 data are cautiously comparable with other years.
Ecstasy Used MDMA (‘X’, ‘E’, or ecstasy)? Used MDMA (‘X’, ‘E’, or ecstasy)? Used ecstasy (‘X’, ‘E’, or MDMA)? 2008 AYS used "ecstasy" as the primary descriptor and moved "MDMA" to examples. Comparable across years.
Prescription drugs
Not applicable, no prescription drugs item on 2004 AYS
Used sedatives (tranquilizers, such as Valium or Xanax, barbiturates, or sleeping pills), stimulants, other than methamphetamines (such as amphetamines, Ritalin, or Dexedrine) or other prescription drugs (such as Oxycontin) without a doctor telling you to take them? (composite question, see notes)
Used prescription stimulants (Ritalin, Adderall, or Dexedrine), sedatives (tranquilizers, such as Valium or Xanax, barbiturates, or sleeping pills) or pain relievers (Vicodin, OxyContin, Percocet or Codeine) without a doctor telling you to take them? (composite question, see notes )
In 2006, responses to the stimulant, sedative and other prescription drug questions were calculated as one measure. (2006 had no prescription pain reliever item.) In 2008, responses to the stimulant, sedative and prescription pain reliever questions were calculated as one measure. (2008 had no standalone prescription drug item.) 2006 and 2008 data are cautiously comparable. (Note that composite 2006 data will not match past reports' prescription drugs category.)
Gambling Category
Not applicable, no gambling items on 2004 AYS
How often during the past 12 months have you:
How often have you done the following for money, possessions, or anything of value:
Sports betting n/a Bet on team sports? Bet on sports? Not comparable across years.
Race betting n/a Bet money on horse races? Bet on a horse race or other animal race? Not comparable across years.
Dice n/a Bet on dice games such as craps? Played a dice game? Not comparable across years.
Games of skill n/a Bet on games of personal skill such as pool, darts, or bowling?
Bet on a game of personal skill such as pool or a video game?
Comparable across years.
Protective Scale: Peer-Individual
Interaction with Prosocial Peers
Think of your four best friends (the friends you feel closest to). In the past year (12 months), how many of your best friends have: (Scale is calculated based on the average response [0, 1, 2, 3 or 4 friends] to the following questions)
Regularly attended religious services was removed from 2008 AYS. 2004 and 2006 have been recalculated to match 2008 AYS and are now comparable across all years. Due to this recalculation, current reports may differ slightly from past reports.
...participated in clubs, organizations and activities at school? ...made the commitment to stay drug-free?
...tried to do well in school? ...liked school? ...regularly attended religious services?(removed in 2008)

37
Regional Prevention Contacts
Cochise, Graham, Greenlee, Pima, and Santa Cruz Counties Bill Burnett Community Partnership of Southern Arizona (CPSA) (520) 618-8807 Gila, La Paz, Pinal, and Yuma Counties Linda Weinberg Cenpatico Behavioral Health of Arizona (866) 495-6738 Apache, Coconino, Mohave, Navajo, and Yavapai Counties Petrice Post Northern Arizona Regional Behavioral Health Authority (NARBHA) (928) 214-2177 Maricopa County Juan Aristizabal Magellan (602) 797-8256 Gila River Indian Community Joan Grey Gila River Regional Behavioral Health Authority (602) 528-7136 Pasqua Yaqui Tribe Centered Spirit Program Jill Fabian (520) 879-6067 Navajo Nation Department of Behavioral Health Services (928) 871-6235 White Mountain Apache Tribe Apache Behavioral Health Services (928) 338-4811 Colorado River Indian Tribes (928) 669-6577 Other State and National Contacts: Arizona Criminal Justice Commission Michelle Neitch/ Phillip Stevenson (602) 364-1173/(602) 364-1157 www.azcjc.gov
Arizona Department of Education Student Services Division www.ade.az.gov Arizona Department of Health Services Division of Behavioral Health Services Lisa Shumaker (602) 364-4594 www.azdhs.gov/bhs/index.htm Arizona Prevention Resource Center (800) 432-2772 www.azprevention.org Center for Violence Prevention and Community Safety Charles Katz (602) 543-6618 [email protected] Center for Substance Abuse Prevention (CSAP) http://prevention.samhsa.gov Governor’s Office of Children, Youth, and Families (602) 542-4043 http://www.governor.state.az.us/cyf/index.html Safe and Drug Free Schools and Communities U.S. Department of Education www.ed.gov/offices/OESE/SDFS Arizona Department of Gaming's Office of Problem Gambling Elise Mikkelsen (602) 266-8299 ext. 351 www.problemgambling.az.gov Substance Abuse and Mental Health Services Administration (SAMHSA) www.samhsa.gov Office of Juvenile Justice and Delinquency Prevention http://ojjdp.ncjrs.org/ Western Regional Center for the Application of Prevention Technologies (CAPT) www.westcapt.org Bach Harrison, L.L.C. R. Steven Harrison, Ph.D. (801) 359-2064 www.bach-harrison.com
Contacts for Prevention