Embed Size (px)
Citation preview
arX
iv:1
507.
0602
9v1
[cs
.CY
] 2
2 Ju
l 201
5
Towards Input Device Satisfaction Through
Hand Anthropometry
Katrina Joy H. Magno and Jaderick P. Pabico
Institute of Computer Science
University of the Philippines
Los Banos, Laguna
{kjhmagno, jppabico}@uplb.edu.ph
Abstract
We collected the hand anthropometric data of 91 respondents to come up with a Filipino-based measurement to determine the suitability of an input device for a digital equipment, thestandard PC keyboard. For correlation purposes, we also collected other relevant informationlike age, height, province of origin, and gender, among others. We computed the percentilesfor each finger to classify various finger dimensions and identify length-specific anthropometriccut-points. We compared the percentiles of each finger dimension against the actual length ofthe longest key combinations when correct finger placement is used for typing, to determinewhether the standard PC keyboard is fit for use by our sampled population. Our analysis showsthat the members of the population with hand dimensions at extended position below 75thpercentile and at 99th percentile are the ones who would most likely not reach the longest keycombination for the left and the right hands, respectively. Using machine vision and imageprocessing techniques, we automated the anthropometric process and compared the accuracyof its measurements to that of manual process’. We compared the measurement generated byour automated anthropometric process with the measurements using the manual one and wefound out that they have a very minimal absolute difference. The data collected from this studycould be used in other studies such as determining a good design for mobile and other handhelddevices, or input devices other than keyboard. The automated method that we developed couldbe used to easily measure hand dimensions given a digital image of the hand and could beextended for measuring the entire human body for various other applications.
1. Introduction
Among the many parts of the human body, the hand is unique in being free from repetitive loco-motor duties that are usually done by the legs, eyelids, jaw, and other body parts with repetitiveand habitual functions. In fact, the human hand is devoted entirely to functions of manipulation,which it does effectively due to the special anatomical configuration of its bones and muscles. Thestructural configuration of the human hand allows the opposing action of the thumb surface tothe corresponding surfaces of the other four fingertips. Controlled by a highly evolved nervoussystem, the human is one among the few species on Earth known to be capable of executing a firmgrasp (Begliomini et al., 2008; Cutkosky and Howe, 1990; Markze, 1971). Because of this, the handhas become an indespensable part of the human body for controlling and effecting changes on theenvironment, either with or without the aid of tools.
1
2
The proper dimension of hand-controlled devices, such as computer input devices, is an importantaspect of a product’s design process. The user’s impression about a product PA while she1 isusing it, in effect, determines her satisfaction level on PA. In fact, studies (Melcher et al., 2003;Wong and Pang, 2005) show that the success of any product PB in the market depends solely on thesatisfaction of the end user while using PB , rather than on PB ’s technological development. Here,user satisfaction can be seen as the sum of a user’s feelings and attitudes on factors affecting theuse of PB (Bailey and Pearson, 1983). Thus, the success or failue of any product is dependent onthe end user’s satisfaction. A key element affecting user satisfaction with a computer input device,such as a keyboard, is its ergonomics. The industrial and mechanical designers face a challengingtask in fitting the keys and other components into an appealing, ergonomic and durable productthat is of the right size of the majority of the population of the target market.
A good design may increase the productivity of users, as well as their comfort, in using input devices.To be able to achieve satisfaction in using these devices, there is a need to come up with an idealmeasurement that would not strain the human’s body parts used to control the devices. Due to therace-based variability (induced by gene × environment interaction) in human’s anatomical features,there is no one-size-fits-all device that one can create for the global population. Thus, designersmust customize the device according to the dimensions of the body parts of the majority in a localpopulation. A scientific way to do this is to conduct a meticulous and time-consuming process of sur-veying the lengths of the body parts of the human users. This scientific way of measuring the bodylengths of human individual is called anthropometry, derived from the Greek words “anthropo” and“metron” that mean “human” and “measure,” respectively (Ulijaszek and Mascie-Taylor, 1994).Based on our literature review, aside from few studies conducted for Filipinos (Amongo et al.,2010; Del Prado-Lu, 2007; Novabos, 2010, 2012; Timoteo-Afinidad, 2010), there is no anthropo-metric database that exists as of this writing that reflects the measurements of Filipino body partsfor use in designing hand-held digital devices. In fact, most digital devices that are available inthe Philippine market have been imported from other countries. In the absence a Filipino-basedanthropometric database, these imports were designed with the anthropometric data, either of thepopulation of the originating country at the worst, or that the importers used neighboring coun-tries’ data they assumed to have approximated the Filipino measurements at the best. In effect,most devices that enter the Philippines do not comfortably fit into the majority of the Filipinos’hands, sacrificing user comfort, usability, and safety.
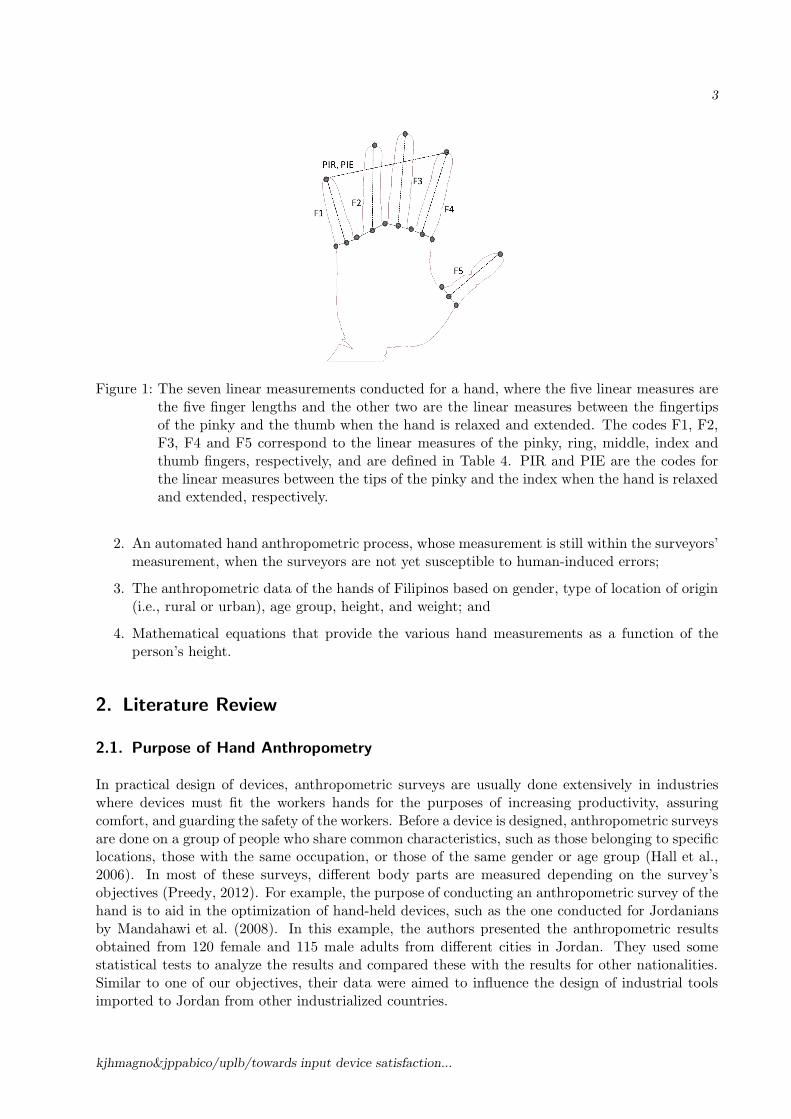
In this study, we conducted an anthropometric survey of the hands of 91 college students known tohave come from different parts of the Philippines. Our purpose is to come up with an initial profileof users that may be used to design keyboards that will fit Filipino groups based on gender, age,and type of location of origin. To provide solution to the time, consistency and accuracy problemsbrought about by manual anthropometric process, we developed a computer-based anthropometryby combining techniques in machine vision and digital image processing in the hope of furnishingsurveyors a fully-automated system that is fast, yet provides consistent measurements. Here, weobtained a total of 14 linear measurements, seven for each hand including the five fingers, and twohand positions used in conducting the key combination with the longest linear distance, as shownin Figure 1.
We present in this paper our contributions to the field of anthropometry:
1. A data supporting our claim that the manual hand anthropometric process, however strictly“enforced,” would still result in accuracy and consistency problems;
1We used the female gender as our writing style only. Depending on the context, we mean both or either gender,
and not as a means to prejudice the opposite one.
kjhmagno&jppabico/uplb/towards input device satisfaction...
3
Figure 1: The seven linear measurements conducted for a hand, where the five linear measures arethe five finger lengths and the other two are the linear measures between the fingertipsof the pinky and the thumb when the hand is relaxed and extended. The codes F1, F2,F3, F4 and F5 correspond to the linear measures of the pinky, ring, middle, index andthumb fingers, respectively, and are defined in Table 4. PIR and PIE are the codes forthe linear measures between the tips of the pinky and the index when the hand is relaxedand extended, respectively.
2. An automated hand anthropometric process, whose measurement is still within the surveyors’measurement, when the surveyors are not yet susceptible to human-induced errors;
3. The anthropometric data of the hands of Filipinos based on gender, type of location of origin(i.e., rural or urban), age group, height, and weight; and
4. Mathematical equations that provide the various hand measurements as a function of theperson’s height.
2. Literature Review
2.1. Purpose of Hand Anthropometry
In practical design of devices, anthropometric surveys are usually done extensively in industrieswhere devices must fit the workers hands for the purposes of increasing productivity, assuringcomfort, and guarding the safety of the workers. Before a device is designed, anthropometric surveysare done on a group of people who share common characteristics, such as those belonging to specificlocations, those with the same occupation, or those of the same gender or age group (Hall et al.,2006). In most of these surveys, different body parts are measured depending on the survey’sobjectives (Preedy, 2012). For example, the purpose of conducting an anthropometric survey of thehand is to aid in the optimization of hand-held devices, such as the one conducted for Jordaniansby Mandahawi et al. (2008). In this example, the authors presented the anthropometric resultsobtained from 120 female and 115 male adults from different cities in Jordan. They used somestatistical tests to analyze the results and compared these with the results for other nationalities.Similar to one of our objectives, their data were aimed to influence the design of industrial toolsimported to Jordan from other industrialized countries.
kjhmagno&jppabico/uplb/towards input device satisfaction...
4
Dizmen (2012), in a similar way, conducted a hand anthropometric survey for Hong Kong nationalswhere he used regression models to analyze his data. He recommended that the use of referencevalues for hand grip strength necessary in designing and fabricating industrial equipments wouldlater prevent repetitive strain injuries to users. This translates, according to him, to a safer andhealthier workplace. Additionally, hand measurements and their relation to the stature were studiedby Laila et al. (2009) for the purposes of estimating the stature of Bengali nationals given theanthropometric measurements of the hand.
Aside from industrial purposes, hand anthropometric data were also used to design hand-helddevices like mobile phones with “user satisfaction” as one of the main objectives. In 2007,Balakrishnan and Yeow (2007) determined that hand measurements and gender are factors in theuser satisfaction of Short Message System (SMS) devices. Additionally, keypad sizes of mobilephones were collected and they found out that the females were more satisfied with the keypadsizes than the males. They recommended that the handheld devices must have larger keys andwider spaces between keys to accommodate those who have larger hand and finger sizes. Thedata they have collected could be used in designing mobile phone keypads and personalized mobilephone devices.
Just like the work of Balakrishnan and Yeow (2007), gender issue could also be one among themany goals of anthropometry. For example, Amongo et al. (2010) conducted an anthropometricsurvey where they measured a total of 38 body lengths of 284 women sampled in CALABARZONarea. Their study was generally aimed to empower women in their participation to agriculturalproduction processes. Their data is the first step toward “gender equality” because it establishes ananthropometric profile of CALABARZON women farmers, which in turn will serve as a databasefor future design and fabrication of gender-neutral agricultural machineries.
2.2. Other Anthropometric Studies
There are many more applications of anthropometry that have been proven practical for some otherfields of study. In the field of medicine, for example, quantitative comparison of anthropometric datawith patients measurements before and after surgery provides the information needed by medicaldoctors for planning of and assessing the need of plastic and re-constructive surgery (Farkas, 1994).In the domain of forensic anthropology, on the other hand, anthropometry-aided “guessworks” onlikely measurements are important factors in the determination of individuals’ appearance fromtheir remains (Farkas, 1994; Rogers, 1984). In the area of recovering missing children, anthropo-metric databases and the missing child’s photographs are used in aging the child’s appearance toinfer what she would look like after so many years of being separated from her family (Farkas, 1994).In the domain of entertainment computing, anthropometry is used to aid in the construction of facemodels for computer graphics applications, for creating life-like avatars in Computer-GeneratedImagery (CGI)-based films, and for three-dimensional animation, among others (DeCarlo et al.,1998).
There are many more examples of human-factors analyses and practical applications of anthro-pometry that can be found from the literature. For a comprehensive survey on these, the readeris directed to the work of Dooley (1982). Most of the works surveyed here resulted into creatingguides to help design products to fit most people. In general, however, anthropometric data isneeded because it provides information on a range of enterprises that depend on knowledge of thedistribution of measurements across human populations.
kjhmagno&jppabico/uplb/towards input device satisfaction...
5
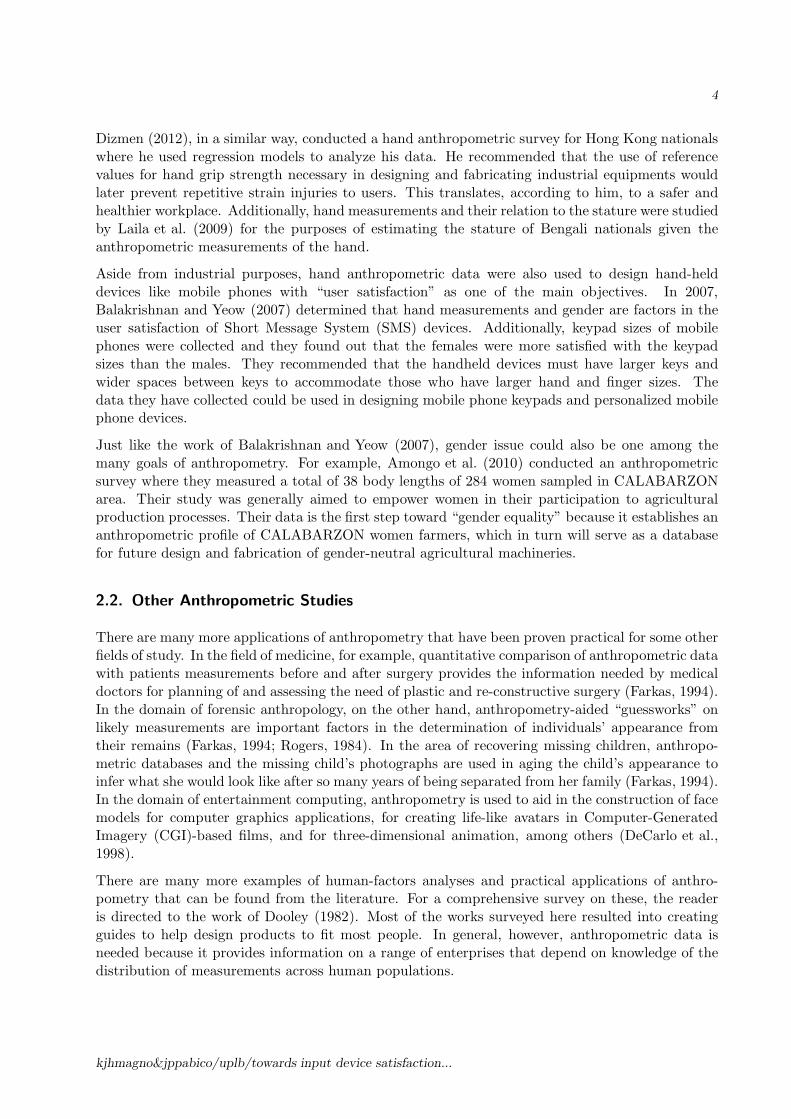
Figure 2: An example digital caliper used for measuring (a) inside and (b) outside diameters, aswell as the depth of a recess or hole. This portable measuring device looks like a sliderule with jaws and an LCD display. Many digital calipers now come with data outputports (c), so that the measurements can be read or logged by a computer.
2.3. Problems in Manual Anthropometry
All of the above example studies used manual procedures in obtaining the hand measurements. Themanual process takes quite a longer time because the anthropometric surveyors follow a strict andmeticulous process (see (Greiner, 1992) and (National Health and Nutrition Examination Survey,2007) for examples). Even though the process requires the human surveyors to be extremely carefuland precise, the process is still realistically prone to human errors. If several surveyors are takingthe measurement of a population sample, the surveyors themselves will introduce inconsistenciesto their measurements. This is because one surveyor’s standard and baselines for measurement canbe different from another’s, even if they meticulously follow the written process, and even undersupervision. In this paper, we provide supporting data to this claim. We show that when fivedifferent surveyors S1, S2, . . . , S5 measure the length of each of the ten fingers of one person P0,at least 0.1 cm discrepancy is introduced in the database. Inconsistency arise when we do notknow whose measurement is the correct one. But why hire multiple surveyors when hiring only onesurveyor to conduct the survey for all the n samples P1, P2, . . . , Pn is an intuitive solution to theinconsistencies brought about by multiple surveyors? The answer to this that using one surveyormay also introduce accuracy problems. A surveyor who does the job of many, given a short amountof time, may get tired easily. Additionally, she may introduce short-cuts to the meticulous processso that she can measure more samples in a short amount of time. Again, we show in this paper theresult of repeatedly measuring the finger lengths of one subject by one surveyor within two hours in30-minute intervals. Here, inconsistencies were observed although some fingers were measured withthe same value. The bottom line of all these is that using human surveyors, whether conductedsolely by a lone surveyor or by many surveyors, has serious consistency and accuracy problems.Knowing that machines seldom get “tired” and can work at the same pace for long periods of time,automating the manual process should be the most logical solution to these problems.
Semi-automating the anthropometric process is of course not a new solution. Instead of the sur-veyors eyeballing the measurements with the aid of a linear ruler (usually, a caliper or a ruledstraight edge), some surveys used simple digital machines in order to automatically obtain thehand measurements. For example, Mandahawi et al. (2008) used an electronic digital caliper (e.g.,see Figure 2) to measure the twenty four hand dimensions included in their survey. However, thedigital caliper is also manually-operated since it is just like a linear ruler but more accurate inmeasuring inside or outside diameters because it does not require a surveyor to perform an eyeballestimate. Therefore, a system that would provide full automation of the anthropometric process isneeded so that the process of gathering anthropometric data is simplified, while the measurementprocess is both efficient and consistent.
kjhmagno&jppabico/uplb/towards input device satisfaction...
6
3. Problems in Manual Hand Anthropometry
We claim in this paper that the manual hand anthropometric process, even though strict adherenceto the meticulous procedure is followed by the surveyors under supervision, is still susceptible toaccuracy and consistency problems.
3.1. Accuracy Problem
The accuracy problem arises when m > 0 surveyors, S1, S2, . . . , Sm perform the hand anthro-pometric survey on a sample population Φ of n >> m subjects, where Φ = {P1, P2, . . . , Pn}.Ordinarily, each surveyor Si is assigned n/m subjects and that the sub-population φi ⊂ Φ of sub-jects assigned to Si is unique to her (i.e., Φ =
⋃mi φi, ∅ =
⋂mi φi and n =
∑mi |φi|). However,
we contend that when all surveyors Si, ∀i = 1, . . . ,m, measure the same set π ⊂ Φ of k sub-jects π = {P1, P2, . . . , Pk}, the measurements mi,j,∀i = 1, . . . ,m will be different, ∀j = 1, . . . ,m.That is, the pairwise absolute difference between the measurements mx,j and my,j of surveyors Sx
and Sy, respectively, on subject Pj ∈ φ is statistically non-zero for some significance level α = 0.05,∀x, y = 1, 2, . . . ,m, x 6= y. This means that |mx,j −my,j | > 0, which implies that the surveyors arenot accurate in measuring Pj .
3.2. Consistency Problem
Consistency problem arises when the surveyors measure the subjects in π repeatedly over a longperiod of time. That is, if a surveyor Si repeatedly measures Pj ∈ π every ∆t within a time spanof T , her measurements mi,j,t will vary. This variability can be attributed to tiredness because thetask was done during a long period of time T , and boredom due to the repetitive nature of thetask. Thus, if |mi,j,t−mi,j,t+δt| > 0, ∀t ∈ [0, T ], then Si is not consistent in measuring Pj within T .Note here that Si would have measured Pj
T∆t
+ 1 times within T .
3.3. A Two-factor Experiment
To test the claims that we made above, we let m = 5 surveyors manually measure the finger lengthsof both hands of each of n = 91 subjects following the meticulous process outlined in Greiner (1992).For T = 2 hours, a set of |π| = 5 subjects was repeatedly measured by the surveyors at an intervalof ∆t = 30 minutes, all of these while the surveyors are measuring the rest of the 86 other subjectsonce. For each subject, the surveyors measure the lengths of the pinky, ring, middle, index, andthumb fingers of both hands, following the general measurement (interaction) model for each fingershown in Equation 1. In the model, µ is the overall mean of the measurements averaged across Φ,S, and τ , while Pj is the variability brought about by the jth subject, Si is the effect of the ithsurveyor, τ is the effect of time on the measurement, and ǫ is the effect of a random error committedby the ith surveyor when measuring the jth subject at time t.
mi,j,t = µ+ Pj + Si + τt + [S × τ ]i,t + ǫi,j,t (1)
In the above model, the term [S× τ ]i,t depicts the interaction effect between the surveyors and thedifferent times of measurement. We used a two-factor factorial analysis of variance (ANOVA) totest the following null hypothesis about the measurements of the subjects in π:
kjhmagno&jppabico/uplb/towards input device satisfaction...
7
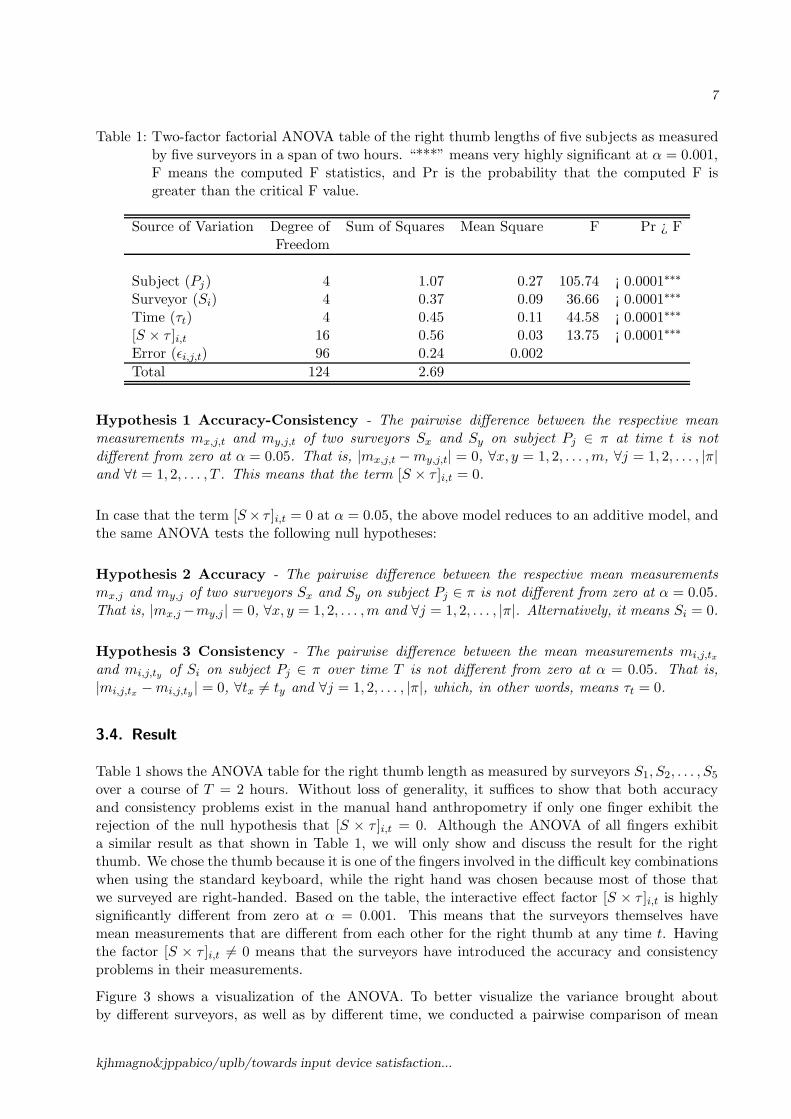
Table 1: Two-factor factorial ANOVA table of the right thumb lengths of five subjects as measuredby five surveyors in a span of two hours. “***” means very highly significant at α = 0.001,F means the computed F statistics, and Pr is the probability that the computed F isgreater than the critical F value.
Source of Variation Degree of Sum of Squares Mean Square F Pr ¿ FFreedom
Subject (Pj) 4 1.07 0.27 105.74 ¡ 0.0001∗∗∗
Surveyor (Si) 4 0.37 0.09 36.66 ¡ 0.0001∗∗∗
Time (τt) 4 0.45 0.11 44.58 ¡ 0.0001∗∗∗
[S × τ ]i,t 16 0.56 0.03 13.75 ¡ 0.0001∗∗∗
Error (ǫi,j,t) 96 0.24 0.002
Total 124 2.69
Hypothesis 1 Accuracy-Consistency - The pairwise difference between the respective meanmeasurements mx,j,t and my,j,t of two surveyors Sx and Sy on subject Pj ∈ π at time t is notdifferent from zero at α = 0.05. That is, |mx,j,t −my,j,t| = 0, ∀x, y = 1, 2, . . . ,m, ∀j = 1, 2, . . . , |π|and ∀t = 1, 2, . . . , T . This means that the term [S × τ ]i,t = 0.
In case that the term [S× τ ]i,t = 0 at α = 0.05, the above model reduces to an additive model, andthe same ANOVA tests the following null hypotheses:
Hypothesis 2 Accuracy - The pairwise difference between the respective mean measurementsmx,j and my,j of two surveyors Sx and Sy on subject Pj ∈ π is not different from zero at α = 0.05.That is, |mx,j−my,j | = 0, ∀x, y = 1, 2, . . . ,m and ∀j = 1, 2, . . . , |π|. Alternatively, it means Si = 0.
Hypothesis 3 Consistency - The pairwise difference between the mean measurements mi,j,tx
and mi,j,ty of Si on subject Pj ∈ π over time T is not different from zero at α = 0.05. That is,|mi,j,tx −mi,j,ty | = 0, ∀tx 6= ty and ∀j = 1, 2, . . . , |π|, which, in other words, means τt = 0.
3.4. Result
Table 1 shows the ANOVA table for the right thumb length as measured by surveyors S1, S2, . . . , S5
over a course of T = 2 hours. Without loss of generality, it suffices to show that both accuracyand consistency problems exist in the manual hand anthropometry if only one finger exhibit therejection of the null hypothesis that [S × τ ]i,t = 0. Although the ANOVA of all fingers exhibita similar result as that shown in Table 1, we will only show and discuss the result for the rightthumb. We chose the thumb because it is one of the fingers involved in the difficult key combinationswhen using the standard keyboard, while the right hand was chosen because most of those thatwe surveyed are right-handed. Based on the table, the interactive effect factor [S × τ ]i,t is highlysignificantly different from zero at α = 0.001. This means that the surveyors themselves havemean measurements that are different from each other for the right thumb at any time t. Havingthe factor [S × τ ]i,t 6= 0 means that the surveyors have introduced the accuracy and consistencyproblems in their measurements.
Figure 3 shows a visualization of the ANOVA. To better visualize the variance brought aboutby different surveyors, as well as by different time, we conducted a pairwise comparison of mean
kjhmagno&jppabico/uplb/towards input device satisfaction...
8
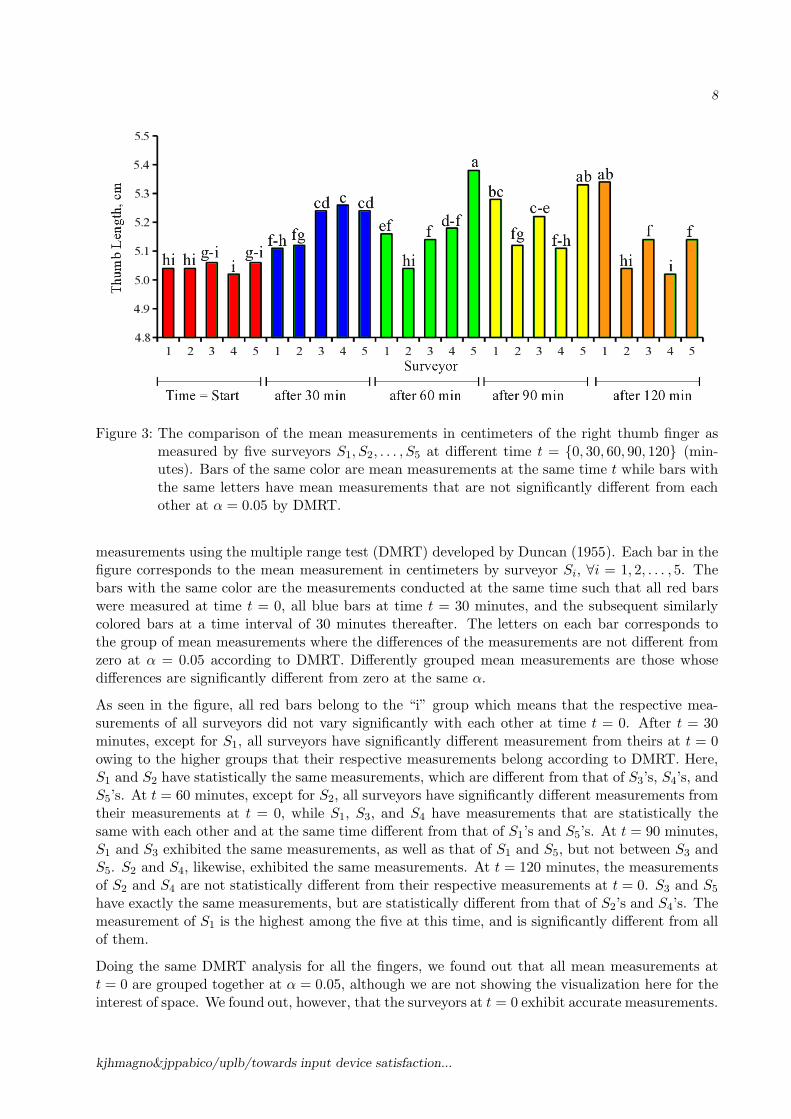
Figure 3: The comparison of the mean measurements in centimeters of the right thumb finger asmeasured by five surveyors S1, S2, . . . , S5 at different time t = {0, 30, 60, 90, 120} (min-utes). Bars of the same color are mean measurements at the same time t while bars withthe same letters have mean measurements that are not significantly different from eachother at α = 0.05 by DMRT.
measurements using the multiple range test (DMRT) developed by Duncan (1955). Each bar in thefigure corresponds to the mean measurement in centimeters by surveyor Si, ∀i = 1, 2, . . . , 5. Thebars with the same color are the measurements conducted at the same time such that all red barswere measured at time t = 0, all blue bars at time t = 30 minutes, and the subsequent similarlycolored bars at a time interval of 30 minutes thereafter. The letters on each bar corresponds tothe group of mean measurements where the differences of the measurements are not different fromzero at α = 0.05 according to DMRT. Differently grouped mean measurements are those whosedifferences are significantly different from zero at the same α.
As seen in the figure, all red bars belong to the “i” group which means that the respective mea-surements of all surveyors did not vary significantly with each other at time t = 0. After t = 30minutes, except for S1, all surveyors have significantly different measurement from theirs at t = 0owing to the higher groups that their respective measurements belong according to DMRT. Here,S1 and S2 have statistically the same measurements, which are different from that of S3’s, S4’s, andS5’s. At t = 60 minutes, except for S2, all surveyors have significantly different measurements fromtheir measurements at t = 0, while S1, S3, and S4 have measurements that are statistically thesame with each other and at the same time different from that of S1’s and S5’s. At t = 90 minutes,S1 and S3 exhibited the same measurements, as well as that of S1 and S5, but not between S3 andS5. S2 and S4, likewise, exhibited the same measurements. At t = 120 minutes, the measurementsof S2 and S4 are not statistically different from their respective measurements at t = 0. S3 and S5
have exactly the same measurements, but are statistically different from that of S2’s and S4’s. Themeasurement of S1 is the highest among the five at this time, and is significantly different from allof them.
Doing the same DMRT analysis for all the fingers, we found out that all mean measurements att = 0 are grouped together at α = 0.05, although we are not showing the visualization here for theinterest of space. We found out, however, that the surveyors at t = 0 exhibit accurate measurements.
kjhmagno&jppabico/uplb/towards input device satisfaction...
9
However, at all t > 0, the measurements of the surveyor on each finger have significant variability.We speculate here that the variability is brought about by the human factors in performing manualtasks, such as boredom due to the repetitive nature of the task, as well as tiredness, becausethe task has been done by the surveyors for a long time. At t = 0, we can safely say that thesurveyors are not yet affected by boredom and tiredness, and so their respective measurements arestill statistically accurate. Thus, we can use these measurements as a basis to compare the resultof our automated system.
4. Hand Anthropometry
4.1. Demography of Respondents
We considered a total of n = 91 tertiary students from a national university, where most studentsgenerally came from different regions in the Philippines. Because of this, they were also asked abouttheir places of origin or the province where they came from, and whether their places of origin isconsidered of urban or of rural type, aside from the standard information such as age, gender,weight and height. Asking the respondents about the type of their places of origin is important indetermining the general characteristics of the measurements of their hands because of the obviousdifferences in the rural and urban lifestyles. Students in the rural area are generally considered tohave larger or longer hands due to exposure to manual work compared to those in urban area whoare considered to have limited exposure to manual tasks.
We randomly selected these students from various groups whom we know to use computers mostof the time. Although most respondents were BS Computer Science students, because they usedcomputers in almost all of their subjects, we have also selected students from other courses thathad computer laboratories in one or more of their subjects. The sampled population composedof mostly sophomore, junior, and senior students. Upon obtaining informed consents from all therespondents, we measured the finger dimensions of each hand of 41 male and 50 female studentsfollowing a meticulous and strict procedure similar to the one outlined in Greiner (1992).
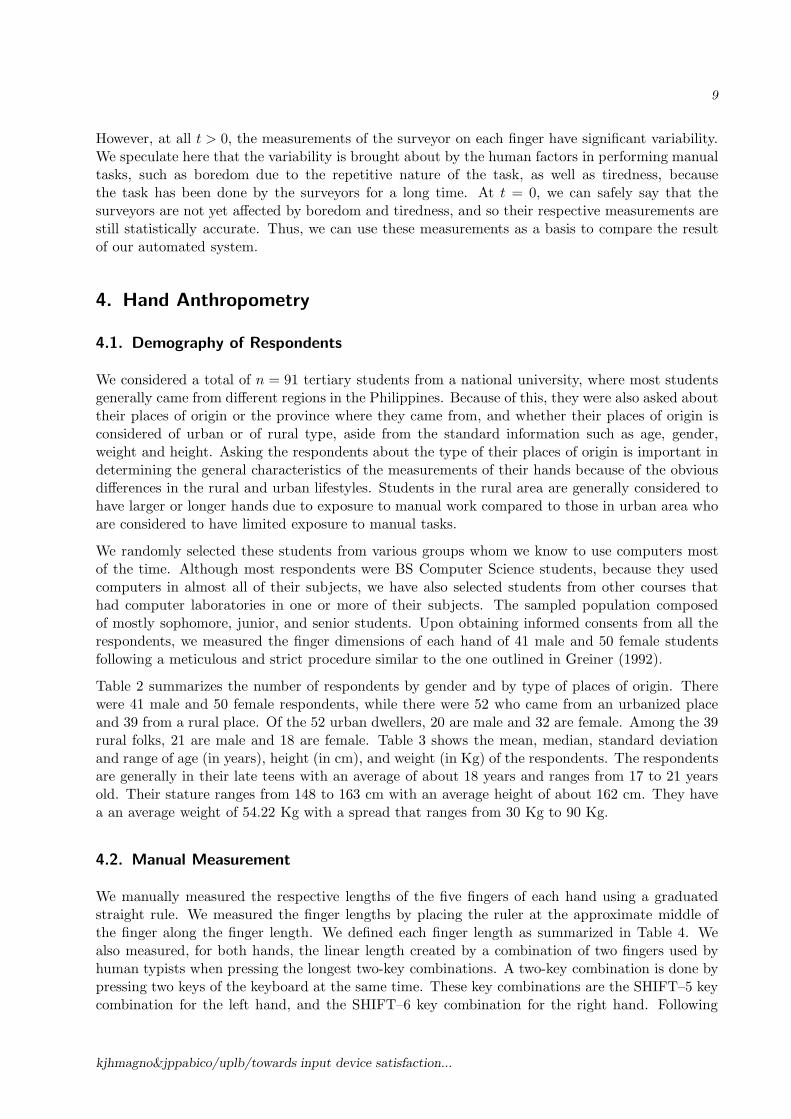
Table 2 summarizes the number of respondents by gender and by type of places of origin. Therewere 41 male and 50 female respondents, while there were 52 who came from an urbanized placeand 39 from a rural place. Of the 52 urban dwellers, 20 are male and 32 are female. Among the 39rural folks, 21 are male and 18 are female. Table 3 shows the mean, median, standard deviationand range of age (in years), height (in cm), and weight (in Kg) of the respondents. The respondentsare generally in their late teens with an average of about 18 years and ranges from 17 to 21 yearsold. Their stature ranges from 148 to 163 cm with an average height of about 162 cm. They havea an average weight of 54.22 Kg with a spread that ranges from 30 Kg to 90 Kg.
4.2. Manual Measurement
We manually measured the respective lengths of the five fingers of each hand using a graduatedstraight rule. We measured the finger lengths by placing the ruler at the approximate middle ofthe finger along the finger length. We defined each finger length as summarized in Table 4. Wealso measured, for both hands, the linear length created by a combination of two fingers used byhuman typists when pressing the longest two-key combinations. A two-key combination is done bypressing two keys of the keyboard at the same time. These key combinations are the SHIFT–5 keycombination for the left hand, and the SHIFT–6 key combination for the right hand. Following
kjhmagno&jppabico/uplb/towards input device satisfaction...
10
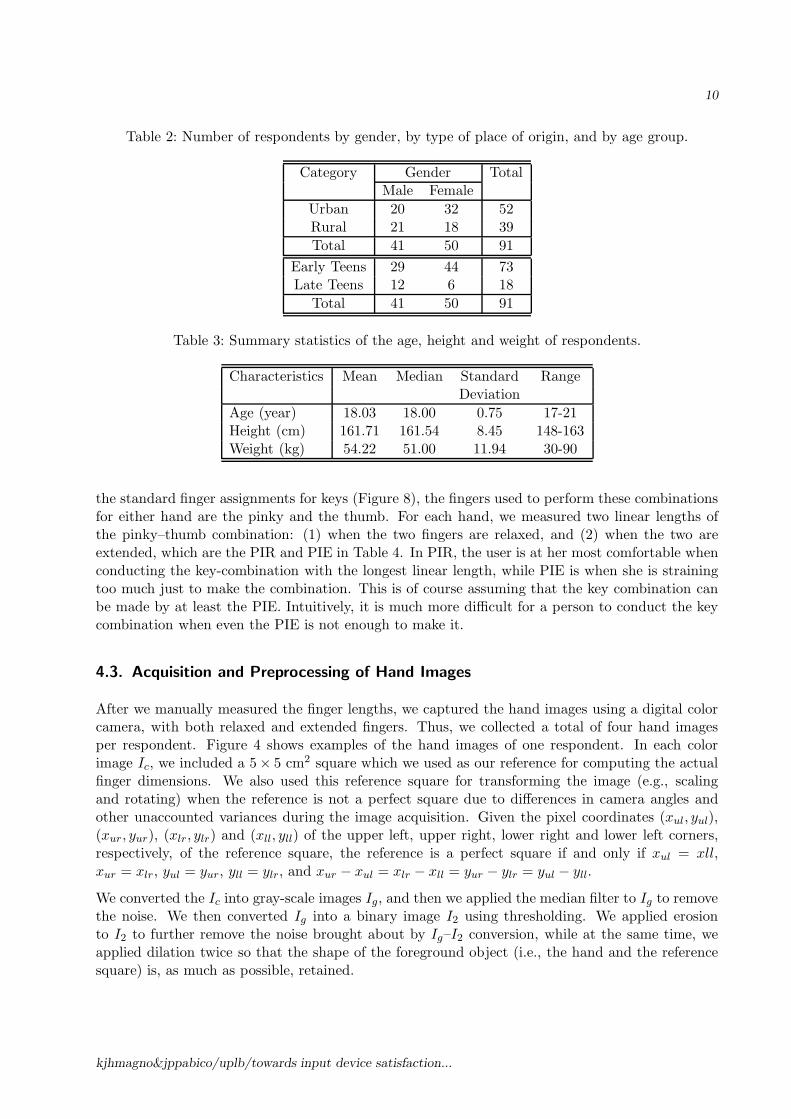
Table 2: Number of respondents by gender, by type of place of origin, and by age group.
Category Gender TotalMale Female
Urban 20 32 52Rural 21 18 39
Total 41 50 91
Early Teens 29 44 73Late Teens 12 6 18
Total 41 50 91
Table 3: Summary statistics of the age, height and weight of respondents.
Characteristics Mean Median Standard RangeDeviation
Age (year) 18.03 18.00 0.75 17-21Height (cm) 161.71 161.54 8.45 148-163Weight (kg) 54.22 51.00 11.94 30-90
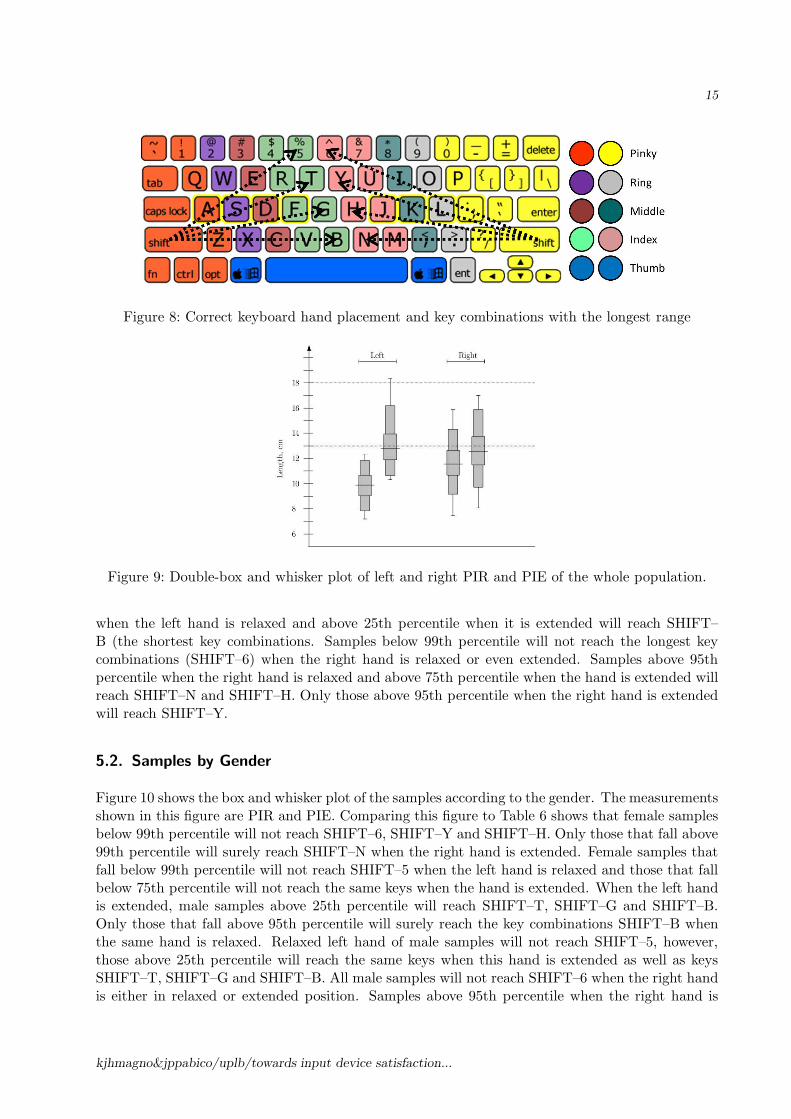
the standard finger assignments for keys (Figure 8), the fingers used to perform these combinationsfor either hand are the pinky and the thumb. For each hand, we measured two linear lengths ofthe pinky–thumb combination: (1) when the two fingers are relaxed, and (2) when the two areextended, which are the PIR and PIE in Table 4. In PIR, the user is at her most comfortable whenconducting the key-combination with the longest linear length, while PIE is when she is strainingtoo much just to make the combination. This is of course assuming that the key combination canbe made by at least the PIE. Intuitively, it is much more difficult for a person to conduct the keycombination when even the PIE is not enough to make it.
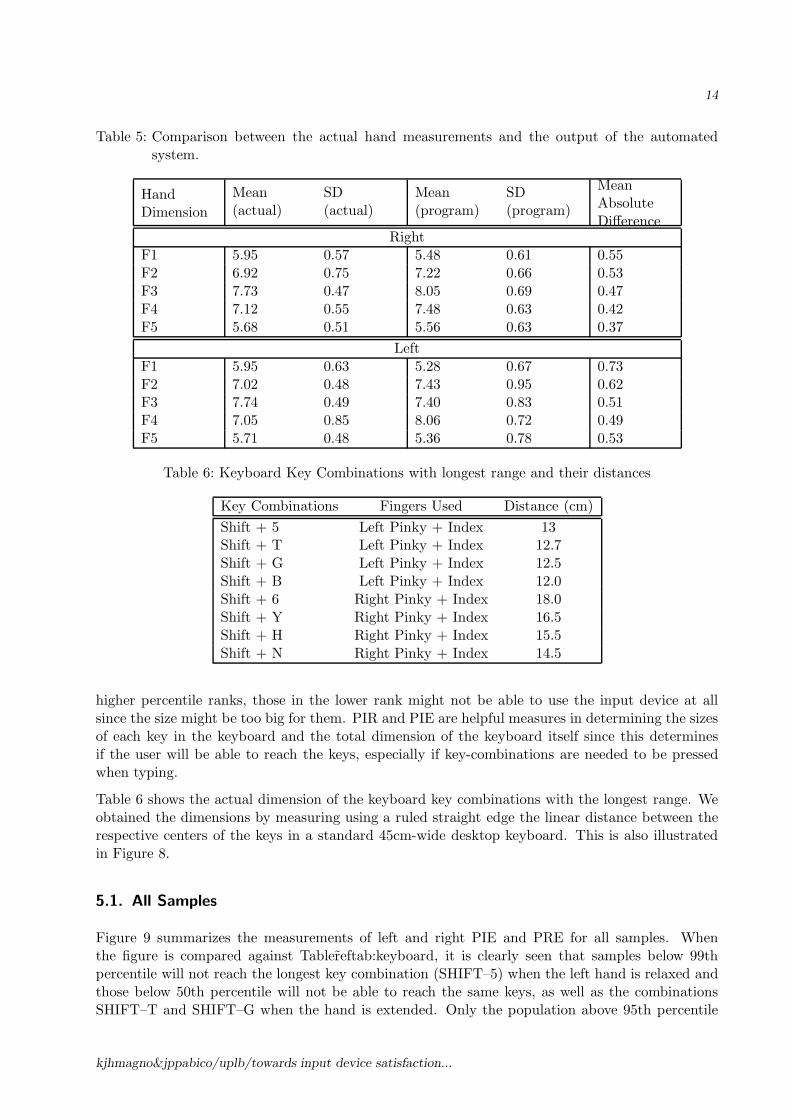
4.3. Acquisition and Preprocessing of Hand Images
After we manually measured the finger lengths, we captured the hand images using a digital colorcamera, with both relaxed and extended fingers. Thus, we collected a total of four hand imagesper respondent. Figure 4 shows examples of the hand images of one respondent. In each colorimage Ic, we included a 5× 5 cm2 square which we used as our reference for computing the actualfinger dimensions. We also used this reference square for transforming the image (e.g., scalingand rotating) when the reference is not a perfect square due to differences in camera angles andother unaccounted variances during the image acquisition. Given the pixel coordinates (xul, yul),(xur, yur), (xlr, ylr) and (xll, yll) of the upper left, upper right, lower right and lower left corners,respectively, of the reference square, the reference is a perfect square if and only if xul = xll,xur = xlr, yul = yur, yll = ylr, and xur − xul = xlr − xll = yur − ylr = yul − yll.
We converted the Ic into gray-scale images Ig, and then we applied the median filter to Ig to removethe noise. We then converted Ig into a binary image I2 using thresholding. We applied erosionto I2 to further remove the noise brought about by Ig–I2 conversion, while at the same time, weapplied dilation twice so that the shape of the foreground object (i.e., the hand and the referencesquare) is, as much as possible, retained.
kjhmagno&jppabico/uplb/towards input device satisfaction...
11
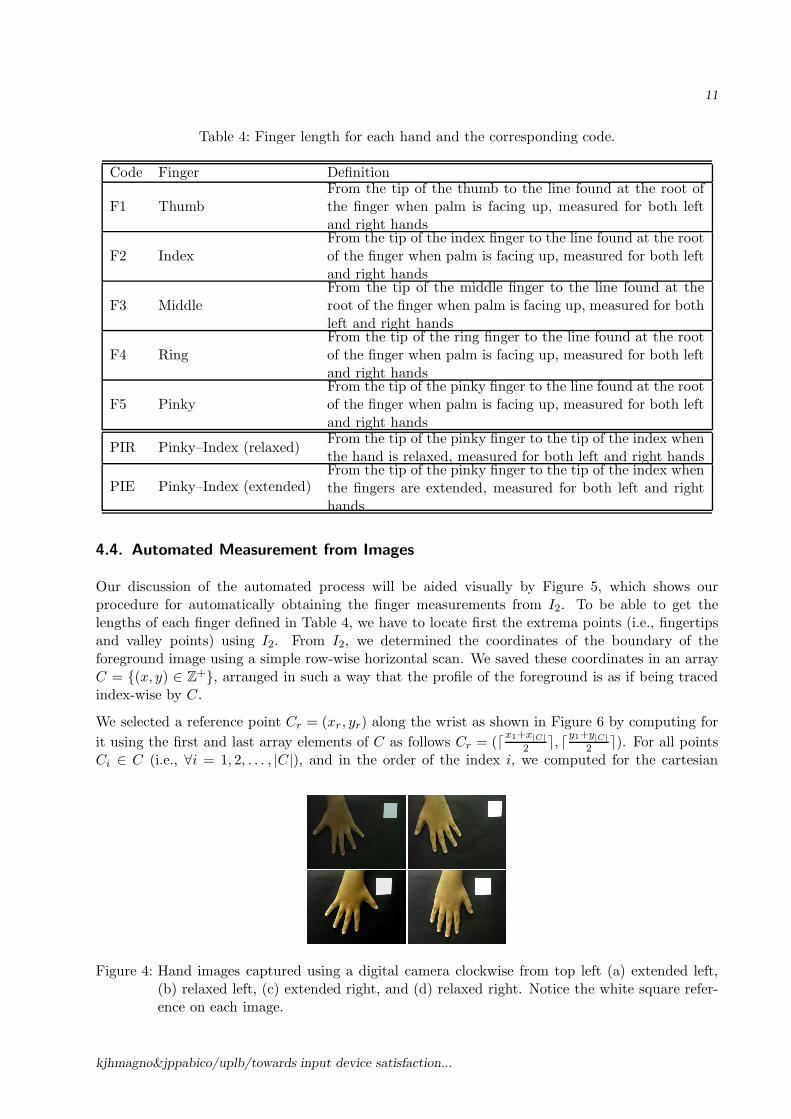
Table 4: Finger length for each hand and the corresponding code.
Code Finger Definition
F1 ThumbFrom the tip of the thumb to the line found at the root ofthe finger when palm is facing up, measured for both leftand right hands
F2 IndexFrom the tip of the index finger to the line found at the rootof the finger when palm is facing up, measured for both leftand right hands
F3 MiddleFrom the tip of the middle finger to the line found at theroot of the finger when palm is facing up, measured for bothleft and right hands
F4 RingFrom the tip of the ring finger to the line found at the rootof the finger when palm is facing up, measured for both leftand right hands
F5 PinkyFrom the tip of the pinky finger to the line found at the rootof the finger when palm is facing up, measured for both leftand right hands
PIR Pinky–Index (relaxed)From the tip of the pinky finger to the tip of the index whenthe hand is relaxed, measured for both left and right hands
PIE Pinky–Index (extended)From the tip of the pinky finger to the tip of the index whenthe fingers are extended, measured for both left and righthands
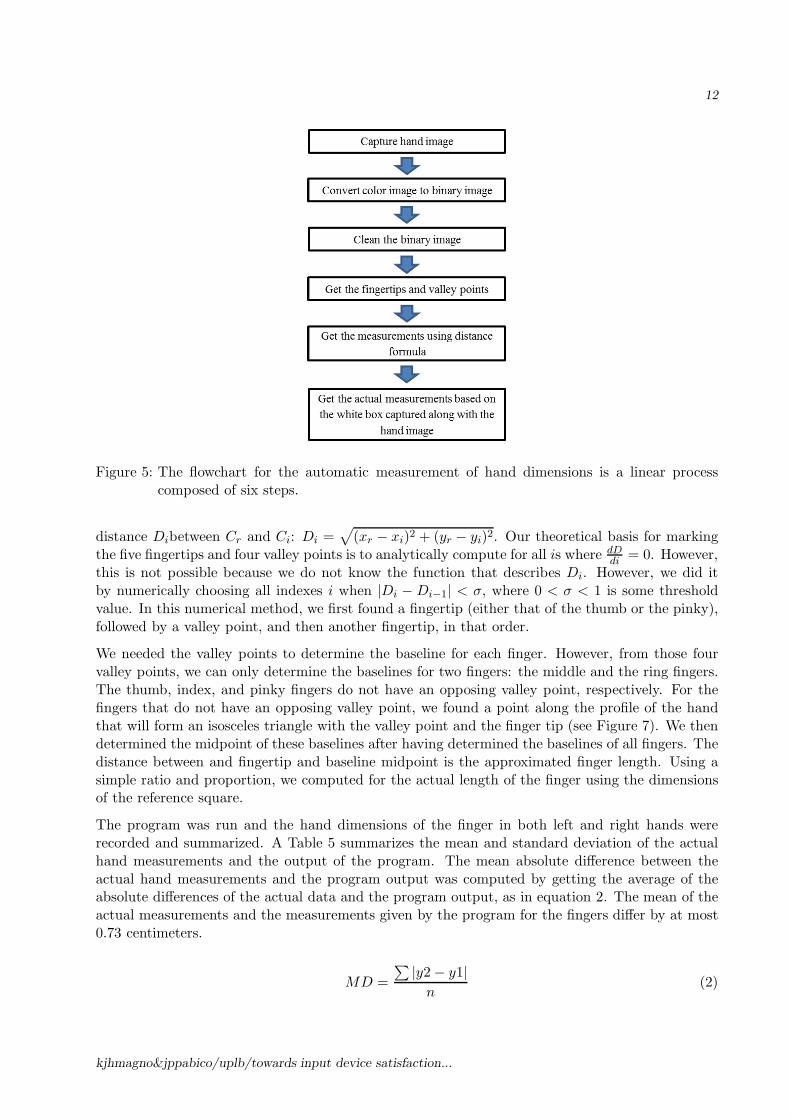
4.4. Automated Measurement from Images
Our discussion of the automated process will be aided visually by Figure 5, which shows ourprocedure for automatically obtaining the finger measurements from I2. To be able to get thelengths of each finger defined in Table 4, we have to locate first the extrema points (i.e., fingertipsand valley points) using I2. From I2, we determined the coordinates of the boundary of theforeground image using a simple row-wise horizontal scan. We saved these coordinates in an arrayC = {(x, y) ∈ Z
+}, arranged in such a way that the profile of the foreground is as if being tracedindex-wise by C.
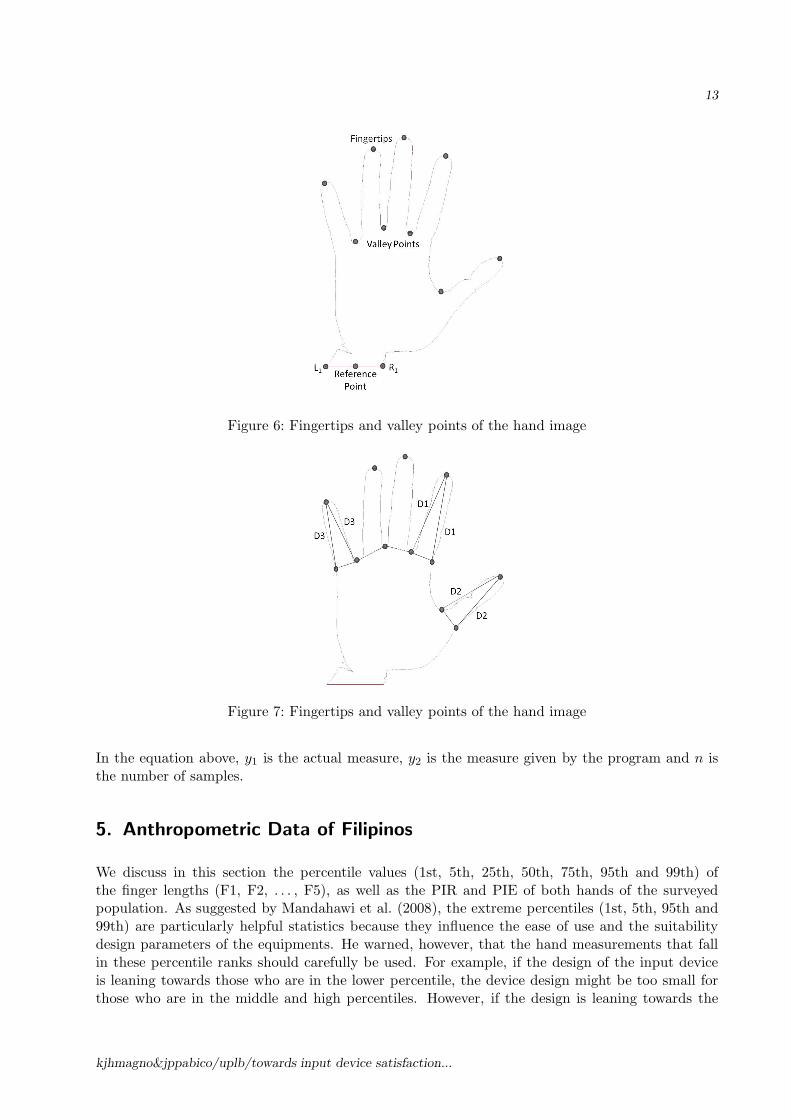
We selected a reference point Cr = (xr, yr) along the wrist as shown in Figure 6 by computing for
it using the first and last array elements of C as follows Cr = (⌈x1+x|C|
2⌉, ⌈
y1+y|C|
2⌉). For all points
Ci ∈ C (i.e., ∀i = 1, 2, . . . , |C|), and in the order of the index i, we computed for the cartesian
Figure 4: Hand images captured using a digital camera clockwise from top left (a) extended left,(b) relaxed left, (c) extended right, and (d) relaxed right. Notice the white square refer-ence on each image.
kjhmagno&jppabico/uplb/towards input device satisfaction...
12
Figure 5: The flowchart for the automatic measurement of hand dimensions is a linear processcomposed of six steps.
distance Dibetween Cr and Ci: Di =√
(xr − xi)2 + (yr − yi)2. Our theoretical basis for markingthe five fingertips and four valley points is to analytically compute for all is where dD
di= 0. However,
this is not possible because we do not know the function that describes Di. However, we did itby numerically choosing all indexes i when |Di − Di−1| < σ, where 0 < σ < 1 is some thresholdvalue. In this numerical method, we first found a fingertip (either that of the thumb or the pinky),followed by a valley point, and then another fingertip, in that order.
We needed the valley points to determine the baseline for each finger. However, from those fourvalley points, we can only determine the baselines for two fingers: the middle and the ring fingers.The thumb, index, and pinky fingers do not have an opposing valley point, respectively. For thefingers that do not have an opposing valley point, we found a point along the profile of the handthat will form an isosceles triangle with the valley point and the finger tip (see Figure 7). We thendetermined the midpoint of these baselines after having determined the baselines of all fingers. Thedistance between and fingertip and baseline midpoint is the approximated finger length. Using asimple ratio and proportion, we computed for the actual length of the finger using the dimensionsof the reference square.
The program was run and the hand dimensions of the finger in both left and right hands wererecorded and summarized. A Table 5 summarizes the mean and standard deviation of the actualhand measurements and the output of the program. The mean absolute difference between theactual hand measurements and the program output was computed by getting the average of theabsolute differences of the actual data and the program output, as in equation 2. The mean of theactual measurements and the measurements given by the program for the fingers differ by at most0.73 centimeters.
MD =
∑
|y2− y1|
n(2)
kjhmagno&jppabico/uplb/towards input device satisfaction...
13
Figure 6: Fingertips and valley points of the hand image
Figure 7: Fingertips and valley points of the hand image
In the equation above, y1 is the actual measure, y2 is the measure given by the program and n isthe number of samples.
5. Anthropometric Data of Filipinos
We discuss in this section the percentile values (1st, 5th, 25th, 50th, 75th, 95th and 99th) ofthe finger lengths (F1, F2, . . . , F5), as well as the PIR and PIE of both hands of the surveyedpopulation. As suggested by Mandahawi et al. (2008), the extreme percentiles (1st, 5th, 95th and99th) are particularly helpful statistics because they influence the ease of use and the suitabilitydesign parameters of the equipments. He warned, however, that the hand measurements that fallin these percentile ranks should carefully be used. For example, if the design of the input deviceis leaning towards those who are in the lower percentile, the device design might be too small forthose who are in the middle and high percentiles. However, if the design is leaning towards the
kjhmagno&jppabico/uplb/towards input device satisfaction...
14
Table 5: Comparison between the actual hand measurements and the output of the automatedsystem.
HandDimension
Mean(actual)
SD(actual)
Mean(program)
SD(program)
MeanAbsoluteDifference
RightF1 5.95 0.57 5.48 0.61 0.55F2 6.92 0.75 7.22 0.66 0.53F3 7.73 0.47 8.05 0.69 0.47F4 7.12 0.55 7.48 0.63 0.42F5 5.68 0.51 5.56 0.63 0.37
LeftF1 5.95 0.63 5.28 0.67 0.73F2 7.02 0.48 7.43 0.95 0.62F3 7.74 0.49 7.40 0.83 0.51F4 7.05 0.85 8.06 0.72 0.49F5 5.71 0.48 5.36 0.78 0.53
Table 6: Keyboard Key Combinations with longest range and their distances
Key Combinations Fingers Used Distance (cm)
Shift + 5 Left Pinky + Index 13Shift + T Left Pinky + Index 12.7Shift + G Left Pinky + Index 12.5Shift + B Left Pinky + Index 12.0Shift + 6 Right Pinky + Index 18.0Shift + Y Right Pinky + Index 16.5Shift + H Right Pinky + Index 15.5Shift + N Right Pinky + Index 14.5
higher percentile ranks, those in the lower rank might not be able to use the input device at allsince the size might be too big for them. PIR and PIE are helpful measures in determining the sizesof each key in the keyboard and the total dimension of the keyboard itself since this determinesif the user will be able to reach the keys, especially if key-combinations are needed to be pressedwhen typing.
Table 6 shows the actual dimension of the keyboard key combinations with the longest range. Weobtained the dimensions by measuring using a ruled straight edge the linear distance between therespective centers of the keys in a standard 45cm-wide desktop keyboard. This is also illustratedin Figure 8.
5.1. All Samples
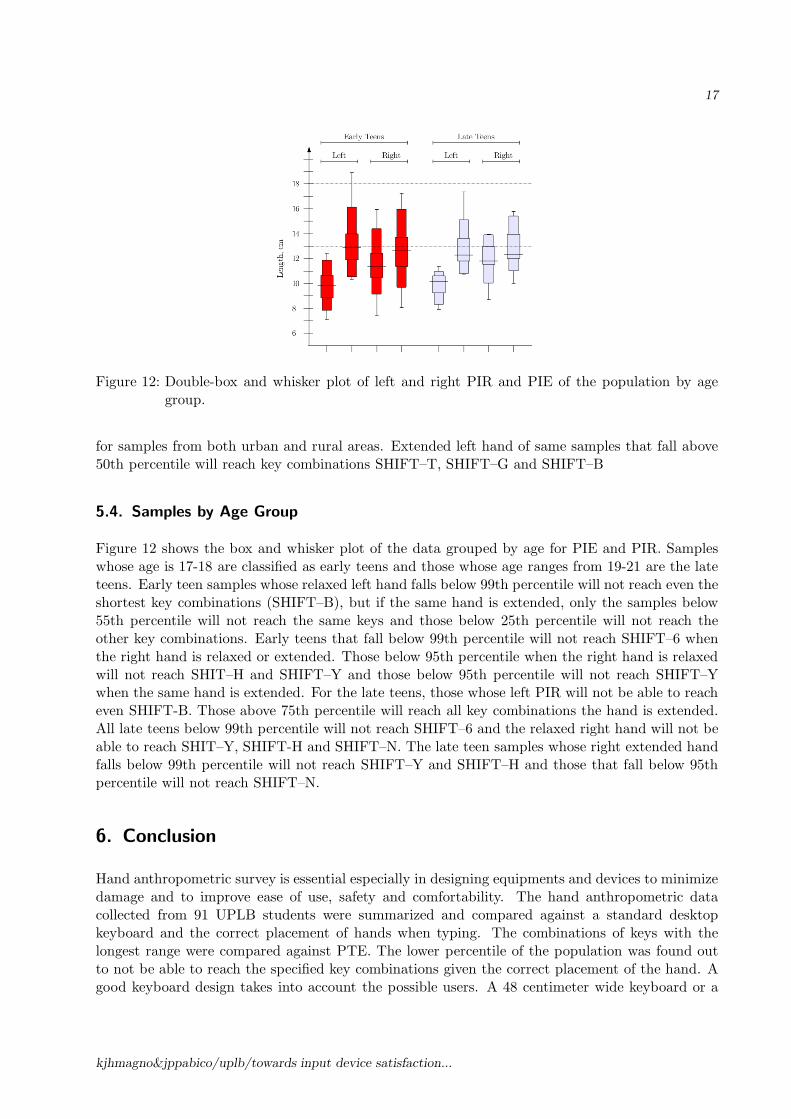
Figure 9 summarizes the measurements of left and right PIE and PRE for all samples. Whenthe figure is compared against Tablereftab:keyboard, it is clearly seen that samples below 99thpercentile will not reach the longest key combination (SHIFT–5) when the left hand is relaxed andthose below 50th percentile will not be able to reach the same keys, as well as the combinationsSHIFT–T and SHIFT–G when the hand is extended. Only the population above 95th percentile
kjhmagno&jppabico/uplb/towards input device satisfaction...
15
Figure 8: Correct keyboard hand placement and key combinations with the longest range
Figure 9: Double-box and whisker plot of left and right PIR and PIE of the whole population.
when the left hand is relaxed and above 25th percentile when it is extended will reach SHIFT–B (the shortest key combinations. Samples below 99th percentile will not reach the longest keycombinations (SHIFT–6) when the right hand is relaxed or even extended. Samples above 95thpercentile when the right hand is relaxed and above 75th percentile when the hand is extended willreach SHIFT–N and SHIFT–H. Only those above 95th percentile when the right hand is extendedwill reach SHIFT–Y.
5.2. Samples by Gender
Figure 10 shows the box and whisker plot of the samples according to the gender. The measurementsshown in this figure are PIR and PIE. Comparing this figure to Table 6 shows that female samplesbelow 99th percentile will not reach SHIFT–6, SHIFT–Y and SHIFT–H. Only those that fall above99th percentile will surely reach SHIFT–N when the right hand is extended. Female samples thatfall below 99th percentile will not reach SHIFT–5 when the left hand is relaxed and those that fallbelow 75th percentile will not reach the same keys when the hand is extended. When the left handis extended, male samples above 25th percentile will reach SHIFT–T, SHIFT–G and SHIFT–B.Only those that fall above 95th percentile will surely reach the key combinations SHIFT–B whenthe same hand is relaxed. Relaxed left hand of male samples will not reach SHIFT–5, however,those above 25th percentile will reach the same keys when this hand is extended as well as keysSHIFT–T, SHIFT–G and SHIFT–B. All male samples will not reach SHIFT–6 when the right handis either in relaxed or extended position. Samples above 95th percentile when the right hand is
kjhmagno&jppabico/uplb/towards input device satisfaction...

16
Figure 10: Double-box and whisker plot of left and right PIR and PIE of the population by gender.
Figure 11: Double-box and whisker plot of left and right PIR and PIE of the population by typeof location of origin.
relaxed SHIFT–H and SHIFT–N and those above 75th percentile when the hand is extended willreach the same keys when the hand is extended.
5.3. Samples by Type of Location
Samples from urban area that fall below 99th percentile will not reach SHIFT–6 whether the handsare in relaxed or in extended position as seen in the box and whisker plot of left and right PIEand PIR of samples according to their place of origin (Figure 11). Similarly, those from rural areawhose PIR is below 99th percentile will not reach even the shortest key combinations and thesamples below 75th percentile of the extended hand will not reach the same key. Samples fromurban area will that fall below 95th percentile both for extended and relaxed right hand will notreach the shortest key combinations as well. Relaxed left hand of samples both from rural andurban area will not reach SHIFT–5 while those below 75th percentile will not reach the same keycombination. Only those above 99th percentile will reach SHIFT–B when the left hand is relaxed
kjhmagno&jppabico/uplb/towards input device satisfaction...
17
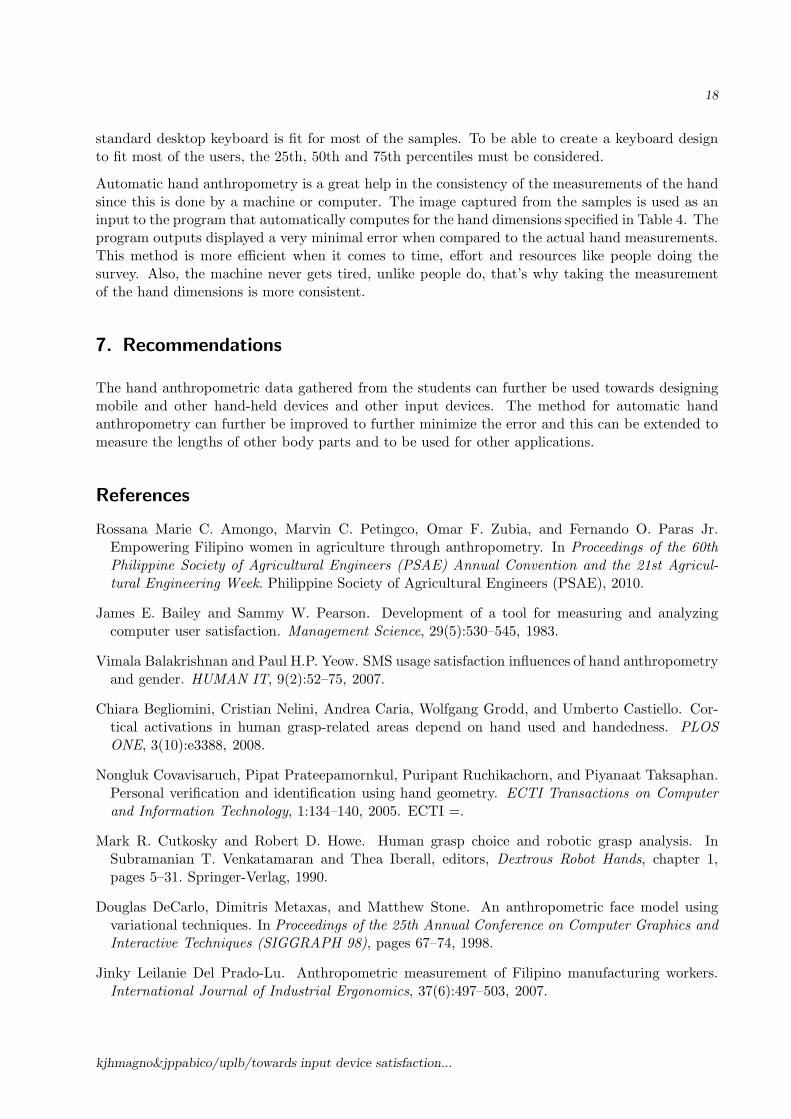
Figure 12: Double-box and whisker plot of left and right PIR and PIE of the population by agegroup.
for samples from both urban and rural areas. Extended left hand of same samples that fall above50th percentile will reach key combinations SHIFT–T, SHIFT–G and SHIFT–B
5.4. Samples by Age Group
Figure 12 shows the box and whisker plot of the data grouped by age for PIE and PIR. Sampleswhose age is 17-18 are classified as early teens and those whose age ranges from 19-21 are the lateteens. Early teen samples whose relaxed left hand falls below 99th percentile will not reach even theshortest key combinations (SHIFT–B), but if the same hand is extended, only the samples below55th percentile will not reach the same keys and those below 25th percentile will not reach theother key combinations. Early teens that fall below 99th percentile will not reach SHIFT–6 whenthe right hand is relaxed or extended. Those below 95th percentile when the right hand is relaxedwill not reach SHIT–H and SHIFT–Y and those below 95th percentile will not reach SHIFT–Ywhen the same hand is extended. For the late teens, those whose left PIR will not be able to reacheven SHIFT-B. Those above 75th percentile will reach all key combinations the hand is extended.All late teens below 99th percentile will not reach SHIFT–6 and the relaxed right hand will not beable to reach SHIT–Y, SHIFT-H and SHIFT–N. The late teen samples whose right extended handfalls below 99th percentile will not reach SHIFT–Y and SHIFT–H and those that fall below 95thpercentile will not reach SHIFT–N.
6. Conclusion
Hand anthropometric survey is essential especially in designing equipments and devices to minimizedamage and to improve ease of use, safety and comfortability. The hand anthropometric datacollected from 91 UPLB students were summarized and compared against a standard desktopkeyboard and the correct placement of hands when typing. The combinations of keys with thelongest range were compared against PTE. The lower percentile of the population was found outto not be able to reach the specified key combinations given the correct placement of the hand. Agood keyboard design takes into account the possible users. A 48 centimeter wide keyboard or a
kjhmagno&jppabico/uplb/towards input device satisfaction...
18
standard desktop keyboard is fit for most of the samples. To be able to create a keyboard designto fit most of the users, the 25th, 50th and 75th percentiles must be considered.
Automatic hand anthropometry is a great help in the consistency of the measurements of the handsince this is done by a machine or computer. The image captured from the samples is used as aninput to the program that automatically computes for the hand dimensions specified in Table 4. Theprogram outputs displayed a very minimal error when compared to the actual hand measurements.This method is more efficient when it comes to time, effort and resources like people doing thesurvey. Also, the machine never gets tired, unlike people do, that’s why taking the measurementof the hand dimensions is more consistent.
7. Recommendations
The hand anthropometric data gathered from the students can further be used towards designingmobile and other hand-held devices and other input devices. The method for automatic handanthropometry can further be improved to further minimize the error and this can be extended tomeasure the lengths of other body parts and to be used for other applications.
References
Rossana Marie C. Amongo, Marvin C. Petingco, Omar F. Zubia, and Fernando O. Paras Jr.Empowering Filipino women in agriculture through anthropometry. In Proceedings of the 60thPhilippine Society of Agricultural Engineers (PSAE) Annual Convention and the 21st Agricul-tural Engineering Week. Philippine Society of Agricultural Engineers (PSAE), 2010.
James E. Bailey and Sammy W. Pearson. Development of a tool for measuring and analyzingcomputer user satisfaction. Management Science, 29(5):530–545, 1983.
Vimala Balakrishnan and Paul H.P. Yeow. SMS usage satisfaction influences of hand anthropometryand gender. HUMAN IT, 9(2):52–75, 2007.
Chiara Begliomini, Cristian Nelini, Andrea Caria, Wolfgang Grodd, and Umberto Castiello. Cor-tical activations in human grasp-related areas depend on hand used and handedness. PLOSONE, 3(10):e3388, 2008.
Nongluk Covavisaruch, Pipat Prateepamornkul, Puripant Ruchikachorn, and Piyanaat Taksaphan.Personal verification and identification using hand geometry. ECTI Transactions on Computerand Information Technology, 1:134–140, 2005. ECTI =.
Mark R. Cutkosky and Robert D. Howe. Human grasp choice and robotic grasp analysis. InSubramanian T. Venkatamaran and Thea Iberall, editors, Dextrous Robot Hands, chapter 1,pages 5–31. Springer-Verlag, 1990.
Douglas DeCarlo, Dimitris Metaxas, and Matthew Stone. An anthropometric face model usingvariational techniques. In Proceedings of the 25th Annual Conference on Computer Graphics andInteractive Techniques (SIGGRAPH 98), pages 67–74, 1998.
Jinky Leilanie Del Prado-Lu. Anthropometric measurement of Filipino manufacturing workers.International Journal of Industrial Ergonomics, 37(6):497–503, 2007.
kjhmagno&jppabico/uplb/towards input device satisfaction...
19
Coskun Dizmen. Hand anthropometry analysis and construction of regression models for a HongKong sample. Procedings of the International MultiConference of Engineers and Computer Sci-entists, 2, 2012.
Marianne Dooley. Anthropometric modeling programs – A survey. IEEE Computer Graphics andApplications, 2(9):17–25, 1982.
David B. Duncan. Multiple range and multiple F tests. Biometrics, 11(1):1–42, 1955.
Leslie G. Farkas. Anthropometry of the Head and Face. Raven Press, 1994.
T.M. Greiner. Hand anthropometry of U.S. Army personnel. Technical report, US Army Research,Development and Engineering Center, Natick, MA, 1992.
Judith Hall, Judith Allanson, Karen Gripp, and Anne Slavotinek. Handbook of Physical Measure-ments. Oxford University Press, 2nd edition, 2006.
Syeda Zamila Hasan Laila, Roxana Ferdousi, ABM Nurunnobi, ATM Shafiqul Islam, SyedaZamila Hosen Holy, and Farzana Yesmin. Anthropometric measurements of the hand lengthand their correlation with the stature of Bengali adult Muslim females. Bangladesh Journal ofAnatomy, 7:10–13, 2009.
Nabeel Mandahawi, Sheik Imrhan, Salman Al-Shobaki, and B. Sarder. Hand anthropometry surveyfor the Jordanian population. International Journal of Industrial Ergonomics, 38:966–976, 2008.
Mary Walpole Markze. Origin of the human hand. American Journal of Physical Anthropology, 34(1):61–64, 1971.
Rudolf Melcher, Reinhard Sefelin, Verena Giller, and Manfred Tscheligi. Improving the user expe-rience on mobile devices and services. In Proceedings of the Telecommunication and MobileComputing Conference, 2003.
National Health and Nutrition Examination Survey. Anthropometry Procedures Manual. Centersfor Disease Control and Prevention, 1600 Clifton Rd., Atlanta, GA 30333, USA, 2007.
Charles Ruel Novabos. Anthropometric and other ergonomic interventions in the design of theFilipino pedicab. In First Conference of the Southeast Asian Network of Ergonomics Societies(SEANES), 2010.
Charles Ruel Novabos. The application of Filipino anthropometric data on the design of houserooms and furniture. In First National Conference of the Human Factors and Ergonomics Socityof the Philippines (HFESP), 2012.
Victor R. Preedy, editor. Handbook of Anthropometry: Physical Measures of Human Form in Healthand Disease, volume 1. Springer, 2012.
Spencer Lee Rogers. Personal Identification from Human Remains. Charles C. Thomas Publisher,LTD, 1984.
Christine B. Timoteo-Afinidad. Workstation and workspace ergonomics in Philippine libraries: Anemerging priority. Journal of Philippine Librarianship, 30(1):21–44, 2010.
Stanley J. Ulijaszek and C.G. Nicholas Mascie-Taylor, editors. Anthropology: The Individual andthe Population (Cambridge Studies in Biological and Evolutionary Anthropology). CambridgeUniversity Press, 1994.
kjhmagno&jppabico/uplb/towards input device satisfaction...

20
Chin Chin Wong and Leang Hiew Pang. Correlations between factors affecting the diffusion ofmobile entertainment in Malaysia. In Proceedings of the 7th International Conference on Elec-tronic Commerce, pages 615–621, 2005.
kjhmagno&jppabico/uplb/towards input device satisfaction...