Embed Size (px)
Citation preview
arX
iv:1
304.
1559
v2 [
astr
o-ph
.GA
] 1
6 Ju
l 201
3
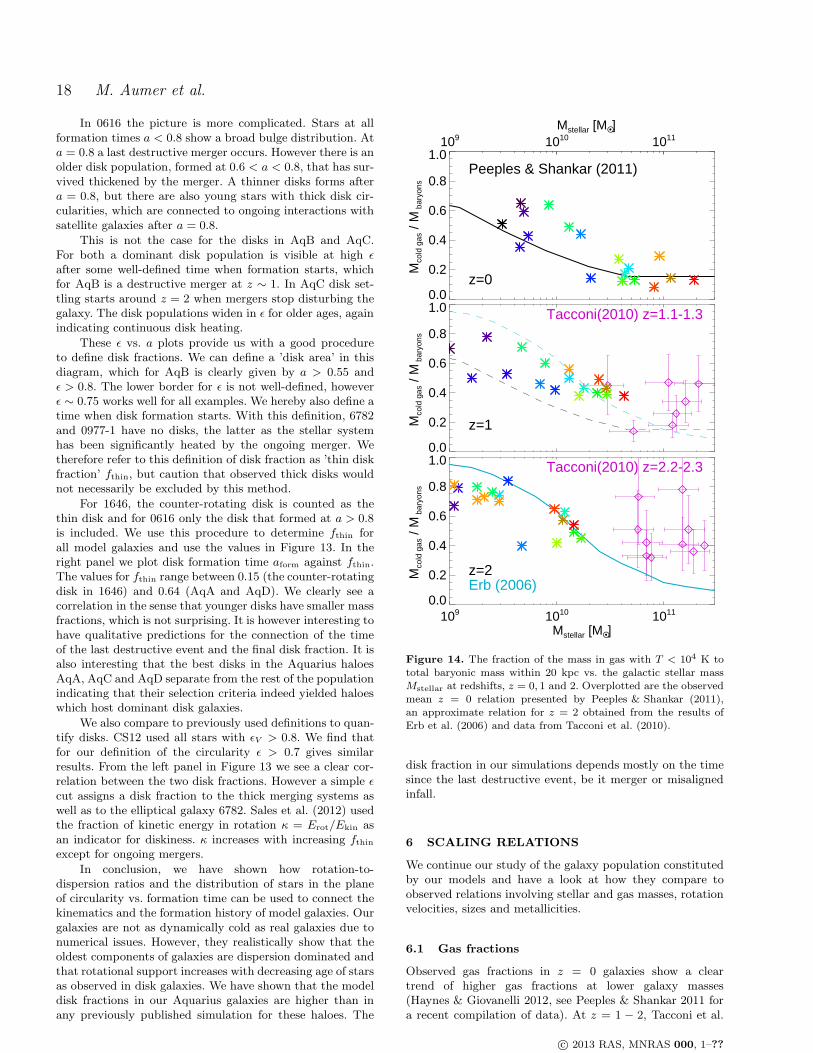
Mon. Not. R. Astron. Soc. 000, 1–?? (2013) Printed 17 July 2013 (MN LATEX style file v2.2)
Towards a more realistic population of bright spiral
galaxies in cosmological simulations
Michael Aumer1,2 ⋆, Simon D.M. White1, Thorsten Naab1, Cecilia Scannapieco31Max-Planck-Institut fur Astrophysik, Karl-Schwarzschild-Str. 1, 85748 Garching, Germany2Excellence Cluster Universe, Boltzmannstr. 2, 85748 Garching, Germany3Leibniz-Institut fur Astrophysik Potsdam (AIP), An der Sternwarte 16, 14482 Potsdam, Germany
Accepted 2013 July 03. Received 2013 July 02; in original form 2013 March 28
ABSTRACT
We present an update to the multiphase SPH galaxy formation code by Scannapieco etal. We include a more elaborate treatment of the production of metals, cooling ratesbased on individual element abundances, and a scheme for the turbulent diffusionof metals. Our SN feedback model now transfers energy to the ISM in kinetic andthermal form, and we include a prescription for the effects of radiation pressure frommassive young stars on the ISM. We calibrate our new code on the well studiedAquarius haloes and then use it to simulate a sample of 16 galaxies with halo massesbetween 1 × 10¹¹ and 3 × 10¹²M⊙. In general, the stellar masses of the sample agreewell with the stellar mass to halo mass relation inferred from abundance matchingtechniques for redshifts z = 0 − 4. There is however a tendency to overproduce starsat z > 4 and to underproduce them at z < 0.5 in the least massive haloes. Overlyhigh SFRs at z < 1 for the most massive haloes are likely connected to the lack ofAGN feedback in our model. The simulated sample also shows reasonable agreementwith observed star formation rates, sizes, gas fractions and gas-phase metallicities atz = 0 − 3. Remaining discrepancies can be connected to deviations from predictionsfor star formation histories from abundance matching. At z = 0, the model galaxiesshow realistic morphologies, stellar surface density profiles, circular velocity curves andstellar metallicities, but overly flat metallicity gradients. 15 out of 16 of our galaxiescontain disk components with kinematic disk fraction ranging between 15 and 65 %.The disk fraction depends on the time of the last destructive merger or misalignedinfall event. Considering the remaining shortcomings of our simulations we concludethat even higher kinematic disk fractions may be possible for ΛCDM haloes with quietmerger histories, such as the Aquarius haloes.
Key words: methods: numerical - galaxies:formation - galaxies:evolution - galax-ies:kinematics and dynamics - galaxies:structure;
1 INTRODUCTION
In the standard paradigm of cosmic structure forma-tion, galaxies form through cooling and condensationof gas within dark matter haloes (White & Rees 1978;Fall & Efstathiou 1980). Collisionless N-body simulations ofthe dark matter component have been able to reproduce theobserved large-scale structure of the universe with high ac-curacy in the Λ Cold Dark Matter (ΛCDM) version of thisparadigm (Springel et al. 2006). Semi-analytic models rely-ing on these simulations and simple analytical prescriptionsfor the baryonic component are capable of reproducing thedetailed systematics of the galaxy population (Guo et al.
⋆ E-mail:[email protected] (MA)
2011). To properly understand the complex dynamical in-teractions between gas, stars and dark matter in galaxiesrequires however cosmological hydrodynamical simulations.
The complexity of properly modeling the manybaryonic astrophysical processes which play a role inthe formation of galaxies has led to a long list of mod-els over the last two decades (e.g. Navarro & White1994; Navarro & Steinmetz 1997; Abadi et al. 2003;Governato et al. 2007; Scannapieco et al. 2009; Agertz et al.2011). Despite significant recent progress (e.g. Sales et al.2012; Guedes et al. 2011; Brook et al. 2012), these sim-ulations continue to be plagued by a range of problems,with different codes often producing very different galaxiesfor the same initial conditions (Okamoto et al. 2005;Keres et al. 2011; Scannapieco et al. 2012).
c© 2013 RAS
2 M. Aumer et al.
The formation of realistic disc galaxies has been shownto be especially problematic. The cooling and condensationof too much low-angular momentum gas (overcooling) andthe loss of angular momentum from baryons to the darkmatter have been a problem since the first efforts to simu-late cosmological galaxy formation (Navarro & Benz 1991).Once disks have formed they have been shown to be suscep-tible to destruction by major mergers (Toomre & Toomre1972), by the infall of satellite galaxies (Toth & Ostriker1992) and by accretion of misaligned gas (Scannapieco et al.2009)(CS09 hereafter). Moreover, the reorientation of disks(Aumer & White 2013; Okamoto 2013) and disk instabili-ties (e.g. Noguchi 1999; Aumer et al. 2010) can enhance thebulge-to-disk ratio.
In addition to these problems, stellar mass to halomass relations from abundance matching techniques haveshown that the majority of simulations over-produce stars(Guo et al. 2010; Sawala et al. 2011), especially at high z(CS09, Moster et al. 2013).
Modeling the injection of energy from supernova ex-plosions into the surrounding gas (e.g. Scannapieco et al.2006; Stinson et al. 2006) has been shown to be a possi-ble mechanism to prevent overly efficient gas cooling, fordriving large-scale outflows, for removing low angular mo-mentum material and thus for producing more realistic diskgalaxies (e.g. Scannapieco et al. 2008; Brook et al. 2011). In-terestingly, simulations applying rather weak feedback havebeen shown to be more successful in reproducing early-typegalaxies (Naab et al. 2007; Oser et al. 2010; Johansson et al.2012). Apart from supernovae, AGN (e.g. Springel et al.2005) and cosmic rays (Uhlig et al. 2012) have been con-sidered as possible sources of feedback.
Simulations including empirical models of momentum-driven winds have been shown to improve the agree-ment with observed properties of the galaxy populationand the intergalactic medium (Oppenheimer & Dave 2006;Oppenheimer et al. 2010). Recently, the input of momen-tum and energy from massive young stars in form of stel-lar winds and radiation pressure prior to their explosion asSNe has been studied in more detail. Hopkins et al. (2011)showed that momentum input into the ISM from radia-tion pressure may play a key role in regulating star forma-tion. Stinson et al. (2013) included thermal feedback fromyoung stars and thus were able to achieve significantly bet-ter agreement of star formation histories with observations.Agertz et al. (2013) presented the most complete model sofar of mass, momentum and energy feedback from stars dur-ing all stages of their evolution, and concluded that radia-tion pressure from young stars has the strongest effect onthe ISM.
Apart from feedback, a more realistic modeling ofstar formation and the ISM has been shown to help inmaking simulated galaxies with more realistic properties.Governato et al. (2010) found that increasing the thresh-old density used in the modeling of star formation to morerealistic values leads to more concentrated star formation,more efficient feedback energy input into the ISM, and theformation of galaxies with higher disk fraction (see alsoGuedes et al. 2011). Christensen et al. (2012) have shownthat the implementation of a model for the formation ofmolecular hydrogen (see Gnedin et al. 2009) can amplify theeffect of higher threshold densities.
In Aumer & White (2013) (AW13 hereafter), we haveshown that it is possible to form a realistic disk galaxy withina triaxial, substructured and growing CDM halo, as long asthe disk forms predominantly at late times (z < 1), the an-gular momentum vector of the infalling gas has a roughlyconstant and appropriate orientation and there are no ma-jor mergers or other significant changes in the configura-tion of the halo. In the Aquila Code Comparison Project
(Scannapieco et al. 2012, CS12 hereafter) one of the haloesconsidered in AW13 was simulated with 15 different galaxyformation codes yielding 15 model galaxies with widely vary-ing properties. Although several models compared well to asubset of the observations considered, none of the modelsyielded a fully realistic disk galaxy. In this paper, we intendto show how modifications to the models of CS09, motivatedby the findings of CS12 and some of the recently discussedsolutions to problems discussed above, can lead to the for-mation of significantly more realistic disk galaxies. We alsouse our model to study a sample of haloes, which has beenpreviously studied by Oser et al. (2010) in the context ofthe formation of massive, early-type galaxies. The combinedsample comprises haloes with very quiet merger histories aswell as low-z mergers, and is thus well suited to be comparedto a range of objects in the observed galaxy population.
Our paper is organized as follows: In Section 2 we de-scribe the updates we applied to our code. In Section 3 weintroduce the sample of initial conditions we use. In Sec-tion 4 we discuss the star formation histories of our galax-ies. In Section 5 we analyze their kinematical and structuralproperties. In Section 6 we compare our sample to observedscaling relations. Finally, we conclude in Section 7.
2 THE CODE
For our simulations, we use the TREESPH code GADGET-3, last described in Springel (2005). Scannapieco et al.(2005, 2006) introduced models for stellar metal production,metal line cooling, star formation, SN feedback and a mul-tiphase gas treatment to be used with GADGET-3, whichwe use as the basis for our code update.
2.1 Multiphase model and star formation
We begin with a description of the parts of the model, whichhave remained unchanged. The code is unique in decouplingSPH particles with very different thermodynamic propertiesby preventing them from being SPH neighbours. Particle idecouples from particle j if
Ai > 50.× Aj and µij < cij. (1)
Here A is the entropic function (Springel & Hernquist 2002),cij is the pair-averaged sound-speed and µij is the relativevelocity of the particles projected onto their separation vec-tor. Marri & White (2003) showed that the second condi-tion is needed to avoid decoupling in shock waves, whichcan lead to unphysical effects. This multiphase gas treat-ment has been implemented to make a realistic co-existenceof hot and cold phase gas (as observed in the ISM) possiblein SPH. It has also been shown to allow a more realisticmodeling of energy and metal injection from stars to thedistinct components of the ISM.
c© 2013 RAS, MNRAS 000, 1–??
Spiral galaxies in cosmological simulations 3
To model the formation of stars, we assume that gasparticles are eligible for this process, if their density isabove a threshold density nth. Whereas CS09 used nth ∼0.03 cm−3, Governato et al. (2010) have argued that signif-icantly higher threshold densities are needed to form real-istic galaxies. While we can confirm their conclusions, wecaution that the effect of varying this parameter dependssignificantly on the details of the applied feedback and ISMmodel. For the model and the resolution applied in thiswork, we use a value of nth ∼ 3 cm−3, for which we findthe best results. As argued by Guedes et al. (2011), a signif-icantly lower value leads to less efficient feedback and higherbulge fraction. However, a significantly higher threshold inour model leads to the formation of bound stellar clumps,which can sink to the centre because of dynamical frictionand thus also enhances the bulge fraction. Our value lies be-tween the value of 1 cm−3 applied for the Gasoline model forhalo Aq-C-5 in CS12 and 5 cm−3 applied by Guedes et al.(2011) in a higher resolution simulation. We note that thesevalues are still two orders of magnitude below the averagedensity of molecular clouds and at least four orders of mag-nitude below the density of molecular cores within whichstars are observed to form. Our resolution is however toocoarse to model these high densities.
For particles with n > nth and an overdensity ρ/ρ >2000 (where ρ is the cosmic mean density) which lie in aconvergent flow, a star formation rate of
dρ⋆dt
= ηρgastdyn
(2)
is assumed. Here stellar and gas densities are represented byρ⋆ and ρgas and tdyn = 1/
√
4πGρgas is the local dynamicaltime for the gas particle. We choose a star formation effi-ciency η = 0.04, in the range of values typically used (seee.g. various models in CS12). The typical timescale for starformation is thus tsf = 1/η tdyn. Star particles are createdstochastically with one gas particle being turned into onestar particle of the same mass.
2.2 Metal Production and Cooling
To account for metals, we explicitly trace the mass in theelements H, He, C, N, O, Ne, Mg, Si, S, Ca and Fe for all gasand star particles. Our model includes chemical enrichmentfrom SNII, SNIa and AGB stars. Each star particle repre-sents a stellar population characterized by a Kroupa (2001)IMF with lower and upper mass limits of 0.1 and 100 M⊙.
We assume that stars more massive than 8 M⊙ explodeas SNII. All SNII are modeled in one event at an age τSNII
(see Section 2.4). For the calculation of the mass returned tothe ISM in the various elements we use the metal-dependentyields provided by Chieffi & Limongi (2004). The uncertain-ties in yields and thus in the predictions of simulations aresignificant, as was for example discussed by Wiersma et al.(2009). It has been argued by Portinari et al. (1998) thatadjustments by factors of 2 for certain elements can helpimprove the agreement with observations. Indeed, we findthat halving the iron yield following their findings leads toa qualitatively better agreement of metallicities as discussedin the following sections, which is why we apply their sug-gested corrections. We note that apart from this, we have
not studied the variation of our results with different yieldsets, IMFs etc. to optimize our results.
For the element production by SNIa, we assume themodel W7 presented by Iwamoto et al. (1999). We apply adelay time distribution, which declines with age τ of a stel-lar population as τ−1, as proposed by Maoz & Mannucci(2012). We also adopt their suggested normalization of 2SNIa per 1000 M⊙ of stars formed and that the first SNIaexplode at τ = 50 Myr. The corresponding masses of ele-ments are returned to the ISM in 50 Myr time-steps in ourmodel.
To account for the mass recycling in the winds of asymp-totic giant branch stars, we use the metal-dependent yieldsof Karakas (2010). Together with the assumed IMF and us-ing lifetimes dependent on stellar mass and metallicity, wecan thus calculate the mass of the considered elements re-leased during the time intervals considered for the SNIa en-richment.
Chemical elements are distributed to the gaseous neigh-bours of the star particles, where neighbours are weightedaccording to their distance from the star particle using anSPH kernel. To account for our multiphase treatment of thegas component, the returned (metal) mass is split between10 hot and 10 cold neighbours. We give 50 per cent to thehot and cold phase each for all three different types of metalproduction sites. We have tested making this fraction de-pendent on the age of the stellar particle, but found thatobserved abundance ratios are best reproduced by our sim-ple choice. For this purpose the cold phase gas is defined byT < 8× 10⁴ K and n > 4.× 10−5 cm−3. Note, that we havereduced this density limit by a factor of ∼ 100 compared toScannapieco et al. (2006) as we found that a higher valuecan have a destructive effect on extended, low-density gasdisks due to energetic feedback (see below).
The metallicities of the SPH particles are used to cal-culate the cooling rates of the gas. We apply the ratespresented by Wiersma et al. (2009) for optically thin gasin ionization equilibrium. These rates are calculated on anelement-by-element basis and take into account the effectsof photo-ionization from a uniform redshift-dependent ion-izing background (Haardt & Madau 2001). The rates thusdepend on redshift, gas density, temperature and chemicalcomposition.
2.3 Metal Diffusion
In many standard implementations of chemical enrichmentin SPH (also true for Scannapieco et al. 2005), the metal-licity of a particle can only change by enrichment. This canlead to situations, where gas particles with similar thermo-dynamic properties, but very different metallicities live nextto each other. This occurs e.g. when a galactic wind parti-cle travels through unenriched IGM. Wiersma et al. (2009)suggested that smoothed metallicities should be used to getrid of these situations. Although this improves the model-ing by smoothing out differences, it also leads to fluctuatingmetallicities for individual particles for the IGM situationdiscussed above.
In the ISM, once metals have been released from stars,turbulent motions of gas are responsible for their spread-ing. Including a corresponding model for the turbulent dif-fusion of metals was already suggested by Groom (1997),
c© 2013 RAS, MNRAS 000, 1–??

4 M. Aumer et al.
but until recently, most galaxy formation SPH codes didnot consider this process. Recent implementations were pre-sented in Martınez-Serrano et al. (2008), Greif et al. (2009)and Shen et al. (2010).
The diffusion equation for a metal concentration c(metal mass per total mass) of a fluid element with den-sity ρ and a diffusion coefficient D is
dc
dt=
1
ρ∇ · (D∇c), (3)
where d/dt is the Lagrangian derivative.Cleary & Monaghan (1998) gave the SPH formulationof the diffusion equation as
dcidt
=∑
j
Kij (ci − cj) , (4)
where
Kij =mj
ρiρj
4DiDj
(Di +Dj)
rij · ∇iWij
r2ij. (5)
Here quantities with subscripts i and j correspond to neigh-bour particles, m is the particle mass, Wij is the SPH kerneland rij is the separation vector with absolute rij .
Greif et al. (2009) argued for the use of an integratedequation assuming that the change in c is small over ∆t:
ci(t0 +∆t) = ci(to)eA∆t +
B
A(1− eA∆t) (6)
with
A =∑
j
Kij and B =∑
j
Kijcj . (7)
As we want to conserve the total metal mass, we modify theequation for a pairwise exchange of metals. For the metalmass µi = cimi we get
∆µi =∑
j
µij =∑
j
[
1
2mi
(
1− eA∆t) 1
AKij (cj − ci))
]
, (8)
where the factor 1/2 was included to account for the factthat most pairs of neighbours are considered twice and µij
is correspondingly subtracted from particle j. To avoid de-pendence on the ordering of particles all changes ∆µij arecalculated for all pairs of neighbours before the metal massesof all particles are updated. This procedure is applied at ev-ery time-step for all active particles using the standard SPHneighbour searches. A neighbour particle j can be inactive,so that the corresponding pair of particles only appears once.Should the particles still be neighbours at the next activetime-step of j, the larger ∆t compensates for that. Clearlythis formalism includes a number of approximations, but ap-plied to tests as discussed in Greif et al. (2009), we find asimilar accuracy.
This leaves the determination of the diffusion coefficientD. Greif et al. (2009) argued for Di = 2ρiσihi, where σ isthe velocity dispersion of gas particles within its smoothingkernel characterized by the smoothing length hi. Shen et al.(2010) argued that Di = 0.05ρi |Skl|h
2i based on the trace-
free tensor Skl (for details see their paper) is a better choiceas it yields no diffusion for purely rotating or compressiveflows. We have tested both ideas and found that for a fixedtest setup the main difference is the strength of the diffusioncoefficient with Greif et al. (2009) predicting values higher
by a factor ∼ 20. For cosmological simulations, we findthat the Shen et al. configuration yields better results whencomparing to observations. As was noticed by Shen et al.(2010), diffusion leads to outflowing particles losing met-als to the circumgalactic medium and subsequently also tohigher gaseous and stellar metallicities in the galaxy. For theGreif et al. value for D this effect is much stronger than forthe Shen et al. value and makes galaxies lie above the mass-metallicity relation. However when we use Di = 0.1ρiσihi
this criterion loses significance. For consistency, we use D assuggested by Shen et al. in the simulations presented in thispaper.
2.4 Thermal and Kinetic feedback
As in Scannapieco et al. (2006) we assume that each SNejects an energy of ∼ 1051erg into the surrounding ISM. Asfor the metals we split this energy in halves and give thoseto the 10 nearest hot and cold gas neighbour particles asdefined above. However, we now split the energy between akinetic and a thermal part (see also Agertz et al. 2013).
To determine the kinetic part, we consider the conser-vation of momentum ∆p = ∆m vout contained in the initialSN ejecta and assume that this is characterized by a typ-ical outflow velocity vout. We use vout = 3000 kms−1, atypical velocity of outflowing material in SN in the Sedovexpansion phase. Note that the kinetic energy carried by∆m = 10 M⊙ at this velocity is 0.9 × 1051erg, the aver-age over all SNII according to our choice of IMF and SNIImass interval is ∼ 1.5× 1051erg. With this assumption, themomentum transferred from a star particle to one of the 20gas neighbour particles i receiving feedback is determined by∆mi, the mass transferred to particle i, which we know fromthe considerations of Section 2.2 for each particle i at a givenfeedback time-step. The momentum transferred to particle iis simply ∆pi = ∆mi vout. The direction of the momentumchange vector is modeled as pointing radially away from thestar particle towards gas particle i. Our choices of parame-ters lead to a typical change in radial velocity component ofa gas particle i receiving feedback of ∆vi = 20− 30 kms−1.As ∆m is not spread equally among particles, in extremecases ∆vi ∼ 100 kms−1 is possible.
We also know how many SN events are representedand thus the total energy that is available to be released,∆Etot, under the assumption that per SN an average of1.0 × 1051erg is transferred to the ISM. The transfer ofmomentum leads to a change in kinetic energy of the gasparticle ∆Ekin. The remaining energy is considered to bethermalized, ∆Etherm = ∆Etot −∆Ekin. For this energy wefollow the ideas of Scannapieco et al. (2006). The fractiontransferred to a hot particle is instantly added to its thermalenergy. Instead, for cold particle we accumulate the energyfrom SNe events in a reservoir. Only when the accumulatedenergy is high enough, so that it can become a hot parti-cle, the energy is released (’promotion’). To define ’hot’ inthis context, we search for neighbour particles with entropieshigh enough to be decoupled from the cold particle in ourmultiphase scheme and calculate their mean entropy Ahot. Ifa particle has less than 5 such neighbours within 10 smooth-ing lengths, we set Ahot = Ath, where Ath corresponds toT = 1.6 × 10⁵ K and n = 2 × 10⁻³cm−3 (’seeding’, seeSawala et al. 2011). Moreover, Ahot = Ath is also assumed
c© 2013 RAS, MNRAS 000, 1–??
Spiral galaxies in cosmological simulations 5
if Ahot < Ath, so that Ath acts as a minimum promotionentropy.
As ∆Etherm > ∆Ekin for the considered situation, thethermal feedback is only mildly weakened. The kinetic feed-back however helps breaking up dense clumps of gas andthus lowers the cooling rates and the star formation effi-ciency in a star-forming disk. Gas fractions increase andso does the efficiency of the thermal feedback. Momentumis also transferred, when mass is released from AGB stars,however masses and velocities are much smaller than in SNexplosions, which is why this effect is negligible.
For the age of star particles at which we input SN energywe choose τSNII = 3 Myr. Clearly this choice is not unprob-lematic, as most SNII explode after that, but the energyrelease from SNII peaks at this time and the most massivestars are supposed to have the strongest effect on the ISM.When not using feedback from massive stars before theirexplosion as SN as described in the following section, wefind less realistic star formation histories for a later choiceof τSNII. When adding an additional source of feedback thiseffect becomes less significant. Star formation rates for indi-vidual haloes can go up or down by up to a factor of 2 ata given epoch for a given halo when τSNII is increased, butcumulative effects are weaker. From these test, we concludethat the choice of τSNII does not significantly impact theresults of our paper.
2.5 Radiation Pressure
Hopkins et al. (2011) used high-resolution simulations totest the idea that the inclusion of feedback from radiationpressure of young massive stars has a comparable or possi-bly even stronger effect on the ISM than SN feedback (forthe underlying ideas see e.g. Murray et al. 2005). They de-veloped a model for high resolution simulations, in whichthey identify star forming regions and can thus use theirproperties to calculate the effect of radiation pressure as afunction of these local properties. Stinson et al. (2013) haveintroduced a model, where instead of a momentum trans-fer, a thermal energy transfer is modeled, assuming that 10per cent of the radiated energy from massive young starsis thermalized in the surrounding ISM. Agertz et al. (2013)presented a model for radiation pressure, which assumes thateach star particle represents a sample of star forming clus-ters. The effect is however then dependent on their choiceof the maximum cluster mass.
We parametrize the rate of momentum deposition tothe gas as
prp = (1 + τIR)L(t)
c, (9)
where τIR is the infrared optical depth and L(t) is the UV-luminosity of the stellar population and we have set addi-tional efficiency parameters to 1 (see Agertz et al. 2013).This equation states that all UV photons are scattered orabsorbed by dust, which subsequently re-radiates the en-ergy in the infra-red. The IR photons are then scatteredmultiple times before leaving the star forming cloud. Weconstruct L(t) by using the stellar evolution models for mas-sive stars by Ekstrom et al. (2012) and assuming a Kroupa(2001) IMF.
More problematic is the estimation of τIR. If we fol-
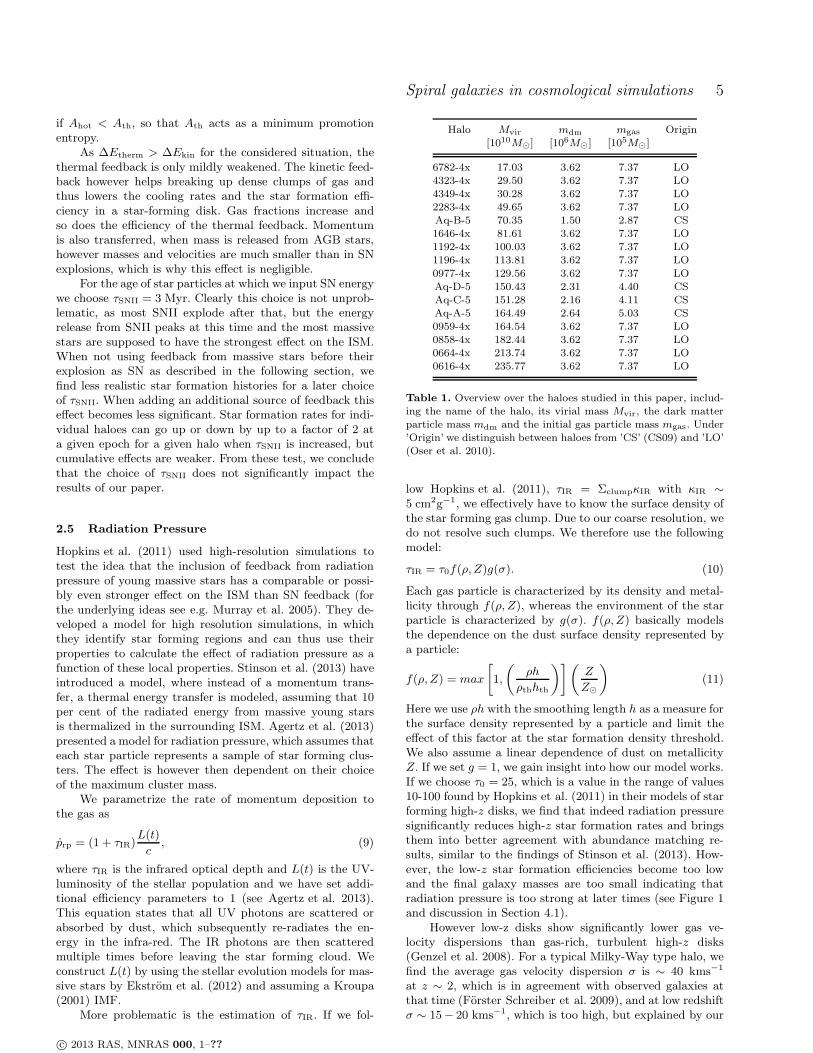
Halo Mvir mdm mgas Origin[1010M⊙] [106M⊙] [105M⊙]
6782-4x 17.03 3.62 7.37 LO4323-4x 29.50 3.62 7.37 LO4349-4x 30.28 3.62 7.37 LO2283-4x 49.65 3.62 7.37 LOAq-B-5 70.35 1.50 2.87 CS1646-4x 81.61 3.62 7.37 LO1192-4x 100.03 3.62 7.37 LO1196-4x 113.81 3.62 7.37 LO
0977-4x 129.56 3.62 7.37 LOAq-D-5 150.43 2.31 4.40 CSAq-C-5 151.28 2.16 4.11 CSAq-A-5 164.49 2.64 5.03 CS0959-4x 164.54 3.62 7.37 LO0858-4x 182.44 3.62 7.37 LO0664-4x 213.74 3.62 7.37 LO0616-4x 235.77 3.62 7.37 LO
Table 1. Overview over the haloes studied in this paper, includ-ing the name of the halo, its virial mass Mvir, the dark matterparticle mass mdm and the initial gas particle mass mgas. Under’Origin’ we distinguish between haloes from ’CS’ (CS09) and ’LO’(Oser et al. 2010).
low Hopkins et al. (2011), τIR = ΣclumpκIR with κIR ∼5 cm2g−1, we effectively have to know the surface density ofthe star forming gas clump. Due to our coarse resolution, wedo not resolve such clumps. We therefore use the followingmodel:
τIR = τ0f(ρ,Z)g(σ). (10)
Each gas particle is characterized by its density and metal-licity through f(ρ, Z), whereas the environment of the starparticle is characterized by g(σ). f(ρ, Z) basically modelsthe dependence on the dust surface density represented bya particle:
f(ρ, Z) = max
[
1,
(
ρh
ρthhth
)](
Z
Z⊙
)
(11)
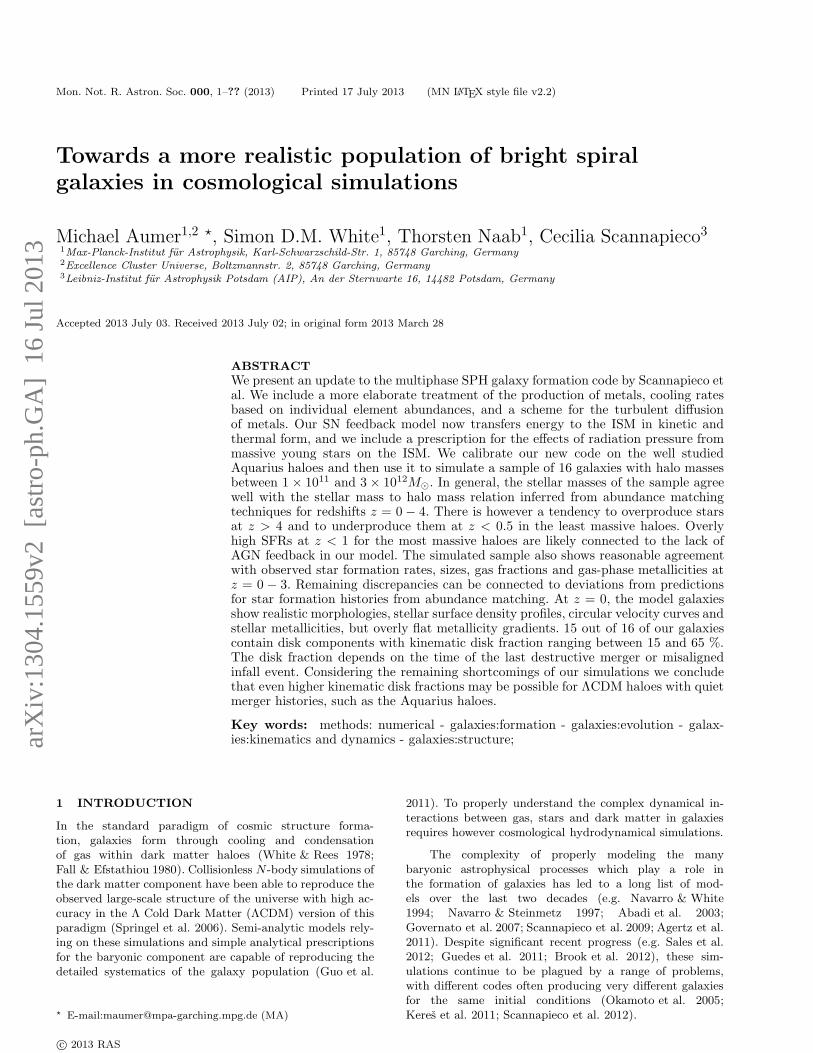
Here we use ρh with the smoothing length h as a measure forthe surface density represented by a particle and limit theeffect of this factor at the star formation density threshold.We also assume a linear dependence of dust on metallicityZ. If we set g = 1, we gain insight into how our model works.If we choose τ0 = 25, which is a value in the range of values10-100 found by Hopkins et al. (2011) in their models of starforming high-z disks, we find that indeed radiation pressuresignificantly reduces high-z star formation rates and bringsthem into better agreement with abundance matching re-sults, similar to the findings of Stinson et al. (2013). How-ever, the low-z star formation efficiencies become too lowand the final galaxy masses are too small indicating thatradiation pressure is too strong at later times (see Figure 1and discussion in Section 4.1).
However low-z disks show significantly lower gas ve-locity dispersions than gas-rich, turbulent high-z disks(Genzel et al. 2008). For a typical Milky-Way type halo, wefind the average gas velocity dispersion σ is ∼ 40 kms−1
at z ∼ 2, which is in agreement with observed galaxies atthat time (Forster Schreiber et al. 2009), and at low redshiftσ ∼ 15− 20 kms−1, which is too high, but explained by our
c© 2013 RAS, MNRAS 000, 1–??
6 M. Aumer et al.
coarse resolution. Star forming regions, and thus the valuesof τIR, are thus much larger at high z. If we assume thatthe Jeans mass is a valid estimator for clump mass, thenthe mass scales as Mcl ∝ σ3 (we ignore the dependence ondensity as we are not modeling densities above the star for-mation threshold properly). As is pointed out in the reviewof observed star forming clouds in Agertz et al. (2013), thefinal radius of clusters depends weakly on mass, which leadsto our crude estimation
g(σ) =(
σ
σ0
)3
. (12)
To estimate σ in the environment of the star particle, we de-termine the velocity dispersion σkernel of gas particles withinthe smoothing kernel for each gas particle. Then we averageover the values σkernel of all the neighbour gas particles to ayoung star particle to avoid strong fluctuations.
We acknowledge that this line of estimation is not par-ticularly stringent, but it qualitatively assures that the effectof radiation pressure is stronger in galaxies with higher gasvelocity dispersions and thus larger star forming regions.
In our simulations, we model the momentum change∆p = prp∆t where ∆t is the time-step of the star particle,as a continuous force acting on the 10 nearest cold neighbourparticles during the first 30 Myr in the life of a star particle.We use τ0 = 25 for σ0 = 40 kms−1, so that the effect athigh-z reduces star formation rates and is weak at low-z.We also limit g(σ) at a value of 4 to avoid overly strongforces. By construction, we thus find values of τIR ∼ 20 atz ∼ 2 with extreme values going up to 100, whereas we findsignificantly lower values of the order 1 − 5 at low redshift.We discuss the choice of parameters in Section 4.1.
3 THE SAMPLE
As initial conditions for our cosmological zoom-in sim-ulations we use haloes from the Aquarius Project(Springel et al. 2008, CS09), one of which was also used forthe Aquila Project (CS12). In addition, we use a selection ofhaloes from Oser et al. (2010).
The Aquarius haloes are a suite of high resolution zoom-in resimulations of regions chosen from the Millenium II sim-ulation (Boylan-Kolchin et al. 2009) which follows a cosmo-logical box of a side-length 137 Mpc. They were simulatedfrom z = 127 assuming a ΛCDM universe with the followingparameters: ΩΛ = 0.75, Ωm = 0.25,Ωb = 0.040, σ8 = 0.9 andH0 = 73 kms−1Mpc−1. The haloes were selected to have asimilar mass to that inferred for the Milky-Way dark haloand to have no neighbour exceeding half of their mass within1.4 Mpc. For details we refer to Springel et al. (2008) andCS09. Because of the second criterion, the haloes have a rel-atively quiet low-z merger history. They are thus expectedto host galaxies with high disk fractions at z = 0. Disks wereindeed found to form in these haloes by CS09 and CS12, butwith low disk-to-bulge ratios and several other propertiesthat do not compare well to observations.
The haloes from Oser et al. (2010) were selected froma simulation of a cosmological box with a side-length of100 Mpc, and were simulated from z = 43 assuminga ΛCDM universe with the following parameters: ΩΛ =0.74, Ωm = 0.26, Ωb = 0.044, σ8 = 0.77 and H0 =
0.00.51.02.03.04.0z
109
1010
1011
Mst
ella
r [M
O •]
CS09, 700 pcno RP, no kin FB, 700 pcno RP, 700 pc
RP on SF gas, 700 pcRP on SF gas, 300 pcRP simple, 300 pc
RP no sigma, 300 pcRP final model, 300 pc
Moster et al. (2013)
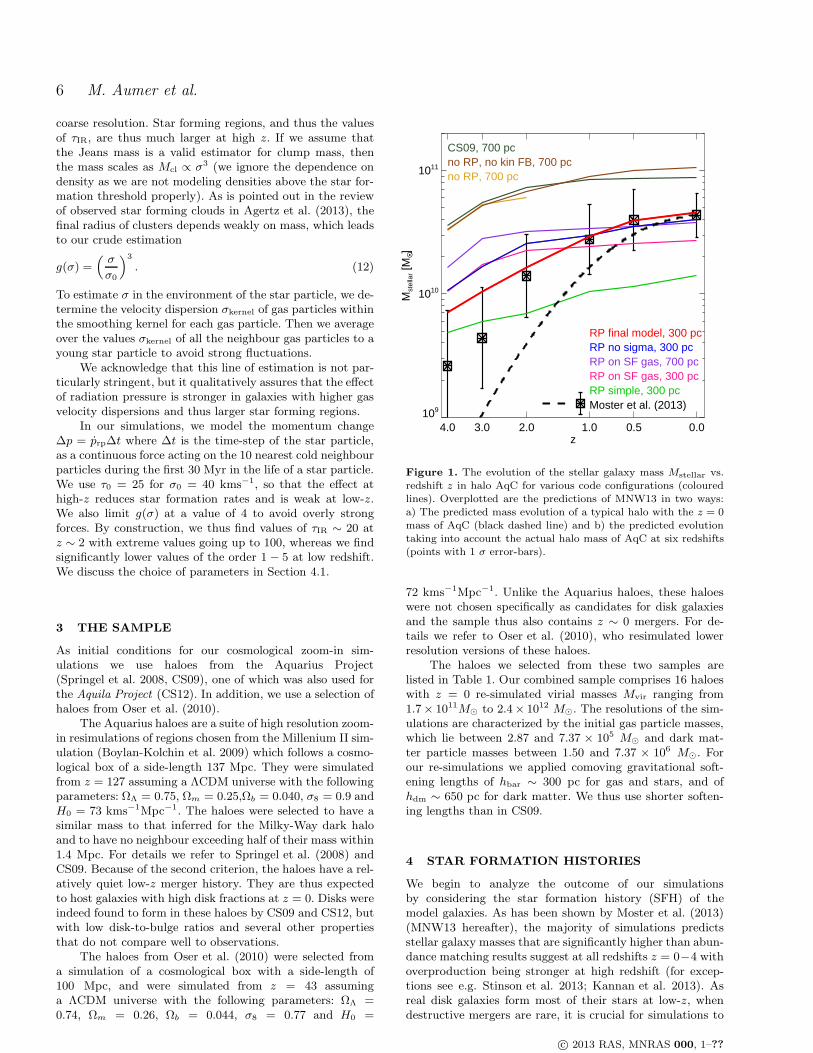
Figure 1. The evolution of the stellar galaxy mass Mstellar vs.redshift z in halo AqC for various code configurations (colouredlines). Overplotted are the predictions of MNW13 in two ways:a) The predicted mass evolution of a typical halo with the z = 0mass of AqC (black dashed line) and b) the predicted evolutiontaking into account the actual halo mass of AqC at six redshifts(points with 1 σ error-bars).
72 kms−1Mpc−1. Unlike the Aquarius haloes, these haloeswere not chosen specifically as candidates for disk galaxiesand the sample thus also contains z ∼ 0 mergers. For de-tails we refer to Oser et al. (2010), who resimulated lowerresolution versions of these haloes.
The haloes we selected from these two samples arelisted in Table 1. Our combined sample comprises 16 haloeswith z = 0 re-simulated virial masses Mvir ranging from1.7× 1011M⊙ to 2.4× 10¹² M⊙. The resolutions of the sim-ulations are characterized by the initial gas particle masses,which lie between 2.87 and 7.37 × 10⁵ M⊙ and dark mat-ter particle masses between 1.50 and 7.37 × 10⁶ M⊙. Forour re-simulations we applied comoving gravitational soft-ening lengths of hbar ∼ 300 pc for gas and stars, and ofhdm ∼ 650 pc for dark matter. We thus use shorter soften-ing lengths than in CS09.
4 STAR FORMATION HISTORIES
We begin to analyze the outcome of our simulationsby considering the star formation history (SFH) of themodel galaxies. As has been shown by Moster et al. (2013)(MNW13 hereafter), the majority of simulations predictsstellar galaxy masses that are significantly higher than abun-dance matching results suggest at all redshifts z = 0−4 withoverproduction being stronger at high redshift (for excep-tions see e.g. Stinson et al. 2013; Kannan et al. 2013). Asreal disk galaxies form most of their stars at low-z, whendestructive mergers are rare, it is crucial for simulations to
c© 2013 RAS, MNRAS 000, 1–??

Spiral galaxies in cosmological simulations 7
produce reasonable SFHs in order to get galaxy structuralproperties right.
4.1 The effect of changing feedback models on the
SFH of AqC
Halo AqC has been studied in CS12 with a variety of dif-ferent simulation codes. Although some of these codes pro-duce realistic z = 0 masses, none produced a good match toabundance matching results for the SFH at all z = 0 − 4.Compared to haloes of similar z = 0 mass, AqC is among theones which assemble their dark mass earliest (see Figure A1in Scannapieco et al. 2011). When developing our feedbackmodels, we found that AqC is particularly sensitive to thechoice of model details, which we demonstrate in this sec-tion. We caution, that the effects we discuss here can varyfrom halo to halo and not all conclusions drawn from AqCare true for all haloes. Moreover, abundance matching givesstatistical properties for a galaxy sample and AqC could wellbe an outlier. As we will show below, our calibration methodis justified by the fact that the feedback model that worksbest for AqC produces a sample of galaxies with reasonableproperties.
In Figure 1 we plot the evolution of the stellar massMstellar from z = 4 − 0 for various runs of the same initialconditions. We compare it to the evolution predicted by theabundance matching results of MNW13, who provide twodifferent ways of comparison. On the one hand, fitting for-mulae for typical SF and accretion histories are presentedas a function of z = 0 halo mass M200. We represent thesepredictions by the dashed line in Figure 1. On the otherhand, we know the halo mass at each redshift z and canthus make use of the fitting formulae for Mstellar/M200(z).We represent these by six data-points with correspondingerror-bars from z = 4 to 0. This method yields significantlyhigher predictions for Mstellar at high z, which reflects theearly assembly of halo AqC. Clearly the latter predictionsshould be used as a guideline for model calibration.
The original model by CS09 produces a stellar mass atz = 4 that is about an order of magnitude too high com-pared to the MNW13 value. It remains more than 1σ abovepredictions at all redshifts. If we add our updated metalproduction and metal cooling rates (no RP, no kin FB) thechanges are negligible. Changing to our new thermal andkinetic feedback (no RP) also does not improve the SFH athigh redshifts (the run was stopped at z = 2). We note thatthe change from the CS09 thermal feedback to our new ther-mal and kinetic feedback can produce significant changes instar formation histories in other haloes.
Stinson et al. (2013) argued that adding feedback fromyoung stars before their explosion as SNe would significantlyshift SF to later times. Kannan et al. (2013) tested this ideaon a simulation of a cosmological volume and found goodagreement with the results of MNW13 at high z. We testedvarious models of feedback from radiation pressure (RP)First we consider a simple model for RP (simple RP) whereall affected gas particles are treated equally independent ofdensity, metallicity and gas velocity dispersion (assumingan effective optical depth τ0 = 25, see Equation 10). Forthis model we achieve a reduction of the early SFR so thatthe z = 4 stellar mass matches predictions. However, thefeedback is too strong later on and SFRs are drastically re-
109
1010
1011
Mst
ella
r [M
O •]
z=0
1011 1012M200 [MO •
]
109
1010
1011
Mst
ella
r [M
O •]
z=1
109
1010
1011
Mst
ella
r [M
O •]
z=2
1011 1012
M200 [MO •]
109
1010
1011
Mst
ella
r [M
O •]
z=3.5
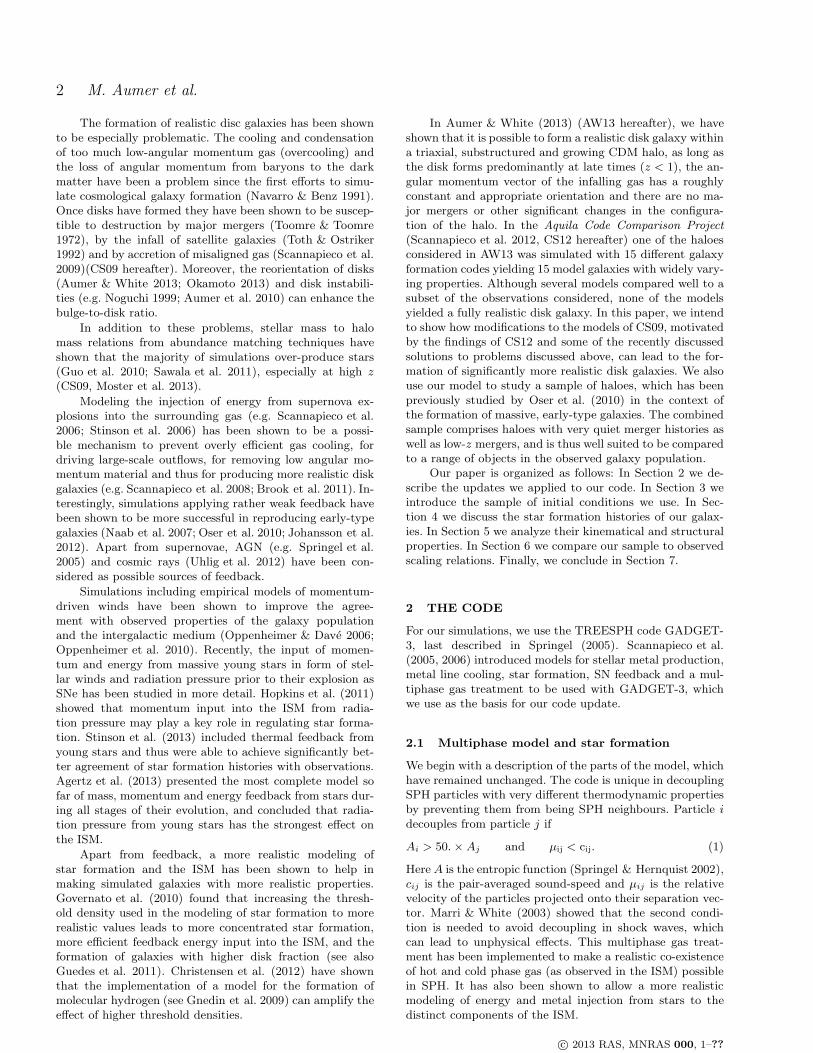
Figure 2. Stellar galactic massMstellar plotted against halo virialmass M200 at redshifts z = 0, 1, 2 and 3.5. The coloured pointsare the models discussed in this paper. Each colour represents asimulation. A colour can appear more than once at high-z repre-senting progenitor haloes. This colour coding is used for figuresthroughout the paper. The gray points are models of the same setof haloes run with the code used in CS09. The black lines are theabundance matching results of MNW13 with 1σ regions indicatedby the dashed lines.
c© 2013 RAS, MNRAS 000, 1–??

8 M. Aumer et al.
0.0 0.5 1.0 2.0 4.00.2 10.z
0.01
0.10
1.00
10.00
100.00
SF
R [M
O • /
yr]
M200 < 5 x 10¹¹ MO •
0.0 0.5 1.0 2.0 4.00.2 10.z
5 x 10¹¹ < M200/MO • < 1.55 x 10¹²
0.0 0.5 1.0 2.0 4.00.2 10.z
M200 > 1.55 x 10¹² MO •
0.001
0.010
0.100
1.000
10.000
100.000
SF
R [M
O • /
yr]
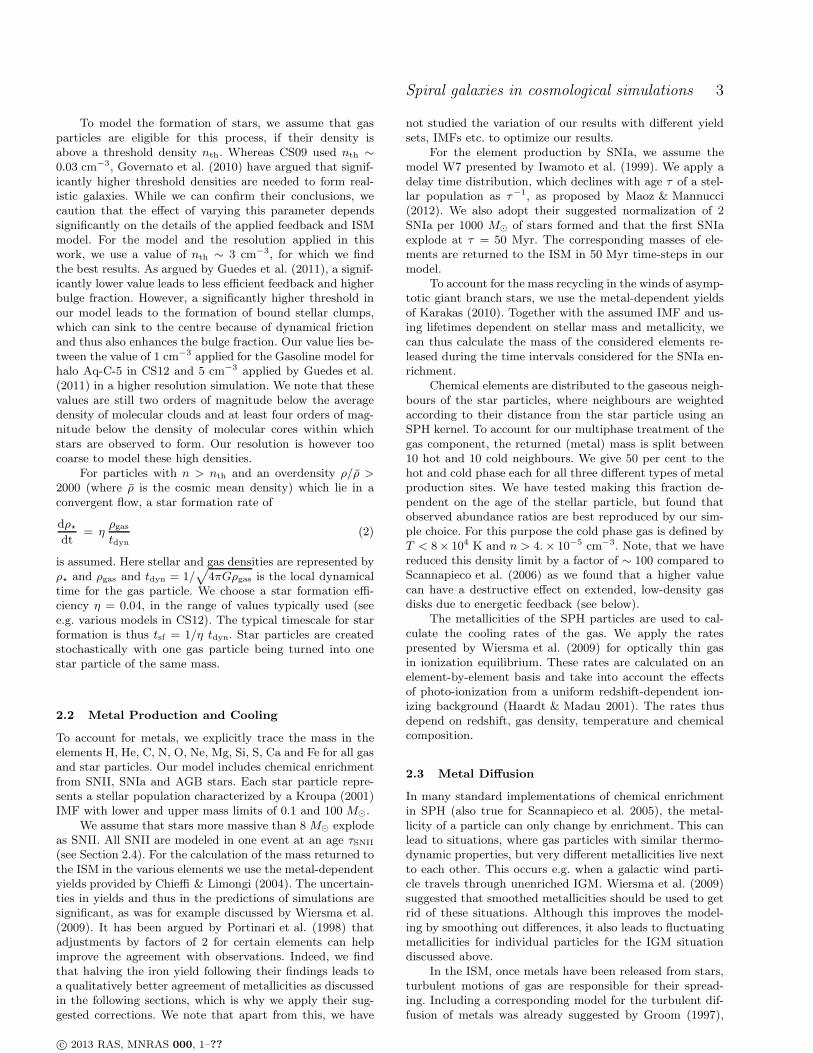
Figure 3. Star formation rates SFR as a function of redshift z for all our models. The haloes are split into M200 < 5× 10¹¹M⊙ (left),5× 1011M⊙ < M200 < 1.55× 10¹²M⊙ (middle) and M200 > 1.55× 10¹²M⊙ (right). Overplotted are predicted SFRs for typical haloesgiven by MNW13 for the mean, lowest and highest halo mass per panel.
duced so that the z = 0 stellar mass is more than 2σ low.When modifying our model so that the force is only actingon star-forming particles with ρ > ρth (RP on SF gas), thestrength of feedback is reduced especially at high z, so thatthe SFR is high at z > 4, but the agreement at z = 0 issignificantly better, however with low-z SFRs being still toolow. A model which includes a metallicity and density de-pendence to account for the dust surface density of each gasparticle as described in Section 2.5 (RP no sigma) lowers theeffect of RP at low z when metallicities are higher but thedensities of the affected gas particles are on average lower,as the systems have lower gas fractions. Our full model in-cluding the dependence on the gas velocity dispersion σ (RPfinal model) models the dependence of RP on the size of starforming regions. As σ is higher in high-z galaxies, the effectof RP is strengthened at high and weakened at low z leadingto a significant change in the shape of the M⋆ − z curve andbringing it within 1σ of the predictions of MNW13 at allz < 4.
Krumholz & Thompson (2013) have argued that the ef-ficiency of the coupling between the radiation field and thedusty gas is significantly lower than assumed in the approachof Hopkins et al. (2011), which is the basis of our modelhere. This would imply that radiation pressure is less effi-cient in reducing the problem of overly high SFRs in sim-ulated galaxies at high z. We thus caution, that the uncer-tainties in the modeled processes remain high and we takethe agreement of simulated SFH with the results of MNW13as a justification for the model we apply.
We also use Figure 1 to show a dependence of our feed-back on the gravitational softening length ǫ. Going from 700to 300 pc baryonic comoving softening length significantlyreduces the high-z SFRs, as shown by two versions of ourRP on SF gas model. This seems to originate in a higherfeedback efficiency due to denser structures in the very earlystages of galaxy formation. Because of this effect, we applyǫbaryons = 300 pc for our simulations, a significantly lowervalue than in CS09. We note that reducing the softening
length has no significant effect on the high-z SFR in theabsence of a model for radiation pressure.
We conclude that the inclusion of a parametrized modelfor feedback from young stars in the from of radiation pres-sure is indeed an efficient way to bring star formation his-tories into better agreement with results from abundancematching techniques. We caution that details of the model-ing have a significant effect on the outcome and that theseeffects vary from halo to halo. It is crucial to test the modelon a set of haloes, as we describe in the next subsection.
4.2 Applying the model to all haloes
We now apply our updated galaxy formation code to the fullsample of haloes described in Section 3 and examine if theresulting SFHs agree with observations of the real galaxypopulation.
We start by discussing stellar masses Mstellar as a func-tion of their halo masses M200 at redshifts z = 3.5, 2, 1 and0 in Figure 2. Mstellar is defined as the mass of stars within aradius rgal defined by visually analyzing the spherical stellarmass profile Mstellar(< r) and determining where its radialgrowth saturates. The coloured points in this Figure are forthe models with our updated code, whereas the gray pointsare for a sample of simulations run on the same set of ini-tial conditions with the code version and model parametersapplied in CS09. Note that the colour coding according tohalo mass that we apply here is used for all appropriate fig-ures throughout the paper. For the haloes 2283 and 0977,which are undergoing major mergers at z = 0, we use thecombined mass of the galaxies about to merge, as their darkhaloes have already merged. At z = 0, the population as awhole agrees nicely with the halo occupation modeling byMNW13. However, there are trends in the sample that dis-agree. The four most massive haloes are 1−2σ high, whereasthe lower mass galaxies show a tendency towards overly lowmass.
The sample simulated with the CS09 code shows z = 0
c© 2013 RAS, MNRAS 000, 1–??
Spiral galaxies in cosmological simulations 9
0.01
0.10
1.00
10.00
100.00
SF
R [M
O • /
yr]
z=0
Elbaz(2007)
109 1010 1011Mstellar [MO •
]
0.01
0.10
1.00
10.00
100.00
SF
R [M
O • /
yr]
z=1
Elbaz(2007)Kajisawa(2010) z=0.5-1Kajisawa(2010) z=1-1.5
109 1010 1011
Mstellar [MO •]
0.01
0.10
1.00
10.00
100.00
SF
R [M
O • /
yr]
z=2
Daddi(2007)Kajisawa(2010) z=1.5-2.5
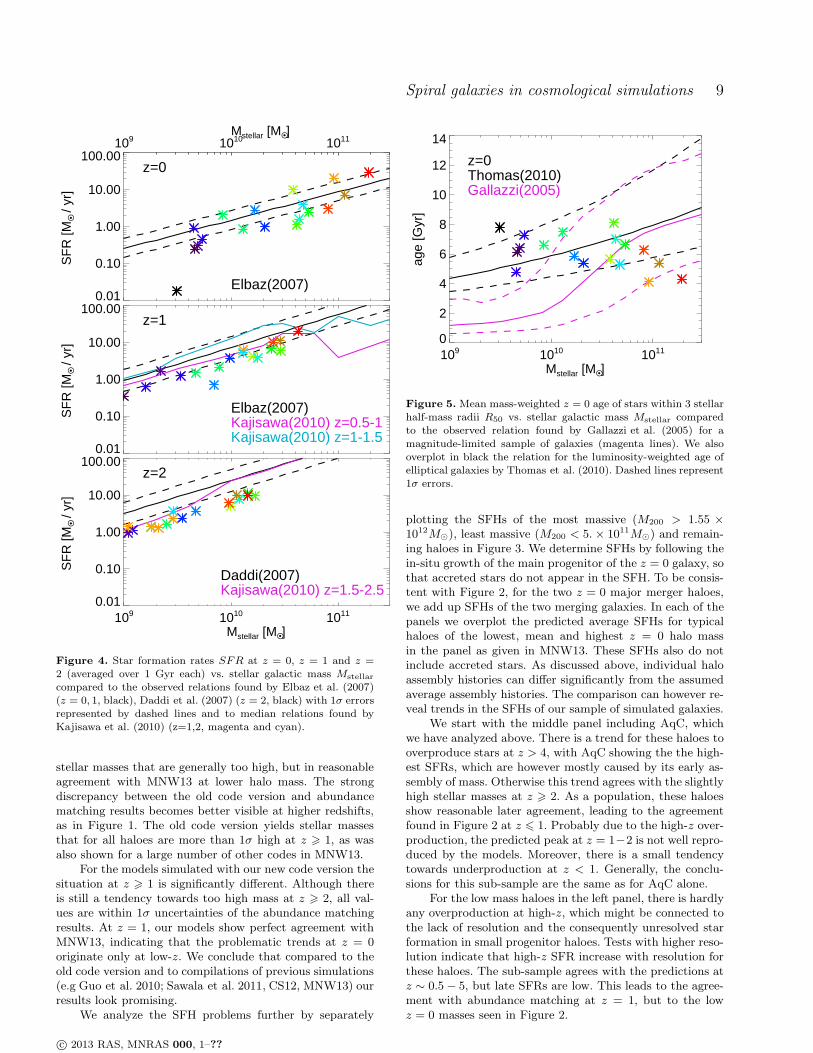
Figure 4. Star formation rates SFR at z = 0, z = 1 and z =2 (averaged over 1 Gyr each) vs. stellar galactic mass Mstellar
compared to the observed relations found by Elbaz et al. (2007)(z = 0, 1, black), Daddi et al. (2007) (z = 2, black) with 1σ errorsrepresented by dashed lines and to median relations found byKajisawa et al. (2010) (z=1,2, magenta and cyan).
stellar masses that are generally too high, but in reasonableagreement with MNW13 at lower halo mass. The strongdiscrepancy between the old code version and abundancematching results becomes better visible at higher redshifts,as in Figure 1. The old code version yields stellar massesthat for all haloes are more than 1σ high at z > 1, as wasalso shown for a large number of other codes in MNW13.
For the models simulated with our new code version thesituation at z > 1 is significantly different. Although thereis still a tendency towards too high mass at z > 2, all val-ues are within 1σ uncertainties of the abundance matchingresults. At z = 1, our models show perfect agreement withMNW13, indicating that the problematic trends at z = 0originate only at low-z. We conclude that compared to theold code version and to compilations of previous simulations(e.g Guo et al. 2010; Sawala et al. 2011, CS12, MNW13) ourresults look promising.
We analyze the SFH problems further by separately
109 1010 1011
Mstellar [MO •]
0
2
4
6
8
10
12
14
age
[Gyr
]
z=0Thomas(2010)Gallazzi(2005)
Figure 5. Mean mass-weighted z = 0 age of stars within 3 stellarhalf-mass radii R50 vs. stellar galactic mass Mstellar comparedto the observed relation found by Gallazzi et al. (2005) for a
magnitude-limited sample of galaxies (magenta lines). We alsooverplot in black the relation for the luminosity-weighted age ofelliptical galaxies by Thomas et al. (2010). Dashed lines represent1σ errors.
plotting the SFHs of the most massive (M200 > 1.55 ×10¹²M⊙), least massive (M200 < 5.× 1011M⊙) and remain-ing haloes in Figure 3. We determine SFHs by following thein-situ growth of the main progenitor of the z = 0 galaxy, sothat accreted stars do not appear in the SFH. To be consis-tent with Figure 2, for the two z = 0 major merger haloes,we add up SFHs of the two merging galaxies. In each of thepanels we overplot the predicted average SFHs for typicalhaloes of the lowest, mean and highest z = 0 halo massin the panel as given in MNW13. These SFHs also do notinclude accreted stars. As discussed above, individual haloassembly histories can differ significantly from the assumedaverage assembly histories. The comparison can however re-veal trends in the SFHs of our sample of simulated galaxies.
We start with the middle panel including AqC, whichwe have analyzed above. There is a trend for these haloes tooverproduce stars at z > 4, with AqC showing the the high-est SFRs, which are however mostly caused by its early as-sembly of mass. Otherwise this trend agrees with the slightlyhigh stellar masses at z > 2. As a population, these haloesshow reasonable later agreement, leading to the agreementfound in Figure 2 at z 6 1. Probably due to the high-z over-production, the predicted peak at z = 1−2 is not well repro-duced by the models. Moreover, there is a small tendencytowards underproduction at z < 1. Generally, the conclu-sions for this sub-sample are the same as for AqC alone.
For the low mass haloes in the left panel, there is hardlyany overproduction at high-z, which might be connected tothe lack of resolution and the consequently unresolved starformation in small progenitor haloes. Tests with higher reso-lution indicate that high-z SFR increase with resolution forthese haloes. The sub-sample agrees with the predictions atz ∼ 0.5− 5, but late SFRs are low. This leads to the agree-ment with abundance matching at z = 1, but to the lowz = 0 masses seen in Figure 2.
c© 2013 RAS, MNRAS 000, 1–??
10 M. Aumer et al.
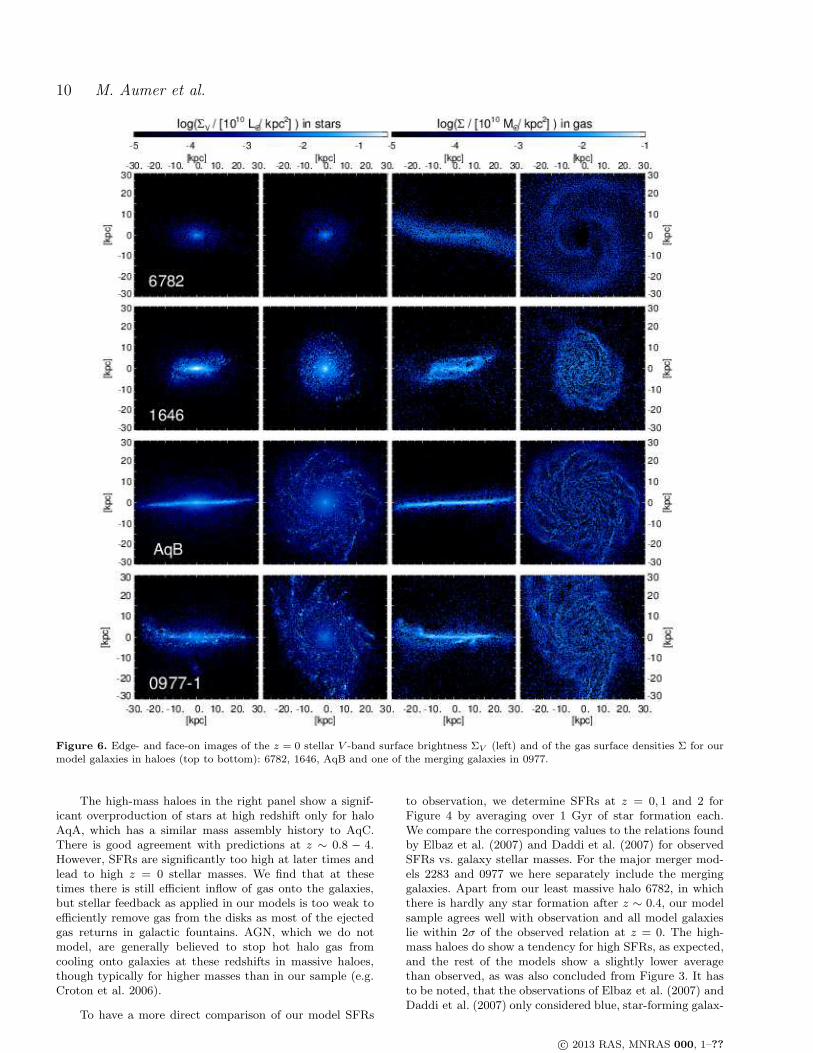
Figure 6. Edge- and face-on images of the z = 0 stellar V -band surface brightness ΣV (left) and of the gas surface densities Σ for ourmodel galaxies in haloes (top to bottom): 6782, 1646, AqB and one of the merging galaxies in 0977.
The high-mass haloes in the right panel show a signif-icant overproduction of stars at high redshift only for haloAqA, which has a similar mass assembly history to AqC.There is good agreement with predictions at z ∼ 0.8 − 4.However, SFRs are significantly too high at later times andlead to high z = 0 stellar masses. We find that at thesetimes there is still efficient inflow of gas onto the galaxies,but stellar feedback as applied in our models is too weak toefficiently remove gas from the disks as most of the ejectedgas returns in galactic fountains. AGN, which we do notmodel, are generally believed to stop hot halo gas fromcooling onto galaxies at these redshifts in massive haloes,though typically for higher masses than in our sample (e.g.Croton et al. 2006).
To have a more direct comparison of our model SFRs
to observation, we determine SFRs at z = 0, 1 and 2 forFigure 4 by averaging over 1 Gyr of star formation each.We compare the corresponding values to the relations foundby Elbaz et al. (2007) and Daddi et al. (2007) for observedSFRs vs. galaxy stellar masses. For the major merger mod-els 2283 and 0977 we here separately include the merginggalaxies. Apart from our least massive halo 6782, in whichthere is hardly any star formation after z ∼ 0.4, our modelsample agrees well with observation and all model galaxieslie within 2σ of the observed relation at z = 0. The high-mass haloes do show a tendency for high SFRs, as expected,and the rest of the models show a slightly lower averagethan observed, as was also concluded from Figure 3. It hasto be noted, that the observations of Elbaz et al. (2007) andDaddi et al. (2007) only considered blue, star-forming galax-
c© 2013 RAS, MNRAS 000, 1–??
Spiral galaxies in cosmological simulations 11
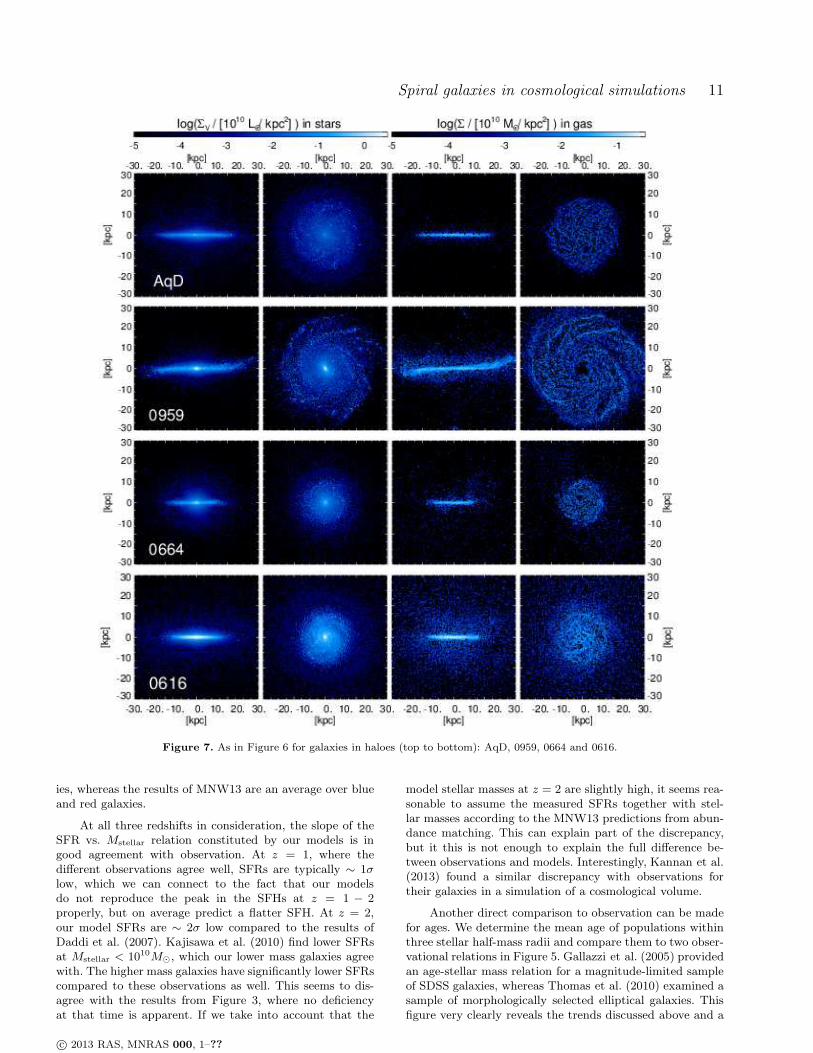
Figure 7. As in Figure 6 for galaxies in haloes (top to bottom): AqD, 0959, 0664 and 0616.
ies, whereas the results of MNW13 are an average over blueand red galaxies.
At all three redshifts in consideration, the slope of theSFR vs. Mstellar relation constituted by our models is ingood agreement with observation. At z = 1, where thedifferent observations agree well, SFRs are typically ∼ 1σlow, which we can connect to the fact that our modelsdo not reproduce the peak in the SFHs at z = 1 − 2properly, but on average predict a flatter SFH. At z = 2,our model SFRs are ∼ 2σ low compared to the results ofDaddi et al. (2007). Kajisawa et al. (2010) find lower SFRsat Mstellar < 1010M⊙, which our lower mass galaxies agreewith. The higher mass galaxies have significantly lower SFRscompared to these observations as well. This seems to dis-agree with the results from Figure 3, where no deficiencyat that time is apparent. If we take into account that the
model stellar masses at z = 2 are slightly high, it seems rea-sonable to assume the measured SFRs together with stel-lar masses according to the MNW13 predictions from abun-dance matching. This can explain part of the discrepancy,but it this is not enough to explain the full difference be-tween observations and models. Interestingly, Kannan et al.(2013) found a similar discrepancy with observations fortheir galaxies in a simulation of a cosmological volume.
Another direct comparison to observation can be madefor ages. We determine the mean age of populations withinthree stellar half-mass radii and compare them to two obser-vational relations in Figure 5. Gallazzi et al. (2005) providedan age-stellar mass relation for a magnitude-limited sampleof SDSS galaxies, whereas Thomas et al. (2010) examined asample of morphologically selected elliptical galaxies. Thisfigure very clearly reveals the trends discussed above and a
c© 2013 RAS, MNRAS 000, 1–??

12 M. Aumer et al.
division of our sample in three parts. The trend of ages of allmodel galaxies with stellar mass is almost flat and thus dis-agrees with the full galaxy population. The Aquarius haloesand the other haloes with masses ∼ 1012M⊙ are in rea-sonable agreement with both observational datasets, whichstrengthens the conclusions about their well-modeled SFHs.The massive galaxies with high late SFRs only marginallyagree with the youngest observed M⋆ ∼ 1011M⊙ galax-ies. The lower mass galaxy models, which include the threehaloes with lowest masses and the galaxies undergoing amajor merger at z = 0, overlap with the observed ellipticalgalaxies but are more than 1σ high compared to the Gallazziet al. sample, which at these masses is dominated by disks.
In conclusion, our feedback model, calibrated on haloAqC, works well for all haloes with similar and slightly lowermasses. These models show overly high SFRs only at highredshift. In the most massive haloes we studied, we find thatSFRs are significantly too high at low redshift, possibly onaccount of the lack of a model for AGN feedback. For ourlower mass galaxy models we find too low SFRs at z < 1,which makes the ages of their stellar populations too highfor disk galaxies at these masses.
5 MORPHOLOGY AND KINEMATICS
After studying how the stellar mass assembles in our modelgalaxies, we now have a closer look at the morphology andthe kinematics of their stellar components.
5.1 Structural Properties
We start by a visual inspection of galaxy morphologies. Weuse the models of Bruzual & Charlot (2003) to assign V -band luminosities to the stellar particles according to theirmass, age and metallicity. We then create edge-on and face-on surface brightness ΣV images for the stellar componentwithout taking obscuration into account. We also create gasmass images and present the results for eight model galaxiesat z = 0 in Figures 6 and 7 to display the variety of galaxytypes produced in our simulations.
In Figure 6 we present lower mass galaxies. All of thesegalaxies do show extended gas disks, as do observed diskgalaxies (e.g. Walter et al. 2008). Moreover, the gas disksand, with the exception of 6782, also the stellar componentsdo show warps of varying extent. Warps are also frequentlyobserved in real galaxies (Sancisi 1976). Considering our fullsample of 18 galaxies in the 16 simulated haloes (2 each for2283 and 0977), 10 galaxies show warps and 11 have gasdisks that extend beyond the stellar populations.
The stars of the galaxy in our least massive halo 6782(first row of Figure 6) show an ellipsoidal distribution, whichis only mildly flattened. The gas however lives in an ex-tended, warped disk, which is dominated by two spiral arms.The gas disk has formed after a major merger at z = 0.4. Ourmodel 1646 (second row) also shows elliptical morphologyin stars, the visible rotational flattening is however higher.Moreover, there are signs of a disk and a misaligned ring.The gas displays a strongly warped, relatively compact diskwith disturbed spiral structure. We will show below thatthis galaxy features strongly misaligned infall at z ∼ 0.1and a counter-rotating stellar population. Misaligned infall
0 5 10 15R [kpc]
10-5
10-4
10-3
10-2
10-1
Σ V [1
010 L
O • /
kpc2 ]
M200 < 5 x 10¹¹ MO •
z=0
0 5 10 15 20 25 30R [kpc]
10-5
10-4
10-3
10-2
10-1
Σ V [1
010 L
O • /
kpc2 ]
5 x 10¹¹ < M200/MO • < 1.55 x 10¹²
z=0
0 5 10 15 20 25 30R [kpc]
10-5
10-4
10-3
10-2
10-1
100
Σ V [1
010 L
O • /
kpc2 ]
M200 > 1.55 x 10¹² MO •
z=0
Figure 8.Radially averaged z = 0 face-on V -band surface bright-ness ΣV as a function of radius R for all our model galaxies. Wesplit the sample into three bins of halo mass: M200 < 5×10¹¹M⊙
(top), 5 × 10¹¹M⊙ < M200 < 1.55 × 10¹²M⊙ (middle) andM200 > 1.55× 10¹²M⊙ (bottom).
and reorientation of disks are frequent phenomena in oursimulations. About half of the z = 0 disks have experiencedreorientation of 40 degrees or more since they started form-ing.
Halo AqB (third row) hosts a very thin, extended stellardisk galaxy with flocculent spiral structure and a prominentbulge. The gas forms a very extended, slightly warped diskwith spiral structure as in the stellar component. One of
c© 2013 RAS, MNRAS 000, 1–??
Spiral galaxies in cosmological simulations 13
0
100
200
300
400
Vci
rc [k
m/s
]
0 2 4 6R / R50
0.1
1.0
Vci
rc,D
M /
Vci
rc,s
tella
r
0 2 4 6R / R50
0.1
1.0
Vci
rc,g
as /
Vci
rc,s
tella
r
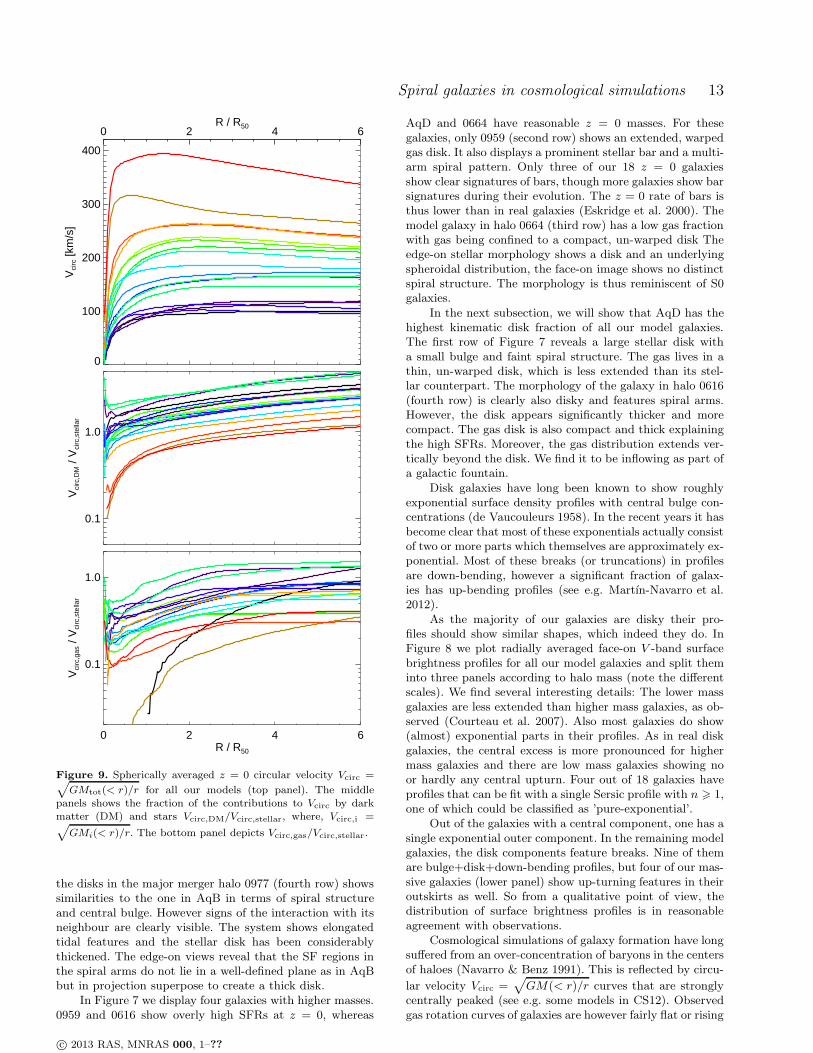
Figure 9. Spherically averaged z = 0 circular velocity Vcirc =√
GMtot(< r)/r for all our models (top panel). The middlepanels shows the fraction of the contributions to Vcirc by darkmatter (DM) and stars Vcirc,DM/Vcirc,stellar, where, Vcirc,i =√
GMi(< r)/r. The bottom panel depicts Vcirc,gas/Vcirc,stellar.
the disks in the major merger halo 0977 (fourth row) showssimilarities to the one in AqB in terms of spiral structureand central bulge. However signs of the interaction with itsneighbour are clearly visible. The system shows elongatedtidal features and the stellar disk has been considerablythickened. The edge-on views reveal that the SF regions inthe spiral arms do not lie in a well-defined plane as in AqBbut in projection superpose to create a thick disk.
In Figure 7 we display four galaxies with higher masses.0959 and 0616 show overly high SFRs at z = 0, whereas
AqD and 0664 have reasonable z = 0 masses. For thesegalaxies, only 0959 (second row) shows an extended, warpedgas disk. It also displays a prominent stellar bar and a multi-arm spiral pattern. Only three of our 18 z = 0 galaxiesshow clear signatures of bars, though more galaxies show barsignatures during their evolution. The z = 0 rate of bars isthus lower than in real galaxies (Eskridge et al. 2000). Themodel galaxy in halo 0664 (third row) has a low gas fractionwith gas being confined to a compact, un-warped disk Theedge-on stellar morphology shows a disk and an underlyingspheroidal distribution, the face-on image shows no distinctspiral structure. The morphology is thus reminiscent of S0galaxies.
In the next subsection, we will show that AqD has thehighest kinematic disk fraction of all our model galaxies.The first row of Figure 7 reveals a large stellar disk witha small bulge and faint spiral structure. The gas lives in athin, un-warped disk, which is less extended than its stel-lar counterpart. The morphology of the galaxy in halo 0616(fourth row) is clearly also disky and features spiral arms.However, the disk appears significantly thicker and morecompact. The gas disk is also compact and thick explainingthe high SFRs. Moreover, the gas distribution extends ver-tically beyond the disk. We find it to be inflowing as part ofa galactic fountain.
Disk galaxies have long been known to show roughlyexponential surface density profiles with central bulge con-centrations (de Vaucouleurs 1958). In the recent years it hasbecome clear that most of these exponentials actually consistof two or more parts which themselves are approximately ex-ponential. Most of these breaks (or truncations) in profilesare down-bending, however a significant fraction of galax-ies has up-bending profiles (see e.g. Martın-Navarro et al.2012).
As the majority of our galaxies are disky their pro-files should show similar shapes, which indeed they do. InFigure 8 we plot radially averaged face-on V -band surfacebrightness profiles for all our model galaxies and split theminto three panels according to halo mass (note the differentscales). We find several interesting details: The lower massgalaxies are less extended than higher mass galaxies, as ob-served (Courteau et al. 2007). Also most galaxies do show(almost) exponential parts in their profiles. As in real diskgalaxies, the central excess is more pronounced for highermass galaxies and there are low mass galaxies showing noor hardly any central upturn. Four out of 18 galaxies haveprofiles that can be fit with a single Sersic profile with n > 1,one of which could be classified as ’pure-exponential’.
Out of the galaxies with a central component, one has asingle exponential outer component. In the remaining modelgalaxies, the disk components feature breaks. Nine of themare bulge+disk+down-bending profiles, but four of our mas-sive galaxies (lower panel) show up-turning features in theiroutskirts as well. So from a qualitative point of view, thedistribution of surface brightness profiles is in reasonableagreement with observations.
Cosmological simulations of galaxy formation have longsuffered from an over-concentration of baryons in the centersof haloes (Navarro & Benz 1991). This is reflected by circu-
lar velocity Vcirc =√
GM(< r)/r curves that are stronglycentrally peaked (see e.g. some models in CS12). Observedgas rotation curves of galaxies are however fairly flat or rising
c© 2013 RAS, MNRAS 000, 1–??
14 M. Aumer et al.
6782-1.0 -0.5 0.0 0.5 1.0
ε
0.00
0.01
0.02
0.03
0.04
0.05
0.06
0.07
4323-1.0 -0.5 0.0 0.5 1.0
ε
4349-1.0 -0.5 0.0 0.5 1.0
ε
2283 z=0-1.0 -0.5 0.0 0.5 1.0
ε
0.00
0.01
0.02
0.03
0.04
0.05
0.06
0.07
AqB
0.00
0.01
0.02
0.03
0.04
0.05
0.06
0.07
1646
1192
1196
0.00
0.01
0.02
0.03
0.04
0.05
0.06
0.07
0977
0.00
0.01
0.02
0.03
0.04
0.05
0.06
0.07
AqD
AqC
AqA
0.00
0.01
0.02
0.03
0.04
0.05
0.06
0.07
0959
-1.0 -0.5 0.0 0.5 1.0ε
0.00
0.01
0.02
0.03
0.04
0.05
0.06
0.07
0858
-1.0 -0.5 0.0 0.5 1.0ε
0664
-1.0 -0.5 0.0 0.5 1.0ε
0616
-1.0 -0.5 0.0 0.5 1.0ε
0.00
0.01
0.02
0.03
0.04
0.05
0.06
0.07
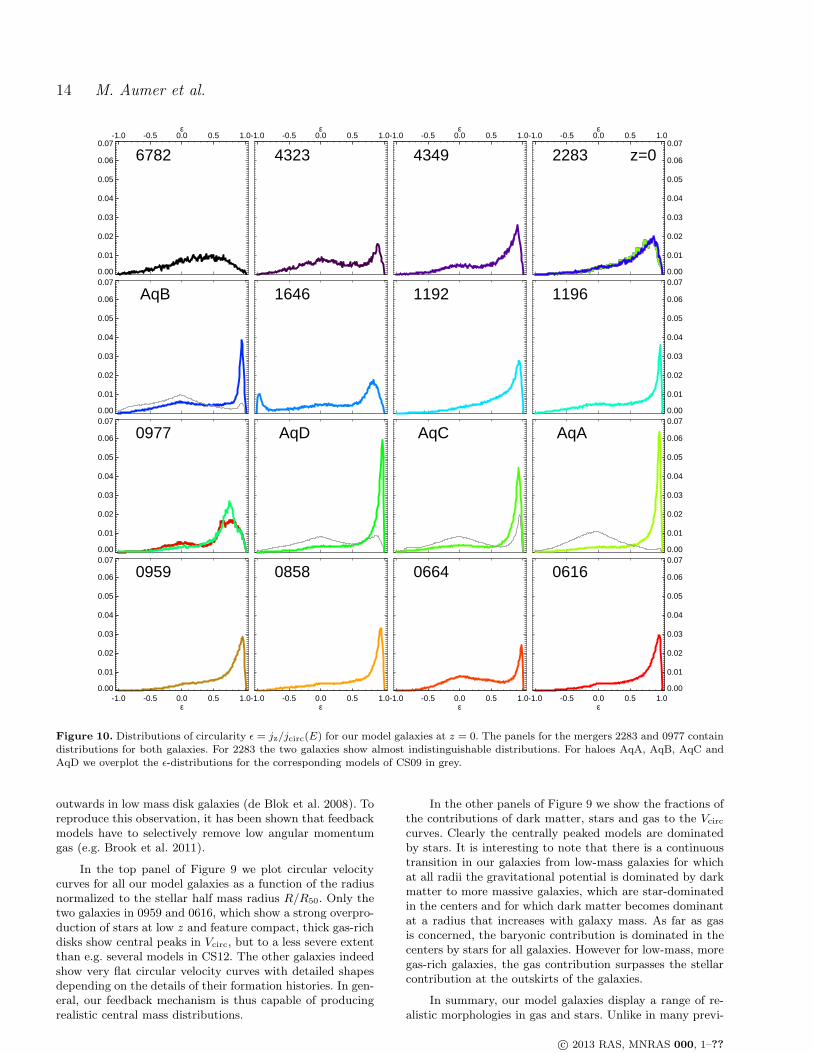
Figure 10. Distributions of circularity ǫ = jz/jcirc(E) for our model galaxies at z = 0. The panels for the mergers 2283 and 0977 containdistributions for both galaxies. For 2283 the two galaxies show almost indistinguishable distributions. For haloes AqA, AqB, AqC andAqD we overplot the ǫ-distributions for the corresponding models of CS09 in grey.
outwards in low mass disk galaxies (de Blok et al. 2008). Toreproduce this observation, it has been shown that feedbackmodels have to selectively remove low angular momentumgas (e.g. Brook et al. 2011).
In the top panel of Figure 9 we plot circular velocitycurves for all our model galaxies as a function of the radiusnormalized to the stellar half mass radius R/R50. Only thetwo galaxies in 0959 and 0616, which show a strong overpro-duction of stars at low z and feature compact, thick gas-richdisks show central peaks in Vcirc, but to a less severe extentthan e.g. several models in CS12. The other galaxies indeedshow very flat circular velocity curves with detailed shapesdepending on the details of their formation histories. In gen-eral, our feedback mechanism is thus capable of producingrealistic central mass distributions.
In the other panels of Figure 9 we show the fractions ofthe contributions of dark matter, stars and gas to the Vcirc
curves. Clearly the centrally peaked models are dominatedby stars. It is interesting to note that there is a continuoustransition in our galaxies from low-mass galaxies for whichat all radii the gravitational potential is dominated by darkmatter to more massive galaxies, which are star-dominatedin the centers and for which dark matter becomes dominantat a radius that increases with galaxy mass. As far as gasis concerned, the baryonic contribution is dominated in thecenters by stars for all galaxies. However for low-mass, moregas-rich galaxies, the gas contribution surpasses the stellarcontribution at the outskirts of the galaxies.
In summary, our model galaxies display a range of re-alistic morphologies in gas and stars. Unlike in many previ-
c© 2013 RAS, MNRAS 000, 1–??
Spiral galaxies in cosmological simulations 15
0.0 0.2 0.4 0.6 0.8 1.0mstellar(tform) / mstellar (z=0)
-5
0
5
10
Vro
t / σ
z
M200 < 5 x 10¹¹ MO •
z=0
0.2 0.4 0.6 0.8 mstellar(tform) / mstellar (z=0)
5 x 10¹¹ < M200/MO • < 1.55 x 10¹²
z=0
0.0 0.2 0.4 0.6 0.8 1.0mstellar(tform) / mstellar (z=0)
-5
0
5
10
Vro
t / σ
z
M200 > 1.55 x 10¹² MO •
z=0
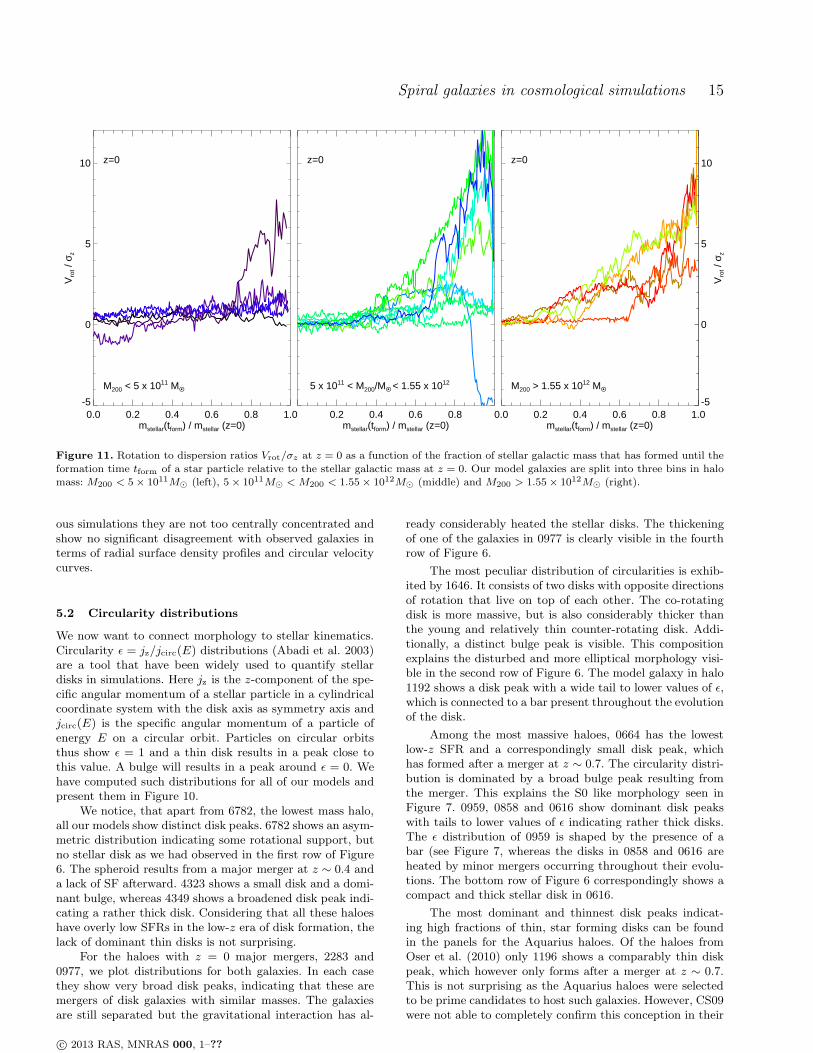
Figure 11. Rotation to dispersion ratios Vrot/σz at z = 0 as a function of the fraction of stellar galactic mass that has formed until the
formation time tform of a star particle relative to the stellar galactic mass at z = 0. Our model galaxies are split into three bins in halomass: M200 < 5× 10¹¹M⊙ (left), 5× 10¹¹M⊙ < M200 < 1.55× 10¹²M⊙ (middle) and M200 > 1.55× 10¹²M⊙ (right).
ous simulations they are not too centrally concentrated andshow no significant disagreement with observed galaxies interms of radial surface density profiles and circular velocitycurves.
5.2 Circularity distributions
We now want to connect morphology to stellar kinematics.Circularity ǫ = jz/jcirc(E) distributions (Abadi et al. 2003)are a tool that have been widely used to quantify stellardisks in simulations. Here jz is the z-component of the spe-cific angular momentum of a stellar particle in a cylindricalcoordinate system with the disk axis as symmetry axis andjcirc(E) is the specific angular momentum of a particle ofenergy E on a circular orbit. Particles on circular orbitsthus show ǫ = 1 and a thin disk results in a peak close tothis value. A bulge will results in a peak around ǫ = 0. Wehave computed such distributions for all of our models andpresent them in Figure 10.
We notice, that apart from 6782, the lowest mass halo,all our models show distinct disk peaks. 6782 shows an asym-metric distribution indicating some rotational support, butno stellar disk as we had observed in the first row of Figure6. The spheroid results from a major merger at z ∼ 0.4 anda lack of SF afterward. 4323 shows a small disk and a domi-nant bulge, whereas 4349 shows a broadened disk peak indi-cating a rather thick disk. Considering that all these haloeshave overly low SFRs in the low-z era of disk formation, thelack of dominant thin disks is not surprising.
For the haloes with z = 0 major mergers, 2283 and0977, we plot distributions for both galaxies. In each casethey show very broad disk peaks, indicating that these aremergers of disk galaxies with similar masses. The galaxiesare still separated but the gravitational interaction has al-
ready considerably heated the stellar disks. The thickeningof one of the galaxies in 0977 is clearly visible in the fourthrow of Figure 6.
The most peculiar distribution of circularities is exhib-ited by 1646. It consists of two disks with opposite directionsof rotation that live on top of each other. The co-rotatingdisk is more massive, but is also considerably thicker thanthe young and relatively thin counter-rotating disk. Addi-tionally, a distinct bulge peak is visible. This compositionexplains the disturbed and more elliptical morphology visi-ble in the second row of Figure 6. The model galaxy in halo1192 shows a disk peak with a wide tail to lower values of ǫ,which is connected to a bar present throughout the evolutionof the disk.
Among the most massive haloes, 0664 has the lowestlow-z SFR and a correspondingly small disk peak, whichhas formed after a merger at z ∼ 0.7. The circularity distri-bution is dominated by a broad bulge peak resulting fromthe merger. This explains the S0 like morphology seen inFigure 7. 0959, 0858 and 0616 show dominant disk peakswith tails to lower values of ǫ indicating rather thick disks.The ǫ distribution of 0959 is shaped by the presence of abar (see Figure 7, whereas the disks in 0858 and 0616 areheated by minor mergers occurring throughout their evolu-tions. The bottom row of Figure 6 correspondingly shows acompact and thick stellar disk in 0616.
The most dominant and thinnest disk peaks indicat-ing high fractions of thin, star forming disks can be foundin the panels for the Aquarius haloes. Of the haloes fromOser et al. (2010) only 1196 shows a comparably thin diskpeak, which however only forms after a merger at z ∼ 0.7.This is not surprising as the Aquarius haloes were selectedto be prime candidates to host such galaxies. However, CS09were not able to completely confirm this conception in their
c© 2013 RAS, MNRAS 000, 1–??

16 M. Aumer et al.
0. 0.2 0.4 0.6 0.8 1.aform
-1.0
-0.5
0.0
0.5
1.0
ε
0977-1
-1.0
-0.5
0.0
0.5
1.0
ε
6782
10. 4.0 2.0 1.0 0.5 0.2 0.zform
0. 0.2 0.4 0.6 0.8 1.aform
AqC
1646
10. 4.0 2.0 1.0 0.5 0.2 0.zform
0. 0.2 0.4 0.6 0.8 1.aform
0616
-1.0
-0.5
0.0
0.5
1.0
ε
AqB
10. 4.0 2.0 1.0 0.5 0.2 0.zform
-1.0
-0.5
0.0
0.5
1.0
ε
0.0
0.2
0.4
0.6
0.8
1.0
n(ε,
a for
m)
/ nm
ax
Figure 12. The normalized number densities of the stars in six of our galaxy models at z = 0 over the plane of circularity ǫ vs. formationscale factor aform, n(ǫ, aform/nmax). The models are from top to bottom: 6782, 1646, AqB, one of the two merging galaxies in 0977, AqCand 0616.
study of all haloes, as their highest kinematic disk fractionswere ∼ 25%. Higher disk fractions were found for differentcodes for AqC in CS12, but these galaxies did not comparewell to observed disk galaxies. Okamoto (2013) presentedthe best Aquarius cosmological disk models so far for haloesAqC and AqD, their circularity distributions are howeverless disk dominated than ours. Considering the idealized,semi-cosmological models in AqA and AqC from AW13, ourcosmological simulations produce disk fractions similar tothe reference model ARef, but not as good as the best mod-els presented there. This is not surprising, as these modelsignore the evolution at z > 1.3 when destructive mergersoccur.
To illustrate the change in circularity distributions be-tween the models of CS09 and our models we over-plotin Fig. 10 the corresponding curves for their models ofAqA, AqB, AqC and AqD in grey. 1 For AqA they found
1 Note that the circularity distributions presented in Figure 3of CS09 were based on a different definition of circularity, ǫV =
jz/(rVcirc(r)) with Vcirc =√
GM(< r)/r. Comparing Figure 3of CS09 to Figure 2 of Tissera et al. (2012), who used the samedefinition as we did and analyzed the models of CS09, illustrateshow the definition of circularity affects the shape of the circularitydistribution.
hardly any disk and correspondingly the difference betweentheir bulge-dominated and our disk-dominated model is veryprominent. For AqC they found their highest disk fraction,but the increase in disk-fraction by a factor of almost 3 is stillclearly visible. For AqB and AqD, the increase in disk frac-tion is also striking. This comparison clearly favours the useof very efficient feedback recipes in simulations. We howevernote that more conservative approaches to feedback modelshave also been successful in producing distinct disk peaksin circularity distributions (see e.g. Governato et al. 2007;Few et al. 2012).
In summary, our models show a large variety of kine-matic properties ranging from rotating spheroids, bulge-dominated disks and counter-rotating components over disksthickened by misaligned infall, bars and mergers to compact,massive disks and dominant thin disks.
5.3 Disk Fractions
Disk fractions in simulations are sometimes quanti-fied by mock photometric surface brightness decompo-sitions (see e.g. Agertz et al. 2011; Guedes et al. 2011).Scannapieco et al. (2010) showed that this way of estima-tion yields significantly higher disk fractions than kinematicdecompositions. In this work, we focus on kinematic disk
c© 2013 RAS, MNRAS 000, 1–??
Spiral galaxies in cosmological simulations 17
0.0 0.2 0.4 0.6 0.8 1.0fthin
0.0
0.2
0.4
0.6
0.8
1.0
f(ε>
0.7)
z=0
0.0 0.2 0.4 0.6 0.8 1.0fthin
0.0
0.2
0.4
0.6
0.8
1.0
κ rot
z=0
0.0 0.2 0.4 0.6 0.8 1.0fthin
0.0
0.2
0.4
0.6
0.8
1.0
a dis
k fo
rmat
ion
10.
4.0
2.0
1.0
0.5
0.2
0.0
z dis
k fo
rmat
ion
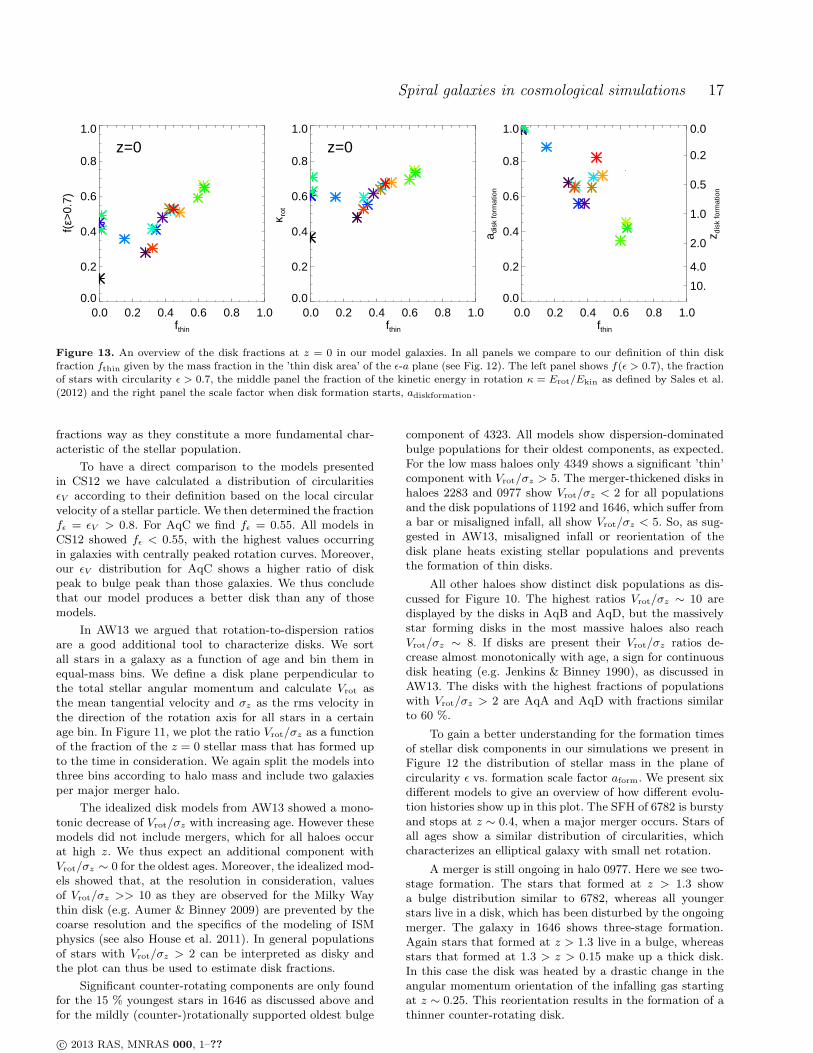
Figure 13. An overview of the disk fractions at z = 0 in our model galaxies. In all panels we compare to our definition of thin diskfraction fthin given by the mass fraction in the ’thin disk area’ of the ǫ-a plane (see Fig. 12). The left panel shows f(ǫ > 0.7), the fractionof stars with circularity ǫ > 0.7, the middle panel the fraction of the kinetic energy in rotation κ = Erot/Ekin as defined by Sales et al.
(2012) and the right panel the scale factor when disk formation starts, adiskformation.
fractions way as they constitute a more fundamental char-acteristic of the stellar population.
To have a direct comparison to the models presentedin CS12 we have calculated a distribution of circularitiesǫV according to their definition based on the local circularvelocity of a stellar particle. We then determined the fractionfǫ = ǫV > 0.8. For AqC we find fǫ = 0.55. All models inCS12 showed fǫ < 0.55, with the highest values occurringin galaxies with centrally peaked rotation curves. Moreover,our ǫV distribution for AqC shows a higher ratio of diskpeak to bulge peak than those galaxies. We thus concludethat our model produces a better disk than any of thosemodels.
In AW13 we argued that rotation-to-dispersion ratiosare a good additional tool to characterize disks. We sortall stars in a galaxy as a function of age and bin them inequal-mass bins. We define a disk plane perpendicular tothe total stellar angular momentum and calculate Vrot asthe mean tangential velocity and σz as the rms velocity inthe direction of the rotation axis for all stars in a certainage bin. In Figure 11, we plot the ratio Vrot/σz as a functionof the fraction of the z = 0 stellar mass that has formed upto the time in consideration. We again split the models intothree bins according to halo mass and include two galaxiesper major merger halo.
The idealized disk models from AW13 showed a mono-tonic decrease of Vrot/σz with increasing age. However thesemodels did not include mergers, which for all haloes occurat high z. We thus expect an additional component withVrot/σz ∼ 0 for the oldest ages. Moreover, the idealized mod-els showed that, at the resolution in consideration, valuesof Vrot/σz >> 10 as they are observed for the Milky Waythin disk (e.g. Aumer & Binney 2009) are prevented by thecoarse resolution and the specifics of the modeling of ISMphysics (see also House et al. 2011). In general populationsof stars with Vrot/σz > 2 can be interpreted as disky andthe plot can thus be used to estimate disk fractions.
Significant counter-rotating components are only foundfor the 15 % youngest stars in 1646 as discussed above andfor the mildly (counter-)rotationally supported oldest bulge
component of 4323. All models show dispersion-dominatedbulge populations for their oldest components, as expected.For the low mass haloes only 4349 shows a significant ’thin’component with Vrot/σz > 5. The merger-thickened disks inhaloes 2283 and 0977 show Vrot/σz < 2 for all populationsand the disk populations of 1192 and 1646, which suffer froma bar or misaligned infall, all show Vrot/σz < 5. So, as sug-gested in AW13, misaligned infall or reorientation of thedisk plane heats existing stellar populations and preventsthe formation of thin disks.
All other haloes show distinct disk populations as dis-cussed for Figure 10. The highest ratios Vrot/σz ∼ 10 aredisplayed by the disks in AqB and AqD, but the massivelystar forming disks in the most massive haloes also reachVrot/σz ∼ 8. If disks are present their Vrot/σz ratios de-crease almost monotonically with age, a sign for continuousdisk heating (e.g. Jenkins & Binney 1990), as discussed inAW13. The disks with the highest fractions of populationswith Vrot/σz > 2 are AqA and AqD with fractions similarto 60 %.
To gain a better understanding for the formation timesof stellar disk components in our simulations we present inFigure 12 the distribution of stellar mass in the plane ofcircularity ǫ vs. formation scale factor aform. We present sixdifferent models to give an overview of how different evolu-tion histories show up in this plot. The SFH of 6782 is burstyand stops at z ∼ 0.4, when a major merger occurs. Stars ofall ages show a similar distribution of circularities, whichcharacterizes an elliptical galaxy with small net rotation.
A merger is still ongoing in halo 0977. Here we see two-stage formation. The stars that formed at z > 1.3 showa bulge distribution similar to 6782, whereas all youngerstars live in a disk, which has been disturbed by the ongoingmerger. The galaxy in 1646 shows three-stage formation.Again stars that formed at z > 1.3 live in a bulge, whereasstars that formed at 1.3 > z > 0.15 make up a thick disk.In this case the disk was heated by a drastic change in theangular momentum orientation of the infalling gas startingat z ∼ 0.25. This reorientation results in the formation of athinner counter-rotating disk.
c© 2013 RAS, MNRAS 000, 1–??
18 M. Aumer et al.
In 0616 the picture is more complicated. Stars at allformation times a < 0.8 show a broad bulge distribution. Ata = 0.8 a last destructive merger occurs. However there is anolder disk population, formed at 0.6 < a < 0.8, that has sur-vived thickened by the merger. A thinner disks forms aftera = 0.8, but there are also young stars with thick disk cir-cularities, which are connected to ongoing interactions withsatellite galaxies after a = 0.8.
This is not the case for the disks in AqB and AqC.For both a dominant disk population is visible at high ǫafter some well-defined time when formation starts, whichfor AqB is a destructive merger at z ∼ 1. In AqC disk set-tling starts around z = 2 when mergers stop disturbing thegalaxy. The disk populations widen in ǫ for older ages, againindicating continuous disk heating.
These ǫ vs. a plots provide us with a good procedureto define disk fractions. We can define a ’disk area’ in thisdiagram, which for AqB is clearly given by a > 0.55 andǫ > 0.8. The lower border for ǫ is not well-defined, howeverǫ ∼ 0.75 works well for all examples. We hereby also define atime when disk formation starts. With this definition, 6782and 0977-1 have no disks, the latter as the stellar systemhas been significantly heated by the ongoing merger. Wetherefore refer to this definition of disk fraction as ’thin diskfraction’ fthin, but caution that observed thick disks wouldnot necessarily be excluded by this method.
For 1646, the counter-rotating disk is counted as thethin disk and for 0616 only the disk that formed at a > 0.8is included. We use this procedure to determine fthin forall model galaxies and use the values in Figure 13. In theright panel we plot disk formation time aform against fthin.The values for fthin range between 0.15 (the counter-rotatingdisk in 1646) and 0.64 (AqA and AqD). We clearly see acorrelation in the sense that younger disks have smaller massfractions, which is not surprising. It is however interesting tohave qualitative predictions for the connection of the timeof the last destructive event and the final disk fraction. It isalso interesting that the best disks in the Aquarius haloesAqA, AqC and AqD separate from the rest of the populationindicating that their selection criteria indeed yielded haloeswhich host dominant disk galaxies.
We also compare to previously used definitions to quan-tify disks. CS12 used all stars with ǫV > 0.8. We find thatfor our definition of the circularity ǫ > 0.7 gives similarresults. From the left panel in Figure 13 we see a clear cor-relation between the two disk fractions. However a simple ǫcut assigns a disk fraction to the thick merging systems aswell as to the elliptical galaxy 6782. Sales et al. (2012) usedthe fraction of kinetic energy in rotation κ = Erot/Ekin asan indicator for diskiness. κ increases with increasing fthinexcept for ongoing mergers.
In conclusion, we have shown how rotation-to-dispersion ratios and the distribution of stars in the planeof circularity vs. formation time can be used to connect thekinematics and the formation history of model galaxies. Ourgalaxies are not as dynamically cold as real galaxies due tonumerical issues. However, they realistically show that theoldest components of galaxies are dispersion dominated andthat rotational support increases with decreasing age of starsas observed in disk galaxies. We have shown that the modeldisk fractions in our Aquarius galaxies are higher than inany previously published simulation for these haloes. The
0.0
0.2
0.4
0.6
0.8
1.0
Mco
ld g
as /
M b
aryo
ns
z=0
Peeples & Shankar (2011)
109 1010 1011Mstellar [MO •
]
0.0
0.2
0.4
0.6
0.8
1.0
Mco
ld g
as /
M b
aryo
ns
z=1
Tacconi(2010) z=1.1-1.3
109 1010 1011
Mstellar [MO •]
0.0
0.2
0.4
0.6
0.8
1.0
Mco
ld g
as /
M b
aryo
ns
z=2Erb (2006)
Tacconi(2010) z=2.2-2.3
Figure 14. The fraction of the mass in gas with T < 104 K tototal baryonic mass within 20 kpc vs. the galactic stellar massMstellar at redshifts, z = 0, 1 and 2. Overplotted are the observedmean z = 0 relation presented by Peeples & Shankar (2011),an approximate relation for z = 2 obtained from the results ofErb et al. (2006) and data from Tacconi et al. (2010).
disk fraction in our simulations depends mostly on the timesince the last destructive event, be it merger or misalignedinfall.
6 SCALING RELATIONS
We continue our study of the galaxy population constitutedby our models and have a look at how they compare toobserved relations involving stellar and gas masses, rotationvelocities, sizes and metallicities.
6.1 Gas fractions
Observed gas fractions in z = 0 galaxies show a cleartrend of higher gas fractions at lower galaxy masses(Haynes & Giovanelli 2012, see Peeples & Shankar 2011 fora recent compilation of data). At z = 1 − 2, Tacconi et al.
c© 2013 RAS, MNRAS 000, 1–??
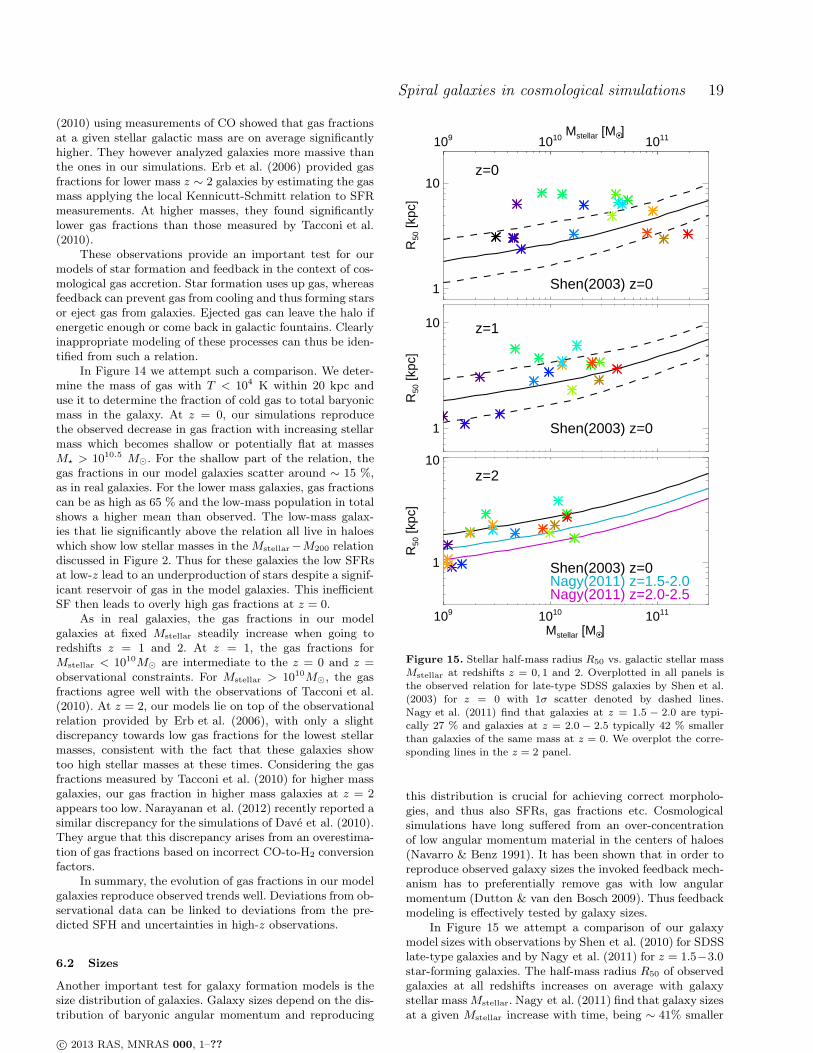
Spiral galaxies in cosmological simulations 19
(2010) using measurements of CO showed that gas fractionsat a given stellar galactic mass are on average significantlyhigher. They however analyzed galaxies more massive thanthe ones in our simulations. Erb et al. (2006) provided gasfractions for lower mass z ∼ 2 galaxies by estimating the gasmass applying the local Kennicutt-Schmitt relation to SFRmeasurements. At higher masses, they found significantlylower gas fractions than those measured by Tacconi et al.(2010).
These observations provide an important test for ourmodels of star formation and feedback in the context of cos-mological gas accretion. Star formation uses up gas, whereasfeedback can prevent gas from cooling and thus forming starsor eject gas from galaxies. Ejected gas can leave the halo ifenergetic enough or come back in galactic fountains. Clearlyinappropriate modeling of these processes can thus be iden-tified from such a relation.
In Figure 14 we attempt such a comparison. We deter-mine the mass of gas with T < 104 K within 20 kpc anduse it to determine the fraction of cold gas to total baryonicmass in the galaxy. At z = 0, our simulations reproducethe observed decrease in gas fraction with increasing stellarmass which becomes shallow or potentially flat at massesM⋆ > 1010.5 M⊙. For the shallow part of the relation, thegas fractions in our model galaxies scatter around ∼ 15 %,as in real galaxies. For the lower mass galaxies, gas fractionscan be as high as 65 % and the low-mass population in totalshows a higher mean than observed. The low-mass galax-ies that lie significantly above the relation all live in haloeswhich show low stellar masses in the Mstellar−M200 relationdiscussed in Figure 2. Thus for these galaxies the low SFRsat low-z lead to an underproduction of stars despite a signif-icant reservoir of gas in the model galaxies. This inefficientSF then leads to overly high gas fractions at z = 0.
As in real galaxies, the gas fractions in our modelgalaxies at fixed Mstellar steadily increase when going toredshifts z = 1 and 2. At z = 1, the gas fractions forMstellar < 1010M⊙ are intermediate to the z = 0 and z =observational constraints. For Mstellar > 1010M⊙, the gasfractions agree well with the observations of Tacconi et al.(2010). At z = 2, our models lie on top of the observationalrelation provided by Erb et al. (2006), with only a slightdiscrepancy towards low gas fractions for the lowest stellarmasses, consistent with the fact that these galaxies showtoo high stellar masses at these times. Considering the gasfractions measured by Tacconi et al. (2010) for higher massgalaxies, our gas fraction in higher mass galaxies at z = 2appears too low. Narayanan et al. (2012) recently reported asimilar discrepancy for the simulations of Dave et al. (2010).They argue that this discrepancy arises from an overestima-tion of gas fractions based on incorrect CO-to-H2 conversionfactors.
In summary, the evolution of gas fractions in our modelgalaxies reproduce observed trends well. Deviations from ob-servational data can be linked to deviations from the pre-dicted SFH and uncertainties in high-z observations.
6.2 Sizes
Another important test for galaxy formation models is thesize distribution of galaxies. Galaxy sizes depend on the dis-tribution of baryonic angular momentum and reproducing
1
10
R50
[kpc
]
z=0
Shen(2003) z=0
109 1010 1011 Mstellar [MO •
]
1
10
R50
[kpc
]
z=1
Shen(2003) z=0
109 1010 1011
Mstellar [MO •]
1
10
R50
[kpc
]
z=2
Shen(2003) z=0Nagy(2011) z=1.5-2.0Nagy(2011) z=2.0-2.5
Figure 15. Stellar half-mass radius R50 vs. galactic stellar massMstellar at redshifts z = 0, 1 and 2. Overplotted in all panels isthe observed relation for late-type SDSS galaxies by Shen et al.(2003) for z = 0 with 1σ scatter denoted by dashed lines.Nagy et al. (2011) find that galaxies at z = 1.5 − 2.0 are typi-cally 27 % and galaxies at z = 2.0 − 2.5 typically 42 % smallerthan galaxies of the same mass at z = 0. We overplot the corre-sponding lines in the z = 2 panel.
this distribution is crucial for achieving correct morpholo-gies, and thus also SFRs, gas fractions etc. Cosmologicalsimulations have long suffered from an over-concentrationof low angular momentum material in the centers of haloes(Navarro & Benz 1991). It has been shown that in order toreproduce observed galaxy sizes the invoked feedback mech-anism has to preferentially remove gas with low angularmomentum (Dutton & van den Bosch 2009). Thus feedbackmodeling is effectively tested by galaxy sizes.
In Figure 15 we attempt a comparison of our galaxymodel sizes with observations by Shen et al. (2010) for SDSSlate-type galaxies and by Nagy et al. (2011) for z = 1.5−3.0star-forming galaxies. The half-mass radius R50 of observedgalaxies at all redshifts increases on average with galaxystellar mass Mstellar. Nagy et al. (2011) find that galaxy sizesat a given Mstellar increase with time, being ∼ 41% smaller
c© 2013 RAS, MNRAS 000, 1–??
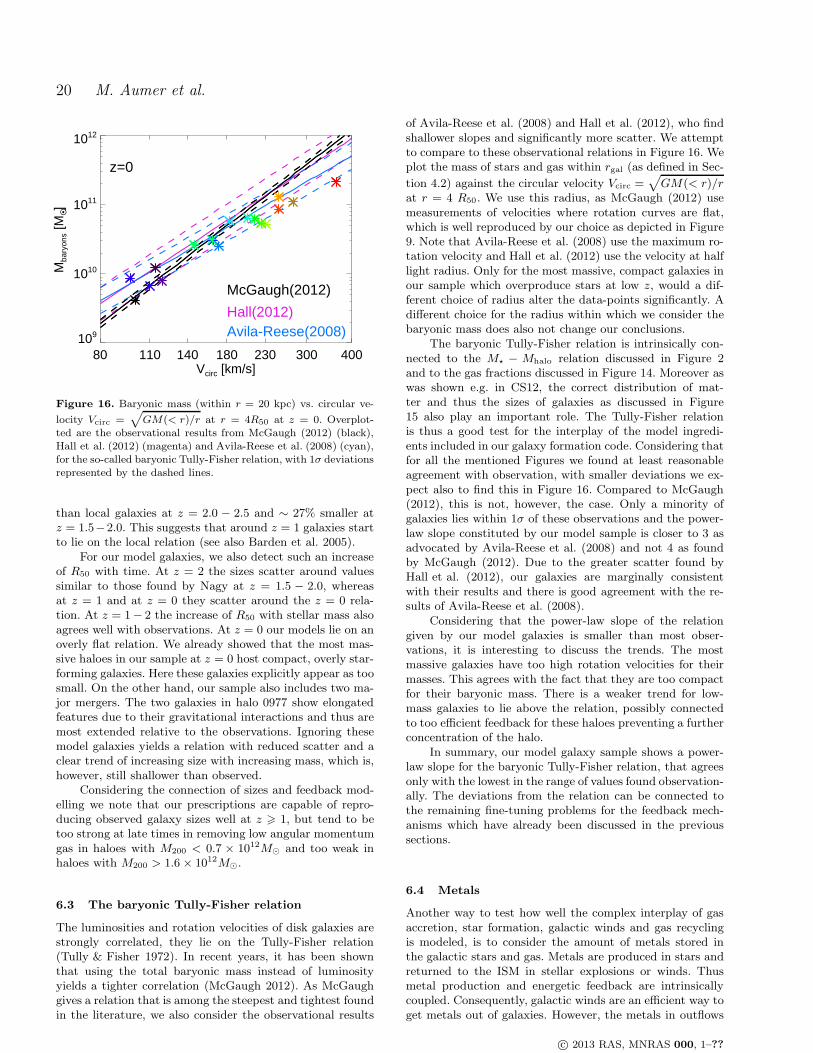
20 M. Aumer et al.
80 110 140 180 230 300 400Vcirc [km/s]
109
1010
1011
1012
Mba
ryon
s [M
O •]
z=0
McGaugh(2012)
Hall(2012)Avila-Reese(2008)
Figure 16. Baryonic mass (within r = 20 kpc) vs. circular ve-
locity Vcirc =√
GM(< r)/r at r = 4R50 at z = 0. Overplot-ted are the observational results from McGaugh (2012) (black),Hall et al. (2012) (magenta) and Avila-Reese et al. (2008) (cyan),for the so-called baryonic Tully-Fisher relation, with 1σ deviationsrepresented by the dashed lines.
than local galaxies at z = 2.0 − 2.5 and ∼ 27% smaller atz = 1.5−2.0. This suggests that around z = 1 galaxies startto lie on the local relation (see also Barden et al. 2005).
For our model galaxies, we also detect such an increaseof R50 with time. At z = 2 the sizes scatter around valuessimilar to those found by Nagy at z = 1.5 − 2.0, whereasat z = 1 and at z = 0 they scatter around the z = 0 rela-tion. At z = 1− 2 the increase of R50 with stellar mass alsoagrees well with observations. At z = 0 our models lie on anoverly flat relation. We already showed that the most mas-sive haloes in our sample at z = 0 host compact, overly star-forming galaxies. Here these galaxies explicitly appear as toosmall. On the other hand, our sample also includes two ma-jor mergers. The two galaxies in halo 0977 show elongatedfeatures due to their gravitational interactions and thus aremost extended relative to the observations. Ignoring thesemodel galaxies yields a relation with reduced scatter and aclear trend of increasing size with increasing mass, which is,however, still shallower than observed.
Considering the connection of sizes and feedback mod-elling we note that our prescriptions are capable of repro-ducing observed galaxy sizes well at z > 1, but tend to betoo strong at late times in removing low angular momentumgas in haloes with M200 < 0.7 × 10¹²M⊙ and too weak inhaloes with M200 > 1.6× 10¹²M⊙.
6.3 The baryonic Tully-Fisher relation
The luminosities and rotation velocities of disk galaxies arestrongly correlated, they lie on the Tully-Fisher relation(Tully & Fisher 1972). In recent years, it has been shownthat using the total baryonic mass instead of luminosityyields a tighter correlation (McGaugh 2012). As McGaughgives a relation that is among the steepest and tightest foundin the literature, we also consider the observational results
of Avila-Reese et al. (2008) and Hall et al. (2012), who findshallower slopes and significantly more scatter. We attemptto compare to these observational relations in Figure 16. Weplot the mass of stars and gas within rgal (as defined in Sec-
tion 4.2) against the circular velocity Vcirc =√
GM(< r)/rat r = 4 R50. We use this radius, as McGaugh (2012) usemeasurements of velocities where rotation curves are flat,which is well reproduced by our choice as depicted in Figure9. Note that Avila-Reese et al. (2008) use the maximum ro-tation velocity and Hall et al. (2012) use the velocity at halflight radius. Only for the most massive, compact galaxies inour sample which overproduce stars at low z, would a dif-ferent choice of radius alter the data-points significantly. Adifferent choice for the radius within which we consider thebaryonic mass does also not change our conclusions.
The baryonic Tully-Fisher relation is intrinsically con-nected to the M⋆ − Mhalo relation discussed in Figure 2and to the gas fractions discussed in Figure 14. Moreover aswas shown e.g. in CS12, the correct distribution of mat-ter and thus the sizes of galaxies as discussed in Figure15 also play an important role. The Tully-Fisher relationis thus a good test for the interplay of the model ingredi-ents included in our galaxy formation code. Considering thatfor all the mentioned Figures we found at least reasonableagreement with observation, with smaller deviations we ex-pect also to find this in Figure 16. Compared to McGaugh(2012), this is not, however, the case. Only a minority ofgalaxies lies within 1σ of these observations and the power-law slope constituted by our model sample is closer to 3 asadvocated by Avila-Reese et al. (2008) and not 4 as foundby McGaugh (2012). Due to the greater scatter found byHall et al. (2012), our galaxies are marginally consistentwith their results and there is good agreement with the re-sults of Avila-Reese et al. (2008).
Considering that the power-law slope of the relationgiven by our model galaxies is smaller than most obser-vations, it is interesting to discuss the trends. The mostmassive galaxies have too high rotation velocities for theirmasses. This agrees with the fact that they are too compactfor their baryonic mass. There is a weaker trend for low-mass galaxies to lie above the relation, possibly connectedto too efficient feedback for these haloes preventing a furtherconcentration of the halo.
In summary, our model galaxy sample shows a power-law slope for the baryonic Tully-Fisher relation, that agreesonly with the lowest in the range of values found observation-ally. The deviations from the relation can be connected tothe remaining fine-tuning problems for the feedback mech-anisms which have already been discussed in the previoussections.
6.4 Metals
Another way to test how well the complex interplay of gasaccretion, star formation, galactic winds and gas recyclingis modeled, is to consider the amount of metals stored inthe galactic stars and gas. Metals are produced in stars andreturned to the ISM in stellar explosions or winds. Thusmetal production and energetic feedback are intrinsicallycoupled. Consequently, galactic winds are an efficient way toget metals out of galaxies. However, the metals in outflows
c© 2013 RAS, MNRAS 000, 1–??

Spiral galaxies in cosmological simulations 21
109 1010 1011 1012
Mstellar [MO •]
-1.0
-0.5
0.0
0.5
[Z] s
tella
r
z=0
Figure 17. Mean mass-weighted galactic stellar metallicitywithin r = 3 R50, [Z] vs. stellar galaxy mass Mstellar at z = 0compared to the observational results of Gallazzi et al. (2005)
can diffuse into hot halo gas and re-accrete, alternatively,outflowing material can return in galactic fountains, provid-ing ways for ejected metals to re-enter the galaxy. Moreover,the metal content of galactic gas can be diluted by the ac-cretion of pristine gas. Basically all ingredients in our galaxyformation simulations have a direct influence on the galacticmetallicities.
Whereas gas metallicities probe cumulative effects overthe whole evolution of galaxies, stellar metallicities containprobes from every stage in galaxy formation. In Figure 17 weattempt a comparison of the mean stellar metallicities of ourmodel galaxies to the observational data of Gallazzi et al.(2005). Apart from the too-metal-rich massive galaxies, thesample agrees well with observations and reproduces theslope of total stellar metallicity [Z] with stellar mass.
The picture is different however for gas phase metallic-ities, which we explore in Figure 18. The observed relationsare quite uncertain in their calibration, which is why differ-ent authors find deviations of up to 0.3 dex in the normal-ization of the relation of oxygen abundance 12 + log(O/H)versus galaxy stellar mass. The slope also differs, but tooa smaller amount. Typically, quoted 1σ errors at z = 0are of the order 0.1-0.2 dex depending on mass and cal-ibration. We include three different observed z = 0 rela-tions by Tremonti et al. (2004), Andrews & Martini (2013)and by Maiolino et al. (2008) and compare our results tothem. Our galaxies follow a significantly steeper relationwith higher mass galaxies (M⋆ > 2 × 10¹⁰M⊙) agree-ing with Maiolino et al. (2008) and Tremonti et al. (2004)and the lower mass galaxies in better agreement withAndrews & Martini (2013), but on average more metal-poorthan all three observational relations.
At higher redshifts, we do not find such a disagreementwith the observational slope of the relation. When we com-pare to the results of Maiolino et al. (2008) at z = 0.7−3.5,we find reasonable agreement between our models and ob-servations when taking into account the observational un-certainties. At z = 3.5, our model galaxies are slightly too
8.08.2
8.4
8.6
8.8
9.0
9.2
9.4
12+
log(
O/H
) gas
z=0
Maiolino (2008)Andrews (2012)Tremonti (2004)
109 1010 1011Mstellar [MO •
]
8.0
8.2
8.4
8.6
8.8
9.0
9.2
12+
log(
O/H
) gas
z=0.7
7.8
8.0
8.2
8.4
8.6
8.8
9.0
12+
log(
O/H
) gas
z=2.2
109 1010 1011
Mstellar [MO •]
7.6
7.8
8.0
8.2
8.4
8.6
8.89.0
12+
log(
O/H
) gas
z=3.5
Figure 18. Mean galactic gas-phase oxygen abundance12 + log(O/H) vs. stellar galaxy mass at compared tothe observational results of Maiolino et al. (2008)(black),Andrews & Martini (2013)(magenta) and Tremonti et al. (2004)(cyan, dotted lines mark 1σ regions) at z = 0, 0.7, 2.2 and 3.5. Atz = 3.5, Maiolino et al. (2008) give two calibrations.
metal rich, which considering the over-production of starsat z > 4 is not surprising. At z = 2 we find perfect agree-ment with observations, whereas at z = 0.7 our models areslightly metal-deficient, probably due to the small deficit inSFRs around z = 1. The discrepancies at z = 0 obviouslyorigin at z < 0.7.
At late times, four lower mass galaxies are metal defi-
c© 2013 RAS, MNRAS 000, 1–??

22 M. Aumer et al.
109 1010 1011
Mstellar [MO •]
0.0
0.1
0.2
0.3
0.4
[O/F
e]st
ella
r
z=0
Figure 19. Mean luminosity-weighted galactic stellar oxygen toiron ratio [O/Fe] vs stellar galaxy mass at z = 0 compared tothe observational results of Johansson et al. (2012) for ellipticalgalaxies.
cient. They include two of the haloes with the lowest massesand the two galaxies involved in the major merger of halo0977. We have noted that these galaxies are too gas rich.From observed relations, we know, that higher gas fractionsand lower metallicities are present in lower mass galaxies. Asour lower mass galaxies are deficient in SF and too gas rich,late low metallicity infalling material can dilute the metal-licity and lead to even lower metallicities than the observedones. The most massive galaxies tend to be too metal-rich,which, as discussed for stellar metallicities, can be connectedto overly high low-z SFRs.
It is well known that SNII and SNIa produce differentfractions of elements and explode on different timescales.Because of that, fractions of O (SNII) to Fe (SNIa) test thevalidity of the modeling of metal production yields, SFHsand model SN time distributions. In Figure 19, we plot themean luminosity-weighted element ratio [O/Fe] in stars. Wecompare them to observations from Johansson et al. (2012)for elliptical galaxies. Although the average [O/Fe] in ourgalaxies agrees with ellipticals, these values are too high,as disk galaxies typically show lower values of [O/Fe] dueto the higher SFRs at late times. Compared to observedellipticals, the increase in [O/Fe] with galaxy mass is muchshallower in our model galaxy sample. Clearly, higher low-z SFRs in lower mass galaxies would shift [O/Fe] to lowervalues and the opposite is true for the highest mass galaxieswhich overproduce stars at low redshifts. However, to shiftthe normalization, a different calibration of yields and SNdistributions over time is necessary. As we noted in Section2.2, the metal production yields we apply were not calibratedin any way.
The modeling of turbulent diffusion of metals also hasan influence on the metallicity in galaxies. We find that us-ing higher normalizations for the diffusion coefficients yieldshigher metallicities in galaxies. Using the normalization pro-posed by Greif et al. (2009) (see Section 2.3) increases themetallicity of model galaxies by ∼ 0.2 − 0.4 dex and would
lead to significantly worse results compared to observations.The reason for this is, that outflowing gas is metal-enrichedand thus loses metals to the circumgalactic gas by diffusion.The halo gas can later accrete onto the galaxy (Shen et al.2010). This effect is enhanced by stronger diffusion coeffi-cients.
Metals in galaxies are not equally distributed. Mostgalaxies show gas oxygen metallicities that decrease out-wards, with gradient slopes in units of dex per scale lengthbeing independent of galaxy mass (Zaritsky et al. 1994). Asmore massive galaxies are more extended, absolute gradientsin dex/kpc are thus steeper for galaxies with lower massesand smaller sizes. Disk galaxies have steeper gradients thanellipticals and than interacting disks (Kewley et al. 2010).Zaritsky et al. (1994) found gradients ranging from -0.23 to+0.02 dex/kpc for a sample of ∼ 40 disk galaxies with amean ∼ −0.06 dex/kpc. Gradients are believed to arise fromthe inside-out formation of disk galaxies and the correspond-ing variation of SF and feedback efficiency with radius.
In Figure 20, we plot the gradients which we find in theoxygen abundances in the gas disks of our model galaxiesand plot them against galaxy mass. All our galaxies showclear negative gradients, but they are rather shallow rang-ing from -0.053 to -0.007 dex/kpc , being a factor of ∼ 3− 4shallower than observations. We do however reproduce thefact that absolute gradients are steeper for smaller galaxies.As far as our interacting galaxies in the merger haloes 2283and 0977 are concerned, the extended disks in halo 0977 in-deed have flatter gradients than the other galaxies of similarmass. The significantly more compact galaxies in halo 2283however show the steepest gradients in our sample.
It is interesting that Pilkington et al. (2012) foundsteeper gradients in a set of cosmological simulations withAMR and SPH codes. Considering our modeling there aretwo ingredients which can make gradients become too flat.Turbulent diffusion of metals is modeled on the scale of theSPH smoothing kernel and thus is not independent of res-olution. In test simulations, we find that stronger diffusionproduces flatter metallicity gradients, as diffusion intrinsi-cally acts against metallicity gradients. Moreover, our twophase enrichment model, which spreads half of the metalsinto the hot gas phase, intrinsically yields a relatively non-local enrichment of the ISM, which also weakens gradients.
Recently, Gibson et al. (2013) compared gradients incosmological simulations which share initial conditions butuse different feedback prescriptions. They found that modelswhich assume efficient SN feedback and pre-SN early stellarfeedback produce shallower metallicity gradients than moreconservative feedback models, as they spread metals overlarger scales. As our models, their stronger feedback mod-els also do not predict a steepening of gradients at high-z,a behaviour displayed by their weaker feedback models. Ingeneral, their conclusions about the interplay between feed-back and gradients thus agree well with ours.
In summary, our model galaxies reproduce the observedrelation of stellar metallicity vs. stellar mass well. The evo-lution of the gas phase oxygen abundance is also reproducedreasonably well at z > 1. At low-z the problems with SFHsdiscussed in Section 4.2 lead to deviations from observation.The oxygen-to-iron fractions [O/Fe] in our models are toohigh and the metallicity gradients in our gas disks are tooshallow. This indicates that the details of our modeling of
c© 2013 RAS, MNRAS 000, 1–??
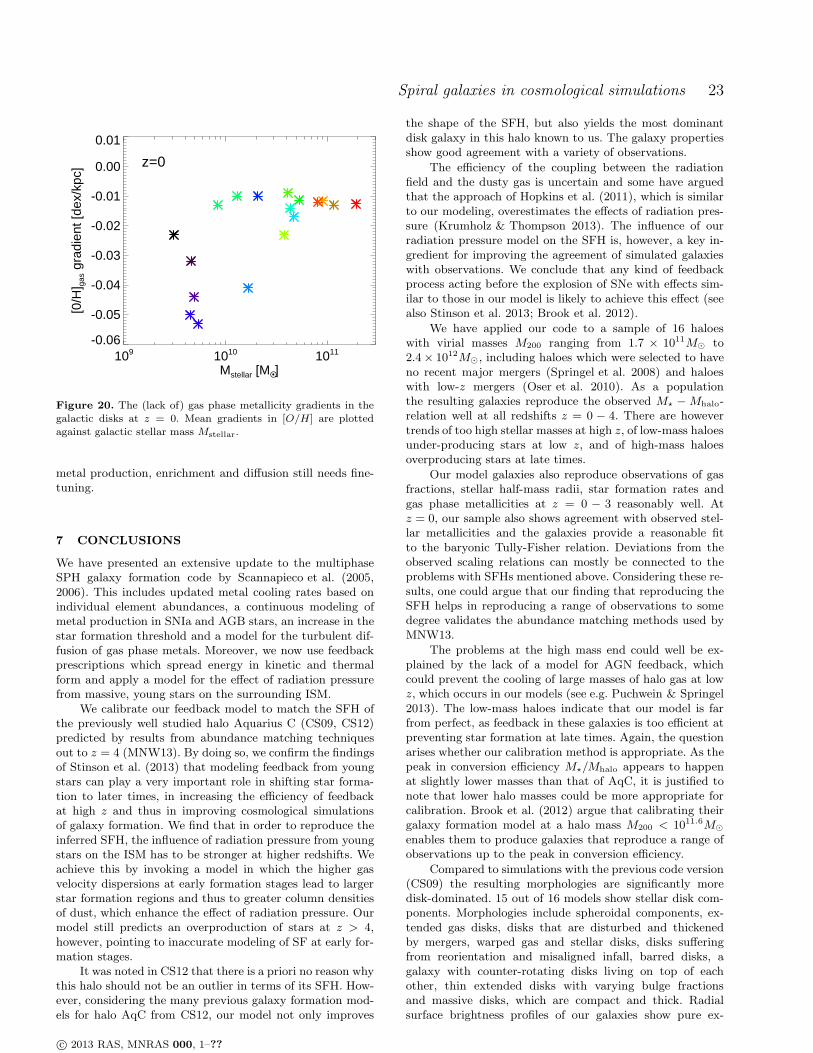
Spiral galaxies in cosmological simulations 23
109 1010 1011
Mstellar [MO •]
-0.06
-0.05
-0.04
-0.03
-0.02
-0.01
0.00
0.01
[0/H
] gas
gra
dien
t [de
x/kp
c]
z=0
Figure 20. The (lack of) gas phase metallicity gradients in thegalactic disks at z = 0. Mean gradients in [O/H] are plottedagainst galactic stellar mass Mstellar.
metal production, enrichment and diffusion still needs fine-tuning.
7 CONCLUSIONS
We have presented an extensive update to the multiphaseSPH galaxy formation code by Scannapieco et al. (2005,2006). This includes updated metal cooling rates based onindividual element abundances, a continuous modeling ofmetal production in SNIa and AGB stars, an increase in thestar formation threshold and a model for the turbulent dif-fusion of gas phase metals. Moreover, we now use feedbackprescriptions which spread energy in kinetic and thermalform and apply a model for the effect of radiation pressurefrom massive, young stars on the surrounding ISM.
We calibrate our feedback model to match the SFH ofthe previously well studied halo Aquarius C (CS09, CS12)predicted by results from abundance matching techniquesout to z = 4 (MNW13). By doing so, we confirm the findingsof Stinson et al. (2013) that modeling feedback from youngstars can play a very important role in shifting star forma-tion to later times, in increasing the efficiency of feedbackat high z and thus in improving cosmological simulationsof galaxy formation. We find that in order to reproduce theinferred SFH, the influence of radiation pressure from youngstars on the ISM has to be stronger at higher redshifts. Weachieve this by invoking a model in which the higher gasvelocity dispersions at early formation stages lead to largerstar formation regions and thus to greater column densitiesof dust, which enhance the effect of radiation pressure. Ourmodel still predicts an overproduction of stars at z > 4,however, pointing to inaccurate modeling of SF at early for-mation stages.
It was noted in CS12 that there is a priori no reason whythis halo should not be an outlier in terms of its SFH. How-ever, considering the many previous galaxy formation mod-els for halo AqC from CS12, our model not only improves
the shape of the SFH, but also yields the most dominantdisk galaxy in this halo known to us. The galaxy propertiesshow good agreement with a variety of observations.
The efficiency of the coupling between the radiationfield and the dusty gas is uncertain and some have arguedthat the approach of Hopkins et al. (2011), which is similarto our modeling, overestimates the effects of radiation pres-sure (Krumholz & Thompson 2013). The influence of ourradiation pressure model on the SFH is, however, a key in-gredient for improving the agreement of simulated galaxieswith observations. We conclude that any kind of feedbackprocess acting before the explosion of SNe with effects sim-ilar to those in our model is likely to achieve this effect (seealso Stinson et al. 2013; Brook et al. 2012).
We have applied our code to a sample of 16 haloeswith virial masses M200 ranging from 1.7 × 10¹¹M⊙ to2.4× 1012M⊙, including haloes which were selected to haveno recent major mergers (Springel et al. 2008) and haloeswith low-z mergers (Oser et al. 2010). As a populationthe resulting galaxies reproduce the observed M⋆ − Mhalo-relation well at all redshifts z = 0 − 4. There are howevertrends of too high stellar masses at high z, of low-mass haloesunder-producing stars at low z, and of high-mass haloesoverproducing stars at late times.
Our model galaxies also reproduce observations of gasfractions, stellar half-mass radii, star formation rates andgas phase metallicities at z = 0 − 3 reasonably well. Atz = 0, our sample also shows agreement with observed stel-lar metallicities and the galaxies provide a reasonable fitto the baryonic Tully-Fisher relation. Deviations from theobserved scaling relations can mostly be connected to theproblems with SFHs mentioned above. Considering these re-sults, one could argue that our finding that reproducing theSFH helps in reproducing a range of observations to somedegree validates the abundance matching methods used byMNW13.
The problems at the high mass end could well be ex-plained by the lack of a model for AGN feedback, whichcould prevent the cooling of large masses of halo gas at lowz, which occurs in our models (see e.g. Puchwein & Springel2013). The low-mass haloes indicate that our model is farfrom perfect, as feedback in these galaxies is too efficient atpreventing star formation at late times. Again, the questionarises whether our calibration method is appropriate. As thepeak in conversion efficiency M⋆/Mhalo appears to happenat slightly lower masses than that of AqC, it is justified tonote that lower halo masses could be more appropriate forcalibration. Brook et al. (2012) argue that calibrating theirgalaxy formation model at a halo mass M200 < 1011.6M⊙
enables them to produce galaxies that reproduce a range ofobservations up to the peak in conversion efficiency.
Compared to simulations with the previous code version(CS09) the resulting morphologies are significantly moredisk-dominated. 15 out of 16 models show stellar disk com-ponents. Morphologies include spheroidal components, ex-tended gas disks, disks that are disturbed and thickenedby mergers, warped gas and stellar disks, disks sufferingfrom reorientation and misaligned infall, barred disks, agalaxy with counter-rotating disks living on top of eachother, thin extended disks with varying bulge fractionsand massive disks, which are compact and thick. Radialsurface brightness profiles of our galaxies show pure ex-
c© 2013 RAS, MNRAS 000, 1–??

24 M. Aumer et al.
ponentials and bulge + exponential disk profiles, as wellas up- and down-bending breaks, as found in observa-tions (Martın-Navarro et al. 2012). Moreover, apart formtwo massive galaxies, all circular velocity curves are flat andnone show strong central peaks of the kind encountered inmany previous simulations (e.g. some models in CS12).
We show how distributions of stars over the circular-ity ǫ vs. formation time aform plane can be used to visual-ize formation histories and extract disk populations. Thistool nicely reveals mergers and misaligned infall of gas. In-terestingly, if misaligned infall and/or the reorientation ofexisting disks occur, the signatures of these processes whichheat stellar populations, are very similar to those observedfor idealized, semi-cosmological models studied by AW13.These processes are of interest in the context of the for-mation of counter-rotating components and 2σ signaturesfound in several elliptical galaxies (Krajnovic et al. 2008).
Most of the disks in our model sample feature a well-defined start for disk formation, defined by a merger or amisaligned infall event. The later the last destructive eventoccurs, the lower the disk mass. These ’disk ages’ all corre-spond to z < 2. It is interesting that the age inferred for thethin disk population in the solar neighbourhood is even older(see Aumer & Binney 2009 and references therein). It shouldalso be noted that observational evidence in favour of a pic-ture where a significant fraction disk galaxies (re)-formedafter a destructive event since z ∼ 2 exists (Puech et al.2012), consistent with the idea that the Milky Way’s forma-tion history was more quiescent than that of an average diskgalaxy (Hammer et al. 2007).
The disk fractions derived from the ǫ−aform plots rangefrom 15 to 65 %. Some galaxies are thus disk dominated.However, there are real galaxies with even higher disk frac-tions. Considering the shortcomings of our SFHs at z > 4,and assuming disk formation times are correctly modeled,we can estimate disk fractions for our haloes under the as-sumption that SFHs follow the MNW13 predictions. For ourthree most disk-dominated galaxies, these estimations yieldan increase in disk fraction from 59-65 % to 70-77 %. Wethus conclude that high disk fractions are not problematicfor ΛCDM haloes with sufficiently quiet merger histories.The Aquarius haloes show the highest disk fractions andthe quietest merger histories, as was expected from their se-lection. However, previous simulations (CS09, CS12) failedto validate these predictions.
Some of the problems of our simulations are connectedto metallicities. Although our model galaxies reproduce thestellar metallicity - stellar mass relation, the z = 0 gas phasemetallicity - stellar mass relation is too steep, our alpha-element abundances are too high and the metallicity gradi-ents in our disks are too shallow. No optimization of yieldshas been attempted for our models so far, leaving room forimprovement. Shallow metallicity gradients are likely to beconnected to the details of our diffusion model and our two-phase enrichment scheme, which both could require modifi-cation. Another problem is that tests indicate unsatisfactoryconvergence of our results when increasing the resolution.Such problems are common for galaxy formation codes (seee.g. the discussion in CS12). One must take into account thatimportant ingredients are ’sub-grid’ and thus that a depen-dence on the lowest resolved length-scale is expected whenresolution is increased without adjusting model parameters.
In general, our simulations provide us with an interest-ing sample of simulated galaxies with realistic properties atleast for MW-like halo masses M200 ∼ 1012M⊙. The simula-tions predict many more observables that can be comparedto the real galaxy population than are touched in this paper.
ACKNOWLEDGMENTS
We thank the referee, Brad Gibson, for valuable comments.MA acknowledges support from the DFG Excellence Cluster”Origin and Structure of the Universe”. SW was supportedin part by Advanced Grant 246797 ”GALFORMOD” fromthe European Research Council.
REFERENCES
Abadi M. G., Navarro J. F., Steinmetz M., Eke V. R., 2003,ApJ, 597, 21
Agertz O., Teyssier R., Moore B., 2011, MNRAS, 410, 1391Agertz O., Kravtsov A. V., Leitner S. N., Gnedin N. Y.,2013, ApJ, 770, 25
Andrews B. H., Martini P., 2013, ApJ, 765, 140Aumer M., Binney J. J., 2009, MNRAS, 397, 1286Aumer M., Burkert A., Johansson P. H., Genzel R., 2010,ApJ, 719, 1230
Aumer M., White S. D. M., 2013, MNRAS, 428, 1055(AW13)
Avila-Reese V., Zavala J., Firmani C., Hernandez-ToledoH. M., 2008, AJ, 136, 1340
Barden M. et al., 2005, ApJ, 635, 959Boylan-Kolchin M., Springel V., White S. D. M., JenkinsA., Lemson G., 2009, MNRAS, 398, 1150
Brook C. B. et al., 2011, MNRAS, 415, 1051Brook C. B., Stinson G., Gibson B. K., Wadsley J., QuinnT., 2012, MNRAS, 424, 1275
Bruzual G., Charlot S., 2003, MNRAS, 344, 1000Chieffi A., Limongi M., 2004, ApJ, 608, 405Christensen C., Quinn T., Governato F., Stilp A., Shen S.,Wadsley J., 2012, MNRAS, 425, 3058
Cleary P. W., Monaghan J. J., 1998, Journal of Computa-tional Physics, 148(1), 227
Courteau S., Dutton A. A., van den Bosch F. C.,MacArthur L. A., Dekel A., McIntosh D. H., Dale D. A.,2007, ApJ, 671, 203
Croton D. J. et al., 2006, MNRAS, 365, 11Daddi E. et al., 2007, ApJ, 670, 156Dave R., Finlator K., Oppenheimer B. D., Fardal M., KatzN., Keres D., Weinberg D. H., 2010, MNRAS, 404, 1355
de Blok W. J. G., Walter F., Brinks E., Trachternach C.,Oh S.-H., Kennicutt Jr. R. C., 2008, AJ, 136, 2648
de Vaucouleurs G., 1958, ApJ, 128, 465Dutton A. A., van den Bosch F. C., 2009, MNRAS, 396,141
Ekstrom S. et al., 2012, A&A, 537, A146Elbaz D. et al., 2007, A&A, 468, 33Erb D. K., Steidel C. C., Shapley A. E., Pettini M., ReddyN. A., Adelberger K. L., 2006, ApJ, 646, 107
Eskridge P. B. et al., 2000, AJ, 119, 536Fall S. M., Efstathiou G., 1980, MNRAS, 193, 189
c© 2013 RAS, MNRAS 000, 1–??
Spiral galaxies in cosmological simulations 25
Few C. G., Gibson B. K., Courty S., Michel-Dansac L.,Brook C. B., Stinson G. S., 2012, A&A, 547, A63
Forster Schreiber N. M. et al., 2009, ApJ, 706, 1364Gallazzi A., Charlot S., Brinchmann J., White S. D. M.,Tremonti C. A., 2005, MNRAS, 362, 41
Genzel R. et al., 2008, ApJ, 687, 59Gibson B. K., Pilkington K., Brook C. B., Stinson G. S.,Bailin J., 2013, A&A, 554, A47
Gnedin N. Y., Tassis K., Kravtsov A. V., 2009, ApJ, 697,55
Governato F., Willman B., Mayer L., Brooks A., StinsonG., Valenzuela O., Wadsley J., Quinn T., 2007, MNRAS,374, 1479
Governato F. et al., 2010, Nature, 463, 203Greif T. H., Glover S. C. O., Bromm V., Klessen R. S.,2009, MNRAS, 392, 1381
Groom W., 1997, PhD thesis, Cambridge Univ.Guedes J., Callegari S., Madau P., Mayer L., 2011, ApJ,742, 76
Guo Q., White S., Li C., Boylan-Kolchin M., 2010, MN-RAS, 404, 1111
Guo Q. et al., 2011, MNRAS, 413, 101Haardt F., Madau P., 2001, in Neumann D. M., TranJ. T. V., eds, XXIst Moriond Astrophys. Meeting, Clus-ters of Galaxies and the High Redshift Universe Observedin X-rays, Editions Frontieres, Paris
Hall M., Courteau S., Dutton A. A., McDonald M., ZhuY., 2012, MNRAS, 425, 2741
Hammer F., Puech M., Chemin L., Flores H., LehnertM. D., 2007, ApJ, 662, 322
Haynes M. P., Giovanelli R., 1984, AJ, 89, 758Hopkins P. F., Quataert E., Murray N., 2011, MNRAS,417, 950
House E. L. et al., 2011, MNRAS, 415, 2652Iwamoto K., Brachwitz F., Nomoto K., Kishimoto N.,Umeda H., Hix W. R., Thielemann F.-K., 1999, ApJS,125, 435
Jenkins A., Binney J., 1990, MNRAS, 245, 305Johansson J., Thomas D., Maraston C., 2012, MNRAS,421, 1908
Johansson P. H., Naab T., Ostriker J. P., 2012, ApJ, 754,115
Kajisawa M., Ichikawa T., Yamada T., Uchimoto Y. K.,Yoshikawa T., Akiyama M., Onodera M., 2010, ApJ, 723,129
Kannan R., Stinson G. S., Maccio A. V., Brook C., Wein-mann S. M., Wadsley J., Couchman H. M. P., 2013, arXive-prints, arXiv:1302.2618
Karakas A. I., 2010, MNRAS, 403, 1413Keres D., Vogelsberger M., Sijacki D., Springel V., Hern-quist L., 2012, MNRAS, 425, 2027
Kewley L. J., Rupke D., Zahid H. J., Geller M. J., BartonE. J., 2010, ApJ, 721, L48
Krajnovic D. et al., 2008, MNRAS, 390, 93Kroupa P., 2001, MNRAS, 322, 231Krumholz M. R., Thompson T. A., 2013, arXiv e-prints,arXiv:1302.4440
Maiolino R. et al., 2008, A&A, 488, 463Maoz D., Mannucci F., 2012, Publications of the Astronom-ical Society of Australia, Volume 29, Issue 4, pp. 447-465
Marri S., White S. D. M., 2003, MNRAS, 345, 561Martın-Navarro I. et al., 2012, MNRAS, 427, 1102
Martınez-Serrano F. J., Serna A., Domınguez-Tenreiro R.,Molla M., 2008, MNRAS, 388, 39
McGaugh S. S., 2012, AJ, 143, 40Moster B. P., Naab T., White S. D. M., 2013, MNRAS,428, 3121 (MNW13)
Murray N., Quataert E., Thompson T. A., 2005, ApJ, 618,569
Naab T., Johansson P. H., Ostriker J. P., Efstathiou G.,2007, ApJ, 658, 710
Nagy S. R., Law D. R., Shapley A. E., Steidel C. C., 2011,ApJ, 735, L19
Narayanan D., Bothwell M., Dave R., 2012, MNRAS, 426,1178
Navarro J. F., Benz W., 1991, ApJ, 380, 320Navarro J. F., White S. D. M., 1994, MNRAS, 267, 401Navarro J. F., Steinmetz M., 1997, ApJ, 478, 13Noguchi M., 1999, ApJ, 514, 77Okamoto T., Eke V. R., Frenk C. S., Jenkins A., 2005,MNRAS, 363, 1299
Okamoto T., 2013, MNRAS, 428, 718Oppenheimer B. D., Dave R., 2006, MNRAS, 373, 1265Oppenheimer B. D., Dave R., Keres D., Fardal M., KatzN., Kollmeier J. A., Weinberg D. H., 2010, MNRAS, 406,2325
Oser L., Ostriker J. P., Naab T., Johansson P. H., BurkertA., 2010, ApJ, 725, 2312
Peeples M. S., Shankar F., 2011, MNRAS, 417, 2962Pilkington K. et al., 2012, A&A, 540, A56Portinari L., Chiosi C., Bressan A., 1998, A&A, 334, 505Puchwein E. and Springel V., 2013, MNRAS, 428, 2966Puech M., Hammer F., Hopkins P. F., Athanassoula E.,Flores H., Rodrigues M., Wang J. L., Yang Y. B., 2012,ApJ, 753, 128
Sales L. V., Navarro J. F., Theuns T., Schaye J., WhiteS. D. M., Frenk C. S., Crain R. A., Dalla Vecchia C.,2012, MNRAS, 423, 1544
Sancisi R., 1976, A&A, 53, 159Sawala T., Guo Q., Scannapieco C., Jenkins A., White S.,2011, MNRAS, 413, 659
Scannapieco C., Tissera P. B., White S. D. M., Springel V.,2005, MNRAS, 364, 552
Scannapieco C., Tissera P. B., White S. D. M., Springel V.,2006, MNRAS, 371, 1125
Scannapieco C., Tissera P. B., White S. D. M., Springel V.,2008, MNRAS, 389, 1137
Scannapieco C., White S. D. M., Springel V., Tissera P. B.,2009, MNRAS, 396, 696 (CS09)
Scannapieco C., Gadotti D. A., Jonsson P., White S. D. M.,2010, MNRAS, 407, L41
Scannapieco C., White S. D. M., Springel V., Tissera P. B.,2011, MNRAS, 417, 154
Scannapieco C. et al., 2012, MNRAS, 423, 1726 (CS12)Shen S., Mo H. J., White S. D. M., Blanton M. R., Kauff-mann G., Voges W., Brinkmann J., Csabai I., 2003, MN-RAS, 343, 978
Shen S., Wadsley J., Stinson G., 2010, MNRAS, 407, 1581Springel V., 2005, MNRAS, 364, 1105Springel V., Hernquist L., 2002, MNRAS, 333, 649Springel V., Di Matteo T., Hernquist L., 2005, MNRAS,361, 776
Springel V., Frenk C. S., White S. D. M., 2006, Nature,440, 1137
c© 2013 RAS, MNRAS 000, 1–??

26 M. Aumer et al.
Springel V. et al., 2008, MNRAS, 391, 1685Stinson G., Seth A., Katz N., Wadsley J., Governato F.,Quinn T., 2006, MNRAS, 373, 1074
Stinson G. S., Brook C., Maccio A. V., Wadsley J., QuinnT. R., Couchman H. M. P., 2013, MNRAS, 428, 129
Tacconi L. J. et al., 2010, Nature, 463, 781Thomas D., Maraston C., Schawinski K., Sarzi M., Silk J.,2010, MNRAS, 404, 1775
Tissera P. B., White S. D. M., Scannapieco C., 2012, MN-RAS, 420, 255
Toomre A., Toomre J., 1972, ApJ, 178, 623Toth G., Ostriker J. P., 1992, ApJ, 389, 5Tremonti C. A. et al., 2004, ApJ, 613, 898Tully R. B., Fisher J. R., 1977, A&A, 54, 661Uhlig M., Pfrommer C., Sharma M., Nath B. B., EnßlinT. A., Springel V., 2012, MNRAS, 423, 2374
Walter F., Brinks E., de Blok W. J. G., Bigiel F., KennicuttJr. R. C., Thornley M. D., Leroy A., 2008, AJ, 136, 2536
White S. D. M., Rees M. J., 1978, MNRAS, 183, 341Wiersma R. P. C., Schaye J., Theuns T., Dalla Vecchia C.,Tornatore L., 2009, MNRAS, 399, 574
Wiersma R. P. C., Schaye J., Smith B. D., 2009, MNRAS,393, 99
Zaritsky D., Kennicutt Jr. R. C., Huchra J. P., 1994, ApJ,420, 87
c© 2013 RAS, MNRAS 000, 1–??