Embed Size (px)
Citation preview
1
Towards OIC Economic Cooperation: Impacts of Developing 8 (D-8)
Preferential Trade Agreement
By
Dr. Jamal Othman, Mustafa Acar and Yaghoob Jafari+
Abstract
The Developing 8 (D-8) comprises 8 developing countries with large Muslim populations that have
formed a freer trade alliance, all of which are OIC members. Among its objectives are to create new
opportunities and enhance intra-trade relations while providing better standards of living amongst its
citizens. This paper examines the trade impacts of possible trade liberalization among the D-8: Turkey,
Malaysia, Indonesia, Bangladesh, Pakistan, Iran, Egypt, and Nigeria using a multi-country computable
general equilibrium model, i.e., GTAP. Results indicate that while D-8 intra-trade is expected to increase
very substantially, not all countries will experience a welfare gain under a free trade arrangement.
Likewise, impact on economic sectors differs substantially across countries.
Key Words: Developing 8, Organization of Islamic countries, Trade Liberalization, Preferential Trade
Arrangement, Economic Integration, GTAP.
+ First and second authors are respectively, Professor of economics at the National University of Malaysia and
Kirikkale University, Turkey. Third author is a Ph.D candidate at the Faculty of Economics and Business, National
University of Malaysia.

2
Background
The Organization of the Islamic Conference (OIC) with its 57 members is the second largest
inter-governmental organization after the UN. As of 2007, the OIC collectively stands for 22
percent of world population, 7 percent of world GDP, 9 percent of world trade, and 12 percent of
intra trade. This compares to EU with only 8 percent of world population; it commands a world
trade share of 35 percent and an impressive intra trade of 60 percent. The hard fact is that
Muslim countries do not trade with or invest in each other’s economies the way they do with the
industrialized or other developing countries. Ironically, when seen from the standpoint of
ownership of global crucial resources, OIC’s potential is enormously striking with more than 70
percent of oil and nearly 50 percent of natural gas reserves of the world.
Intra-OIC trade stands only about 12 percent of the total trade. However, in recent years there
have been clear efforts to enhance trade among OIC member states. Especially relevant is the
OIC Ten–Year Program of Action, adopted in 2005, which identified increased economic
cooperation among OIC members as a key strategy for higher economic growth and welfare.
Thus far a dozen member states have signed the Protocol on Preferential Tariff Scheme
(PRETAS), which proposes a preferential trade regime among the member countries to be
effective as of January, 2009. A special grouping within OIC - the so-called D-8 (developing 8)
group was established in 1997 to strengthen economic relationships and to provide the impetus
for greater economic integration within the larger OIC community.
The D-8 group comprises eight major countries within OIC - Malaysia, Iran, Indonesia, Turkey,
Bangladesh, Nigeria, Pakistan, and Egypt. The D-8 member countries have signed a preferential
trade agreement with the aim of strengthening intra-trade and their economic relationships for
improvements in living standards as well as for world harmony and stability. Various sectors
have been identified for cooperation and project development in this trade agreement. These
include intra-trade, industry, telecommunications and information, finance, banking and
privatization, rural development, science and technology, poverty alleviation and human
resources development, agriculture, energy, environment and health.
This paper investigates the intra-trade and welfare effects of the preferential trade agreement
among the D-8 countries by looking at the possibility of a full-fledge trade liberalization through
the expansion of the coverage of the preferential tariff reduction. This paper applies the
computable general equilibrium (CGE) modeling approach using the Global Trade Analysis
project (GTAP) model and the accompanying V7 database for a quantitative analysis of the
economic effects of a free trade arrangement between the contracting countries. A full-fledge
trade liberalization of tariff barriers is examined with special focus on Malaysia, Turkey and
Indonesia. An important aim of the paper is to appraise whether there will be significant gains in

3
intra-trade and welfare amongst the D-8 member countries when tariff barriers and enhancement
measures are being entirely dismantled.
State of Intra-trade within the D-8 Countries
Table 1 depicts the intra trade levels among the D-8 countries in comparison with other OIC
countries (ROIC) and the Rest-of-the-Wolrd (ROW) aggregate. It clearly indicates that intra
trade among D-8 countries has been dismally minute ranging mainly from 0-4 percent of their
respective total trade. However, trade with ROW is overwhelmingly high at about 90 percent on
average. Among the D-8 countries, Indonesia-Malaysia trade has been the top trading pair.
Malaysian trade with Indonesia accounts for 1.7 percent of total trade while Indonesian trade
with Malaysia is somewhat larger at 3.9 percent. Pakistan is the second biggest Malaysian trade
partner followed by Turkey. The second top trading pair within the D-8 grouping is between Iran
and Turkey. Iran’s trade with Turkey comprises 3.5 percent of her total trade. All other bilateral
trade between the D-8 countries has only been ‘microscopic’; mainly less than 1 percent of each
country’s total trade. Overall, intra-trade within the D-8 forms only 3.7 percent, relative to 6
percent with ROIC and 90 percent with the ROW (Table 2). As noted at the outset, it will be
interesting to examine whether removals of trade impediments particularly tariff barriers will
enhance intra-trade among D-8 countries substantially.
Table 1: Decomposition of Trade Among D-8, ROIC and ROW (percentage)
Partner Country
Total Malaysia Iran Turkey Indonesia Nigeria Pakistan Bangladesh Egypt ROIC ROW
Rep
orter
Co
un
try
Malaysia 0 0.25 0.36 1.69 0.06 0.47 0.26 0.24 3.07 93.59 100
Iran 0.45 0 3.47 0.37 0.04 0.7 0.27 0.04 7.48 87.17 100
Turkey 0.31 1.05 0 0.25 0.14 0.16 0.07 0.51 13.22 84.3 100
Indonesia 3.88 0.25 0.57 0 0.21 0.53 0.41 0.26 3.42 90.47 100
Nigeria 0.06 0.02 0.05 0.35 0 0.08 0.02 0.02 1.42 97.97 100
Pakistan 0.57 0.71 1.45 0.49 1.88 0 1.4 0.14 11.28 82.08 100
Bangladesh 0.23 0.41 0.72 0.21 0.04 0.47 0 0.13 2.57 95.24 100
Egypt 0.43 0.08 1.32 0.44 0.17 0.35 0.09 0 12.64 84.49 100
ROIC 0.47 1.44 1.89 0.63 0.1 1.15 0.18 0.32 7.37 86.44 100
ROW 1.04 0.33 0.89 0.73 0.2 0.2 0.11 0.21 3.77 92.52 100
Total 1.01 0.38 0.93 0.72 0.2 0.26 0.12 0.22 4.04 92.13 100
Source: GTAP V7 database

4
Table 2: Baseline Bilateral Export at World Prices
(in percent value)
D8 ROIC ROW Total
D8 3.7 6.0 90.2 100
ROIC 6.2 7.3 86.4 100
ROW 3.7 3.8 92.5 100
Total 3.8 4.0 92.1 100
Source: GTAP V7 database
Methodology
The GTAP Model
This study uses the GTAP model to appraise the economic-wide impacts of free trade among the
D-8 countries. The GTAP (The Global trade analysis Project) model, developed by the Center
for Global Trade Analysis, Purdue University is a multiregional, comparative statistic,
exogenous policy, applied general equilibrium (CGE) model based on neoclassical theories
(Walras law). The model to date has been the most widely used tool for the ex ante analysis of
economy-wide trade effects of multilateral or bilateral trade agreement. Bilateral trade is handled
via the Armington assumption, household’s preferences based on non-homothetic CDE
functional form. The model assumes constant return to scale production technology, competitive
markets and utility maximization behavior of consumers. The model is linearised and uses a
common global database. Dynamic effects and other technology variant for certain sectors were
not considered in the study. Therefore, the effects and potential gains from trade liberalization
espoused in this study are highly likely to be modest or underestimated. Details of the model can
be found in Hertel (1997).
The GTAP database
This study uses the latest available GTAP database (V7), which carries a snapshot of the 2004
world economy. The database has 113 regions (aggregate of 226 countries) and 57 sectors. The
database is formatted as an input-output structure within each country with bilateral trade values
expressed in USD million. Bilateral trade data extends down to the sector level which enables
the analyst to examine the effect of trade policy changes to the sector level. The sectoral
definitions in the database follow the Central Product Classification (CPC) for agricultural &
food processing and international Standard Industrial Classification (ISIC) for all others.

5
Sectoral and Regional Aggregation
In this study, the world economy was modeled to comprise the individual D-8 members, Rest of
OIC (ROIC), and Rest-of-the-World (ROW) aggregate while 8 major economic sectors were
considered. Table 3 shows the sectoral aggregations and Appendix 1 provides a description of
the products for each sectoral aggregate.
Table 3: Regional and Sectoral Aggregation
Regions
Code Sectors
1 Malaysia 1 RAWAG Primary agriculture
2 Indonesia 2 MINERAL Natural resources, extractive
and related industries
3 Turkey 3 FOOD Processed food
4 Iran 4 MANU Manufacturing products
5 Pakistan 5 VEGOIL Vegetable oil products
6 Egypt 6 F&FISH Forest and fisheries product
7 Nigeria 7 ANIMAL Animal product
8 Bangladesh 8 TEXT Textile and wearing apparel
9 ROIC (Rest of OIC) 9 SVCS Services
10 ROW (Rest of the World)
Source: Sectoral and regional aggregation by the authors
Baseline Bilateral Trade Relations
This section examines the baseline (pre free trade simulation) bilateral trade relations between D-
8 members with emphasis on intra D-8 trade particularly Malaysia, Turkey and Indonesia.
Exports
For Malaysia, total export to D-8 constitutes only 3.3 percent of total trade to the world (Table
4). Commodity-wise, only VEGOIL, TEXT and FOOD have made quite substantial inroads into
the D-8 markets at 15, 10, and 9 percent, respectively. All other exports to D-8 have been rather
minute (1-4 percent) of total trade for each commodity. Of total trade to D-8, the MANU sector
constitutes the largest share at 47 percent and followed by VEGO (25 percent) (Table 5).
Turkish export share to D-8 markets has been even lower at 2.5 percent. Relative to other
markets, none of its products made significant inroads into D-8 (Table 4). Table 5 indicates the
major commodities exported to D-8 are MANU (44 percent), SVCS (27 percent) and RAWAG
(10 percent).

6
Of the three countries, Indonesia’s export share to D-8 markets is largest at 6.1 percent. Sectoral-
wise, only three commodities - RAWAG (20 percent), VEGOIL (19 percent) and F&FISH (9
percent) have made significant presence in D-8 markets. The major commodities exported to D-8
are MANU (45 percent), TEXT (19 percent) and VEGOIL (16 percent).
Table 4: Decomposition of Exports by Partner Countries and Sector (percentage)
Total Export of Malaysia
Total Export of Turkey
Total Export of Indonesia
D-8 ROIC ROW Total
D-8 ROIC ROW Total
D-8 ROIC ROW Total
RawAg 0.043 0.044 0.913 1
0.031 0.064 0.905 1
0.203 0.030 0.767 1
Animal 0.026 0.055 0.919 1
0.007 0.137 0.856 1
0.008 0.059 0.933 1
F&Fish 0.013 0.005 0.982 1
0.005 0.035 0.960 1
0.086 0.009 0.905 1
Food 0.090 0.057 0.852 1
0.024 0.243 0.733 1
0.056 0.026 0.918 1
Text 0.102 0.033 0.865 1
0.014 0.074 0.912 1
0.070 0.050 0.879 1
Manu 0.025 0.025 0.950 1
0.031 0.204 0.765 1
0.063 0.034 0.903 1
Svcs 0.020 0.033 0.947 1
0.022 0.033 0.945 1
0.019 0.048 0.933 1
Mineral 0.041 0.000 0.958 1
0.039 0.138 0.823 1
0.017 0.001 0.982 1
Vegoil 0.150 0.161 0.689 1
0.027 0.360 0.613 1
0.179 0.106 0.715 1
Total 0.033 0.031 0.936 1
0.025 0.132 0.843 1
0.061 0.034 0.905 1
Source: GTAP database V 7
Table 5: Decomposition of Exports by Partner Countries and Sector (percentage)
Total Export of Malaysia
Total Export of Turkey
Total Export of Indonesia
D-8 ROIC ROW Total
D-8 ROIC ROW Total
D-8 ROIC ROW Total
RawAg 1.94 0.36 0.24 0.25
10.09 1.9 4.22 3.93
5.1 1.72 1.65 1.95
Animal 1.41 0.35 0.19 0.2
1.41 0.25 0.25 0.24
1.37 0.66 0.4 0.39
F&Fish 0.62 0.11 0.75 0.71
0.48 0.05 0.2 0.17
0.7 0.17 0.62 0.62
Food 3.18 2.93 1.44 1.58
3.8 6.62 3.13 3.6
3.25 2.82 3.74 3.69
Text 7.86 2.19 1.89 2.05
9.18 12.5 24.18 22.35
19.05 14.91 9.86 10.14
Manu 47.33 64.05 79.21 78.06
44.43 71.25 41.82 46.09
45.53 54.07 54.15 54.26
Svcs 10.2 7.81 7.46 7.38
27.28 5.63 25.1 22.4
6.44 9.33 6.87 6.66
Mineral 2.63 0.09 5.71 5.57
2.94 0.93 0.87 0.89
2.38 0.66 18.71 17.23
Vegoil 24.85 22.1 3.1 4.21
0.41 0.88 0.24 0.32
16.19 15.65 4.01 5.07
Total 100 100 100 100
100 100 100 100
100 100 100 100
Source: GTAP database V7

7
Imports
The decomposition of imports by partner countries and sectors are depicted in Table 6 and 7.
The D-8 has been Malaysia’s source of imports for 28 percent of RAWAG, 36 percent F&FISH,
18 percent MINERAL, 12 percent TEXT and 51 percent VEGOIL. Overall imports from D-8
represent 4.2 percent of Malaysia’s total imports (Table 6).
The D-8 has also been a substantial source of Turkish imports for the same commodities, i.e.,
TEXT (13 percent), MINERAL (15 percent) and VEGOIL (18 percent). Overall Turkish imports
from D-8 at 3.5 percent are lower than Malaysia.
For Indonesia, MINERAL and F&FISH have been quite substantially sourced from D-8 markets
at 11 and 15 percent, respectively. Of the three countries, Indonesia’s share of imports from D-8,
similar to exports, has been the highest at 4.6 percent.
Table 7 indicates Malaysia, Turkey and Indonesia’s imports from D-8 have been largely
composed of SVCS, MANU, TEXT, MINERALS and RAWAG.
Table 6: Decomposition of Import by Partner Country and Sector
Total Import of Malaysia Total Import of Turkey Total Import of Indonesia
D-8 ROIC ROW Total
D-8 ROIC ROW Total
D-8 ROIC ROW Total
RawAg 0.149 0.0058 0.8451 1
0.025 0.0965 0.8785 1
0.0306 0.0131 0.9564 1
Animal 0.0073 0.0144 0.9783 1
0.0189 0.0995 0.8817 1
0.0148 0.005 0.9802 1
F&Fish 0.3567 0.0044 0.6389 1
0.0098 0.0377 0.9525 1
0.1472 0.0164 0.8364 1
Food 0.0693 0.004 0.9268 1
0.0343 0.0514 0.9143 1
0.0914 0.0101 0.8986 1
Text 0.1156 0.0049 0.8794 1
0.1263 0.0437 0.83 1
0.0334 0.0033 0.9634 1
Manu 0.0297 0.0136 0.9566 1
0.012 0.0458 0.9421 1
0.0473 0.0129 0.9398 1
Svcs 0.026 0.0286 0.9453 1
0.0269 0.0382 0.9349 1
0.0225 0.0308 0.9466 1
Mineral 0.1784 0.4055 0.416 1
0.1552 0.5814 0.2633 1
0.1061 0.4699 0.424 1
Vegoil 0.514 0.0065 0.4796 1
0.1824 0.0411 0.7765 1
0.0452 0.0411 0.9137 1
Total 0.042 0.0226 0.9354 1
0.0347 0.0994 0.8659 1
0.0457 0.0417 0.9126 1 Source: GTAP database V 7

8
Table 7: Decomposition of Import by Partner Country and Sector (percentage)
Total Import of Malaysia
Total import of Turkey
Total import of Indonesia
D-8 ROIC ROW Total
D-8 ROIC ROW Total
D-8 ROIC ROW Total
RawAg 5.13 0.55 1.95 2.16
6.00 2.24 2.34 2.30
10.28 1.30 4.34 4.14
Animal 1.45 0.25 0.42 0.40
1.48 0.73 0.74 0.73
1.40 0.07 0.64 0.60
F&Fish 4.94 0.03 0.12 0.17
0.47 0.08 0.23 0.21
0.55 0.04 0.09 0.10
Food 6.75 0.48 2.72 2.74
3.14 0.62 1.27 1.20
3.55 0.75 3.05 3.10
Text 10.24 0.46 1.99 2.12
30.73 2.33 5.08 5.30
10.43 0.32 4.27 4.05
Manu 26.04 47.07 79.87 78.10
27.57 33.57 79.15 72.75
33.15 19.12 63.78 61.93
Svcs 34.29 14.57 11.64 11.52
11.95 2.76 7.74 7.17
28.45 14.64 20.53 19.80
Mineral 9.34 36.35 0.90 2.03
16.38 57.46 2.99 9.82
11.85 63.08 2.60 5.60
Vegoil 1.83 0.22 0.39 0.77
2.28 0.21 0.46 0.51
0.34 0.68 0.69 0.69
Total 100 100 100 100
100 100 100 100
100 100 100 100
Source: GTAP database V7
Decomposition of Import and Export Taxes/Subsidies
Tables 8 and 9 depict the baseline levels of trade policies among D-8, ROIC and ROW
economies. Table 8 shows import taxes instituted on FOOD especially to D-8 markets have been
the heaviest in each country. Malaysia levied the highest FOOD import levy (64 percent) relative
to Turkey and Indonesia. The RAWAG sector in Malaysia is the second most protected sector,
followed by TEXT. Turkey also protected highly its FOOD, RAWAG, VEGOIL and TEXT
sectors from D-8 and other countries. On the other hand, Indonesia’s import taxes against D-8
and other countries are far smaller relative to Malaysia and Turkey. For export subsidies,
generally they have been very low across countries and commodities (Table 9).
Table 8: Import Taxes
Import Taxes by Malaysia
Import Taxes by Turkey
Import Taxes by Indonesia
D-8 ROIC ROW Total
D-8 ROIC ROW Total
D-8 ROIC ROW Total
RawAg 18.56 10.69 12.65 41.90
25.05 10.60 12.45 48.10
2.96 2.00 1.67 6.63
Animal 0.62 0.36 0.62 1.60
1.00 2.01 13.31 16.32
0.90 1.22 2.45 4.57
F&Fish 1.69 1.11 1.00 3.80
2.93 14.69 1.31 18.93
1.77 2.86 2.11 6.74
Food 64.38 42.77 23.67 130.81
35.05 22.26 18.11 75.42
8.55 8.64 13.81 30.99
Text 8.01 15.35 14.87 38.22
6.35 3.62 2.65 12.62
5.68 8.33 8.10 22.11
Manu 2.15 8.78 4.99 15.92
3.20 1.33 1.23 5.76
1.76 2.06 4.30 8.11
Svcs 0.00 0.00 0.00 0.00
0.00 0.00 0.00 0.00
0.00 0.00 0.00 0.00
Mineral 0.91 2.22 0.68 3.82
0.02 0.28 0.06 0.36
0.13 0.02 0.46 0.61
Vegoil 0.26 0.14 0.92 1.31
9.53 15.66 14.85 40.04
0.73 0.00 0.40 1.13
Total 96.58 81.41 59.39 237.38
83.13 70.45 63.97 217.54
22.48 25.13 33.30 80.90
Source: GTAP database V7

9
Table 9: Export Subsidies
Export Subsidy by Malaysia
Export Subsidy by Turkey
Export Subsidy by Indonesia
D8 ROIC ROW Total
D8 ROIC ROW Total
D8 ROIC ROW Total
RawAg 0.00 0.00 0.00 0.00
0.00 0.00 0.00 0.00
0.00 0.00 0.00 0.00
Animal 0.00 0.00 0.00 0.00
0.00 0.00 0.00 0.00
0.00 0.00 0.00 0.00
F&Fish 0.00 0.00 0.00 0.00
0.00 0.00 0.00 0.00
0.00 0.00 0.00 0.00
Food 0.00 0.00 0.00 0.00
0.00 0.00 0.00 0.00
0.00 0.00 0.00 0.00
Text 0.00 0.00 -0.77 -0.77
0.02 0.13 -0.85 -0.69
-0.79 -0.74 -1.60 -3.12
Manu 0.00 0.00 0.00 0.00
-0.52 -1.37 -0.44 -2.33
-1.25 -1.22 -1.17 -3.64
Svcs 0.00 0.00 0.00 0.00
0.00 0.00 0.00 0.00
0.00 0.00 0.00 0.00
Mineral 1.26 -1.33 -0.45 -0.52
0.00 0.00 0.00 0.00
-0.61 -1.19 -0.58 -2.39
Vegoil 0.00 0.00 0.00 0.00
0.00 0.00 0.00 0.00
0.00 0.00 0.00 0.00
Total 1.26 -1.33 -1.21 -1.29
-0.49 -1.24 -1.29 -3.02
-2.65 -3.15 -3.35 -9.15
D-8 FTA Simulation Results
The simulation scenario examined in this paper is a complete liberalization of merchandise trade,
which is the removal of all bilateral trade policies (import tariff and export subsidies/taxes) on
goods trade among D-8 members from the 2004 base year, while all other trade distortion in
other countries remained unchanged. The results are presented and discussed in the following
sub-sections.
Impact on D-8 Intra-Trade
The most important examination in this study is whether complete removals of trade
impediments among D-8 members would enhance trade among them. Table 10 below shows the
expected share of trade across the three aggregated regions following the removals of such
impediments. To appreciate the magnitude of changes, the figures should well be contrasted to
that of the baseline levels as in Table 2. Intra-trade within the D-8 members is expected to
increase to 6.7 percent. This represents a substantial increase from the baseline level of 3.7
(Table 2). However, the share of total D-8 intra-trade to total global trade remains somewhat
unchanged.

10
Table 10: Free Trade Simulation of Bilateral
Export Share at World Prices (percentage)
D8 ROIC ROW Total
D8 6.69 5.84 87.46 100
ROIC 6.12 7.38 86.49 100
ROW 3.65 3.77 92.57 100
Total 3.91 4.04 92.05 100
Source: Simulation Results
Table 11 shows the change in export in terms of absolute values as compared to the baseline
levels. As shown, trade within the D-8 members following a free trade would increase by USD
14,708 million or 87 percent. Further, exports of D-8 to ROIC and ROW are expected to decline
by 2.1 percent, respectively. The results suggest that if increasing intra-trade is an important
objective of the D-8 preferential trade arrangement, then very likely it would succeed. However,
the quantum of D-8 intra-trade following the removals of trade impediments would still be small
relative to trade with other regions, particularly ROW due to the small baseline level.
Table 11: Impact on D-8 Intra-trade
Baseline Export Levels (mill USD)
Change in Exports Post
Simulation – Absolute
values (mill USD)
Regions D-8 ROIC ROW Total D-8 ROIC ROW
D-8 17014 27235 407499 451748 14708 -553 -8675
Source: Simulation Results
Effect on Real GDP and Output
As shown in Table 12, the effects of removals of trade enhancement and protectionist policies
among D-8 countries on real GDP are highly insignificant due to the very small trade base
between the D-8 nations. Malaysian GDP is expected to gain most (albeit very slightly - only a
0.56 percent change), followed by Pakistan and Indonesia. Bangladesh, Nigeria, Iran and Egypt
may however, see a small decline in real GDP, while the GDP of Turkey, ROIC and ROW
would remain unchanged.

11
For the different commodity sectors in the economy, the output of TEXT followed by VEGOIL
especially in Malaysia and Indonesia are poised to increase markedly. However, VEGOIL in
other D-8 regions especially Nigeria, Pakistan and Bangladesh would experience the largest
output fall relative to other countries.
Animal products in most regions are projected to decline, resulting in gains to both Malaysian
and Nigerian ANIMAL (animal production) sector. The expected decline in Malaysia’s RAWAG
is about 5 percent, which is quite substantial in relation to other countries. Forest and fisheries
products (F&FISH) across most of the D-8 countries would decline, generating some small
benefits to Egypt and ROW.
While Malaysia and Indonesia would experience, respectively, 8 and 2 percent increase in
processed food products (FOOD), other D-8 members would only experience marginal changes.
The effect of D-8 FTA on mineral products (MINERAL) also seems to be very small and only
Bangladesh is expected to experience a decline of some 2 percent decrease.
Table 12: Changes on Real GDP and Impact on Output by Sector (Percent Change)
Malaysia Iran Turkey Indonesia Nigeria Pakistan Bangladesh Egypt ROIC ROW
Real GDP 0.56 -0.14 +0 0.03 -0.15 0.14 -0.18 -0.02 0 0
RawAg -4.96 0.66 1.9 0.22 -0.47 -0.43 -0.17 0.05 -0.04 -0.08
Animal 8.1 -0.28 -0.41 -0.29 0.83 -0.24 -0.38 -0.06 -0.01 0
F&Fish -0.41 -0.08 -0.12 -0.02 -1.13 -0.82 -0.16 0.06 0 0.01
Food 7.61 -0.59 -0.32 2.22 0.51 0.14 -0.26 0.74 -0.04 -0.04
Text 19.78 -2.39 -1.18 3.19 -34.37 4.2 3.57 -0.72 -0.41 -0.1
Manu -1.37 0.42 -0.01 -0.77 0.48 -0.79 -1.81 0.24 -0.02 0.02
Svcs -0.1 -0.04 -0.12 -0.01 0.39 -0.14 -0.14 -0.03 0 0
Mineral -0.67 -0.01 -0.62 -0.72 0.15 0.09 -2.29 0.01 0.03 0.01
Vegoil 15.34 -4 -1.28 1.27 -39.61 -32.32 -21.87 -3.88 -0.92 -0.26
Source: Simulation Results
Effects on Trade Balance
Overall, the trade balance for the entire D-8 moves in a negative direction, in complete contrast
to that of ROIC and ROW (Table 13). In Malaysia, VEGOIL, TEXT and RAWAG are not
capable of covering the negative trade balance from MANU and SCVS sector. For Turkey,
RAWAG is the only sector that yields positive trade balance changes. Indonesia will also
experience a negative change in trade balance but at a lower magnitude relative to Malaysia and
Turkey due to her more resilient MANU sector. Appendix 2 provides the details of percentage
changes estimates in Malaysian exports and imports by her partners and sectors.

12
Table 13: Changes in Trade Balance by Sector (Million USD)
Malaysia Iran Turkey Indonesia Nigeria Pakistan Bangladesh Egypt ROIC ROW
RawAg 188.73 103.46 680.18 -201.34 21.01 -53.67 12.13 -11.42 -6.78 -684.01
Animal 69.02 5.13 -42.68 -45.14 0.23 -5.91 0.02 -3.2 8.34 10.39
F&Fish -20.85 0.13 -5.71 -12.14 1.03 -7.97 11.94 -0.13 2.03 32.64
Food 171.65 -99.05 -92.63 721 -4.49 87.21 -8.05 74.03 -15.79 -895.38
Text 491.69 -237.86 -160.73 437.55 -330.81 732.99 170.12 -82.32 -111.29 -1022.98
Manu -1629.1 24.38 -195.83 -586.79 -179.24 -318.77 -193.93 32.01 -3.66 2814.1
Svcs -414.02 12.37 -598.52 -459.67 94.08 -312.3 -2.9 -31.75 205.37 1959.36
Mineral 18.17 -68.52 -26.08 -75.4 37.39 42.18 -34.39 -14.47 90.18 -59.9
Vegoil 972.01 7.84 -31.41 148.69 -21.99 -633.68 -99.82 -7.88 -57.49 -383.74
Total -110.51 -253.07 -473.41 -61.59 -380.84 -468.16 -145.51 -45.08 111.42 1811.98
Source: Simulation results
Impacts on Welfare
The effect of a change in trade policies on the welfare of a region depends on the impacts of
changes in world prices on the welfare of the trading country and the efficiency gains associated
with output changes. The welfare measure in the analysis employs the equivalent variation (EV)
criterion, a measure of absolute welfare gains for each regional household, expressed in millions
of USD. The EV can be interpreted as the change in regional household income at constant
prices that is equivalent to the proposed changes. Because the EV uses initial period prices as its
base, welfare results from any given simulation can be compared directly.
Changes in welfare as a result of trade liberalization could be due to changes in terms of trade,
better use of resources (allocative efficiency) and others, i.e. less costly imports and scale effects.
Results in Table 10 suggest that improvement in effectiveness of use of resources, followed by
increases in terms of trade contribute to the increase in Malaysian societal welfare that includes
poverty alleviation. Aggregate effects of other factors seem to have a small negative effect on
social welfare.
The increase in Malaysian GDP results in the decline of dead welfare loss and this implies that
Malaysian aggregate supply before trade liberalization has been inefficient.
Iran and Bangladesh are expected to be worse off among D-8 nations following the D-8 trade
liberalization. Turkey gains from freer trade due to increases in terms of trade while resources
efficiency seems unchanged. Pakistan and Indonesian welfare is expected to improve. The
reduction in Nigerian GDP is manifested by the decline in the efficiency of resource use as well
as terms of trade, while less costly imports of Nigeria from other D-8 members and
improvements in economic of scale are translated into a net gain in Nigerian welfare. The

13
increase in Egypt’s social dead loss weight is due to the reduction in GDP brought by the decline
in resource allocation process and economics of scale.
The wide range of effects from the D-8 freer trade suggests that not every country will benefit
from trade liberalization. As is obvious from Table 14, Iran, Bangladesh and Egypt may
experience a reduction in welfare while other D-8 nations (Malaysia, Turkey, Indonesia, Nigeria
and Pakistan) will gain.
Table 14: Impact on Regional Welfare (EV, Million USD)
Decomposition of Welfare Change
Total
Allocative
Efficiency
Terms of
trade Other
Malaysia
647.3687 413.4625 -91.691
969.1402
Iran
-215.345 -14.417 9.6223
-220.14
Turkey
0.3661 596.2694 95.0018
691.6373
Indonesia
70.5443 597.7478 -85.6323
582.6599
Nigeria
-104.108 -23.695 239.1854
111.3824
Pakistan
129.2085 154.3294 71.4629
355.0009
Bangladesh
-97.9 -88.5247 -7.0515
-193.476
Egypt
-13.5048 8.3821 -0.2328
-5.3555
ROIC
-42.571 -162.538 9.6924
-195.417
ROW
-213.889 -1476.36 -237.036
-1927.28
Source: Simulation results
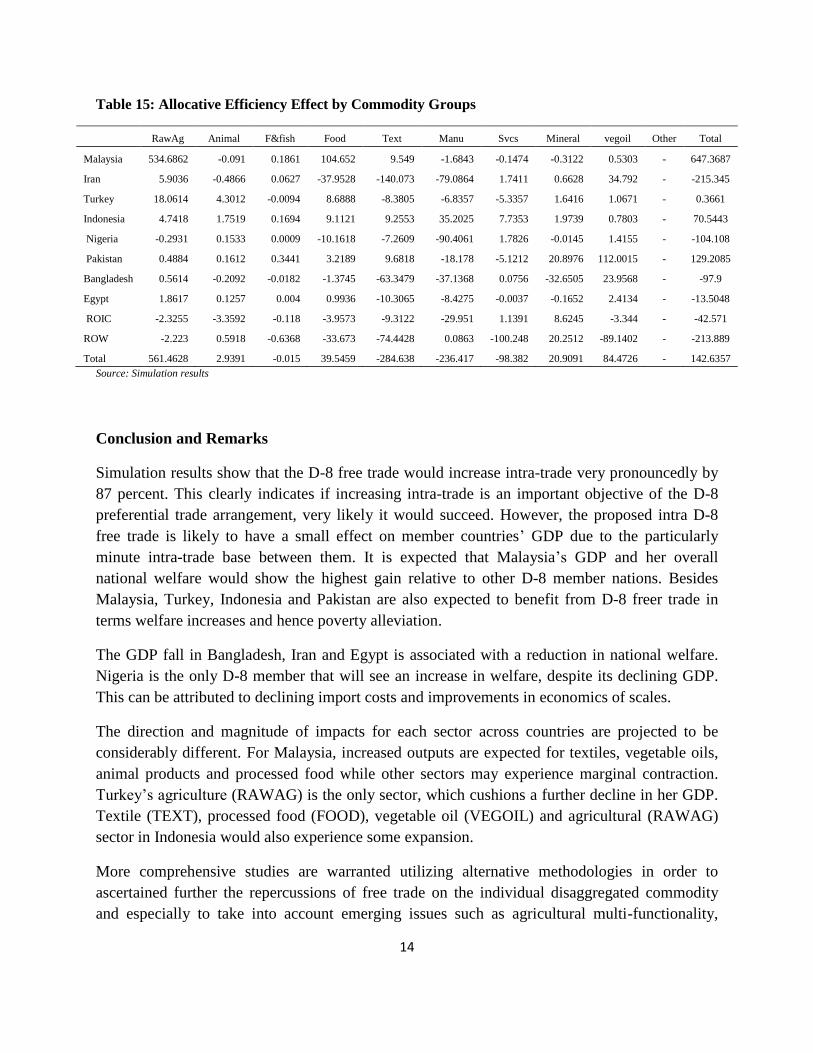
Table 15 illustrates the allocative efficiency effects by sectors. Especially it shows the RAWAG
followed by FOOD have contributed most to allocative efficiency in Malaysia. For other D-8
nations, changes in allocation of resource do not seem to affect welfare significantly (except for
Pakistan’s vegetable oil sector).
14
Table 15: Allocative Efficiency Effect by Commodity Groups
RawAg Animal F&fish Food Text Manu Svcs Mineral vegoil Other Total
Malaysia 534.6862 -0.091 0.1861 104.652 9.549 -1.6843 -0.1474 -0.3122 0.5303 - 647.3687
Iran 5.9036 -0.4866 0.0627 -37.9528 -140.073 -79.0864 1.7411 0.6628 34.792 - -215.345
Turkey 18.0614 4.3012 -0.0094 8.6888 -8.3805 -6.8357 -5.3357 1.6416 1.0671 - 0.3661
Indonesia 4.7418 1.7519 0.1694 9.1121 9.2553 35.2025 7.7353 1.9739 0.7803 - 70.5443
Nigeria -0.2931 0.1533 0.0009 -10.1618 -7.2609 -90.4061 1.7826 -0.0145 1.4155 - -104.108
Pakistan 0.4884 0.1612 0.3441 3.2189 9.6818 -18.178 -5.1212 20.8976 112.0015 - 129.2085
Bangladesh 0.5614 -0.2092 -0.0182 -1.3745 -63.3479 -37.1368 0.0756 -32.6505 23.9568 - -97.9
Egypt 1.8617 0.1257 0.004 0.9936 -10.3065 -8.4275 -0.0037 -0.1652 2.4134 - -13.5048
ROIC -2.3255 -3.3592 -0.118 -3.9573 -9.3122 -29.951 1.1391 8.6245 -3.344 - -42.571
ROW -2.223 0.5918 -0.6368 -33.673 -74.4428 0.0863 -100.248 20.2512 -89.1402 - -213.889
Total 561.4628 2.9391 -0.015 39.5459 -284.638 -236.417 -98.382 20.9091 84.4726 - 142.6357
Source: Simulation results
Conclusion and Remarks
Simulation results show that the D-8 free trade would increase intra-trade very pronouncedly by
87 percent. This clearly indicates if increasing intra-trade is an important objective of the D-8
preferential trade arrangement, very likely it would succeed. However, the proposed intra D-8
free trade is likely to have a small effect on member countries’ GDP due to the particularly
minute intra-trade base between them. It is expected that Malaysia’s GDP and her overall
national welfare would show the highest gain relative to other D-8 member nations. Besides
Malaysia, Turkey, Indonesia and Pakistan are also expected to benefit from D-8 freer trade in
terms welfare increases and hence poverty alleviation.
The GDP fall in Bangladesh, Iran and Egypt is associated with a reduction in national welfare.
Nigeria is the only D-8 member that will see an increase in welfare, despite its declining GDP.
This can be attributed to declining import costs and improvements in economics of scales.
The direction and magnitude of impacts for each sector across countries are projected to be
considerably different. For Malaysia, increased outputs are expected for textiles, vegetable oils,
animal products and processed food while other sectors may experience marginal contraction.
Turkey’s agriculture (RAWAG) is the only sector, which cushions a further decline in her GDP.
Textile (TEXT), processed food (FOOD), vegetable oil (VEGOIL) and agricultural (RAWAG)
sector in Indonesia would also experience some expansion.
More comprehensive studies are warranted utilizing alternative methodologies in order to
ascertained further the repercussions of free trade on the individual disaggregated commodity
and especially to take into account emerging issues such as agricultural multi-functionality,

15
trade-environment effects and the so-called ‘development box’ which has taken the limelight in
recent trade negotiations.
References
Badri, N. G. and Terrie L. W. (2008), The GTAP 7 Data Base: Global Trade, Assistance and Production, Center for
Global Trade Analysis, Purdue University
Brockmeier, M. (1996),‘‘A Graphical Exposition of GTAP Model”, GTAP Technical Paper, Centre for Global
Trade Analysis, Purdue University, West Laffayette, IN.
Dimaranan, B.V. and Mc Dougall,.R.2006,eds. ‘‘Global Trade, Assistance and Production: The GTAP Data Base’’.
Center for Global Trade Analysis, Purdue University, USA: Indonesia
Hertel, T.W. (1997), Global Trade Analysis: Modeling and Applications, Cambridge University Press
Jamal Othman, Y. Jafari” (2009), ‘‘Does ASEAN Trade Liberalization Benefit Malaysia”, paper presented at the
National University of Malaysia 2009 Annual Economic Conference.
Itakura, K. and Hertel, T.2001. ‘‘A Note on Changes since GTAP Book Model (Version 2,2a/GTAP94)’’. Center
For Global Trade Analysis, Purdue University, USA
M.Siriwardana Jinmei Yang, (2007), ‘‘GTAP Model Analysis of the Effects of an Australia-China FTA: Sectoral
Aspect’’, CCAS Working Paper No. 7, May 2007.
Soo yuen Chong and Jung Hur, ‘‘Overlapping Free trade Agreements of Singapore-USA-Japan: A Computational
Analysis’’, SCAPE Working paper Series, No.2007/11.
Appendix 1: Sectoral Aggregation and Codes
Sector Code Coverage of Commodities
Agriculture RawAg paddy rice, wheat, cereal grains not elsewhere
classified(nec), vegetables, fruit, nuts, oil seeds, sugar
cane, sugar beet, plant-based fibers crops nec, sugar,
processed rice
Animal
Products
Animal cattle, sheep, goats, horses, animal products nec , raw
milk, wool, silk-worm cocoons, meat: cattle, sheep,
goats, horse, meat products nec
Vegetable oil Vegoil vegetable oils and fats
Forestry And
Fishing
F&Fish forestry, fishing

16
Mineral Mineral coal, oil, gas, minerals nec
Processed
Food
Food dairy products, processed rice, sugar, beverages and
tobacco products, food products nec
Textiles TEXT textiles, wearing apparel
Manufactures Manu leather products, wood products, paper products,
publishing, petroleum, coal products, chemical,
rubber, plastic prods, mineral products nec , ferrous
metals, metals nec , metal products, motor vehicles and
parts, transport equipment, electronic equipment,
machinery and equipment nec, manufacturing nec.
Services SVCS electricity, gas manufacture, distribution, water, trade,
transport nec, construction, sea transport, air transport,
communication, financial services nec,, insurance,
business services nec, recreation and other services,
pub admin /defence/health/education, dwellings
Source: Adapted from GTAP7 Database
Appendix 2:
Table A2.1 Decomposition of Bilateral Export Changes by Malaysia and by Sector (percentage
change)
Malaysia Iran Turkey Indonesia Nigeria Pakistan Bangladesh Egypt ROIC ROW
RawAg
-36.32 923 221.02 50.24 1219.31 131.12 325.73 173.37 31.16 27.24
Anima
17.78 21.38 26.64 32.89 19.67 151.25 209.87 23.01 20.88 20.28
F&Fish
-0.59 141.62 -1.13 5.78 -8.17 17.2 -3.06 0.09 -2.25 -2.13
Food
-16.7 151.99 140.32 61.03 1028.35 154.38 133.77 343.39 14.63 14.84
Text
7.74 133.79 73.19 34.54 102.18 411.5 366.02 176.48 9.1 9.32
Manu
-3.25 95.34 21.71 10.37 313.86 163.6 181.31 89.01 -2.74 -2.8
Svcs
-1.07 -3.01 -0.8 -0.84 -3.63 0.38 -2.78 -2.57 -2.79 -2.72
Mineral
-2.35 328.08 -10.29 -12.58 228.03 108.91 211.31 -13.55 0.55 0.58
Vegoil
11.95 272.83 70.92 7.93 419.04 122.11 70.87 55.44 -0.54 -0.82
Source: Simulation results
Table A2.2. Decomposition of Bilateral Import Changes by Malaysia and by Sector (Percentage
change)

17
Malaysia Iran Turkey Indonesia Nigeria Pakistan Bangladesh Egypt ROIC ROW
RawAg
-36.32 -49.45 8436.38 -25.85 -52.04 103.78 -48.81 -40.47 -52.93 -52.95
Animal
17.78 30.43 -12.45 -6.7 -0.76 -8.78 2.37 5.14 -3.39 -3.56
F&Fish
-0.59 2.79 -1.15 0.11 6.17 11.68 44.05 1.09 2.27 2.07
Food
-16.7 66.01 -13.15 625.93 -26.11 -29.27 66.12 254.46 -28.49 -28.55
Text
7.74 161.19 200.85 37 162.02 235.73 366.79 278.16 -1.87 -1.95
Manu
-3.25 92.98 89 15.44 255.53 64.75 101.26 31.31 -0.13 -0.27
Svcs
-1.07 1.88 -1.91 -2.36 3.6 -4.35 1.17 1.3 1.82 1.67
Mineral
-2.35 16.27 0.93 7.22 -3.56 4740.97 36.69 -1.39 -2.89 -2.92
Vegoil
11.95 62.71 15.22 7.01 26.54 18.27 39.28 12.4 14.07 13.97
Source: Simulation results