Embed Size (px)
Citation preview
1
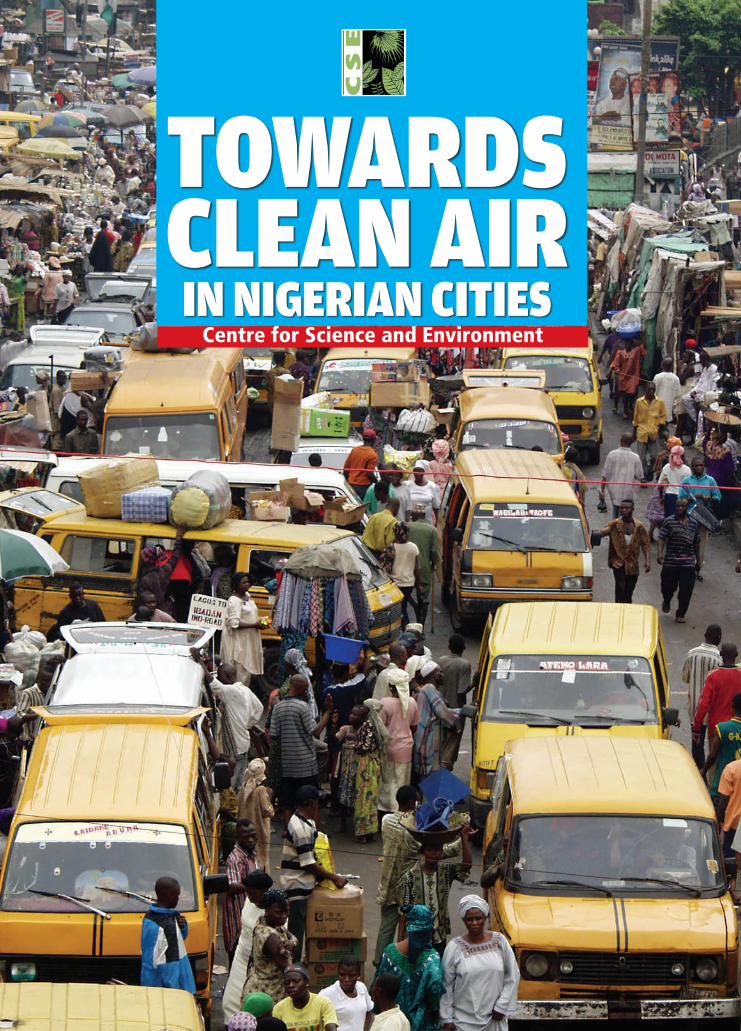
TOWARDS CLEAN AIR IN NIGERIAN CITIES
Centre for Science and Environment
2
Authors: Anumita Roychowdhury Usman Nasim Priyanka Chandola
Editor: Archana Shankar
Cover design: Ajit Bajaj
Layout: Kirpal Singh
Production: Rakesh Shrivastava and Gundhar Das
We are grateful to the Federal Ministry of Environment of the Federal Republic of Nigeria for giving the opportunity to collaborate as knowledge partner to develop the guidance framework for urban air quality management in Nigeria.
We are grateful to the Swedish International Development Agency (SIDA) for Institutional support.
© 2016 Centre for Science and Environment
Material from this publication can be used, but with acknowledgement.
Published byCentre for Science and Environment41, Tughlakabad Institutional Area, New Delhi 110 062
Phones: 91-11-40616000
Fax: 91-11-29955879
E-mail: [email protected]
Website: www.cseindia.org
Printed at Multi Colour Services, New Delhi
3
Contents
Urban Air quality management in Nigeria: Agenda for action 5
Urban air quality in Nigeria 5
State of air quality monitoring 9
Ambient air quality standards and compliance strategy 11
Public heath challenge 11
Where is pollution coming from? 13
First-generation pollution control action in Nigeria 13
Special challenge of vehicular pollution 15
Need clean fuels and vehicles 16
Leapfrog with alternative fuels 18
Unique challenge of old second-hand vehicles (Tokunbo) 19
Planning for sustainable mobility and clean air 24
Road safety and clean air 26
Intermediate and informal public transport system 28
Formal public transport system 29
Lagos Bus Rapid Transit 31
Urban design for walking and cycling 35
Current status of vehicle inspection in Nigeria 37
Vehicle taxation 38
Car restraint measures: Parking as a TDM measure 38
Open burning of waste 41
Pollution from construction and demolition waste 42
Emissions from generator sets for captive power generation 43
Power generation in Nigeria 44
References 46
4
Abbreviations
AUMTCO Abuja Urban Mass Transport Company
BAU Business As Usual
BRT Bus Rapid Transit
CKD Completely Knocked Down
EIA Environment Impact Assessment
FEPA Federal Environment Protection Agency
FME Federal Ministry of Environment
FRSC Federal Road Safety Corps
FUMTA Federal Urban Mass Transit Agency
GBD Global Burden of Disease
GDP Gross Domestic Product
ITC International Trade Centre
LAMATA Lagos Metropolitan Area Transport Authority
LUTP Lagos Urban Transport Project
NADDC National Automotive Design and Development Council
NESI Nigerian Electricity Supply Industry
NESREA National Environment Standards and Regulation Enforcement Agency
NCC Nigerian Customs Service
NGC Nigerian Gas Company
NIPCO Nigerian Independent Petroleum Company
NNPC Nigeria National Petroleum Conservation
NUTCO Nationwide Unity Transport Company
NVECP National Vehicular Emission Control Programme
PPP Public Private Partnership
UNEP United Nations Environment Programme
USEPA United States Environment Protection Agency
WHO World Health Organisation
5
URBAN AIR QUALITY MANAGEMENT IN NIGERIA: AGENDA FOR ACTION
This is a rapid review of the current concerns around urban air pollution and public health challenges in Nigerian cities. It aims to identify the key policy gaps that need to be addressed while framing the policy guidance on national urban air quality management in Nigeria. It is based on a systematic review of available evidences, current status of action and emerging global good practices. As cities in Nigeria take steps towards cleaning up their air, priority measures for pollution assessment and source-wise pollution-reduction plan become necessary.
This review is part of the collaborative initiative of the Federal Ministry of Environment, Nigeria, and the Centre for Science and Environment that has helped to create a multi-stakeholder platform for cross-learning and engagement to inform framing of an integrated air-quality management framework for Nigeria.
This initiative makes explicit recognition of the following principles for the preparation of the guidance framework: • Reducing integrated exposure to toxic air pollution from all sources to
protect public health;• Addressing the unique health-risk transition of developing country regions
where rapidly growing and aging populations are bringing more children, elderly and ailing to polluted urban environments. This is enhancing the health burden significantly;
• Adopting the principle of co-benefits to design air-pollution control action for diverse benefits of public health, climate mitigation and energy security;
• Air-quality action needs to address the principles of equity, affordability, inventiveness, compliance and transparency;
• A leapfrog approach in the early stages of growth is needed to move to cleaner benchmarks for air quality, best available technologies and fuels and demand management measures to control pollution;
• Integrating local air-quality control with regional air quality planning to reduce the effect of pollution movement;
• Adopting a legal framework for enforcement and compliance that will enable time-bound implementation of action plan for each pollution source to meet the clean-air target with strong compliance strategies;
• Capacity and skill building and data protocol for robust air-quality management, governance and implementation;
• Building public awareness regarding the health risk from air pollution and building support strategies needed to control air pollution.
Urban air quality in Nigeria
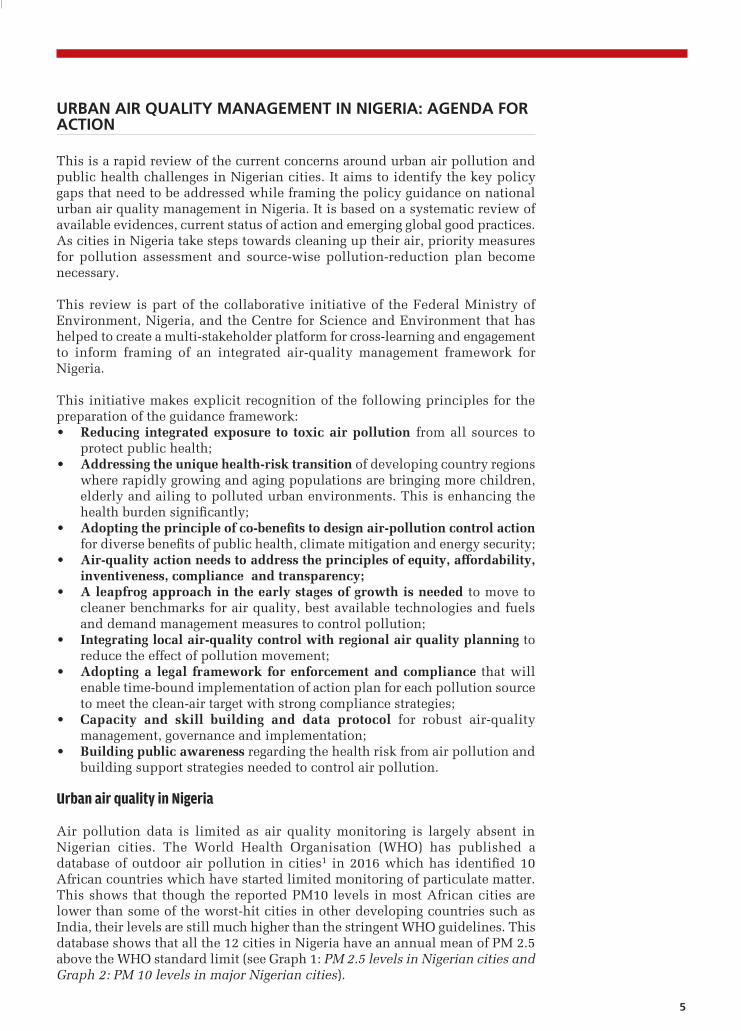
Air pollution data is limited as air quality monitoring is largely absent in Nigerian cities. The World Health Organisation (WHO) has published a database of outdoor air pollution in cities1 in 2016 which has identified 10 African countries which have started limited monitoring of particulate matter. This shows that though the reported PM10 levels in most African cities are lower than some of the worst-hit cities in other developing countries such as India, their levels are still much higher than the stringent WHO guidelines. This database shows that all the 12 cities in Nigeria have an annual mean of PM 2.5 above the WHO standard limit (see Graph 1: PM 2.5 levels in Nigerian cities and Graph 2: PM 10 levels in major Nigerian cities).
6
TOWARDS CLEAN AIR IN NIGERIAN CITIES
6
Graph 1: PM 2.5 levels in 12 Nigerian cities
Source: 2016, WHO Global Urban Ambient Air Pollution Database, http://www.who.int/phe/health_topics/outdoorair/
databases/cities/en/
Graph 2: PM 10 levels in major Nigerian cities
Source: 2015, Federal Ministry of Environment, Nigeria
According to the WHO database,2 all the 12 cities in Nigeria have PM 2.5 levels that are above the standard. Kaduna city with 90 microgramme per cubic metre is among the higher ones. Also, for PM 10, all cities have crossed the permissible standard. Onitsha, Kaduna and Aba have PM 2.5 values that are 15 to 30 times higher than the standard.
Moreover, the Little Green Data Book 2016 of the World Bank shows that 100 per cent of the Nigerian population is now exposed to PM 2.5 levels that exceed WHO guidelines.
Particulate pollution is a matter of concern in Nigerian cities. The earliest smog episode in Lagos was reported way back in October 2006 when people around Lagos woke up to a hazy atmosphere that was very unusual. The situation was so strange that some schools around Maryland, Ojota, Anthony and Ikeja had to shut down and children were sent back home. The period of smog lasted for over six hours.3
Studies have been carried out to project increase in pollution with economic growth in Nigeria. The representation of concentration-pathways scenarios projects growth in emission of NOx and ozone with growth.4 A considerable part of NOx comes from the open fires. This with severely restricted ventilation leads to poor ozone levels in central Nigeria.5
0
10
20
30
40
50
60
70
80
90
100
Onitsha Kaduna Aba Umuahia Owerri Nsukka Enugu Ile-Ife Abakaliki Afikpo Nnewi Orlu
PM 2
.5 m
icro
gra
mm
e/cu
bic
met
re Annual PM 2.5 (mircogramme/cubic metre)
WHO Standard for annual mean-PM 2.5 (mircogramme/cubic metre)
Kan
o
140
120
100
80
60
40
20
0
WHO standard
Soko
to
Mai
dugu
ri
Bauc
hi
Kad
una
Jos
Min
na
Yola
Ilori
n
Abu
ja
Loko
ja
Beni
n Ci
ty
Enug
u
Ibad
an
War
ri
Lago
s
7
TOWARDS CLEAN AIR IN NIGERIAN CITIES
The experience in developing countries shows that air pollution grows at an alarming speed and therefore needs stringent and preventive action at the early stages.
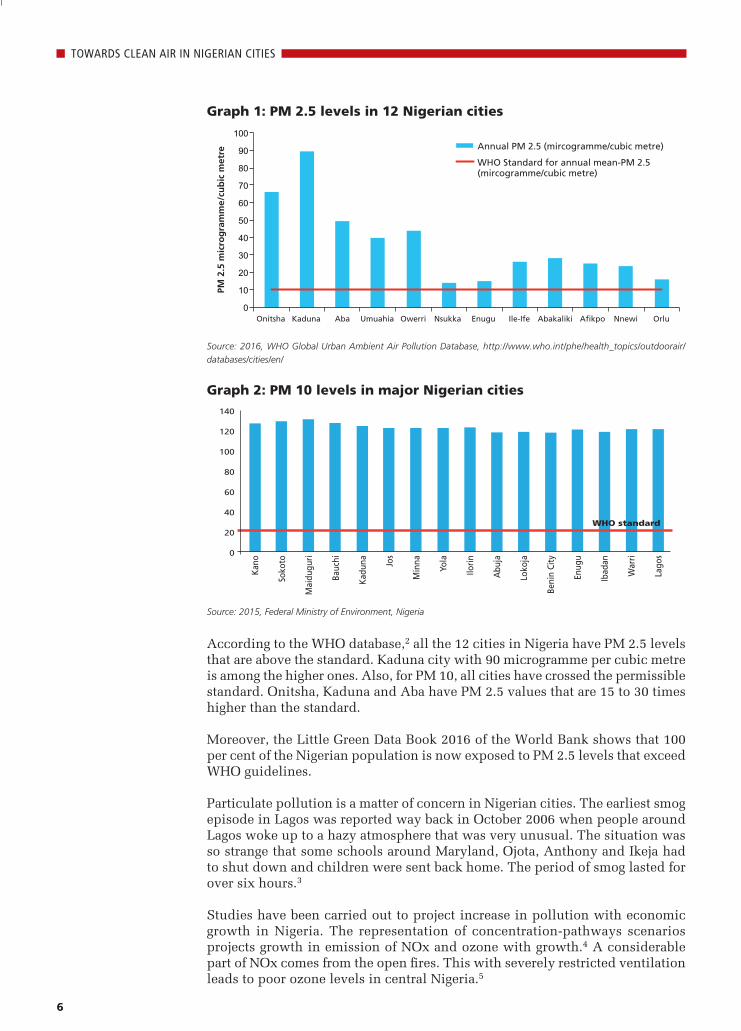
Seasonal variation: Nigerian cities have made special efforts to generate data on carbon monoxide (CO) levels along with PM 10 through special studies. This is important as this region is largely dominated by very old petrol cars that cause high CO levels. The CO levels are high in traffic areas. But PM 10 levels are much higher across all locations. High PM 10 levels have also brought out seasonal variations in pollution. Monitoring during summer and winter months in Abuja demonstrates this. Summer shows high particulate matter and also carbon monoxide. During winter, the concentration of carbon monoxide is very high. Overall the levels of gaseous pollution—carbon monoxide, sulphur dioxide and nitrogen oxides—are relatively high in winter when calm and cool weather conditions prevail (see Graph 3: Trend in carbon monoxide levels in summer and winter).
Graph 3: Trend in carbon monoxide and PM 10 levels in summer and winter
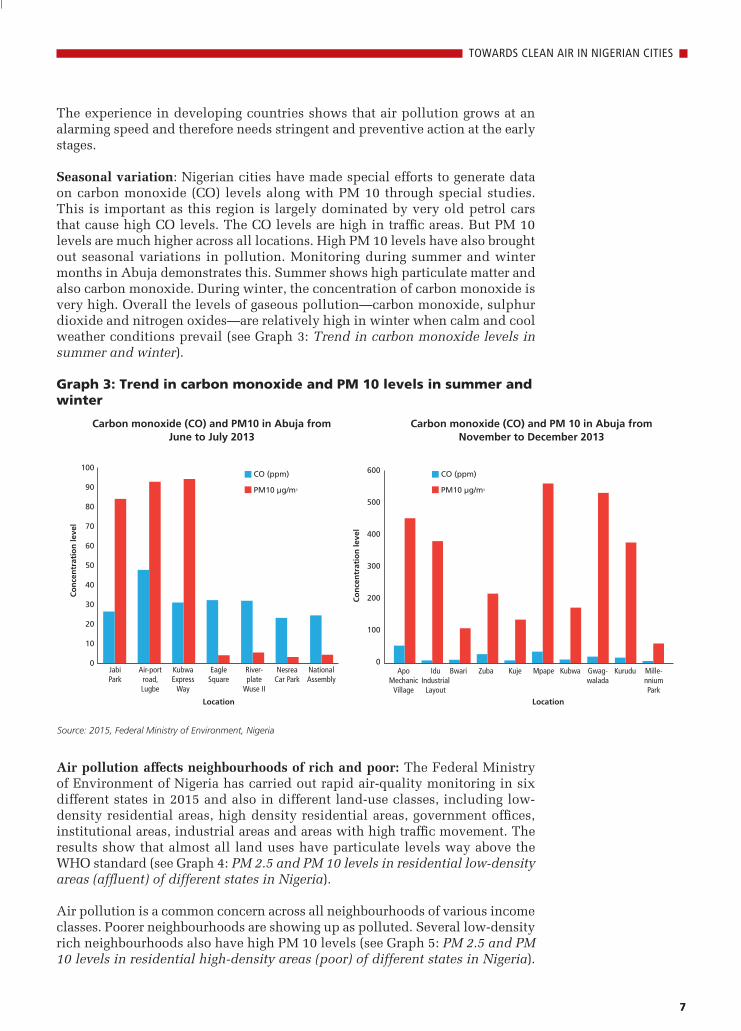
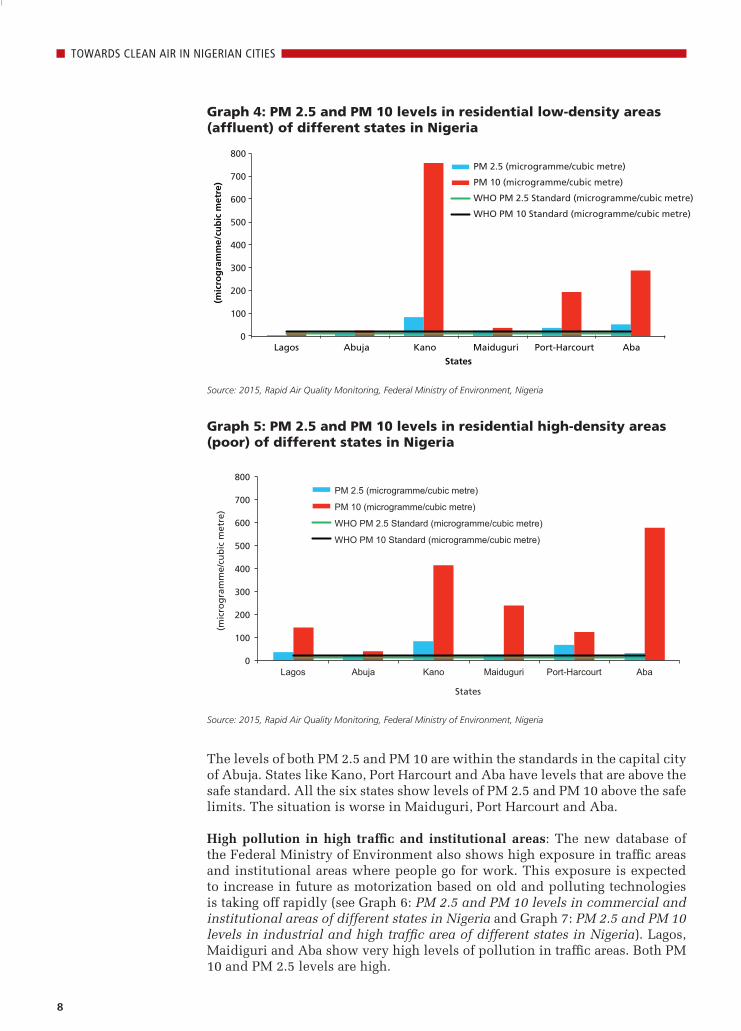
Air pollution affects neighbourhoods of rich and poor: The Federal Ministry of Environment of Nigeria has carried out rapid air-quality monitoring in six different states in 2015 and also in different land-use classes, including low-density residential areas, high density residential areas, government offices, institutional areas, industrial areas and areas with high traffic movement. The results show that almost all land uses have particulate levels way above the WHO standard (see Graph 4: PM 2.5 and PM 10 levels in residential low-density areas (affluent) of different states in Nigeria).
Air pollution is a common concern across all neighbourhoods of various income classes. Poorer neighbourhoods are showing up as polluted. Several low-density rich neighbourhoods also have high PM 10 levels (see Graph 5: PM 2.5 and PM 10 levels in residential high-density areas (poor) of different states in Nigeria).
7
Co
nce
ntr
atio
n le
vel
Co
nce
ntr
atio
n le
vel
600
500
400
300
200
100
0Apo
Mechanic Village
Idu Industrial
Layout
Bwari
LocationLocation
Zuba Kuje Mpape Kubwa Gwag-walada
Kurudu Mille-nnium Park
Jabi Park
100
90
80
70
60
50
40
30
20
10
0Air-port
road, Lugbe
KubwaExpress
Way
Eagle Square
River-plate
Wuse II
Nesrea Car Park
National Assembly
CO (ppm)
PM10 µg/m3
CO (ppm)
PM10 µg/m3
Carbon monoxide (CO) and PM10 in Abuja from June to July 2013
Carbon monoxide (CO) and PM 10 in Abuja from November to December 2013
Source: 2015, Federal Ministry of Environment, Nigeria
8
TOWARDS CLEAN AIR IN NIGERIAN CITIES
The levels of both PM 2.5 and PM 10 are within the standards in the capital city of Abuja. States like Kano, Port Harcourt and Aba have levels that are above the safe standard. All the six states show levels of PM 2.5 and PM 10 above the safe limits. The situation is worse in Maiduguri, Port Harcourt and Aba.
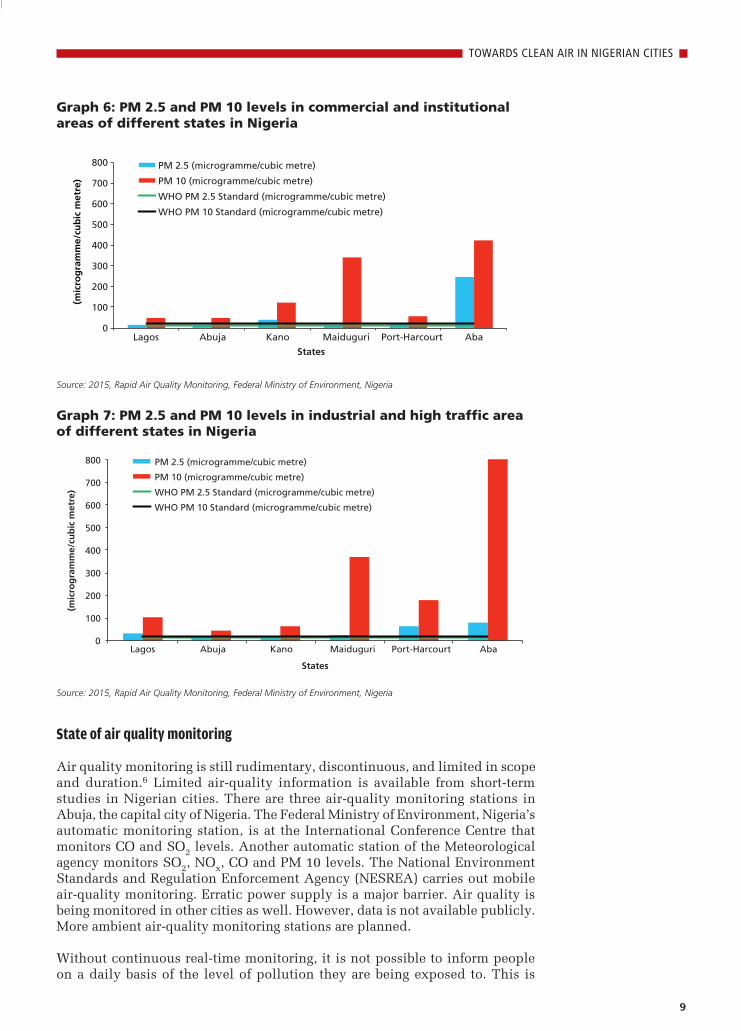
High pollution in high traffic and institutional areas: The new database of the Federal Ministry of Environment also shows high exposure in traffic areas and institutional areas where people go for work. This exposure is expected to increase in future as motorization based on old and polluting technologies is taking off rapidly (see Graph 6: PM 2.5 and PM 10 levels in commercial and institutional areas of different states in Nigeria and Graph 7: PM 2.5 and PM 10 levels in industrial and high traffic area of different states in Nigeria). Lagos, Maidiguri and Aba show very high levels of pollution in traffic areas. Both PM 10 and PM 2.5 levels are high.
Graph 4: PM 2.5 and PM 10 levels in residential low-density areas (affluent) of different states in Nigeria
Source: 2015, Rapid Air Quality Monitoring, Federal Ministry of Environment, Nigeria
0
100
200
300
400
500
600
700
800
Lagos Abuja Kano Maiduguri Port-Harcourt Aba
(mic
rog
ram
me/
cub
ic m
etre
)
States
PM 2.5 (microgramme/cubic metre)
PM 10 (microgramme/cubic metre)
WHO PM 2.5 Standard (microgramme/cubic metre)
WHO PM 10 Standard (microgramme/cubic metre)
0
100
200
300
400
500
600
700
800
Lagos Abuja Kano Maiduguri Port-Harcourt Aba
(mic
rog
ram
me/
cub
ic m
etre
)
States
PM 2.5 (microgramme/cubic metre)
PM 10 (microgramme/cubic metre)
WHO PM 2.5 Standard (microgramme/cubic metre)
WHO PM 10 Standard (microgramme/cubic metre)
Graph 5: PM 2.5 and PM 10 levels in residential high-density areas (poor) of different states in Nigeria
Source: 2015, Rapid Air Quality Monitoring, Federal Ministry of Environment, Nigeria
9
TOWARDS CLEAN AIR IN NIGERIAN CITIES
Graph 6: PM 2.5 and PM 10 levels in commercial and institutional areas of different states in Nigeria
0
100
200
300
400
500
600
700
800
Lagos Abuja Kano Maiduguri Port-Harcourt Aba
(mic
rog
ram
me/
cub
ic m
etre
)
States
PM 2.5 (microgramme/cubic metre)
PM 10 (microgramme/cubic metre)
WHO PM 2.5 Standard (microgramme/cubic metre)
WHO PM 10 Standard (microgramme/cubic metre)
Source: 2015, Rapid Air Quality Monitoring, Federal Ministry of Environment, Nigeria
Graph 7: PM 2.5 and PM 10 levels in industrial and high traffic area of different states in Nigeria
Source: 2015, Rapid Air Quality Monitoring, Federal Ministry of Environment, Nigeria
State of air quality monitoring
Air quality monitoring is still rudimentary, discontinuous, and limited in scope and duration.6 Limited air-quality information is available from short-term studies in Nigerian cities. There are three air-quality monitoring stations in Abuja, the capital city of Nigeria. The Federal Ministry of Environment, Nigeria’s automatic monitoring station, is at the International Conference Centre that monitors CO and SO2 levels. Another automatic station of the Meteorological agency monitors SO2, NOx, CO and PM 10 levels. The National Environment Standards and Regulation Enforcement Agency (NESREA) carries out mobile air-quality monitoring. Erratic power supply is a major barrier. Air quality is being monitored in other cities as well. However, data is not available publicly. More ambient air-quality monitoring stations are planned.
Without continuous real-time monitoring, it is not possible to inform people on a daily basis of the level of pollution they are being exposed to. This is
0
100
200
300
400
500
600
700
800
Lagos Abuja Kano Maiduguri Port-Harcourt Aba
(mic
rog
ram
me/
cub
ic m
etre
)
States
PM 2.5 (microgramme/cubic metre)
PM 10 (microgramme/cubic metre)
WHO PM 2.5 Standard (microgramme/cubic metre)
WHO PM 10 Standard (microgramme/cubic metre)
10
TOWARDS CLEAN AIR IN NIGERIAN CITIES
important from public-health standpoint. Globally, systems have been instituted in which daily pollution levels are communicated to the people based on simple communication methods so that people suffering from respiratory and cardiac disease can take precaution. If levels go up very high, local government take simmediate pollution emergency action like reducing 50 per cent of the cars on the road, shutting down industries etc. to reduce the peak levels.
Real-time monitoring will require rapid expansion of real-time air quality monitoring capacity. It can be combined with more affordable manual monitoring to create baseline air-quality data for a wider population base. This can also be conjoined with other innovative techniques like using digital data and satellite imagery to map out pollution across cities. Cities will have to frame an air-quality monitoring plan.
Explore alternative air quality monitoring in Nigeria: To meet the requirement of regulatory monitoring globally, efforts to support the development of low-cost sensor-based monitoring technologies along with guidelines are underway. These technologies can be widely deployed at lower costs to supplement the conventional monitoring systems that are very expensive. Cities in developing countries like Nigeria need to bridge the data gap and improve data availability to citizens and assess exposure. This is needed to inform policy action for health protection.
Bridging the data gap will require some scoping and assessment. Sensor-based technologies allows a range of application. They are low cost and affordable. They can help create a baseline of air-quality data, especially in areas that do not have any data to inform policymaking. They can help map local micro environments so that more localized strategies can be worked out to reduce exposure. This can make people more aware and democratize air-pollution information and build citizen science. Globally several regulatory agencies, including USEPA, UNEP, and California Air Resources Board, are evaluating these technologies.
The United Nations Environment Programme (UNEP) has developed an air-quality measurement device in the Africa region.7 It is designed mainly to revolutionize air-quality measurement in developing countries. It is very inexpensive as compared to the existing monitoring systems. The device can monitor all the important pollutants like PM 1, PM 2.5 and PM 10. It also records the concentration of sulphur and nitrogen oxides and can be extended to measure other gases such as ozone. It allows the regulatory body to establish countrywide networks of mobile and stationary monitoring stations.
Critical first steps • Air-quality monitoring strategy and monitoring network design needed• Leapfrog to real-time monitoring. Adopt a good monitoring protocol• Select pollutants and meteorological factors for monitoring• Ensure quality control and assurance for credible data• Data reporting and pubic information system• Pollution forecasting• Pollution source assessment strategy• Emissions inventory, source apportionment and modelling tools• Exposure assessment and management• Clean-air action plan to be implemented in time-bound manner• Institutional process for air-quality management to be set up
11
TOWARDS CLEAN AIR IN NIGERIAN CITIES
Ambient-air-quality standards and compliance strategy
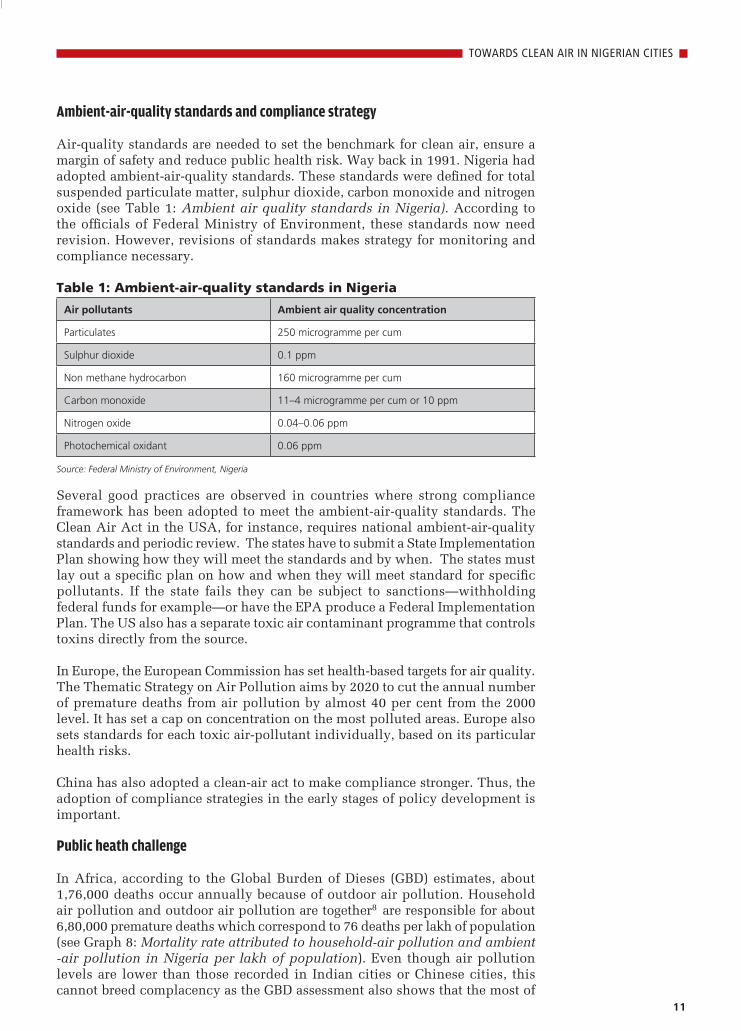
Air-quality standards are needed to set the benchmark for clean air, ensure a margin of safety and reduce public health risk. Way back in 1991. Nigeria had adopted ambient-air-quality standards. These standards were defined for total suspended particulate matter, sulphur dioxide, carbon monoxide and nitrogen oxide (see Table 1: Ambient air quality standards in Nigeria). According to the officials of Federal Ministry of Environment, these standards now need revision. However, revisions of standards makes strategy for monitoring and compliance necessary.
Table 1: Ambient-air-quality standards in Nigeria
Air pollutants Ambient air quality concentration
Particulates 250 microgramme per cum
Sulphur dioxide 0.1 ppm
Non methane hydrocarbon 160 microgramme per cum
Carbon monoxide 11–4 microgramme per cum or 10 ppm
Nitrogen oxide 0.04–0.06 ppm
Photochemical oxidant 0.06 ppm
Source: Federal Ministry of Environment, Nigeria
Several good practices are observed in countries where strong compliance framework has been adopted to meet the ambient-air-quality standards. The Clean Air Act in the USA, for instance, requires national ambient-air-quality standards and periodic review. The states have to submit a State Implementation Plan showing how they will meet the standards and by when. The states must lay out a specific plan on how and when they will meet standard for specific pollutants. If the state fails they can be subject to sanctions—withholding federal funds for example—or have the EPA produce a Federal Implementation Plan. The US also has a separate toxic air contaminant programme that controls toxins directly from the source.
In Europe, the European Commission has set health-based targets for air quality. The Thematic Strategy on Air Pollution aims by 2020 to cut the annual number of premature deaths from air pollution by almost 40 per cent from the 2000 level. It has set a cap on concentration on the most polluted areas. Europe also sets standards for each toxic air-pollutant individually, based on its particular health risks.
China has also adopted a clean-air act to make compliance stronger. Thus, the adoption of compliance strategies in the early stages of policy development is important.
Public heath challenge
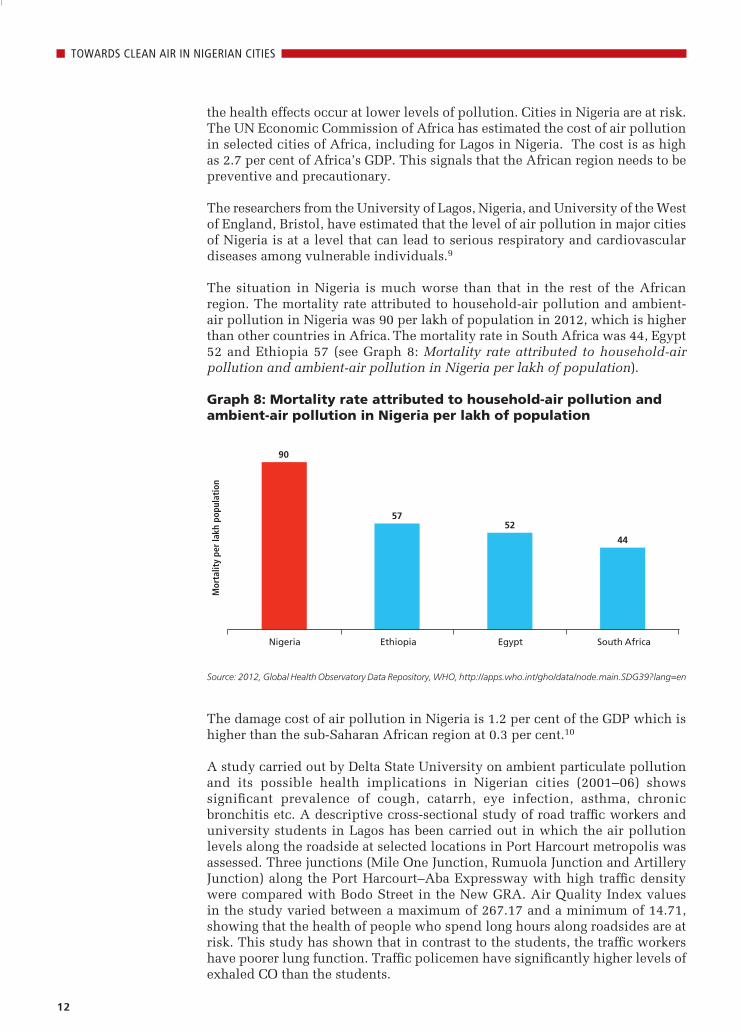
In Africa, according to the Global Burden of Dieses (GBD) estimates, about 1,76,000 deaths occur annually because of outdoor air pollution. Household air pollution and outdoor air pollution are together8 are responsible for about 6,80,000 premature deaths which correspond to 76 deaths per lakh of population (see Graph 8: Mortality rate attributed to household-air pollution and ambient -air pollution in Nigeria per lakh of population). Even though air pollution levels are lower than those recorded in Indian cities or Chinese cities, this cannot breed complacency as the GBD assessment also shows that the most of
12
TOWARDS CLEAN AIR IN NIGERIAN CITIES
the health effects occur at lower levels of pollution. Cities in Nigeria are at risk. The UN Economic Commission of Africa has estimated the cost of air pollution in selected cities of Africa, including for Lagos in Nigeria. The cost is as high as 2.7 per cent of Africa’s GDP. This signals that the African region needs to be preventive and precautionary.
The researchers from the University of Lagos, Nigeria, and University of the West of England, Bristol, have estimated that the level of air pollution in major cities of Nigeria is at a level that can lead to serious respiratory and cardiovascular diseases among vulnerable individuals.9
The situation in Nigeria is much worse than that in the rest of the African region. The mortality rate attributed to household-air pollution and ambient-air pollution in Nigeria was 90 per lakh of population in 2012, which is higher than other countries in Africa. The mortality rate in South Africa was 44, Egypt 52 and Ethiopia 57 (see Graph 8: Mortality rate attributed to household-air pollution and ambient-air pollution in Nigeria per lakh of population).
Graph 8: Mortality rate attributed to household-air pollution and ambient-air pollution in Nigeria per lakh of population
Source: 2012, Global Health Observatory Data Repository, WHO, http://apps.who.int/gho/data/node.main.SDG39?lang=en
The damage cost of air pollution in Nigeria is 1.2 per cent of the GDP which is higher than the sub-Saharan African region at 0.3 per cent.10
A study carried out by Delta State University on ambient particulate pollution and its possible health implications in Nigerian cities (2001–06) shows significant prevalence of cough, catarrh, eye infection, asthma, chronic bronchitis etc. A descriptive cross-sectional study of road traffic workers and university students in Lagos has been carried out in which the air pollution levels along the roadside at selected locations in Port Harcourt metropolis was assessed. Three junctions (Mile One Junction, Rumuola Junction and Artillery Junction) along the Port Harcourt–Aba Expressway with high traffic density were compared with Bodo Street in the New GRA. Air Quality Index values in the study varied between a maximum of 267.17 and a minimum of 14.71, showing that the health of people who spend long hours along roadsides are at risk. This study has shown that in contrast to the students, the traffic workers have poorer lung function. Traffic policemen have significantly higher levels of exhaled CO than the students.
90
57 52
44
Nigeria Ethiopia Egypt South Africa
Mor
talit
y pe
r la
kh p
opul
atio
n
13
TOWARDS CLEAN AIR IN NIGERIAN CITIES
Yet another study assessed air quality along busy roads in Kano metropolis in December 2009 to September 2010. It monitored CO, H2S, NO2, SO2, FL and NH3. It shows traffic emission within Kano metropolis is not within the safe limits and is hazardous to health. The Uyo metropolis study in the south of south Nigeria shows respiratory disorders, impairment and other debilitating illnesses. Another study conducted in Calabar revealed transport-related pollution is significant, with possibly severe health consequences. The study also says that pollution at the traffic intersections is threatening and that vehicles remain the dominant source of urban air pollution.
The 2009 study of Cross River University of Technology, Calabar, Nigeria and University of Nigeria, Nsukka, Nigeria suggested that there should be proper air-quality-management programmes, improvement in traffic flow and control that require good city-road networks, improvement in fuel quality through reduction of sulphur, proper legislative framework to regulate and control vehicle emission in the city and programmes to reduce the idling period for vehicles in highways and streets.11
Another study12 carried out in 2012 by the Department of Physics, University of Port Harcourt, Nigeria, found that in Rivers State between 2003 and 2008, a total of 30,435 cases of disease were reported. The majority of reported cases were related to air pollution.
This jigsaw of health evidences is valuable and should be integrated with the policymaking on air pollution.
Where is pollution coming from?
Proper emissions source inventory and apportionment studies have not been carried out yet to assess the relative contribution of pollution sources in Nigeria. Broad estimates show that air pollution in Lagos, Port Harcourt, Kano, Abuja and other major cities in Nigeria can be attributed to emissions from transport, energy, industry and domestic sources. The majority of the residents in Lagos are dependent on petrol-fuelled generators for domestic electricity supply and on diesel-fuelled generators for commercial energy supply. Also, uncontrolled open waste burning, thermal power stations and petrochemical activities within the city limits expose the population to significant ambient air pollution concentration.13
The air pollution control agencies can also carry out rapid mapping of pollution sources in cities to take action in micro environments and reduce pollution exposure. Mapping of pollution sources can help significantly to reduce public health risk. Nonetheless, the national air quality management will have to adopt pollution source-wise action plan to meet clean-air targets.
First-generation pollution control action in Nigeria
Air quality management has taken root in Nigeria. Since 1988, the Nigerian government has introduced environment legislations with the aim of reducing the atmospheric impact of different sources of pollution. The Federal Environment Protection Agency (FEPA) Act, 1988 was established to coordinate statutory and institutional response to environmental pollution. In 1999, the government of Nigeria created Federal Ministry of Environment with a more focused agenda of tackling issues of industrial and urban pollution.
14
TOWARDS CLEAN AIR IN NIGERIAN CITIES
The National Environmental Standard and Regulation Enforcement Agency (NESREA) was formed in 2007 as parastatal to the Federal Ministry of Environment. It is charged with the responsibility of enforcing all environmental laws, guidelines, policies, standards and regulations in Nigeria. It also has the responsibility to enforce compliance with provisions of all international agreements, protocols, conventions and treaties on the environment to which Nigeria is a signatory.
The government has formed the National Environmental (Control of Vehicular Emissions from Petrol and Diesel Engines) Regulations, 2011. It is mainly for the enforcement of the provisions given under the vehicular emission control regulations like banning of two-stroke engines and using four-stroke engines as an alternate, prohibition of motor vehicles that do not have installed approved emission-reduction technology with penalties on violators, and conducting annual testing of vehicles for toxic gas emissions.
The government has approved the National Vehicular Emission Control Programme (NVECP) to run on a Public–Private Partnership (PPP) arrangement. NVECP will be involved with the Vehicle Emission Testing Centres nationwide, annual testing of vehicles for toxic air emissions and collation of data. The National Environmental (Air Quality Control) Regulation was formed in 2014 for ambient-air-quality monitoring; it acquired air-quality monitoring equipments (both mobile stations and hand held tool) to monitor and generate accurate data on the state of air quality in Nigeria.
Several steps have been taken to bring clean fuels. Nigeria has successfully phased out the lead from its gasoline in 2003 which was two years earlier than what was proposed in the Dakar declaration of 2001. The Nigerian government has introduced vehicle emission standards equivalent to Euro 2 in 2012 though fuel quality remains a constraint. The Nigerian National Petroleum Conservation (NNPC) has a programme to revamp the existing four refineries by 2020 and by 2020 all the refineries will produce fuel of 50 ppm sulphur. They have collaborated with the Nigerian Environmental Society and a private investor, King’s Corporation, for the production of low-sulphur fuel. NNPC is exploring the biofuel option by 2017. The programme is also promoting cleaner fuels like CNG and this will be expanded by NIPCO.
There are several other regulations for other sources of pollution. They include the National Environmental (Mining and processing of Coal, Ores and Industrial Minerals) Regulations, 2009 to control pollution from mining and processing of coal; Domestic and Industrial Plastic, Rubber and Foam Sector National Environmental (Domestic and Industrial Plastic, Rubber and Foam Sector) Regulations, 2011 for pollution from all operations and ancillary activities; National Environmental (Control of Bush or Forest Fire and Open Burning) Regulations, 2011 for pollution from open burning of waste etc.; National Environmental (Construction Sector) Regulations, 2011 for pollution from construction, decommissioning and demolition activities; and National Environmental (Quarrying and Blasting Operations) Regulations, 2013 for pollution from quarrying and blasting operations.
Like other developing nations in the world, Nigeria continues to face challenges, including inadequate air-quality monitoring, human resource, capacity building of staff, paucity of funds, lack of awareness among the citizens, erratic power supply which results in use of diesel powered gensets, and illegal importation of two-stroke engines, among others.
15
TOWARDS CLEAN AIR IN NIGERIAN CITIES
The emerging action will have to be taken forward more aggressively and widely within an integrated framework. The second-generation action will now have to be scaled up and made more stringent to prevent worsening of pollution and public health risk in the years to come. Special challenge of vehicular pollution
Nigerian cities are already in grip of rapid motorization. Even with lower baselines, the rate of increase is rapid. The country has about 6 million registered vehicles that are largely concentrated in cities. In 2012, there were about 20 vehicles per 1000 people. About 4,00,000 vehicles get added every year. Though low, this is expected to increase rapidly because of economic growth and low cost of used-car imports. The average number of cars per middle-class household is estimated to be about 0.8. Around one third of middle-class Nigerians have a car that is less than five years old and 5 per cent of homes have two cars. In Lagos, vehicles contribute about 43 per cent of PM 2.5 and in Abuja, 87 per cent. Studies in the Calabar region of Nigeria found that all the five monitored air pollutants when compared with air quality index were high. CO was poor to moderate in different locations. SO2 was very poor to poor; NO2 was very poor to poor, and PM 10 was poor at all the monitored locations.14
The International Energy Agency in 2010 has stated that about 25 per cent of the Nigeria’s carbon footprint comes from the road transportation alone.
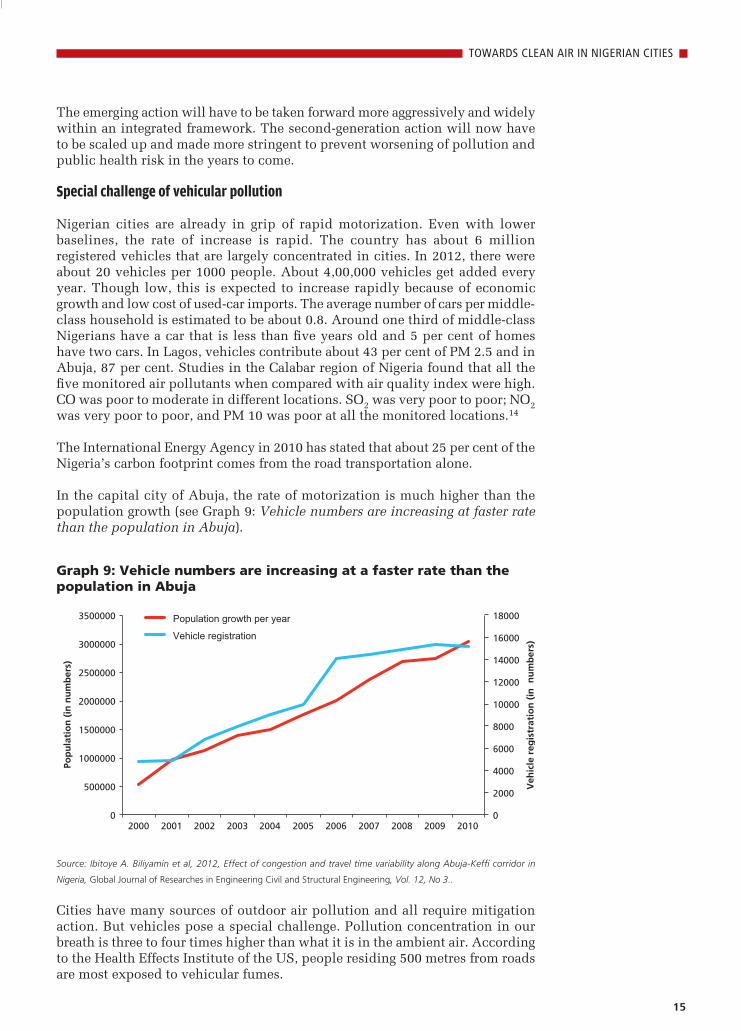
In the capital city of Abuja, the rate of motorization is much higher than the population growth (see Graph 9: Vehicle numbers are increasing at faster rate than the population in Abuja).
Cities have many sources of outdoor air pollution and all require mitigation action. But vehicles pose a special challenge. Pollution concentration in our breath is three to four times higher than what it is in the ambient air. According to the Health Effects Institute of the US, people residing 500 metres from roads are most exposed to vehicular fumes.
Graph 9: Vehicle numbers are increasing at a faster rate than the population in Abuja
Source: Ibitoye A. Biliyamin et al , 2012, Effect of congestion and travel time variability along Abuja-Keffi corridor in
Nigeria, Global Journal of Researches in Engineering Civil and Structural Engineering, Vol . 12, No 3..
0
2000
4000
6000
8000
10000
12000
14000
16000
18000
0
500000
1000000
1500000
2000000
2500000
3000000
3500000
2000 2001 2002 2003 2004 2005 2006 2007 2008 2009 2010
Veh
icle
reg
istr
atio
n (
in n
um
ber
s)
Pop
ula
tio
n (
in n
um
ber
s)
Population growth per year
Vehicle registration
16
TOWARDS CLEAN AIR IN NIGERIAN CITIES
Vehicular fumes are also extremely toxic. The toxicity of the fumes is aggravated by the rapid increase in the use of diesel in cars and expansion of freight traffic. In June 2012, WHO reclassified diesel emissions as a Class I carcinogen by putting it in the same bracket as tobacco smoking for its strong link with lung cancer. Diesel also has short-term respiratory and cardiac effects. International studies, including one carried out in London, show diesel emissions have worsened the lung function in people with asthma. The Lagos Metropolitan Area Transport Authority in 2005 initiated a 14-month air quality monitoring study. The results of the study confirmed that transport is the major cause of air pollution in the city. Another EIA study carried out by Mechelec Construction (Nigeria) in 1996 on behalf of the Lagos Urban Transport Project (LUTP) revealed that the road traffic is the major source of air pollution in the city.
Nigerians spend a whopping 4 billion Naira to fuel their vehicles on a daily basis, which costs about 35 per cent of individual income, while vehicular emissions account for about 50 per cent of Nigerian contribution to global CO2 emissions annually.
Need clean fuels and vehicles
Clean fuel is the critical first step to bring more advanced vehicle technology and reduce emissions. This process has started in the African region. In 2002, no country in Africa had 50 ppm sulphur diesel. Since January 2015, Kenya, Uganda, Rwanda, Burundi and Tanzania have moved to 50 ppm sulphur fuel within East Africa. South Africa and Nigeria have implemented the Euro II emissions standards for vehicles. South Africa has passed the regulation to implement 10 ppm by 2017. Morocco, Tunisia and Mauritius have met the 50 ppm or below target. Kenya and Rwanda have also met the 50 ppm diesel fuel sulphur target from January 2015.
In Nigeria, diesel fuel has 3000 ppm sulphur and petrol has 1000 ppm sulphur. As a result, improved vehicle emissions standards of Euro II cannot be enforced. According to the estimates available from International Council on Clean Transportation, Nigeria imports 70 per cent of its fuels to meet their national demand. Their four refineries cannot meet the domestic demand. There is a possibility that all their state refineries will be privatized. Their new refinery that will meet new specifications will come into operation in 2019. The Port Harcourt (Alesa Elema) refinery in Nigeria has the capacity to produce less than 50 ppm sulphur. It is expected that 50 ppm sulphur fuels will be available in another three years. The capital cost to upgrade fuel production to less than 50 ppm is expected to cost about US $1.5 billion.
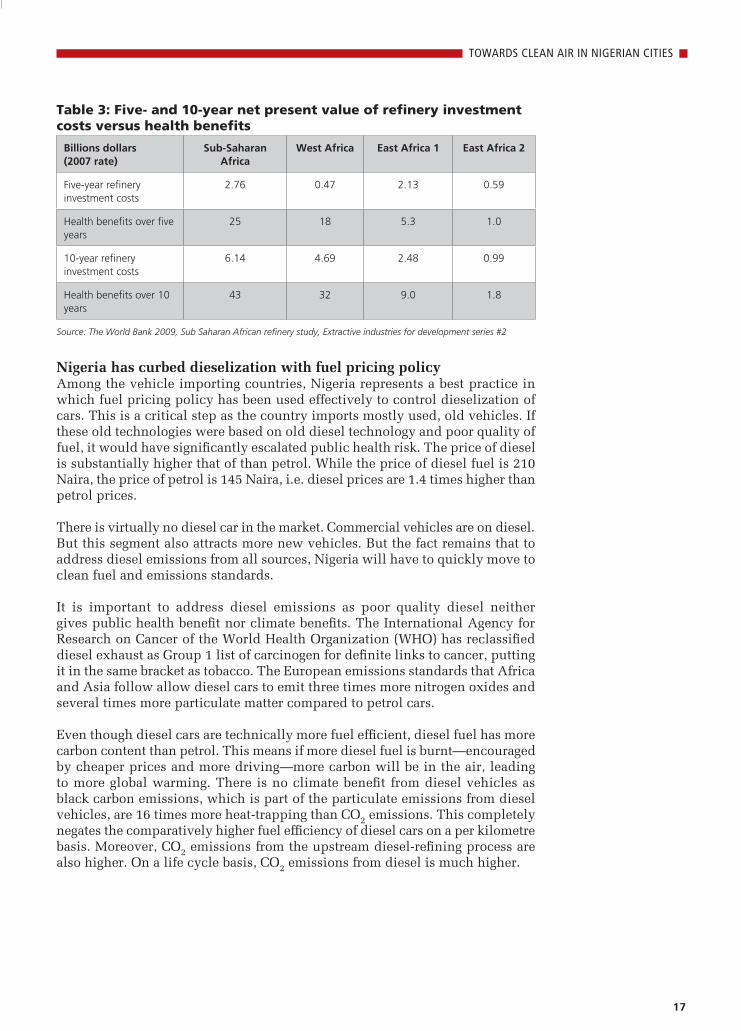
Leapfrogging to cleaner fuel can give enormous health benefits: A 2009 study of the World Bank shows that health benefits from refinery investments can be considerable in different regions of Africa. It clearly shows that over a five-year period, the health benefit can be 2.4 times the refinery investment costs and over a 10-year period it is 7.6 times. This needs to be taken into account while making investment decisions.
17
TOWARDS CLEAN AIR IN NIGERIAN CITIES
Table 3: Five- and 10-year net present value of refinery investment costs versus health benefits
Billions dollars (2007 rate)
Sub-Saharan Africa
West Africa East Africa 1 East Africa 2
Five-year refinery investment costs
2.76 0.47 2.13 0.59
Health benefits over five years
25 18 5.3 1.0
10-year refinery investment costs
6.14 4.69 2.48 0.99
Health benefits over 10 years
43 32 9.0 1.8
Source: The World Bank 2009, Sub Saharan African refinery study, Extractive industries for development series #2
Nigeria has curbed dieselization with fuel pricing policyAmong the vehicle importing countries, Nigeria represents a best practice in which fuel pricing policy has been used effectively to control dieselization of cars. This is a critical step as the country imports mostly used, old vehicles. If these old technologies were based on old diesel technology and poor quality of fuel, it would have significantly escalated public health risk. The price of diesel is substantially higher that of than petrol. While the price of diesel fuel is 210 Naira, the price of petrol is 145 Naira, i.e. diesel prices are 1.4 times higher than petrol prices.
There is virtually no diesel car in the market. Commercial vehicles are on diesel. But this segment also attracts more new vehicles. But the fact remains that to address diesel emissions from all sources, Nigeria will have to quickly move to clean fuel and emissions standards.
It is important to address diesel emissions as poor quality diesel neither gives public health benefit nor climate benefits. The International Agency for Research on Cancer of the World Health Organization (WHO) has reclassified diesel exhaust as Group 1 list of carcinogen for definite links to cancer, putting it in the same bracket as tobacco. The European emissions standards that Africa and Asia follow allow diesel cars to emit three times more nitrogen oxides and several times more particulate matter compared to petrol cars.
Even though diesel cars are technically more fuel efficient, diesel fuel has more carbon content than petrol. This means if more diesel fuel is burnt—encouraged by cheaper prices and more driving—more carbon will be in the air, leading to more global warming. There is no climate benefit from diesel vehicles as black carbon emissions, which is part of the particulate emissions from diesel vehicles, are 16 times more heat-trapping than CO2 emissions. This completely negates the comparatively higher fuel efficiency of diesel cars on a per kilometre basis. Moreover, CO2 emissions from the upstream diesel-refining process are also higher. On a life cycle basis, CO2 emissions from diesel is much higher.
18
TOWARDS CLEAN AIR IN NIGERIAN CITIES
The European Commission has found lifetime pollution costs of Euro IV-compliant diesel cars to be much higher than that of petrol cars. If more diesel is burnt, more heat-trapping CO2 will escape.
Nigeria is therefore well advised to maintain the fuel price differential in which diesel fuel prices are higher. This should be taken forward to ban the import of diesel cars until Nigeria has introduced Euro VI emission standards.
Leapfrog with alternative fuels
There is a common challenge and opportunity in Indian and Nigerian cities. Several of them have access to natural gas that can be compressed as CNG to be used in vehicles. This fuel substitution method can make a significant difference to emissions and lower pollution significantly when petrol and diesel are taking a lot of time to improve. According to the World Oil and Gas review, 2007, Nigeria is the seventh largest country in the world in terms of natural gas reserves, with 3 per cent of the world’s total natural gas reserves.
CNG use in Nigeria dates back to the late 1980s. The Nigerian Gas Company (NGC) proposed the use of CNG as vehicular fuel in 1988 and introduced it in 1989. The CNG project began in 2009. Over 5,000 vehicles run on CNG in Nigeria, according to Nigerian Independent Petroleum Company (NIPCO) Plc, an indigenous downstream petroleum and gas operator. A pilot project between the Nigerian National Petroleum Corporation (NNPC) and NIPCO, through a joint venture, Green Gas Ltd has been set up. This has led to significant infrastructure development in and around Benin City. Lagos has access to CNG. More than 4,000 vehicles have converted to CNG in Benin, the Edo State capital. Green gas refuels these taxis and cars. About 500 CNG vehicles are operating in Lagos. The company, NIPCO, has set up about 10 CNG operating stations nationwide. Others are under construction.
This CNG programme will have to be expanded for air quality gains with effective emissions and safety regulations. This is an opportunity to move the most polluting vehicle segments like the diesel buses and taxis to CNG. Use of natural gas has also led to significant savings for taxi drivers.
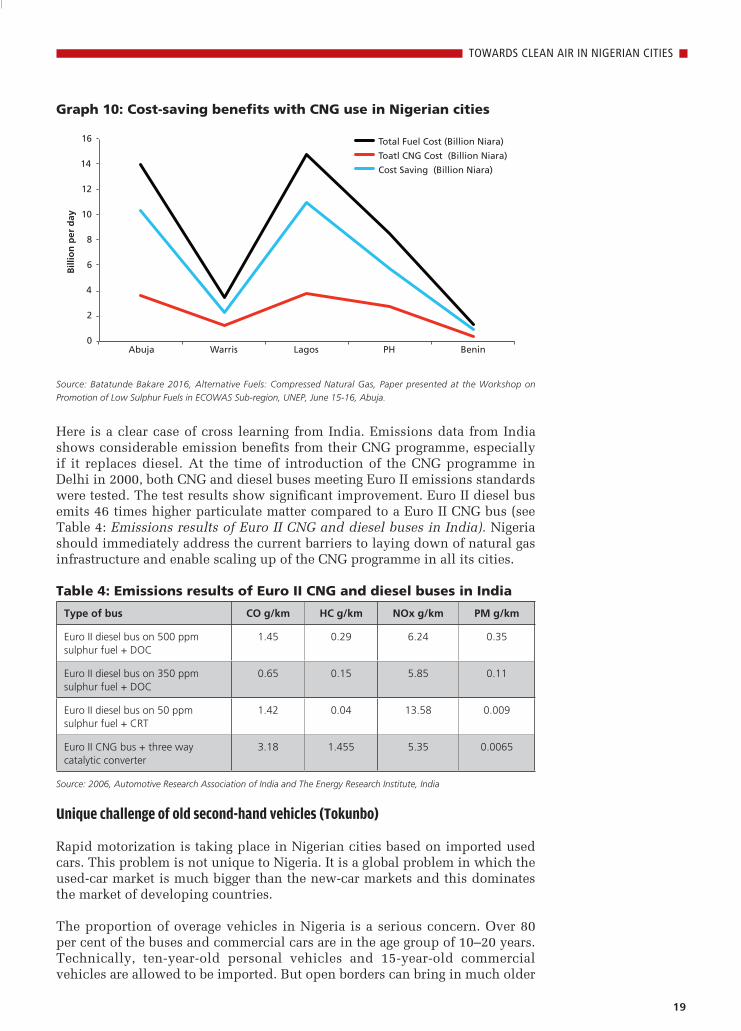
The CNG programme can improve the energy security of the country and lead to significant cost and pollution savings. According to an estimate of UNEP, the CNG programme will hugely benefit the Nigerian government. If 40 per cent of the vehicles in Nigeria switch to CNG, the government will save 28 per cent of the foreign exchange spent for importation of 1,02 billion litres of petroleum products every year. CNG use in cities will also lead to savings. In Abuja, Abuja Investment spends 13.9 billion Naira on AGO per day. The use of CNG vehicles would reduce the cost to 3.6 billion Naira, saving 10.4 billion Naira per day. Similarly, in Lagos, CNG use would reduce the fuel price to 3.8 billion compared to 14.8 billion average per day on AGO used by Lagbus and BRT, thereby saving 11 billion Naira. In another commercial hub, Port Harcourt, CNG use would lead to reduction from 8.5 billion Naira—used on both PMS and AGO—to 2.8 billion Naira, saving 5.7 billion Naira per day.15 (See Graph 10: Cost-saving benefits with CNG use in Nigerian cities)
19
TOWARDS CLEAN AIR IN NIGERIAN CITIES
Graph 10: Cost-saving benefits with CNG use in Nigerian cities
Source: Batatunde Bakare 2016, Alternative Fuels: Compressed Natural Gas, Paper presented at the Workshop on
Promotion of Low Sulphur Fuels in ECOWAS Sub-region, UNEP, June 15-16, Abuja.
Here is a clear case of cross learning from India. Emissions data from India shows considerable emission benefits from their CNG programme, especially if it replaces diesel. At the time of introduction of the CNG programme in Delhi in 2000, both CNG and diesel buses meeting Euro II emissions standards were tested. The test results show significant improvement. Euro II diesel bus emits 46 times higher particulate matter compared to a Euro II CNG bus (see Table 4: Emissions results of Euro II CNG and diesel buses in India). Nigeria should immediately address the current barriers to laying down of natural gas infrastructure and enable scaling up of the CNG programme in all its cities.
Table 4: Emissions results of Euro II CNG and diesel buses in India
Type of bus CO g/km HC g/km NOx g/km PM g/km
Euro II diesel bus on 500 ppm sulphur fuel + DOC
1.45 0.29 6.24 0.35
Euro II diesel bus on 350 ppm sulphur fuel + DOC
0.65 0.15 5.85 0.11
Euro II diesel bus on 50 ppm sulphur fuel + CRT
1.42 0.04 13.58 0.009
Euro II CNG bus + three way catalytic converter
3.18 1.455 5.35 0.0065
Source: 2006, Automotive Research Association of India and The Energy Research Institute, India
Unique challenge of old second-hand vehicles (Tokunbo)
Rapid motorization is taking place in Nigerian cities based on imported used cars. This problem is not unique to Nigeria. It is a global problem in which the used-car market is much bigger than the new-car markets and this dominates the market of developing countries.
The proportion of overage vehicles in Nigeria is a serious concern. Over 80 per cent of the buses and commercial cars are in the age group of 10–20 years. Technically, ten-year-old personal vehicles and 15-year-old commercial vehicles are allowed to be imported. But open borders can bring in much older
0
2
4
6
8
10
12
14
16
Abuja Warris Lagos PH Benin
Bill
ion
per
day
Total Fuel Cost (Billion Niara)
Toatl CNG Cost (Billion Niara)
Cost Saving (Billion Niara)
20
TOWARDS CLEAN AIR IN NIGERIAN CITIES
vehicles. Older vehicles do not have emissions control systems like catalytic converters and emit much higher pollution. Nearly 70 per cent of the imported vehicles are old and used.
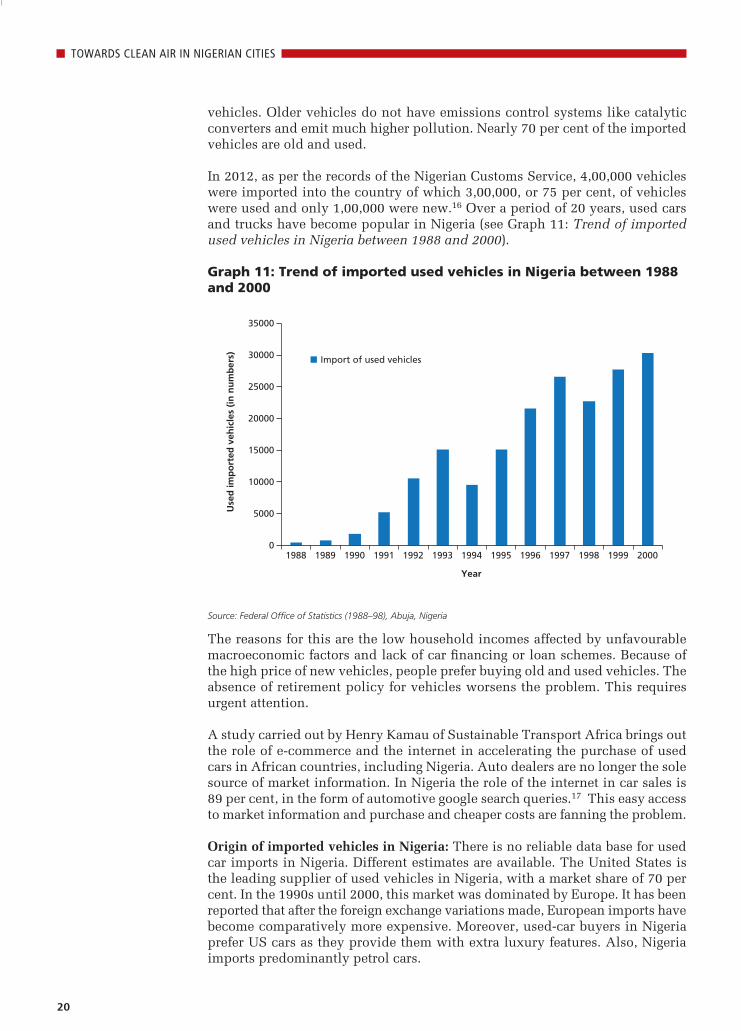
In 2012, as per the records of the Nigerian Customs Service, 4,00,000 vehicles were imported into the country of which 3,00,000, or 75 per cent, of vehicles were used and only 1,00,000 were new.16 Over a period of 20 years, used cars and trucks have become popular in Nigeria (see Graph 11: Trend of imported used vehicles in Nigeria between 1988 and 2000).
Graph 11: Trend of imported used vehicles in Nigeria between 1988 and 2000
Source: Federal Office of Statistics (1988–98), Abuja, Nigeria
The reasons for this are the low household incomes affected by unfavourable macroeconomic factors and lack of car financing or loan schemes. Because of the high price of new vehicles, people prefer buying old and used vehicles. The absence of retirement policy for vehicles worsens the problem. This requires urgent attention.
A study carried out by Henry Kamau of Sustainable Transport Africa brings out the role of e-commerce and the internet in accelerating the purchase of used cars in African countries, including Nigeria. Auto dealers are no longer the sole source of market information. In Nigeria the role of the internet in car sales is 89 per cent, in the form of automotive google search queries.17 This easy access to market information and purchase and cheaper costs are fanning the problem.
Origin of imported vehicles in Nigeria: There is no reliable data base for used car imports in Nigeria. Different estimates are available. The United States is the leading supplier of used vehicles in Nigeria, with a market share of 70 per cent. In the 1990s until 2000, this market was dominated by Europe. It has been reported that after the foreign exchange variations made, European imports have become comparatively more expensive. Moreover, used-car buyers in Nigeria prefer US cars as they provide them with extra luxury features. Also, Nigeria imports predominantly petrol cars.
0
5000
10000
15000
20000
25000
30000
35000
1988 1989 1990 1991 1992 1993 1994
Year
1995 1996 1997 1998 1999 2000
Use
d im
po
rted
veh
icle
s (i
n n
um
ber
s)
Import of used vehicles
21
TOWARDS CLEAN AIR IN NIGERIAN CITIES
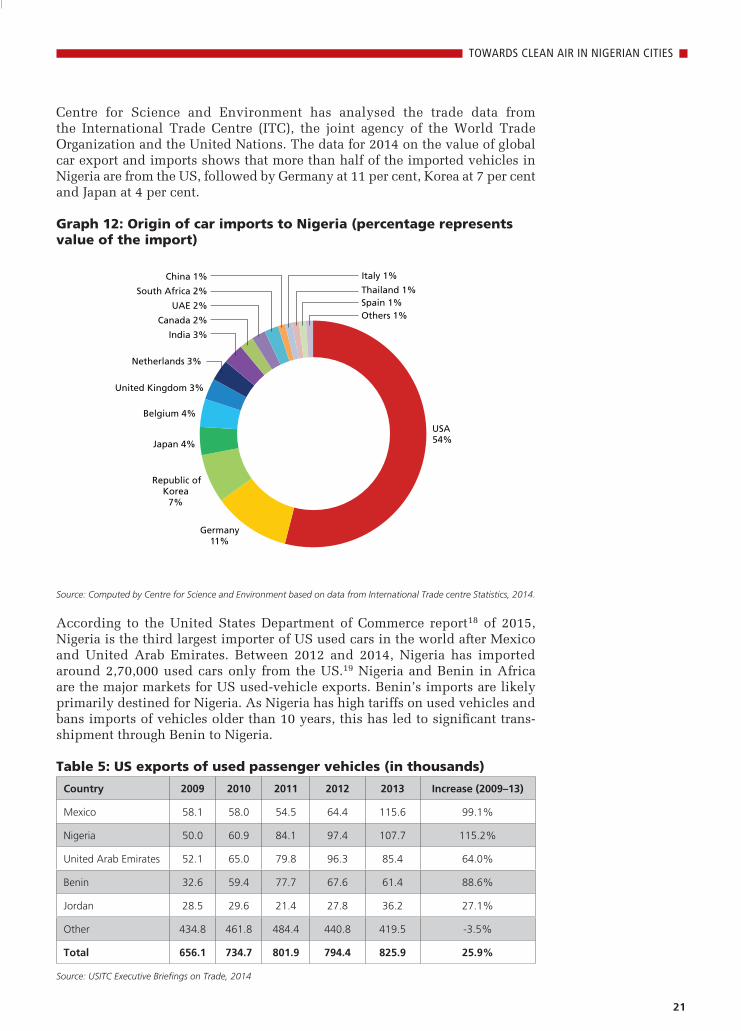
Centre for Science and Environment has analysed the trade data from the International Trade Centre (ITC), the joint agency of the World Trade Organization and the United Nations. The data for 2014 on the value of global car export and imports shows that more than half of the imported vehicles in Nigeria are from the US, followed by Germany at 11 per cent, Korea at 7 per cent and Japan at 4 per cent.
Graph 12: Origin of car imports to Nigeria (percentage represents value of the import)
Source: Computed by Centre for Science and Environment based on data from International Trade centre Statistics, 2014.
According to the United States Department of Commerce report18 of 2015, Nigeria is the third largest importer of US used cars in the world after Mexico and United Arab Emirates. Between 2012 and 2014, Nigeria has imported around 2,70,000 used cars only from the US.19 Nigeria and Benin in Africa are the major markets for US used-vehicle exports. Benin’s imports are likely primarily destined for Nigeria. As Nigeria has high tariffs on used vehicles and bans imports of vehicles older than 10 years, this has led to significant trans-shipment through Benin to Nigeria.
Table 5: US exports of used passenger vehicles (in thousands)
Country 2009 2010 2011 2012 2013 Increase (2009–13)
Mexico 58.1 58.0 54.5 64.4 115.6 99.1%
Nigeria 50.0 60.9 84.1 97.4 107.7 115.2%
United Arab Emirates 52.1 65.0 79.8 96.3 85.4 64.0%
Benin 32.6 59.4 77.7 67.6 61.4 88.6%
Jordan 28.5 29.6 21.4 27.8 36.2 27.1%
Other 434.8 461.8 484.4 440.8 419.5 -3.5%
Total 656.1 734.7 801.9 794.4 825.9 25.9%
Source: USITC Executive Briefings on Trade, 2014
USA 54%
Germany 11%
Republic of Korea
7%
Japan 4%
Belgium 4%
United Kingdom 3%
Netherlands 3%
India 3%
Canada 2%
UAE 2%
South Africa 2%
China 1% Italy 1%
Thailand 1% Spain 1% Others 1%
22
TOWARDS CLEAN AIR IN NIGERIAN CITIES
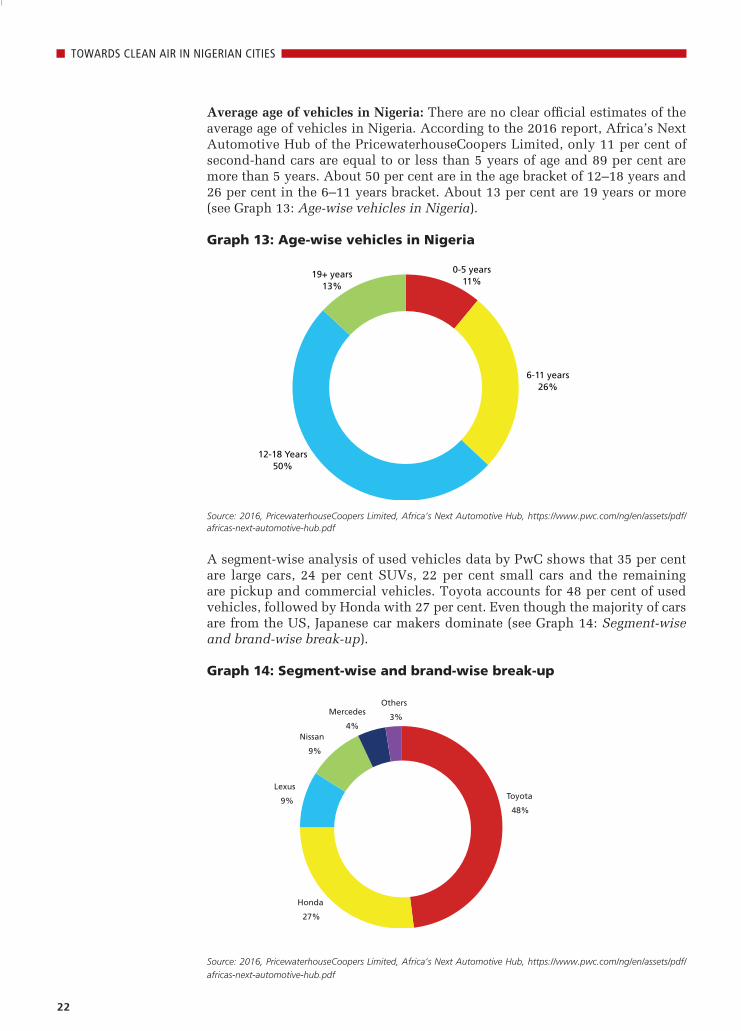
Average age of vehicles in Nigeria: There are no clear official estimates of the average age of vehicles in Nigeria. According to the 2016 report, Africa’s Next Automotive Hub of the PricewaterhouseCoopers Limited, only 11 per cent of second-hand cars are equal to or less than 5 years of age and 89 per cent are more than 5 years. About 50 per cent are in the age bracket of 12–18 years and 26 per cent in the 6–11 years bracket. About 13 per cent are 19 years or more (see Graph 13: Age-wise vehicles in Nigeria).
Graph 13: Age-wise vehicles in Nigeria
Source: 2016, PricewaterhouseCoopers Limited, Africa’s Next Automotive Hub, https://www.pwc.com/ng/en/assets/pdf/africas-next-automotive-hub.pdf
A segment-wise analysis of used vehicles data by PwC shows that 35 per cent are large cars, 24 per cent SUVs, 22 per cent small cars and the remaining are pickup and commercial vehicles. Toyota accounts for 48 per cent of used vehicles, followed by Honda with 27 per cent. Even though the majority of cars are from the US, Japanese car makers dominate (see Graph 14: Segment-wise and brand-wise break-up).
Graph 14: Segment-wise and brand-wise break-up
Source: 2016, PricewaterhouseCoopers Limited, Africa’s Next Automotive Hub, https://www.pwc.com/ng/en/assets/pdf/
africas-next-automotive-hub.pdf
0-5 years 11%
6-11 years 26%
12-18 Years 50%
19+ years 13%
Toyota
48%
Honda
27%
Lexus
9%
Nissan
9%
Mercedes
4%
Others
3%
23
TOWARDS CLEAN AIR IN NIGERIAN CITIES
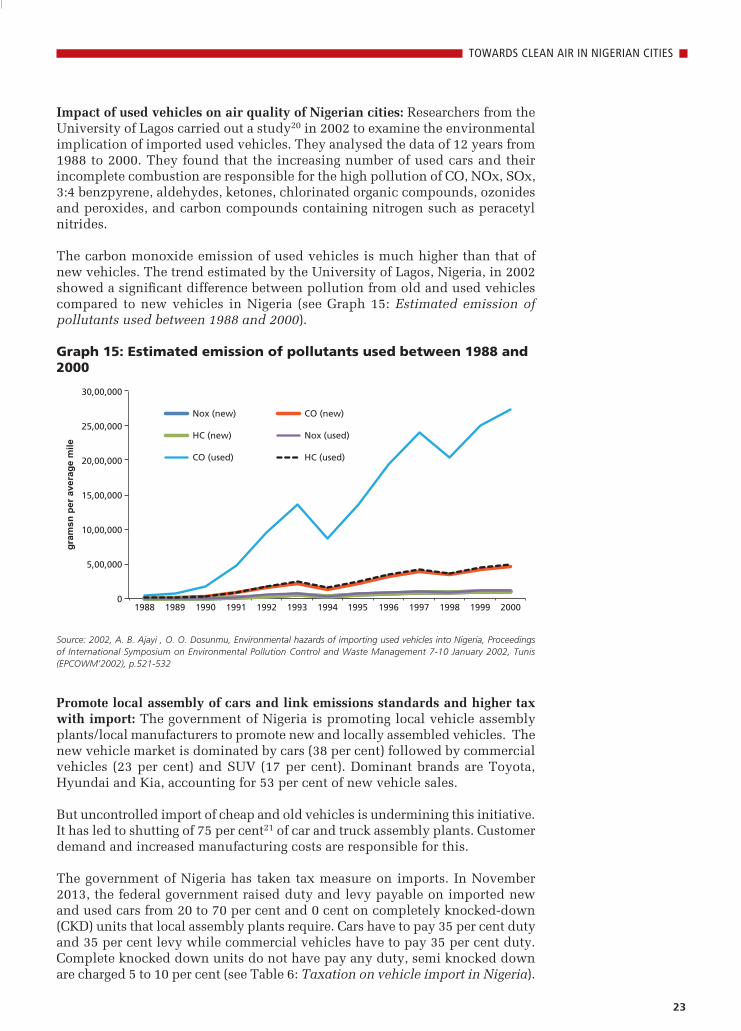
Impact of used vehicles on air quality of Nigerian cities: Researchers from the University of Lagos carried out a study20 in 2002 to examine the environmental implication of imported used vehicles. They analysed the data of 12 years from 1988 to 2000. They found that the increasing number of used cars and their incomplete combustion are responsible for the high pollution of CO, NOx, SOx, 3:4 benzpyrene, aldehydes, ketones, chlorinated organic compounds, ozonides and peroxides, and carbon compounds containing nitrogen such as peracetyl nitrides.
The carbon monoxide emission of used vehicles is much higher than that of new vehicles. The trend estimated by the University of Lagos, Nigeria, in 2002 showed a significant difference between pollution from old and used vehicles compared to new vehicles in Nigeria (see Graph 15: Estimated emission of pollutants used between 1988 and 2000).
Graph 15: Estimated emission of pollutants used between 1988 and 2000
Source: 2002, A. B. Ajayi , O. O. Dosunmu, Environmental hazards of importing used vehicles into Nigeria, Proceedings of International Symposium on Environmental Pollution Control and Waste Management 7-10 January 2002, Tunis (EPCOWM’2002), p.521-532
Promote local assembly of cars and link emissions standards and higher tax with import: The government of Nigeria is promoting local vehicle assembly plants/local manufacturers to promote new and locally assembled vehicles. The new vehicle market is dominated by cars (38 per cent) followed by commercial vehicles (23 per cent) and SUV (17 per cent). Dominant brands are Toyota, Hyundai and Kia, accounting for 53 per cent of new vehicle sales.
But uncontrolled import of cheap and old vehicles is undermining this initiative. It has led to shutting of 75 per cent21 of car and truck assembly plants. Customer demand and increased manufacturing costs are responsible for this.
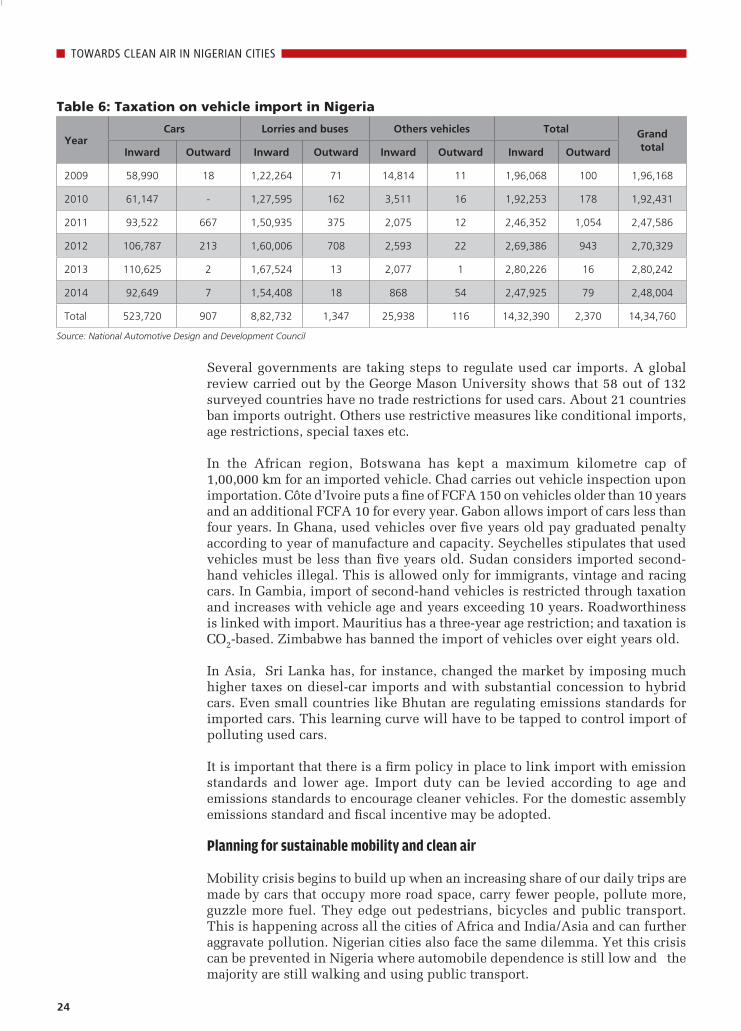
The government of Nigeria has taken tax measure on imports. In November 2013, the federal government raised duty and levy payable on imported new and used cars from 20 to 70 per cent and 0 cent on completely knocked-down (CKD) units that local assembly plants require. Cars have to pay 35 per cent duty and 35 per cent levy while commercial vehicles have to pay 35 per cent duty. Complete knocked down units do not have pay any duty, semi knocked down are charged 5 to 10 per cent (see Table 6: Taxation on vehicle import in Nigeria).
0
5,00,000
10,00,000
15,00,000
20,00,000
25,00,000
30,00,000
gram
sn p
er a
vera
ge m
ile
Nox (new) CO (new)
HC (new) Nox (used)
CO (used) HC (used)
1988 1989 1990 1991 1992 1993 1994 1995 1996 1997 1998 1999 2000
24
TOWARDS CLEAN AIR IN NIGERIAN CITIES
Several governments are taking steps to regulate used car imports. A global review carried out by the George Mason University shows that 58 out of 132 surveyed countries have no trade restrictions for used cars. About 21 countries ban imports outright. Others use restrictive measures like conditional imports, age restrictions, special taxes etc.
In the African region, Botswana has kept a maximum kilometre cap of 1,00,000 km for an imported vehicle. Chad carries out vehicle inspection upon importation. Côte d’Ivoire puts a fine of FCFA 150 on vehicles older than 10 years and an additional FCFA 10 for every year. Gabon allows import of cars less than four years. In Ghana, used vehicles over five years old pay graduated penalty according to year of manufacture and capacity. Seychelles stipulates that used vehicles must be less than five years old. Sudan considers imported second-hand vehicles illegal. This is allowed only for immigrants, vintage and racing cars. In Gambia, import of second-hand vehicles is restricted through taxation and increases with vehicle age and years exceeding 10 years. Roadworthiness is linked with import. Mauritius has a three-year age restriction; and taxation is CO2-based. Zimbabwe has banned the import of vehicles over eight years old.
In Asia, Sri Lanka has, for instance, changed the market by imposing much higher taxes on diesel-car imports and with substantial concession to hybrid cars. Even small countries like Bhutan are regulating emissions standards for imported cars. This learning curve will have to be tapped to control import of polluting used cars.
It is important that there is a firm policy in place to link import with emission standards and lower age. Import duty can be levied according to age and emissions standards to encourage cleaner vehicles. For the domestic assembly emissions standard and fiscal incentive may be adopted.
Planning for sustainable mobility and clean air
Mobility crisis begins to build up when an increasing share of our daily trips are made by cars that occupy more road space, carry fewer people, pollute more, guzzle more fuel. They edge out pedestrians, bicycles and public transport. This is happening across all the cities of Africa and India/Asia and can further aggravate pollution. Nigerian cities also face the same dilemma. Yet this crisis can be prevented in Nigeria where automobile dependence is still low and the majority are still walking and using public transport.
Table 6: Taxation on vehicle import in Nigeria
YearCars Lorries and buses Others vehicles Total Grand
totalInward Outward Inward Outward Inward Outward Inward Outward
2009 58,990 18 1,22,264 71 14,814 11 1,96,068 100 1,96,168
2010 61,147 - 1,27,595 162 3,511 16 1,92,253 178 1,92,431
2011 93,522 667 1,50,935 375 2,075 12 2,46,352 1,054 2,47,586
2012 106,787 213 1,60,006 708 2,593 22 2,69,386 943 2,70,329
2013 110,625 2 1,67,524 13 2,077 1 2,80,226 16 2,80,242
2014 92,649 7 1,54,408 18 868 54 2,47,925 79 2,48,004
Total 523,720 907 8,82,732 1,347 25,938 116 14,32,390 2,370 14,34,760
Source: National Automotive Design and Development Council
25
TOWARDS CLEAN AIR IN NIGERIAN CITIES
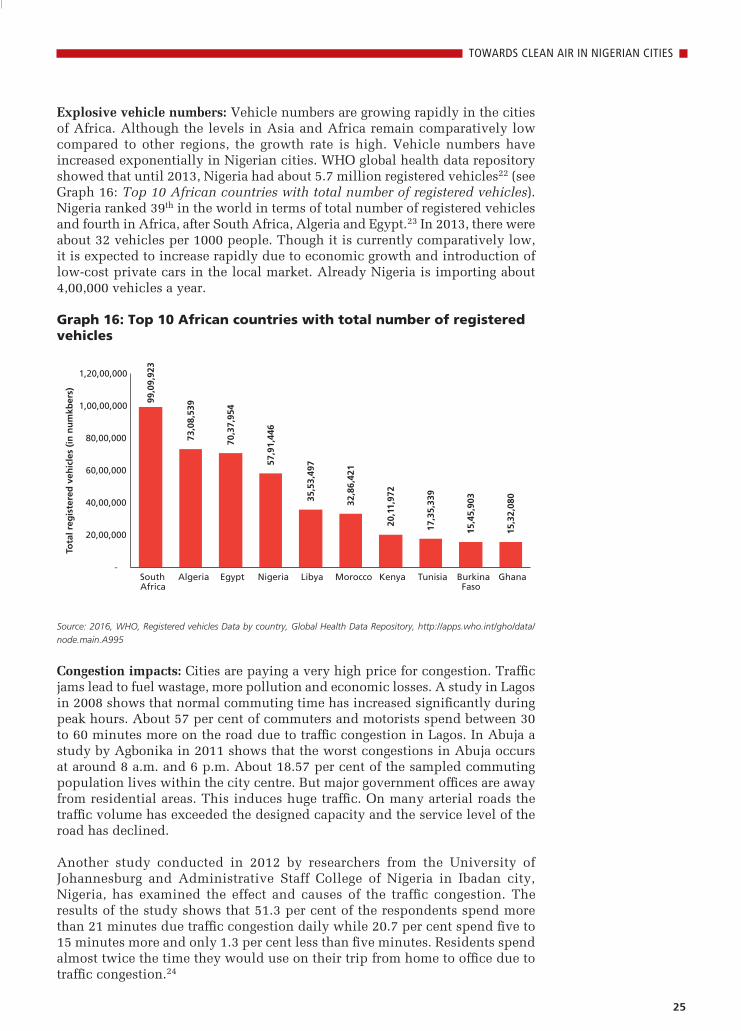
Explosive vehicle numbers: Vehicle numbers are growing rapidly in the cities of Africa. Although the levels in Asia and Africa remain comparatively low compared to other regions, the growth rate is high. Vehicle numbers have increased exponentially in Nigerian cities. WHO global health data repository showed that until 2013, Nigeria had about 5.7 million registered vehicles22 (see Graph 16: Top 10 African countries with total number of registered vehicles). Nigeria ranked 39th in the world in terms of total number of registered vehicles and fourth in Africa, after South Africa, Algeria and Egypt.23 In 2013, there were about 32 vehicles per 1000 people. Though it is currently comparatively low, it is expected to increase rapidly due to economic growth and introduction of low-cost private cars in the local market. Already Nigeria is importing about 4,00,000 vehicles a year.
Graph 16: Top 10 African countries with total number of registered vehicles
99,
09,9
23
73,
08,5
39
70,
37,9
54
57,
91,4
46
35,
53,4
97
32,
86,4
21
20,
11,9
72
17,
35,3
39
15,
45,9
03
15,
32,0
80
-
20,00,000
40,00,000
60,00,000
80,00,000
1,00,00,000
1,20,00,000
South Africa
Algeria Egypt Nigeria Libya Morocco Kenya Tunisia Burkina Faso
Ghana
Tota
l reg
iste
red
veh
icle
s (i
n n
um
kber
s)
Source: 2016, WHO, Registered vehicles Data by country, Global Health Data Repository, http://apps.who.int/gho/data/
node.main.A995
Congestion impacts: Cities are paying a very high price for congestion. Traffic jams lead to fuel wastage, more pollution and economic losses. A study in Lagos in 2008 shows that normal commuting time has increased significantly during peak hours. About 57 per cent of commuters and motorists spend between 30 to 60 minutes more on the road due to traffic congestion in Lagos. In Abuja a study by Agbonika in 2011 shows that the worst congestions in Abuja occurs at around 8 a.m. and 6 p.m. About 18.57 per cent of the sampled commuting population lives within the city centre. But major government offices are away from residential areas. This induces huge traffic. On many arterial roads the traffic volume has exceeded the designed capacity and the service level of the road has declined.
Another study conducted in 2012 by researchers from the University of Johannesburg and Administrative Staff College of Nigeria in Ibadan city, Nigeria, has examined the effect and causes of the traffic congestion. The results of the study shows that 51.3 per cent of the respondents spend more than 21 minutes due traffic congestion daily while 20.7 per cent spend five to 15 minutes more and only 1.3 per cent less than five minutes. Residents spend almost twice the time they would use on their trip from home to office due to traffic congestion.24
26
TOWARDS CLEAN AIR IN NIGERIAN CITIES
Road safety and clean air
Urban road designs that give priority to vehicle speed and movement also compromise road safety. They discourage walking and public transport usage and add to pollution. Safe access is therefore critical for pollution control. Africa is said to have high road injury risk. It has less than 3 per cent of the world’s motor vehicles but more than 11 per cent of global road fatalities. Nigeria has initiated a road safety programme.
Nigeria witnessed its first traffic accident in 1906. The accident rate had remained very low because of low vehicle population. But 1970s onwards, motorization and the rate of traffic accidents have increased. According to the Department of Transport Management Technology, Federal University of Technology, Minna, Nigeria, there were 53,997 road traffic accidents in 1976, resulting in 7,717 deaths. In 1981, accidents reduced to 35,114 but deaths increased to 10,236. In 1984, Nigeria was said to have the highest rate of road traffic deaths in Africa. The chances of a vehicle killing someone in Nigeria are 47 times higher than in Britain. In 1988 there were 25,292 road traffic accidents and 9,077 deaths.
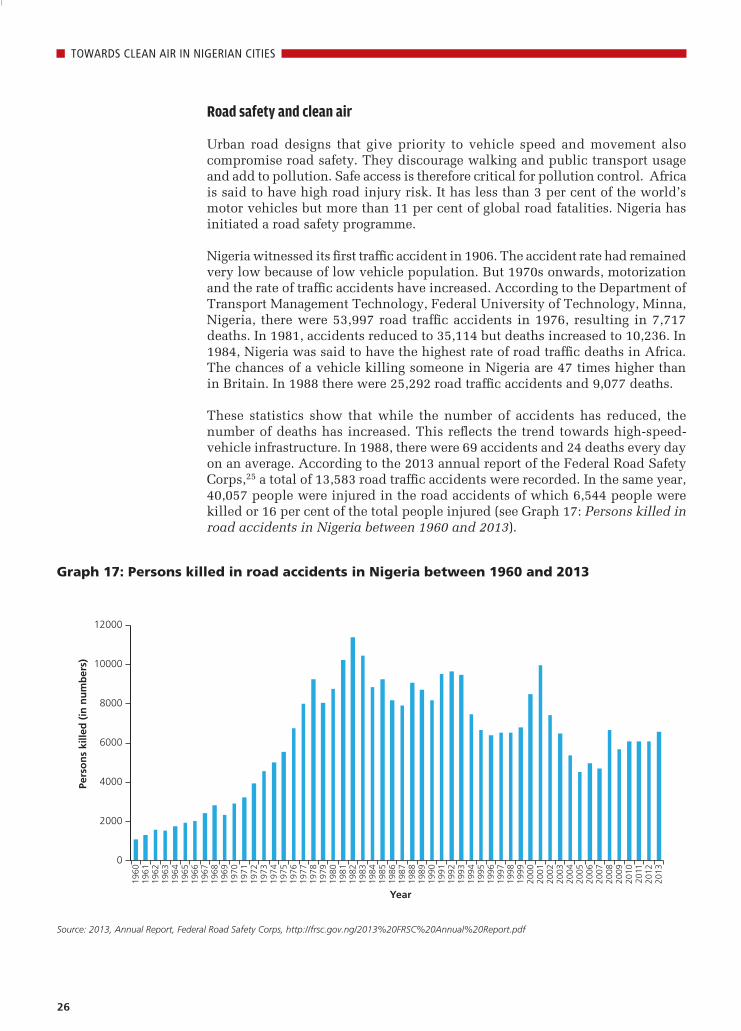
These statistics show that while the number of accidents has reduced, the number of deaths has increased. This reflects the trend towards high-speed-vehicle infrastructure. In 1988, there were 69 accidents and 24 deaths every day on an average. According to the 2013 annual report of the Federal Road Safety Corps,25 a total of 13,583 road traffic accidents were recorded. In the same year, 40,057 people were injured in the road accidents of which 6,544 people were killed or 16 per cent of the total people injured (see Graph 17: Persons killed in road accidents in Nigeria between 1960 and 2013).
0
2000
4000
6000
8000
10000
12000
1960
19
61
1962
19
63
1964
19
65
1966
19
67
1968
19
69
1970
19
71
1972
19
73
1974
19
75
1976
19
77
1978
19
79
1980
19
81
1982
19
83
1984
19
85
1986
19
87
1988
19
89
1990
19
91
1992
19
93
1994
19
95
1996
19
97
1998
19
99
2000
20
01
2002
20
03
2004
20
05
2006
20
07
2008
20
09
2010
20
11
2012
20
13
Pers
on
s ki
lled
(in
nu
mb
ers)
Year
Graph 17: Persons killed in road accidents in Nigeria between 1960 and 2013
Source: 2013, Annual Report, Federal Road Safety Corps, http://frsc.gov.ng/2013%20FRSC%20Annual%20Report.pdf
27
TOWARDS CLEAN AIR IN NIGERIAN CITIES
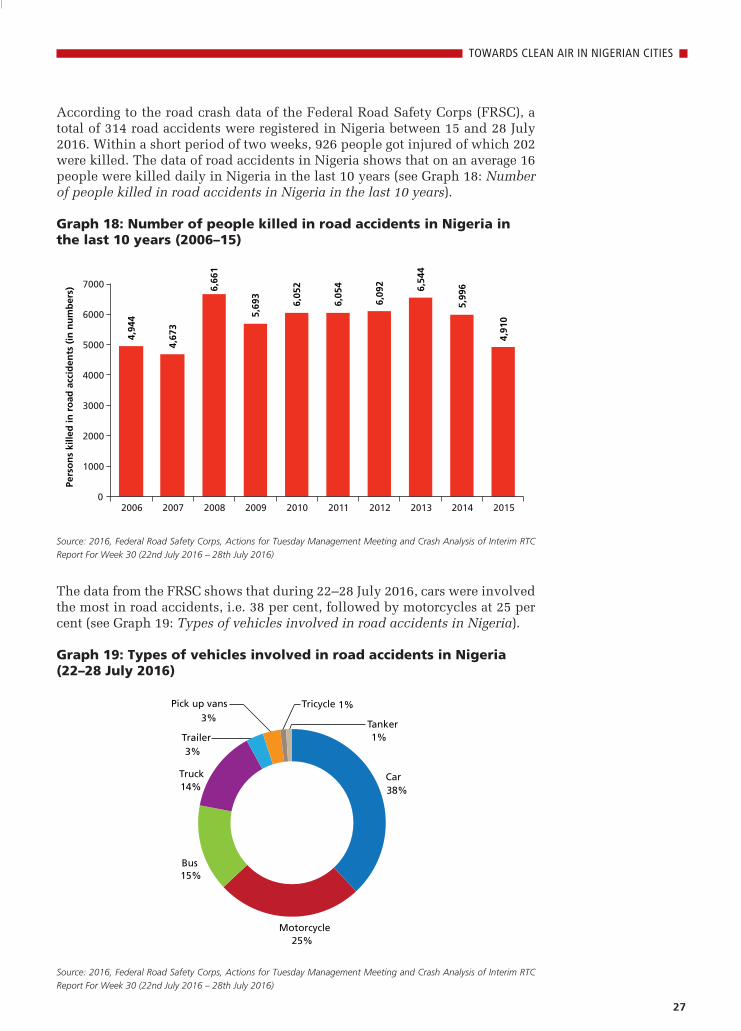
According to the road crash data of the Federal Road Safety Corps (FRSC), a total of 314 road accidents were registered in Nigeria between 15 and 28 July 2016. Within a short period of two weeks, 926 people got injured of which 202 were killed. The data of road accidents in Nigeria shows that on an average 16 people were killed daily in Nigeria in the last 10 years (see Graph 18: Number of people killed in road accidents in Nigeria in the last 10 years).
Graph 18: Number of people killed in road accidents in Nigeria in the last 10 years (2006–15)
Source: 2016, Federal Road Safety Corps, Actions for Tuesday Management Meeting and Crash Analysis of Interim RTC
Report For Week 30 (22nd July 2016 – 28th July 2016)
The data from the FRSC shows that during 22–28 July 2016, cars were involved the most in road accidents, i.e. 38 per cent, followed by motorcycles at 25 per cent (see Graph 19: Types of vehicles involved in road accidents in Nigeria).
Graph 19: Types of vehicles involved in road accidents in Nigeria (22–28 July 2016)
Source: 2016, Federal Road Safety Corps, Actions for Tuesday Management Meeting and Crash Analysis of Interim RTC
Report For Week 30 (22nd July 2016 – 28th July 2016)
4,94
4
4,67
3
6,66
1
5,69
3
6,05
2
6,05
4
6,09
2 6,54
4
5,99
6
4,91
0 0
1000
2000
3000
4000
5000
6000
7000
2006 2007 2008 2009 2010 2011 2012 2013 2014 2015
Pers
on
s ki
lled
in r
oad
acc
iden
ts (
in n
um
ber
s)
Car 38%
Motorcycle 25%
Bus 15%
Truck 14%
Trailer 3%
Pick up vans
3% Tricycle 1%
Tanker 1%
28
TOWARDS CLEAN AIR IN NIGERIAN CITIES
Intermediate and informal public transport system
In African cities, intermediate public transport systems such as mini buses and taxis, play a crucial role in providing affordable public transport services to the masses. Cities must not make the mistake of destroying this intermediate public transport system that includes a wide range of informal systems in African cities—white and blue minibuses/vans (blue donkeys), matatus, boda bodas and auto rickshaws. In most cities of India and Africa, intermediate public transport system provides the bulk of public transport services. In Nigerian cities, as much as 70 per cent of the daily travel trips are carried by this transport system. In Nairobi, for example, matatus or minibuses are the only form of public transport operating and meeting nearly 70 per cent of the travel demand. These systems are also very important for last-mile connectivity and as feeders to mass transit systems like bus rapid transit systems and rail-based systems. Congestion will worsen if they are replaced by cars.
These modes of transport are overcrowded, polluting and known for being dangerously driven. But this can be improved and organized. These have cheap and affordable fares and are the lifeline of city’s public transport. Steps should be taken to bring a cleaner fleet and organize them better. For example, in Nairobi and Addis Ababa, efforts are being made to organize this system by basing it on a zoning system and involving owners’ associations. These associations manage service routes. This system should be protected and scaled up.
In Nigeria, the private sector is involved in the business of procuring and operating different types of vehicles that are believed to be cost effective in meeting peoples demand for mobility.
From the studies carried out in 2008 by the University of Technology, Ogbomoso, Nigeria, and Obafemi Awolowo University, Ile-Ife, Nigeria, on public transport vehicles, the popular modes of public transport are taxis, mini buses (locally called danfo) and adapted vehicles built on truck chassis, locally called molue or bolekaja, and conventional buses to some extent.26
According to the Trans-Africa Consortium and International Association of Public Transport report of 2008, informal systems provides 60 per cent of the public transport services in Lagos.27 Public transport services with large buses are operated in Abuja and Port Harcourt but these are still at an inception stage. But these services are not adequate and have very limited area of operations.
Several cities across African countries are taking steps to reorganize informal transport operators. In Addis Ababa in Ethiopia, owners of blue and white taxis have been organized under 13 owners’ associations based on the zoning system reintroduced in 2011.
The number of members in each association varies, with a minimum number of 500. These associations engage in service route management. The 13 minibus taxi owners associations are being reorganized into two bigger share companies. Members of the associations are expected to change their vehicles into midi-buses, with a capacity of up to 24 passengers.
A similar initiative is being undertaken in Nairobi. Mini- and midi-bus taxis should not be phased out if light rail system comes. These should only be improved and integrated.
29
TOWARDS CLEAN AIR IN NIGERIAN CITIES
There is also a scope of cross-learning from Delhi, India. The three-wheeler auto rickshaws are being organized and are to be given public service vehicle badges and smart cards. They are to have GPS connectivity to improve the metering and compliance. These vehicles are subjected to in-use vehicle fitness and emission testing systems. They are also being deployed as feeders to mass transit system. All of them run on CNG. In other cities of India, cycle rickshaws are also being organized in a similar way.
Okada refers to commercial motorcycles in Nigeria, where motorcycle riders carry passengers for hire. It is one of the main modes of transport in Nigeria and by far the most common form of informal transport system in the country. Its popularity and widespread acceptance has rapidly risen in recent years. Unfortunately, the rise of Okada has been accompa nied by increased levels of high-risk behaviour and accidents on Nigerian roads; as a result they have come under heavy flak culminating in legislation restricting or prohibiting their operations in some Nigerian cities.28 This will have to be addressed.
Formal public transport system
The challenges providing transportation in Nigeria are numerous.29 Some of these, as identified by government officials and other experts, include poor governance, neglect, excessive government monopoly in rail systems, non-implementation of road-related mass transit policies and programmes, obsolete and deficient transport policies, and underdeveloped inland waterways, ports and port services.30
The rail sub-sector has not met expectations due to poor maintenance, inferior quality of networks, financing, research and technology, economic, financial and efficiency viability, insufficient modern equipment and technology for rail operations, inadequate investment, shortages and malfunctioning of transport equipment and furniture, lack of executive capacity and technically qualified personnel lack of involvement by private sector operators and lack of implementable laws to open the sector to interested investors.
The road sub-sector is bedevilled by insufficient fleet of buses, irregular, aged, overcrowded vehicles, especially commuter buses, inadequate investment by the private sector, poor implementation of government mass transportation programmes and traffic congestion.
The government of Nigeria is now taking active interest and has earmarked investments through budgetary allocations. It is revamping the rail sub-sector and policies to harness resources from the private sector. It plans to focus on the provision of adequate regulatory framework for coordinating the sector. Aware of the failures in past efforts at providing mass transport buses through agencies like FUMTA (Federal Urban Mass Transit Agency), the government is encouraging private sector involvement while focusing on the rail sector.
Public transport regulation: The public transport sector in Nigeria is supervised at the fed eral level by the Federal Ministry of Transport. At the state level, like in Lagos, it is managed by the State Ministry of Trans portation. The State Ministry aims for safe, efficient, affordable and seamless Intermodal Transport System in line with global best practices. In practice, it is responsible for the state road infra structures network, road traffic and public transport provision within the Lagos state boundaries through a large number of departments and agencies at the state as well as the local levels. In 2007, LAMATA (Lagos Metropolitan
30
TOWARDS CLEAN AIR IN NIGERIAN CITIES
Area Transport Authority) was successful in passing the neces sary regulation through the Lagos State House of Rep resentative to improve transportation in Metropolitan Lagos such as the franchise regulation. It empowered LAMATA with the tendering of exclusive operating rights for specific transport services on defined routes or within geographical areas.
Buses in Nigeria In any developing country city buses play an important role in meeting the travel demand. Buses provide the bulk of public transport services—as much as 40–60 per cent—in most developing country city that have city bus services. High targets for public transport modal share can be met only with bus systems. For instance, the Delhi Master Plan targets an 80 per cent share of public transport by 2020 and 73 per cent of this share can be met by buses. Buses allow greater flexibility, geographical coverage, cost effectiveness and space efficiency. They can flexibly meet the needs of changes in demography and demand in different land use. It can cover areas with lower travel demand.
A bus occupies twice the road space taken by a car but carries 40 times the number of passengers. It can displace anywhere between five and 50 other vehicles and allow enormous oil and pollution savings (IEA). Poor people are most dependent on affordable public transport to access jobs and services. Urban poor can use upto 25–30 per cent of their income on transportation. Buses minimize interchange and reduce cost of travel. Per person emissions are several time less than cars.
The World Bank’s Urban Transport Indicators database shows that the average number of bus seats per thousand urban residents of Latin America, Asia, the Middle East and Eastern Europe is around 30–40. In Africa, the average number is six bus seats per thousand residents.
Ther formal public bus transport system in Abuja needs improvement. A study31 in 2013 by researchers from Federal University of Technology Owerri, Imo State, Nigeria, examined the service efficiency, passenger’s perspectives and bus route deficiencies for two bus companies—Abuja Urban Mass Transport Company (AUMTCO) and Nationwide Unity Transport Company’s (NUTCO) in Abuja. On an average, six trips are operated per day. The efficiency is poor with passenger volume, vehicle kilometre and revenue generation. A large number of bus users have reported long waiting time for the buses. While 43 per cent of users have reported waiting of more than 15 minutes, 24 per cent have reported waiting time of 10–15 minutes, 19 per cent 5–10 minutes and 14 per cent about 5 minutes.
The study identified challenges of developing transit ways in major activity centres. These include absence of pedestrian walkways, widespread use of low-occupancy vehicles for public transport, city-wide traffic congestion, inefficiency of institutional mechanism for managing transport. The study recommends establishment of the Abuja Area Transportation Authority for sustainable transportation management.
Another study on the quality of transport services in Ibadan metropolis shows urban residents commute on foot to meet their travel demands. They are dissatisfied with the transport services. Household income is highly correlated with modal choice. Intra-transport services are poorly maintained. Transport services in Nigeria must be revitalized to improve accessibility.
31
TOWARDS CLEAN AIR IN NIGERIAN CITIES
Lagos Bus Rapid Transit
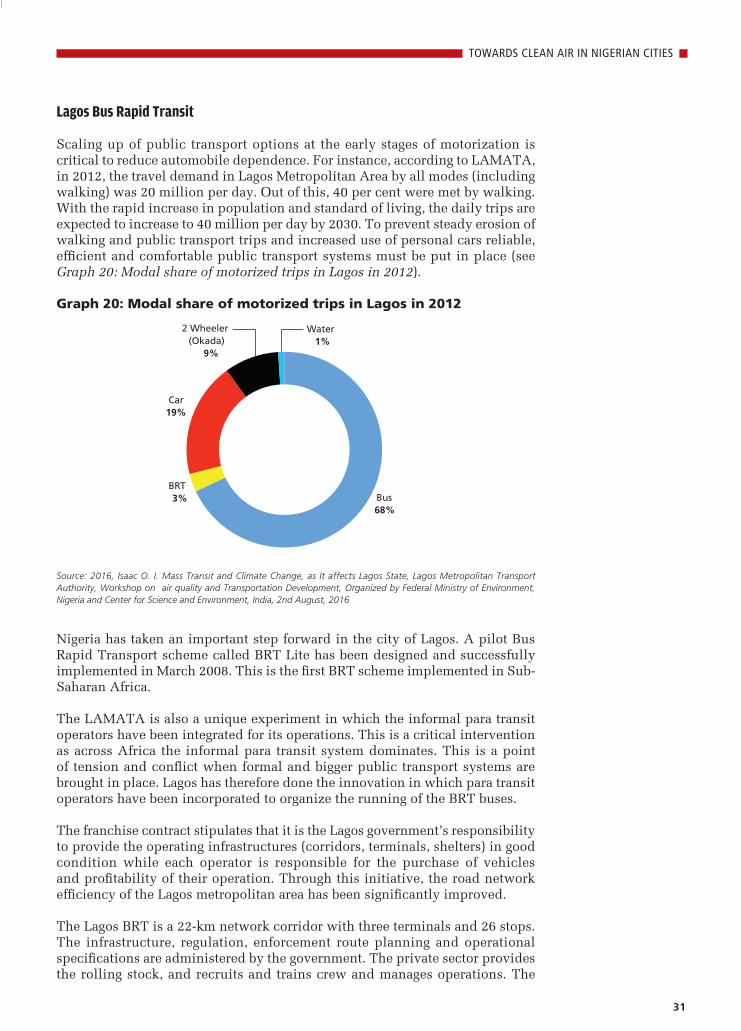
Scaling up of public transport options at the early stages of motorization is critical to reduce automobile dependence. For instance, according to LAMATA, in 2012, the travel demand in Lagos Metropolitan Area by all modes (including walking) was 20 million per day. Out of this, 40 per cent were met by walking. With the rapid increase in population and standard of living, the daily trips are expected to increase to 40 million per day by 2030. To prevent steady erosion of walking and public transport trips and increased use of personal cars reliable, efficient and comfortable public transport systems must be put in place (see Graph 20: Modal share of motorized trips in Lagos in 2012).
Graph 20: Modal share of motorized trips in Lagos in 2012
Source: 2016, Isaac O. I. Mass Transit and Climate Change, as It affects Lagos State, Lagos Metropolitan Transport Authority, Workshop on air quality and Transportation Development, Organized by Federal Ministry of Environment, Nigeria and Center for Science and Environment, India, 2nd August, 2016
Nigeria has taken an important step forward in the city of Lagos. A pilot Bus Rapid Transport scheme called BRT Lite has been designed and successfully implemented in March 2008. This is the first BRT scheme im plemented in Sub-Saharan Africa.
The LAMATA is also a unique experiment in which the informal para transit operators have been integrated for its operations. This is a critical intervention as across Africa the informal para transit system dominates. This is a point of tension and conflict when formal and bigger public transport systems are brought in place. Lagos has therefore done the innovation in which para transit operators have been incorporated to organize the running of the BRT buses.
The franchise contract stipulates that it is the Lagos government’s responsibility to provide the operating infrastructures (corridors, terminals, shelters) in good condition while each operator is responsible for the purchase of vehicles and profitability of their operation. Through this initiative, the road network efficiency of the Lagos metropolitan area has been significantly improved.
The Lagos BRT is a 22-km network corridor with three terminals and 26 stops. The infrastructure, regulation, enforcement route planning and operational specifications are administered by the government. The private sector provides the rolling stock, and recruits and trains crew and manages operations. The
Bus 68%
BRT 3%
Car 19%
2 Wheeler (Okada)
9%
Water 1%
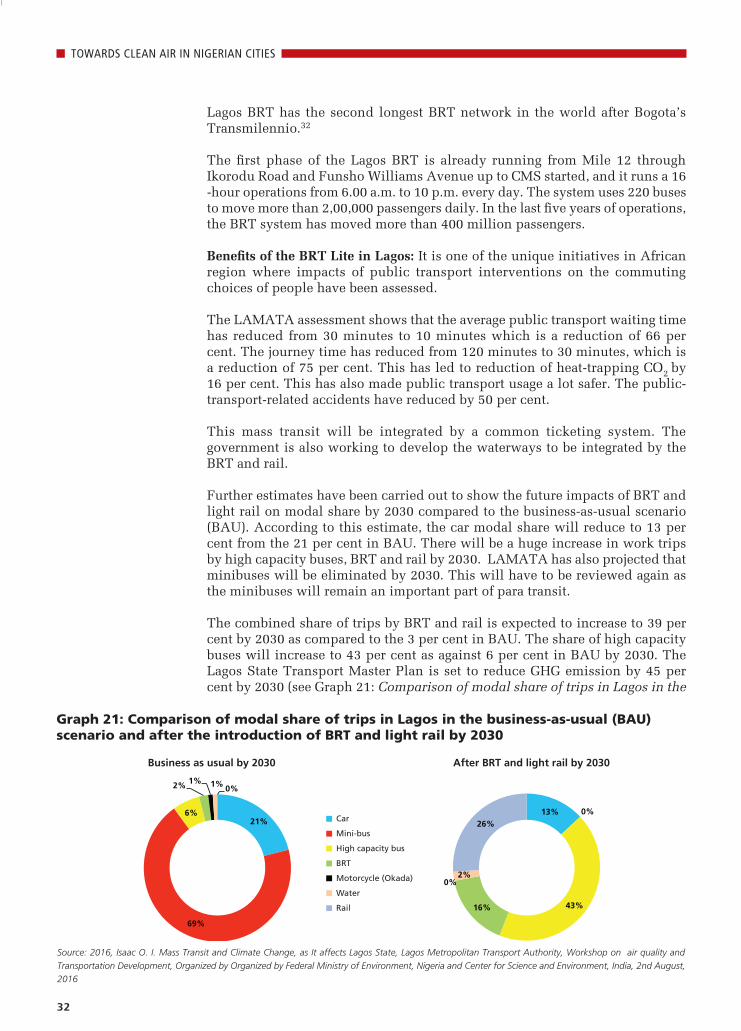
32
TOWARDS CLEAN AIR IN NIGERIAN CITIES
Lagos BRT has the second longest BRT network in the world after Bogota’s Transmilennio.32
The first phase of the Lagos BRT is already running from Mile 12 through Ikorodu Road and Funsho Williams Avenue up to CMS started, and it runs a 16 -hour operations from 6.00 a.m. to 10 p.m. every day. The system uses 220 buses to move more than 2,00,000 passengers daily. In the last five years of operations, the BRT system has moved more than 400 million passengers.
Benefits of the BRT Lite in Lagos: It is one of the unique initiatives in African region where impacts of public transport interventions on the commuting choices of people have been assessed.
The LAMATA assessment shows that the average public transport waiting time has reduced from 30 minutes to 10 minutes which is a reduction of 66 per cent. The journey time has reduced from 120 minutes to 30 minutes, which is a reduction of 75 per cent. This has led to reduction of heat-trapping CO2 by 16 per cent. This has also made public transport usage a lot safer. The public-transport-related accidents have reduced by 50 per cent.
This mass transit will be integrated by a common ticketing system. The government is also working to develop the waterways to be integrated by the BRT and rail.
Further estimates have been carried out to show the future impacts of BRT and light rail on modal share by 2030 compared to the business-as-usual scenario (BAU). According to this estimate, the car modal share will reduce to 13 per cent from the 21 per cent in BAU. There will be a huge increase in work trips by high capacity buses, BRT and rail by 2030. LAMATA has also projected that minibuses will be eliminated by 2030. This will have to be reviewed again as the minibuses will remain an important part of para transit.
The combined share of trips by BRT and rail is expected to increase to 39 per cent by 2030 as compared to the 3 per cent in BAU. The share of high capacity buses will increase to 43 per cent as against 6 per cent in BAU by 2030. The Lagos State Transport Master Plan is set to reduce GHG emission by 45 per cent by 2030 (see Graph 21: Comparison of modal share of trips in Lagos in the
Business as usual by 2030 After BRT and light rail by 2030
Source: 2016, Isaac O. I. Mass Transit and Climate Change, as It affects Lagos State, Lagos Metropolitan Transport Authority, Workshop on air quality and
Transportation Development, Organized by Organized by Federal Ministry of Environment, Nigeria and Center for Science and Environment, India, 2nd August,
2016
Graph 21: Comparison of modal share of trips in Lagos in the business-as-usual (BAU) scenario and after the introduction of BRT and light rail by 2030
Car
Mini-bus
High capacity bus
BRT
Motorcycle (Okada)
Water
Rail
13% 0%
43% 16%
0% 2%
26% 21%
69%
6%
2% 1% 1% 0%
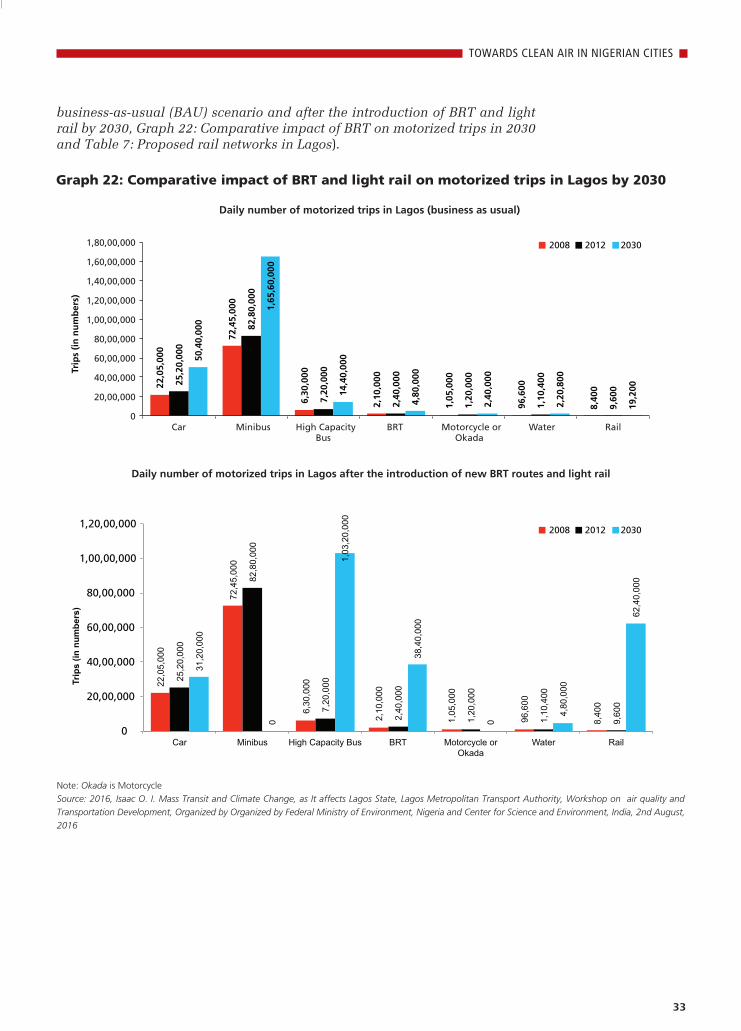
33
TOWARDS CLEAN AIR IN NIGERIAN CITIES
business-as-usual (BAU) scenario and after the introduction of BRT and light rail by 2030, Graph 22: Comparative impact of BRT on motorized trips in 2030 and Table 7: Proposed rail networks in Lagos).
Graph 22: Comparative impact of BRT and light rail on motorized trips in Lagos by 2030
Daily number of motorized trips in Lagos (business as usual)
Note: Okada is Motorcycle
Source: 2016, Isaac O. I. Mass Transit and Climate Change, as It affects Lagos State, Lagos Metropolitan Transport Authority, Workshop on air quality and
Transportation Development, Organized by Organized by Federal Ministry of Environment, Nigeria and Center for Science and Environment, India, 2nd August,
2016
22,0
5,00
0
72,4
5,00
0
6,30
,000
2,10
,000
1,05
,000
96,6
00
8,40
0
25,2
0,00
0
82,8
0,00
0
7,20
,000
2,40
,000
1,20
,000
1,10
,400
9,60
0
50,4
0,00
0
1,65
,60,
000
14,4
0,00
0
4,80
,000
2,40
,000
2,20
,800
19,2
00
0
20,00,000
40,00,000
60,00,000
80,00,000
1,00,00,000
1,20,00,000
1,40,00,000
1,60,00,000
1,80,00,000
Car Minibus High Capacity Bus
BRT Motorcycle or Okada
Water Rail
Trip
s (i
n n
um
ber
s)
2008 2012 2030
2008 2012 2030
22,0
5,00
0
72,4
5,00
0
6,30
,000
2,10
,000
1,05
,000
96,6
00
8,40
0
25,2
0,00
0
82,8
0,00
0
7,20
,000
2,40
,000
1,20
,000
1,10
,400
9,60
0
31,2
0,00
0
0
1,03
,20,
000
38,4
0,00
0
0
4,80
,000
62,4
0,00
0
0
20,00,000
40,00,000
60,00,000
80,00,000
1,00,00,000
1,20,00,000
Car Minibus High Capacity Bus BRT Motorcycle or Okada
Water Rail
Trip
s (in
num
bers
)
Daily number of motorized trips in Lagos after the introduction of new BRT routes and light rail
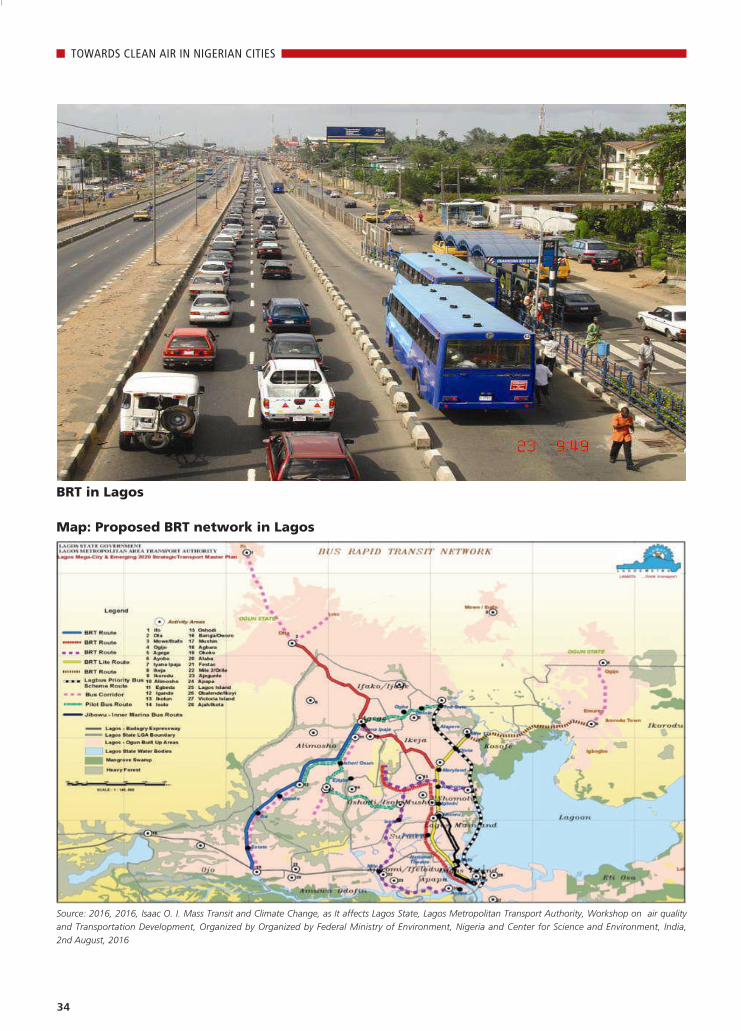
34
TOWARDS CLEAN AIR IN NIGERIAN CITIES
Source: 2016, 2016, Isaac O. I. Mass Transit and Climate Change, as It affects Lagos State, Lagos Metropolitan Transport Authority, Workshop on air quality
and Transportation Development, Organized by Organized by Federal Ministry of Environment, Nigeria and Center for Science and Environment, India,
2nd August, 2016
Map: Proposed BRT network in Lagos
BRT in Lagos
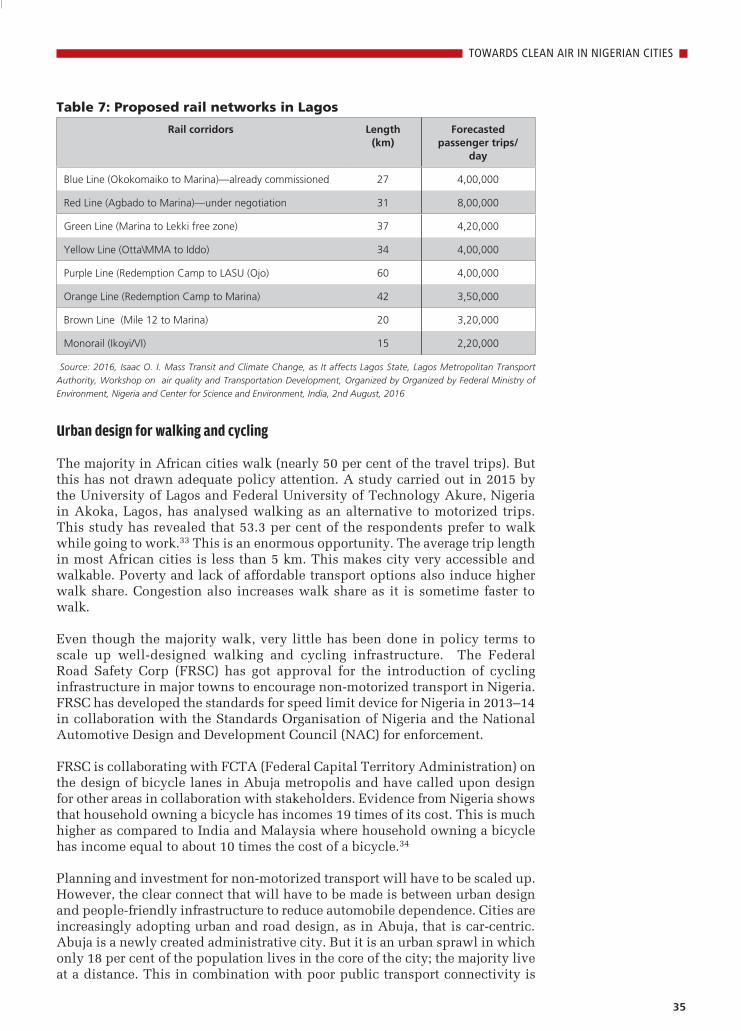
35
TOWARDS CLEAN AIR IN NIGERIAN CITIES
Table 7: Proposed rail networks in Lagos
Rail corridors Length (km)
Forecasted passenger trips/
day
Blue Line (Okokomaiko to Marina)—already commissioned 27 4,00,000
Red Line (Agbado to Marina)—under negotiation 31 8,00,000
Green Line (Marina to Lekki free zone) 37 4,20,000
Yellow Line (Otta\MMA to Iddo) 34 4,00,000
Purple Line (Redemption Camp to LASU (Ojo) 60 4,00,000
Orange Line (Redemption Camp to Marina) 42 3,50,000
Brown Line (Mile 12 to Marina) 20 3,20,000
Monorail (Ikoyi/VI) 15 2,20,000
Source: 2016, Isaac O. I. Mass Transit and Climate Change, as It affects Lagos State, Lagos Metropolitan Transport
Authority, Workshop on air quality and Transportation Development, Organized by Organized by Federal Ministry of
Environment, Nigeria and Center for Science and Environment, India, 2nd August, 2016
Urban design for walking and cycling
The majority in African cities walk (nearly 50 per cent of the travel trips). But this has not drawn adequate policy attention. A study carried out in 2015 by the University of Lagos and Federal University of Technology Akure, Nigeria in Akoka, Lagos, has analysed walking as an alternative to motorized trips. This study has revealed that 53.3 per cent of the respondents prefer to walk while going to work.33 This is an enormous opportunity. The average trip length in most African cities is less than 5 km. This makes city very accessible and walkable. Poverty and lack of affordable transport options also induce higher walk share. Congestion also increases walk share as it is sometime faster to walk.
Even though the majority walk, very little has been done in policy terms to scale up well-designed walking and cycling infrastructure. The Federal Road Safety Corp (FRSC) has got approval for the introduction of cycling infrastructure in major towns to encourage non-motorized transport in Nigeria. FRSC has developed the standards for speed limit device for Nigeria in 2013–14 in collaboration with the Standards Organisation of Nigeria and the National Automotive Design and Development Council (NAC) for enforcement.
FRSC is collaborating with FCTA (Federal Capital Territory Administration) on the design of bicycle lanes in Abuja metropolis and have called upon design for other areas in collaboration with stakeholders. Evidence from Nigeria shows that household owning a bicycle has incomes 19 times of its cost. This is much higher as compared to India and Malaysia where household owning a bicycle has income equal to about 10 times the cost of a bicycle.34
Planning and investment for non-motorized transport will have to be scaled up. However, the clear connect that will have to be made is between urban design and people-friendly infrastructure to reduce automobile dependence. Cities are increasingly adopting urban and road design, as in Abuja, that is car-centric. Abuja is a newly created administrative city. But it is an urban sprawl in which only 18 per cent of the population lives in the core of the city; the majority live at a distance. This in combination with poor public transport connectivity is
36
TOWARDS CLEAN AIR IN NIGERIAN CITIES
increasing dependence on personal vehicles. Wide roads are being designed with no at grade crossing facilities and with foot overbridges that discourage walking.
There are some lessons from India. Studies in India have shown that such urban planning and mass transport can push the poor out, disrupt livelihoods, and increase travel distances and costs. There is a lesson for all cities in developing regions. For instance, for the majority of the households in relocated slums in Delhi, cycling distance has increased from 3.27 km to 7.29 km. Bus distance has increased from from 4.7 km to 14.68 km. Journey time has increased. The average distance to services and number of trips have increased. As a result, non-motorized transport share has declined. In another Indian city, Ahmedabad, the share of transport cost in the household budget has increased significantly for the bottom 50 per cent of the population and that on education and health has stagnated. These larger issues of public good around the transportation issues need to be understood.
In developing country cities that are coming up with mass transit, systems are also framing transit-oriented development policies to enable more people to live close and access transit lines and reduce use of cars. For instance, to address this, Delhi has framed guidelines for transit-oriented development that mandates mixed land-use and mixed income development to bring jobs, housing, services and recreation close and reduce distances. The guidelines state that at least 30 per cent of the units should be residential and 20 per cent commercial and institutional, especially within 500 metres from the mass transit line. It also mandates mixed-income building typologies—low, middle and high incomes, shelterless and chronically poor, so that all sections of the population can live close to transit lines and the city core. This will also help to reduce sprawl.
Overall compact city design will have to be promoted. There is another example from India. The national Ministry of Urban Development has developed the National Habitat Standard Mission. These guidelines for compact mixed land use state that 95 per cent of residences should have daily needs retail, parks, primary schools and recreational areas accessible within 400 m walking distance. About 95 per cent of residences should have access to employment and public and institutional services by public transport or bicycle or walk or combination of two or more. At least 85 per cent of all streets need to have mixed-use development. It has asked for small block size with high density permeable streets among others.
It will be helpful if similar policies can be adopted at the early stages of urbanization and motorization in Nigeria to prevent lock-in of pollution in the infrastructure that cannot be undone easily.
Integrate all transport systemsAs different public transport systems have started to take shape in Lagos and other cities, immediate intervention is needed to integrate all systems—LRT, BRT, bus, minibuses, taxis and walkways. Well designed and safe pedestrian facilities need to be expanded to support public transport as all public transport trips begin and end as walk trips. The interchange points of LRT, BRT and bus stations need to be planned and executed carefully for easy transfers and access. There are already some discussions in Lagos on common ticketing. This should be taken forward.
37
TOWARDS CLEAN AIR IN NIGERIAN CITIES
It may be noted in India that Delhi has started to frame norms for multi-modal integration. The Delhi Development Authority has developed guidelines on the physical integration of mass rapid transit systems. For instance, bus stop and cycle rental should be within a 50-metre level walk from the mass transit station exit. Cycle and two-wheeler parking should be within the 100-metre level walk from station exit. The para-transit stand should be within the 150-metre level walk from station exit. A private car/taxi/auto rickshaw ‘drop off’ plan is needed. It requires barrier-free exiting of pedestrians and non-motorized transport. Pedestrian exits, bus-stops and cycle-rickshaw stands must be closest to main pedestrian exits from the station. Car parking, if provided, must be beyond a distance of 250 metre of the station or public transport interchange point. Pairing of origin-destination nodes should provide cycle/auto stands at nearby important destinations.
Such an approach is necessary to enable easy transfers between systems and make the city more accessible.
Current status of vehicle inspection in Nigeria
Robust vehicle inspection regime is necessary as most of the vehicles are old and polluting.
In Nigeria, vehicle inspection centres have been set up to monitor roadworthiness and emissions from in-use vehicles. The Nigerian government has made some regulations for the emission from vehicles, i.e. the National Environmental (Control of Vehicular Emissions from Petrol & Diesel Engines) Regulations, 2011. They have also set up the first computerized vehicle-testing centre known as Abuja Computerised Vehicle Testing Service.
The enforcement agencies are unable to fully implement and enforce some existing laws and regulations due to lack of adequate equipment to carry out required tests. Testing of speedometer checks, brake checks, emissions etc. is not adequate. Testing centres are few.
There are several emerging good practices in the African region. In Kenya and Ethiopia, annual vehicle inspection is mandatory. The vehicle roadworthiness test is being conducted with upgraded machines to measure exhaust emissions against the standard set by the Authority.
In Rwanda, the National Police and Rwanda Environment Management Authority has implemented vehicle emission testing programme. All vehicles have to undergo emissions inspection. Norms for roadworthiness and emissions have been adopted. Commercial vehicles undergo a test every six months. Private vehicles also have to get tested every year. Traffic police can ask for impromptu emission testing for any grossly polluting vehicle. If a vehicle fails it is impounded or pays high monetary penalty. Cross-learning from all these programmes are important for designing a robust system as all these markets have similar fleet and technology genre.
However, compliance and enforcement are serious challenges. Specific tools will have to be designed to ensure compliance. For instance, in India there is a proposal to link and mandate annual vehicle insurance with emission tests to ensure everyone complies with the rules. These programmes will have to be scaled up.
38
TOWARDS CLEAN AIR IN NIGERIAN CITIES
Given the fact that setting up of adequate numbers of vehicle testing centres is time- and resource-intensive, other supportive and low-cost compliance strategies can also be rolled out. These include on road smoky vehicle check in which visible inspection is carried out and smoky vehicles are penalized and sent for tests.
Vehicle taxation
The scale of transition that is needed to control pollution and congestion requires investment. A lot of the investment requirement can be met through innovative fiscal strategies. The polluter pays principle should be implemented. Motorists should pay the full external costs that include congestion, pollution, ill health and climate change. This can bring additional revenue to pay for alternatives like public transport, walking and cycling infrastructure.
It is ironic that in most developing countries, including India, buses are made to pay higher taxes than cars. This will have to be reversed. Currently, bus operations are treated as commercial operations and taxed high. But cars will have to be taxed higher than buses. In Delhi, for instance, cars pay a minuscule amount of one-time road tax when they are purchased. But buses are made to pay much higher taxes annually. This creates pressure to increase bus fares.
It seems that in Nigeria, the import tax burden on buses is lower than cars. Available information shows that cars have to pay a 35 per cent duty and also a 35 per cent levy while commercial vehicles have to pay a 35 per cent duty. A thorough review of the overall tax burden on buses and cars will have to be carried out. There should be a policy of cross-subsidization in which cars are taxed higher to offset the taxes to be waived off on buses. This is needed to keep bus fares affordable for the masses. Ethiopia has set a good example of lowering taxes on public transport and imposing higher taxes on personal vehicles. This is a good practice among cities in developing countries.
Moreover, cities will be well advised to develop dedicated urban transport funds through more innovative methods. Higher parking charges, higher taxes on car ownership etc. can bring more revenue that can be tapped to fund public transport improvement.
Car restraint measures: Parking as a TDM measure
Globally, the governments are adopting measures to restrain the use of cars to control pollution, congestion and oil guzzling. This is being done either through tax policies, road pricing or parking policy. First-generation restraint measures include parking policy as a demand-management tool to reduce demand for parking and the use of personal cars. This is easier to implement in developing cities.
Conventional parking policies in most of our cities have aimed at increasing parking provisions to meet the growing demand for parking by earmarking as much public land as possible, by constructing multi-level car parks and by mandating all buildings to provide minimum parking spaces. The underlying assumption has been that demand for parking will continue to grow with motorization and therefore the local governments should set aside adequate parking spaces to meet this demand. But this policy assumption is now under attack. Decades of experience across the world has shown that parking demand is insatiable that only locks up valuable urban land that has more important
39
TOWARDS CLEAN AIR IN NIGERIAN CITIES
usages. Moreover, uncontrolled parking supply incites more driving and more car ownership, and defeats the purpose of reducing automobile dependence, pollution and congestion. This has led to a serious policy rethink.
Parking policy can be redesigned in such a way that instead of encouraging unlimited parking supply and car usage it can be leveraged to restrain parking demand and thereby personal vehicle usage. But there is very little policy or public understanding of the key elements and principles of parking policy that can make it a tool for reducing parking demand and car usage to cut decongestion and pollution in cities.
Cheap and free parking is a subsidy to rich car owners and loss to the local government exchequer. The costs of using valuable urban land for parking of personal vehicles are not recovered through proper taxes and pricing. Parking rates even in expensive parking structures are minimal and are not adequate to recover the cost of investment. This is a subsidy. This subsidy amount will work out to be much larger if the rental or the land cost is taken into account. Increased investment in expensive and prime areas of the city further enhances this subsidy as the parking rates are not expected to recover this cost.
Parking policy implemented in Abuja in 2012: Abuja has taken the initiative to implement priced parking—which is the crucial step towards demand management. It is mandatory for all vehicle owners to pay a fee of Naira 50 for every 30 minutes between 7a.m. to 7 p.m. Beyond the stipulated time allotted on a purchased ticket, vehicles will be clamped and towed and forced to pay Naira 5000 into the account of the enforcement company at a commercial bank before the vehicle is released. This was challenged by a private savings and loan firm in the city. While the policy of priced parking is under pressure, Abuja has taken the progressive step to impose high penalty for violation in areas earmarked for no parking. This can attract high penalty of Naira 25,000.
Indian cities are also framing several strategies. These include variable and increased parking pricing, parking district management plan, no car without proof of parking barring parking on green areas etc.
It is important to carry this initiative forward in cities of Nigeria. This will require enforcement strategies for the legal parking areas. The management rules should be set, including signages and pricing metres for payments, use of smart cards, IT systems for information and enforcement, prevention of illegal parking that can compromise safety, having facilities to clamp or tow away vehicles, parking data collection and analysis for policy feedback and monitoring, street design and management of queues, street reconstruction services, and surveys on expected revenue.
Detailed parking pricing policy is needed. Variable parking rates according to peak and non-peak hours should be introduced. Prices should be variable by the hour so that it changes behaviour, prices should be higher for on-street parking and the most convenient place, charges for park and ride on light rail or BRT should be lower, charges for park and walk should be lower, and remote parking can be cheaper than parking in the heart of the city. Similarly, in residential areas, residential parking permit for use of public land for parking should be introduced. A monthly fee can be charged for this. This is also needed to control multiple car ownership. Ideally parking rates should be market-driven. Impose high penalty for illegal parking.
40
TOWARDS CLEAN AIR IN NIGERIAN CITIES
Global good practice: It may be noted that globally, parking policy has been adopted by several governments to control air pollution. For instance, Boston froze their parking requirements at a level that is only 10 per cent higher than the 1973 level to meet the federal clean air standards. New York has very high parking fees and limited parking supply that have lowered car ownership far below the average rates in other US cities. In Amsterdam parking fees have been expanded to meet EU directives regarding NO2 and PM 10 emissions. Car plate numbers are registered with emissions information. Trucks are allowed to unload for a maximum of 15 minutes in spots where they are not allowed to park. Zurich considers total NO2 emissions when determining the amount of parking to be allowed. Aizawl and Sikkim in India have made proof of parking mandatory for purchase of cars.
In fact, several governments carry out campaigns to build public support for parking restraints.
Downtown Pasadena in California Redevelopment has dedicated revenue from parking to area improvements. Each parking metre has a sticker saying, ‘Your Meter Money Will Make A Difference: Signage, Lighting, Benches, Paving’. Ventura Municipality in California has introduced a byelaw that states ‘All moneys collected from parking pay stations, and meters shall be placed in a special fund, devoted to purposes within the parking district’. This encouraged the residents to support. In the city of Regina, Canada, the parking awareness campaign linked parking management with public safety. This helped build public support for difficult action.
Need parking policy: Cities may adopt a comprehensive parking policy that will help to reduce traffic chaos as well as restrain car usage and congestion. The key elements of the parking policy should be as follow: • Adopt flexible parking standards and cap the maximum legal parking area
that can be provided. This will take into account improved public transport access and reduction in personal vehicle travel;
• Take the area approach towards parking management—off-street and on-street;
• Ensure stringent controls and enforcement; • Reform parking pricing for good management—minimize free parking,
restrict on-street parking, use variable parking rates, avoid fixed annual payment, price parity between surface and multi-level parking etc. Discard one-time parking charge;
• Integrate parking design with multi-modal integration; parking strategy is needed for buses, para-transit and freight;
• No parking should be allowed on green spaces, pavement, cycle lanes etc. • Need parking strategy for residential areas and mixed land-use areas.
Promote priced, shared, common parking; • Use parking revenue for local area development, public transport; • Impose stringent penalty on parking violations; • Develop parking strategy for special localities like hospitals, railway
stations, cinemas, shopping malls, schools and high impact events
41
TOWARDS CLEAN AIR IN NIGERIAN CITIES
Controlling pollution from other sources
There are several other sources of air pollution in a city that need to be controlled to meet clean air goals and reduce exposure to toxic pollutants to protect public health. Air quality assessment and inventory can help identify the key sources to enable framing of a clean-air action plan. Sources of pollutants include power plants, industries, diesel generator sets, open burning, construction dust and use of solid fuels for household cooking. All these sources will require in-depth investigation. There is very little local data available on these sources in Nigeria. However, based on the limited information that is available it is possible to outline some critical intervention points for the way forward.
Open burning of waste
The open burning of municipal waste as well as horticultural waste leads to emission of toxic gases and compounds. This is also widespread. Normally these include open burning of trash in municipal dump yards by urban local bodies and small fires that are lit by local residents. In many cities landfill for waste dump is emerging as the standards practice that is adding enormously to the problem. Due to poor waste disposal systems, waste is often burnt for easy disposal.
The magnitude of this problem has not been assessed well in Nigeria. A study35 carried out in 2014 by the Department of Environmental Science, Federal University of Petroleum Resources, Effurun, Nigeria assessed the atmospheric impact of the waste burning at five municipal solid waste dump sites where fire incidences are frequent in the delta region of Nigeria. Eight air quality parameters were monitored, such as particulate matter (SPM10), nitrogen dioxide (NO2), carbon dioxide (CO2), carbon monoxide (CO), sulphur dioxide (SO2), methane (CH4), ammonia (NH3) and hydrogen sulphide (H2S), using a series of hand-held air-quality monitoring equipment.
The results of the study indicated that the levels of suspended particulate matter (SPM) ranged between 773 and 801 microgramme per cum and the levels of CO ranged between 133.7 and 141.6 ppm. The levels of CO2 ranged between 401 ppm and 404.5 ppm while that of NO2 ranged between 21.0 ppm and 27.3 ppm. The levels of SO2 ranged between 27.7 ppm and 37.1 ppm while that of NH3 ranged from 14.7 to 19.5 ppm. The levels of methane ranged between 2310 ppm and 2771 ppm. Levels of SPM, CO, CO2 and CH4 within the vicinity of the dumpsite fires were above regulatory limits. This clearly brings out the severe impacts of waste burning on air pollution.
Strategies to control emissions from waste burningThe ultimate solution to this problem can come from a robust and comprehensive waste disposal, recycling and reuse policy in cities. • Open burning within the city limits should be banned. Fires should be
permitted only for legitimate reasons after scrutiny of the need for the same;• Clear composting rules and decentralized strategies for organic waste are
needed. Composting of organic waste should be promoted as a disposal mechanism instead of incineration;
• Segregation of waste should be mandated at the source, during transport and for final disposal.
• Universal coverage of an efficient waste collection and disposal mechanism should be ideally delegated to the local neighbourhood level. Timely and regular collection of waste will also mitigate health and sanitation issues
42
TOWARDS CLEAN AIR IN NIGERIAN CITIES
that are common in many urban areas;• Informal mechanism of waste collection, recycling and re-use which
already exist should be leveraged;• Meetings of departments dealing with horticulture and sanitation at the
regional level should be held regularly to prepare strategies to stop open burning of both horticultural and municipal waste;
• Steps should be taken to increase public awareness on the effects of burning trash and its consequences on public health. Awareness campaigns should be built through residential societies, ecology and environment clubs and urban local bodies;
• Availability of cleaner fuels, such as LPG or PNG, for domestic and commercial use should be addressed. Transition from highly polluting biomass burning for cooking should beb facilitated.
Pollution from construction and demolition waste
With rapid urbanization and real estate construction boom, all developing country cities are facing high dust pollution from construction. Construction and demolition (C&D) waste is a complex waste stream, made up of a wide variety of materials in the form of building debris, rubble, earth, concrete, steel, timber, and mixed site clearance materials arising from various construction activities, including land excavation or formation, civil and building construction, site clearance, demolition activities, roadwork and building renovation.
However, material waste has been recognized as a major problem in the construction industry that has important implications both for the efficiency of the industry and for the environmental impact of construction projects. Most construction wastes that were previously regarded as inert have been found to generate harmful leachates which have negative effects on the environment. As such, it is absolutely imperative for the construction industry to adopt ecologically sound planning and construction practices for the purpose of creating a healthy and sustainable built environment.
Though comprehensive assessment of C&D waste has not been carried out in Nigeria, there are sporadic studies available that provide important evidence. A study36 carried out in 2005 by the University of Ado-Ekiti, Nigeria and University of Ibadan, Nigeria in south-western Nigeria revealed that material wastage brings about additional cost to the construction project as well as a reduction in the profit of the contractor, considering the cost of storing and transporting construction waste along with the loss of revenue from not reclaiming waste. Also, most waste that occurs at construction sites is because of poor management and lack of awareness of effective waste management. The study finally recommends that recycling and reuse of construction waste is a viable option in construction waste management and that material wastage can be reduced by giving incentives for better handling of materials and by having trained personnel supervise the works.
Strategies for controlling construction and demolition waste and road dust• Dust-control regulations and techniques for construction industry, roads
and vehicular traffic should be formally adopted;• Special procedure should be developed and implemented for demolition
activities; dismantling should be preferred over demolition.• Water sprinkling and other dust-suppressing techniques to stabilize surfaces
and loose soil should be used during and after construction activities.
43
TOWARDS CLEAN AIR IN NIGERIAN CITIES
Greening of such surfaces should be undertaken as long-term measure;• Tighter dust control measures should beo be adopted for ready-mix concrete
batching;• It should be obligatory for the real-estate industry to provide evidence
of proper covered storage and disposal of debris from construction and demolition activities on site and ultimately at designated disposal sites;
• Building material and debris should be transported via covered vehicles to avoid fugitive dust emissions. Additionally, all building materials and debris that have soil or dust component should be adequately watered to cut dust while transportation;
• On-site recycling of C&D waste for large building and infrastructure projects should be promoted;
• C&D waste should be disposed of at proper disposal sites and recycling facilities should be decentralized for small projects;
• Measures are also needed to control road dust. Proper procedure for road digging and filling should be developed and implemented. Street-design guidelines for streets, including footpaths and cycle tracks with adequate vegetative barriers should be developed and implemented. Vehicular speed should be limited to reduce dust on all roads.
Emissions from generator sets for captive power generation
Power deficit is a serious problem in developing countries, where energy access is limited. It is increasing captive power generation based on diesel-powered generator sets. Though the ultimate solution will come from improved access to electricity, some intermediate solutions can also be looked at to reduce exposure.
The available evidence in Nigeria shows that there is inadequate electric power supply to households, businesses and industries. The result is that many households, businesses and even industries operate small, medium and large capacity fossil-fuel electric power generators for electric power supply whose exhaust is a source of air pollution that releases poisonous carbon monoxide. A study conducted in 2013 by Hassan Usman Katsina Polytechnic, Nigeria showed that small household generators in Nigeria operated on an average for six hours daily and the average distance of generators away from buildings was 5.6 metres. Moreover, poor ventilation negatively influences the quality of indoor air in the households.37
In India, regulatory steps have been taken to set emission standards for diesel generator sets. These are equivalent to Euro Stage IIIA for all size classes in Europe until 2010. Europe has further tightened the standards since then for all size classes and enforced Stage IV in Europe in 2015.
These units will also require energy efficiency standards. Average energy efficiency levels of diesel generator sets in India, for instance, fall short of the global benchmark. It is a percentage difference of about 7–8 per cent. India’s Bureau of Energy Efficiency has proposed energy efficiency standards and a labelling programme for generator sets. This will have to be supported by the enforcement mechanism and energy audits to improve operation and maintenance.
Strategies for emissions from domestic gensets• The mandatory diesel genset norms for acoustic enclosures and stack height
need to be monitored closely;
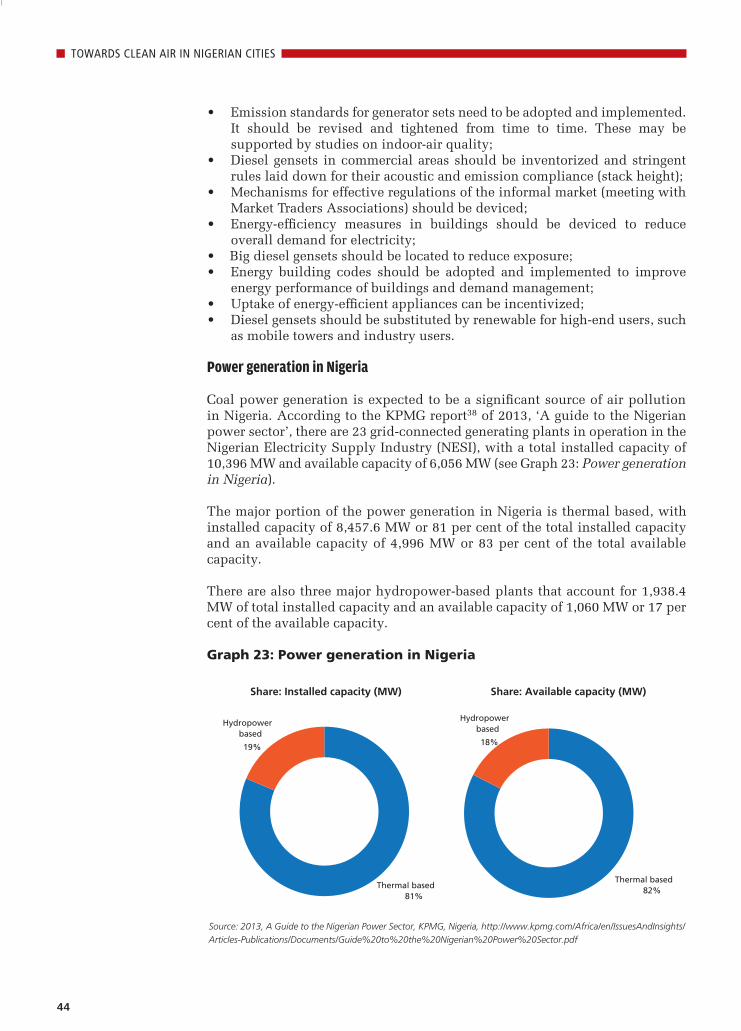
44
TOWARDS CLEAN AIR IN NIGERIAN CITIES
• Emission standards for generator sets need to be adopted and implemented. It should be revised and tightened from time to time. These may be supported by studies on indoor-air quality;
• Diesel gensets in commercial areas should be inventorized and stringent rules laid down for their acoustic and emission compliance (stack height);
• Mechanisms for effective regulations of the informal market (meeting with Market Traders Associations) should be deviced;
• Energy-efficiency measures in buildings should be deviced to reduce overall demand for electricity;
• Big diesel gensets should be located to reduce exposure;• Energy building codes should be adopted and implemented to improve
energy performance of buildings and demand management; • Uptake of energy-efficient appliances can be incentivized;• Diesel gensets should be substituted by renewable for high-end users, such
as mobile towers and industry users.
Power generation in Nigeria
Coal power generation is expected to be a significant source of air pollution in Nigeria. According to the KPMG report38 of 2013, ‘A guide to the Nigerian power sector’, there are 23 grid-connected generating plants in operation in the Nigerian Electricity Supply Industry (NESI), with a total installed capacity of 10,396 MW and available capacity of 6,056 MW (see Graph 23: Power generation in Nigeria).
The major portion of the power generation in Nigeria is thermal based, with installed capacity of 8,457.6 MW or 81 per cent of the total installed capacity and an available capacity of 4,996 MW or 83 per cent of the total available capacity.
There are also three major hydropower-based plants that account for 1,938.4 MW of total installed capacity and an available capacity of 1,060 MW or 17 per cent of the available capacity.
Graph 23: Power generation in Nigeria
Thermal based 81%
Thermal based 82%
Hydropower based
18%
Hydropower based
19%
Share: Installed capacity (MW) Share: Available capacity (MW)
Source: 2013, A Guide to the Nigerian Power Sector, KPMG, Nigeria, http://www.kpmg.com/Africa/en/IssuesAndInsights/
Articles-Publications/Documents/Guide%20to%20the%20Nigerian%20Power%20Sector.pdf
45
TOWARDS CLEAN AIR IN NIGERIAN CITIES
This sector will require deep investigation to assess both the local and trans-boundary effect of pollution. There is no information available on the age and genre of technology and the level of emission-control systems in the power plants. • Review the current standards for power plants and frame a time-bound
roadmap to introduce tighter emissions standards for the key pollutants;• Review the global best practices in emissions standards and technology for
power plants and adapt it to the roadmap of Nigeria.
Next stepsDevelop a detailed guidance framework for National Air Quality management Policy based on multi- stakeholder consultation, technical assessment and sharing of global best practices. This will enable further framing of pollution source-wise action plan to help cities meet the clean air standards.
46
TOWARDS CLEAN AIR IN NIGERIAN CITIES
References
1 World Health Organization 2016, Global Urban Ambient Air Pollution Database 2016, http://www.who.int/phe/health_topics/outdoorair/databases/cities/en/ as accessed on 13 June 2016
2 World Health Organization 2016, Global Urban Ambient Air Pollution Database 2016, http://www.who.int/phe/health_topics/outdoorair/databases/cities/en/ as accessed on 13 June 2016
3 Eugene O. Itua, Vehicular emission monitoring study in Lagos, Nigeria
4 E.A. Marais, D.J. Jacob, K. Wecht, C. Lerot , L. Zhang , K. Yu, T.P. Kurosu , K. Chance, B. Sauvage 2014, Anthropogenic emissions in Nigeria and implications for atmospheric ozone pollution: A view from space, Atmospheric Environment, http://acmg.seas.harvard.edu/publications/2014/MaraisAE2014.pdf as accessed on 13 June 2016
5 E.A. Marais, D.J. Jacob, K. Wecht, C. Lerot , L. Zhang , K. Yu, T.P. Kurosu , K. Chance, B. Sauvage 2014, Anthropogenic emissions in Nigeria and implications for atmospheric ozone pollution: A view from space, Atmospheric Environment, http://acmg.seas.harvard.edu/publications/2014/MaraisAE2014.pdf as accessed on 13 June 2016
6 Ngele S.O. and Onwu F.K. 2015, Measurements of Ambient Air Fine and Coarse Particulate Matter in ten South-East Nigerian cities, Research Journal of Chemical Sciences Vol. 5(1), 71-77 http://www.isca.in/rjcs/Archives/v5/i1/12.ISCA-RJCS-2015-004.pdf as accessed on 13 June 2016
7 United Nations Environment Programme 2015, Low-Cost Device Can Revolutionize Air Quality Monitoring and Help Countries Prevent Deaths from Outdoor Pollution, http://www.unep.org/newscentre/Default.aspx?DocumentID=26840&ArticleID=35403 as accessed on 13 June 2016
8 Anon 2014, Burden of disease from the joint effects of Household and Ambient Air Pollution for 2012, WHO, Geneva, Switzerland, http://www.who.int/phe/health_topics/outdoorair/databases/AP_jointeffect_BoD_results_March2014.pdf?ua=1 as accessed on 14 June 2016
9 A.O. Olowoporoku, J. W. S. Longhurst, J. H. Barnes & C. A. Edokpayi 2011, Towards a new framework for air quality management in Nigeria, WIT Transactions on Ecology and the Environment Vol. 147 http://www.witpress.com/Secure/elibrary/papers/AIR11/AIR11001FU1.pdf as accessed on 15 June 2016
10 Anon. 2016, The Little Green Data Book, The World Bank, Washington D.C., USA http://data.worldbank.org/sites/default/files/ldb-green-2016-with-cover.pdf as accessed on 14 June 2016
11 F.I. Abam, G. O. Unachukwu 2009, Vehicular Emissions and Air Quality Standards in Nigeria, European Journal of Scientific Research, Vol.34 No.4 (2009), pp.550-560, https://www.researchgate.net/publication/275335697_Vehicular_Emissions_and_Air_Quality_Standards_in_Nigeria as accessed on 16 June 2016
12 Nwachukwu A.N., Chukwuocha E. O. and Igbudu O. 2012, A survey on the effects of air pollution on diseases of the people of Rivers State, Nigeria, African Journal of Environmental Science and Technology Vol. 6(10), pp. 371-379, http://www.ajol.info/index.php/ajest/article/viewFile/88650/78242 as accessed on 16 June 2016
13 Dotun Olowoporoku 2011, How Clean Is The Air Nigerians Breathe?‐ A Case For National Air Quality Management Framework, Nigeria World, http://nigeriaworld.com/articles/2011/feb/012.html as accessed on 13 June 2016
14 F.I. Abam, G. O. Unachukwu 2009, Vehicular Emissions and Air Quality Standards in Nigeria, European Journal of Scientific Research, Vol.34 No.4 (2009), pp.550-560, https://www.researchgate.net/publication/275335697_Vehicular_Emissions_and_Air_Quality_Standards_in_Nigeria as accessed on 16 June 2016
15 Batatunde Bakare 2016, Alternative Fuels: Compressed Natural Gas, UNEP
16 Anon. 2015, The African & Nigerian Automotive Industry-Market Report 2015, XCom Africa
47
TOWARDS CLEAN AIR IN NIGERIAN CITIES
17 Henry Kamau, 2016, Trade in second hand vehicles, Sustainable Transport Africa, presented in UNEP Vehicles and Fuels Partnership 11th Global Partner Meeting in London, June 2016
18 Anon. 2015, Compilation of Foreign Motor Vehicle Import Requirements, International Trade Administration, United States Department of Commerce
19 Anon. 2015, Compilation of Foreign Motor Vehicle Import Requirements, International Trade Administration, United States Department of Commerce
20 A.B. Ajayi , O. O. Dosunmu 2002, Environmental hazards of importing used vehicles into Nigeria, Proceedings of International Symposium on Environmental Pollution Control and Waste Management 7-10 January 2002, Tunis (EPCOWM’2002), p.521-532
21 Anon 2014, Third Edition-Automotive Resource Guide: A reference for US exporters, U.S. Department of Commerce,
22 WHO 2016, Global Health Data Repository, http://apps.who.int/gho/data/node.main.A995 as accessed on 20 June 2016
23 WHO 2016, Global Health Data Repository, http://apps.who.int/gho/data/node.main.A995 as accessed on 20 June 2016
24 Wellington Didibhuku Thwala, Stephen Enyinnaya Eluwa, Musibau Akintunde Ajagbe, Kayode Ayobami Ojo, Edward Eric Duncan, Yusuf Olanrewaju Gafar, Arham Abdullah 2012, Traffic Congestion, Causes and Effect on Residents of Urban Cities in Nigeria, The Asian Conference on the Social Sciences 2012 Official Conference Proceedings, Osaka, Japan http://iafor.org/archives/offprints/acss2012-offprints/ACSS2012_0377.pdf as accessed on 23 June 2016
25 Annual Report 2013, Federal Road Safety Corps, http://frsc.gov.ng/2013%20FRSC%20Annual%20Report.pdf as accessed on 28 June 2016
26 Aworemi, J., Salami, A., Adewoye, J. and Ilori, M. 2008, Impact of socio-economic characteristics on formal and informal public transport demands in Kwara state, Nigeria, African Journal of Business Management Vol.2 (4), pp. 072-076,
http://www.academicjournals.org/journal/AJBM/article-full-text-pdf/4EB098616833 as accessed on 29 June 2016
27 Anon 2008, Overview of public transport in Sub-Saharan Africa, UITP - International Association of Public Transport, Brussels, Belgium, http://www.uitp.org/sites/default/files/cck-focus-papers-files/Transafrica_UITP_UATP_PublicTransport_in_SubSaharan_Africa_2008.pdf as accessed on 30 June 2016
28 Anon 2008, Overview of public transport in Sub-Saharan Africa, UITP - International Association of Public Transport, Brussels, Belgium, http://www.uitp.org/sites/default/files/cck-focus-papers-files/Transafrica_UITP_UATP_PublicTransport_in_SubSaharan_Africa_2008.pdf as accessed on 30 June 2016
29 Olomola, A. S. (2003), Understanding Poverty in Nigeria: Highlights from NISER Review of Nigerian Development, The Magazine of the Nigerian Institute of Social and Economic Research, Nos. 4 & 5, December, 2003, Ibadan
30 Sekibo, Abiye (2005), Reform of Transport Sector In Nigeria,. Cited in Social actor 1, Transportation systems in Nigeria: problems and prospects http://wwwjimoh4bunuland.blogspot.com.ng/2009/03/transpotation-systems-in-nigeria.html
31 Nwaogbe Obioma 2013, The quality of mass transit service in Abuja, Nigeria: An analysis of customers opinions in International Journal of Scientific and Technology Research, Vol 2, No 12, December
32 Tayo Orekoya 2010, The Bus Rapid Transit System of Lagos, Nigeria, United Nations Forum on Climate Change Mitigation,, Fuel Efficiency & Sustainable Urban Transport, Seoul, Korea
33 Yussuf Lukeman , Gbadamosi, T.K and Omole, F.K 2015, Analysis of walking and trekking as an alternative to motorised trip in Akoka, Lagos Nigeria, International Journal of Education and Research Vol. 3 No. 1 January 2015, http://www.ijern.com/journal/2015/January-2015/21.pdf as accessed on 23 June 2016
48
TOWARDS CLEAN AIR IN NIGERIAN CITIES
34 Paul Guitink, Susanne Holste, Jerry Lebo 1994, Non-Motorized Transport: Confronting Poverty Through Affordable Mobility, Transportation, Water And Urban Development Department, The World Bank, Washington D.C. United States, http://siteresources.worldbank.org/INTURBANTRANSPORT/Resources/T-UT-4.pdf as accessed on 28 June 2016
35 Akpofure Rim-Rukeh 2014, An Assessment of the Contribution of Municipal Solid Waste Dump Sites Fire to Atmospheric Pollution, Open Journal of Air Pollution, 2014, 3, 53-60, Scientific Research, http://file.scirp.org/pdf/OJAP_2014090916213779.pdf as accessed on 19 July 2016
36 O.O. Akinkurolere, S.O. Franklin 2005, Investigation into Waste Management on Construction Sites in South Western Nigeria, American Journal of Applied Sciences 2 (5): 980-984, http://thescipub.com/PDF/ajassp.2005.980.984.pdf as accessed on 19 July 2016
37 Suleiman Iguda Ladan 2013, Examining Air Pollution and Control Measures in Urban Centers of Nigeria, International Journal of Environmental Engineering and Management. ISSN 2231-1319, Volume 4, Number 6 (2013), pp. 621-628, http://www.ripublication.com/ijeem_spl/ijeemv4n6_16.pdf as accessed on 19 July 2016
38 Anon 2013, A Guide to the Nigerian Power Sector, KPMG, Nigeria, http://www.kpmg.com/Africa/en/IssuesAndInsights/Articles-Publications/Documents/Guide%20to%20the%20Nigerian%20Power%20Sector.pdf as accessed on 19 July 2016
49
TOWARDS CLEAN AIR IN NIGERIAN CITIES
Notes
50
TOWARDS CLEAN AIR IN NIGERIAN CITIES


52
Centre for Science and Environment41, Tughlakabad Institutional Area, New Delhi 110 062Phones: 91-11-40616000 Fax: 91-11-29955879 E-mail: [email protected] Website: www.cseindia.org