Embed Size (px)
Citation preview
Draft, published inLeduc, T., Chaillou, F., and Ouard, T. (2011). Towards a ”typification” of the pedestrian surrounding space: analysis of the isovist
using digital signal processing method. In Stan Geertman, Wolfgang Reinhardt, and Fred Toppen, editors, Advancing GeoinformationScience for a Changing World (associated to the 14th AGILE International Conference on Geographic Information Science, Utrecht,
The Netherlands - AGILE’2011), Lecture notes in Geoinformation and Cartography (LNG&C), pages 275-292. Springer-Verlag, BerlinHeidelberg, 2011.
Towards a “typification” of the pedestrian surrounding space: analysis of the isovist using digital signal processing method
Thomas Leduc, Françoise Chaillou, Thomas Ouard
CERMA laboratory UMR CNRS 1563, 6 quai François Mitterrand, BP 16202, 44262 Nantes cedex 2, France - {thomas.leduc, francoise.chaillou, thomas.ouard}@cerma.archi.fr
Abstract
The aim of this paper is to couple the isovists field (a useful tool to determine the surroundings) with a classical digital signal processing method so as to classify the open spaces all along a pedestrian pathway and identify some urban patterns. Indeed, it could be of a great interest to determine automatically the type of surrounding spaces to improve the knowledge of the urban fabric at an intermediate level (the one of someone immersed in the city) and to make it possible to enrich its visual perception in real time using dedicated numerical devices. After a brief overview of visibility analysis methods, we focus on the isovist one. The remainder of this paper is dedicated to the methodology of visualscape fingerprint characterization we developed. At last, before concluding, we present a use case based on a real pathway.
1 Introduction
(Morello and Ratti, 2009) notices that there were “many attempts to translate visual-perception research into architectural and urban design.
Draft, published inLeduc, T., Chaillou, F., and Ouard, T. (2011). Towards a ”typification” of the pedestrian surrounding space: analysis of the isovist
using digital signal processing method. In Stan Geertman, Wolfgang Reinhardt, and Fred Toppen, editors, Advancing GeoinformationScience for a Changing World (associated to the 14th AGILE International Conference on Geographic Information Science, Utrecht,
The Netherlands - AGILE’2011), Lecture notes in Geoinformation and Cartography (LNG&C), pages 275-292. Springer-Verlag, BerlinHeidelberg, 2011.
The best known contribution in urban-planning studies is perhaps (Lynch, 1960)”. In his book, Lynch asserts “We are continuously engaged in the attempt to organize our surroundings, to structure and identify them […] it should be possible to give [cities] a form which facilitates these organizing efforts rather than frustrates them”. As explained by (Morello and Ratti, 2009), city mental maps can help to describe a sort of image of the city but also to evaluate the ‘legibility’ of a built context. Based on this concept of legibility, (Lynch, 1960) introduces the derived notion of “imageability” which is a kind of indicator of the evocation power of an environment.
These two key concepts have been enriched by a third one introduced by the Space Syntax theory. Indeed, (Hillier, 1996) defines the notion of intelligibility as “the degree to which what we can see from the spaces that make up the system – that is how many other spaces are connected to it – is a good guide to what we cannot see, that is the integration of each space into the system as a whole”.
(Benedikt, 2008) reminds us that "Walls and ceilings, buildings and trees, are positioned in such a way as to modulate experience: not just the experience of those very walls and ceilings (and buildings and trees), but the experience of the people and signs, images and machines, and so on, that move about and populate the room or cityscape". To this end, the "theory of isovists" was developed (Benedikt, 1979).
In (Franz and Wiener, 2008), several isovists measures have been translated into basic spatial qualities hypotheses. (Meilinger et al., 2009) addresses the interactions between partial isovists fields and human wayfinding performance. In (Leduc et al., 2009), partial isovists fields have been used to exhibit the fact that it is worth taking strategic visual properties into account in the design of a patrimonial tour in a historic city center. (Weitkamp, 2010) uses isovist to establish the relationship between landscape openness and wellbeing.
These four last bibliographic references, demonstrate, if necessary, the fact that a spatial concept such as the isovist is still relevant today to analyze the plenum conception (Coucleclis, 1992) of urban spaces. However, even if this useful tool to model pedestrian perception has already been studied and used, it appears clearly that it has not yet been coupled with a commonly used tool of the signal theory: the frequency analysis. Because perception of visual dynamics involved in motion perspective clearly implies a great set of mental images of the cities, it seems logical to process corresponding digital images of the city as classical digital signals that are often analyzed or modelled in terms of their frequency spectrum.
Draft, published inLeduc, T., Chaillou, F., and Ouard, T. (2011). Towards a ”typification” of the pedestrian surrounding space: analysis of the isovist
using digital signal processing method. In Stan Geertman, Wolfgang Reinhardt, and Fred Toppen, editors, Advancing GeoinformationScience for a Changing World (associated to the 14th AGILE International Conference on Geographic Information Science, Utrecht,
The Netherlands - AGILE’2011), Lecture notes in Geoinformation and Cartography (LNG&C), pages 275-292. Springer-Verlag, BerlinHeidelberg, 2011.
Such a digital process will help, as an example, to determine the type of surrounding space… much more accurately than with traditional isovist's shape indicators. That is to say, it is a helpful tool to improve the knowledge of the urban fabric at an intermediate scale (the one of someone immersed in a city). Such knowledge could, as an example, be useful to enrich the visual perception of a pedestrian in real time (using a dedicated numerical device with augmented reality capability).
The aim of this paper is to present a new relevant isovist's shape indicator. The one presented here is based on the analysis of the complex module of the discrete Fourier transform of the isovist.
2 Overview of isovists’ based methods to analyze open spaces morphology
2.1 Brief overview of visibility analysis
In the 1970s, two main approaches emerge in the visibility analysis context: the concept of viewshed in terrain and landscape analysis and the concept of isovist in architecture and urban space.
The viewshed analysis is a traditional way of analyzing a visibility field. It is defined as the part of terrain visible from a viewpoint, and is basically applied to the landscape with terrain and topographic differentiation (Lynch, 1976). As noticed in (Yang, 2007), viewshed analysis in GIS is rarely applied to urban settings because the operation is based on raster data or TIN (triangular irregular network) data structure, which have problems of accuracy in representing complex geometry of urban form.
An isovist is the set of all points in an environment of opaque surfaces that are visible from a given point (the limit of the isovist is an artificial one functioning something like a horizon in the absence of any other intervening surfaces). This 2D bounded polygon is a useful tool to define the open space concept. From a morphological point of view, open spaces are usually defined as the empty space, the void, between the surrounding buildings. However, although these open spaces are not material components of the physical world, they can be conceived as part and parcel of our urban heritage (Teller, 2003). (Batty, 2001) puts the emphasis on the fundamental motivations of conducting visibility analysis research. He noticed that the key questions "how far can we see", "how much can

Draft, published inLeduc, T., Chaillou, F., and Ouard, T. (2011). Towards a ”typification” of the pedestrian surrounding space: analysis of the isovist
using digital signal processing method. In Stan Geertman, Wolfgang Reinhardt, and Fred Toppen, editors, Advancing GeoinformationScience for a Changing World (associated to the 14th AGILE International Conference on Geographic Information Science, Utrecht,
The Netherlands - AGILE’2011), Lecture notes in Geoinformation and Cartography (LNG&C), pages 275-292. Springer-Verlag, BerlinHeidelberg, 2011.
we see", and "how much space is enclosed" are relevant to develop good urban design.
Essentially, isovists describe local geometrical properties of spaces with respect to individual observation points and weight all the possible view directions equally (see Fig. 1). An isovist is a 2D horizontal slice of pedestrian's surrounding space.
Fig. 1. Isovist symbolic representation (Conroy, 2001). The observer is comparable to a visual sensor. Corresponding isovist is the set of all points visible from his given punctual position taking surrounding occluding surfaces into account.
2.2 Analyze the visual dynamics of the pedestrian mobility in the urban fabric: mainly scalar indicators
As written in (Davis and Benedikt, 1979; Benedikt, 2008), every point in an environment generally has a uniquely shaped isovist belonging to it. (Benedikt, 2008) defines five useful measures: the area of the isovist (A), the perimeter of the isovist (P), a measure of the length of the radial (Q), a statistical measure of the variability of the boundary's distance from viewpoint (M2), and a measure of the asymmetry of M2 (M3). He noticed that our impression of spaciousness is evoked by high A, low P, low Q, and high M3 (M2 seemed to make little difference). City spaces and parts
Draft, published inLeduc, T., Chaillou, F., and Ouard, T. (2011). Towards a ”typification” of the pedestrian surrounding space: analysis of the isovist
using digital signal processing method. In Stan Geertman, Wolfgang Reinhardt, and Fred Toppen, editors, Advancing GeoinformationScience for a Changing World (associated to the 14th AGILE International Conference on Geographic Information Science, Utrecht,
The Netherlands - AGILE’2011), Lecture notes in Geoinformation and Cartography (LNG&C), pages 275-292. Springer-Verlag, BerlinHeidelberg, 2011.
of them that have these characteristic values - relative to the local norm - will be perceived as more spacious than those with any other combination.
(Conroy-Dalton and Dalton, 2001) and (Weitkamp, 2010) calculate some other isovist's geometrical properties such as:• the area to perimeter ratio,• the circularity (area of a perfect circle whose radius is set to the mean
radial length of the isovist divided by the isovist area),• the drift (distance between the view-point, i.e. the location from which
the isovist is generated, and the centre of gravity of the isovist),• the minimum, mean and maximum radial lengths.
The aim here is to characterize the isovist shape using a relevant indicator. The one mentioned before seem to be inaccurate for some different reasons. Perimeter, area, minimum, mean and maximum radial lengths, but also circularity, are too directly connected with the shape's scale. The required indicator has to be a dimensionless quantity (independent of any linear change of scale). The drift is a measure of displacement between the centroid of the isovist and its viewpoint. Therefore, as the circularity or the area to perimeter ratio, it is a useful tool for measuring the difference between actual and ideal geometric shapes. Such an isovist's surface property does not match our requirement because of the jaggedness of such a shape in the urban context. Moreover the drift parameter is not adapted because, in a given canyon street, for each pedestrian's punctual position, the isovist remains unchanged (so as its own centroid) whereas the view-point's position changes.
Finally the standard deviation of the isovist's radials (M2) and their skewness (M3) measure respectively the "width" of the distribution of radials lengths and the "asymmetry" of the distribution of lengths (it indicates if the values are relatively evenly distributed on both sides of the mean radial length).
To sum up, a one-dimensional indicator seems inaccurate to describe deeply a shape as complex as an isovist in an urban outdoor context. Instead of trying to combine some of them so as to produce a composite indicator, we prefer to try a digital signal processing tool.
Draft, published inLeduc, T., Chaillou, F., and Ouard, T. (2011). Towards a ”typification” of the pedestrian surrounding space: analysis of the isovist
using digital signal processing method. In Stan Geertman, Wolfgang Reinhardt, and Fred Toppen, editors, Advancing GeoinformationScience for a Changing World (associated to the 14th AGILE International Conference on Geographic Information Science, Utrecht,
The Netherlands - AGILE’2011), Lecture notes in Geoinformation and Cartography (LNG&C), pages 275-292. Springer-Verlag, BerlinHeidelberg, 2011.
2.3 Need of a geoprocessing approach - declarative Geoprocessing with the Gearscape Geoprocessing Language
An urban pedestrian pathway and a visualscape are both data that include a spatial component. What is required here is some tool able to process these spatial data using: on one hand the table-oriented programming paradigm (for its table-friendly syntax, its fundamental and consistent collection operations, and its easiness of understanding) and, on the other hand, batch processing with parametric ability and procedural extension. We pretend that the use of a spatial SQL with semantics ability is essential to perform such an objective. That is the reason why we need to take benefits from the GearScape Geoprocessing Language (GGL) specific layer (González Cortés and Leduc, 2010), aside the features of robustness, scalability, and easy to use main characteristics.
3 Methodology: towards an isovist fingerprint
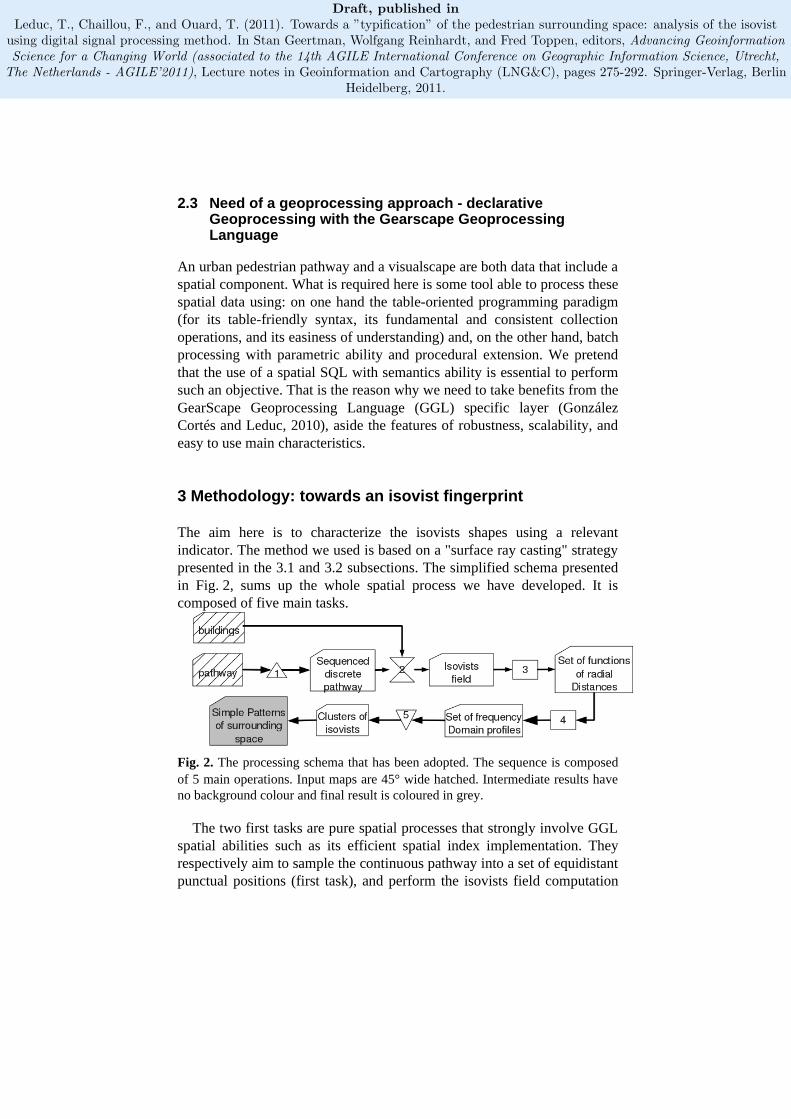
The aim here is to characterize the isovists shapes using a relevant indicator. The method we used is based on a "surface ray casting" strategy presented in the 3.1 and 3.2 subsections. The simplified schema presented in Fig. 2, sums up the whole spatial process we have developed. It is composed of five main tasks.
Fig. 2. The processing schema that has been adopted. The sequence is composed of 5 main operations. Input maps are 45° wide hatched. Intermediate results have no background colour and final result is coloured in grey.
The two first tasks are pure spatial processes that strongly involve GGL spatial abilities such as its efficient spatial index implementation. They respectively aim to sample the continuous pathway into a set of equidistant punctual positions (first task), and perform the isovists field computation
Draft, published inLeduc, T., Chaillou, F., and Ouard, T. (2011). Towards a ”typification” of the pedestrian surrounding space: analysis of the isovist
using digital signal processing method. In Stan Geertman, Wolfgang Reinhardt, and Fred Toppen, editors, Advancing GeoinformationScience for a Changing World (associated to the 14th AGILE International Conference on Geographic Information Science, Utrecht,
The Netherlands - AGILE’2011), Lecture notes in Geoinformation and Cartography (LNG&C), pages 275-292. Springer-Verlag, BerlinHeidelberg, 2011.
(second task). The third task consists in an angular abscissa sampling process. The fourth task operates a Discrete Fourier Transform (DFT) of the previous isovists’ samples. At last, the fifth task aims to partition the isovists fields using a clustering method so as to classify the pedestrian positions surrounding space.
3.1 Sampling the isovist: 2π periodic function of radial distances
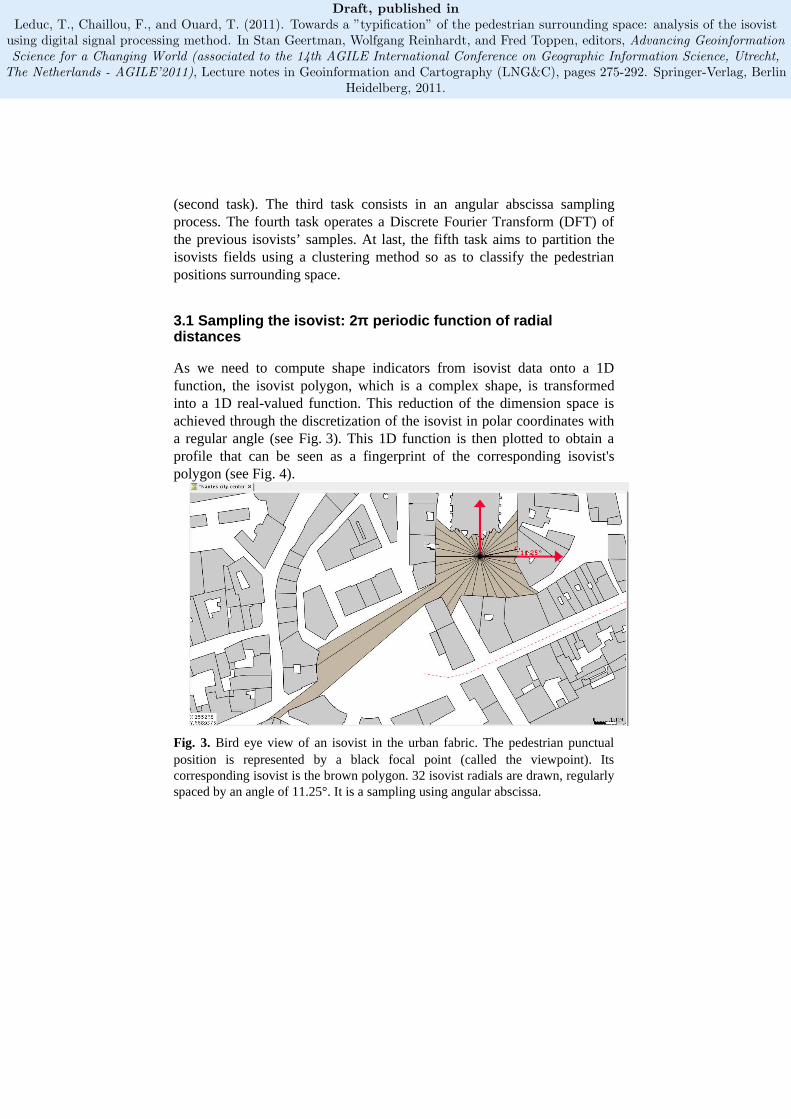
As we need to compute shape indicators from isovist data onto a 1D function, the isovist polygon, which is a complex shape, is transformed into a 1D real-valued function. This reduction of the dimension space is achieved through the discretization of the isovist in polar coordinates with a regular angle (see Fig. 3). This 1D function is then plotted to obtain a profile that can be seen as a fingerprint of the corresponding isovist's polygon (see Fig. 4).
Fig. 3. Bird eye view of an isovist in the urban fabric. The pedestrian punctual position is represented by a black focal point (called the viewpoint). Its corresponding isovist is the brown polygon. 32 isovist radials are drawn, regularly spaced by an angle of 11.25°. It is a sampling using angular abscissa.

Draft, published inLeduc, T., Chaillou, F., and Ouard, T. (2011). Towards a ”typification” of the pedestrian surrounding space: analysis of the isovist
using digital signal processing method. In Stan Geertman, Wolfgang Reinhardt, and Fred Toppen, editors, Advancing GeoinformationScience for a Changing World (associated to the 14th AGILE International Conference on Geographic Information Science, Utrecht,
The Netherlands - AGILE’2011), Lecture notes in Geoinformation and Cartography (LNG&C), pages 275-292. Springer-Verlag, BerlinHeidelberg, 2011.
Fig. 4. The previous sampling of the isovist into 32 radials (left hand side) is represented by a profile plot (right hand side). This profile plot corresponds to a function of radial distances all around the viewpoint. In this profile plot, x-axis corresponds to the angle value in degrees and y-axis to the corresponding radial length. The angle increases in the counter-clockwise direction.
In practice (in the following use case at least), we are used to sample the isovist into 1024 radials. It means that the viewpoint’s surrounding space is divided into isovists radials regularly spaced by an angle of about 0.35°. Such an angular abscissa sampling is of enough fine granularity for the urban fabric. Thus, it gives the possibility to detect metric fluctuation at a distance of more than 160 meters. Actually, to be exhaustive, this sampling process must take into account the result exhibited by the Nyquist-Shanon sampling theorem. Thus, the sampling angular abscissa should not be greater than half the minimum angle between any couple of nodes of the isovist’s contour and the view point. As may be noticed, the number of radials is always a power of 2. This constraint is required by the Fast Fourier Transform algorithm we use (Commons-Math, 2010).

Draft, published inLeduc, T., Chaillou, F., and Ouard, T. (2011). Towards a ”typification” of the pedestrian surrounding space: analysis of the isovist
using digital signal processing method. In Stan Geertman, Wolfgang Reinhardt, and Fred Toppen, editors, Advancing GeoinformationScience for a Changing World (associated to the 14th AGILE International Conference on Geographic Information Science, Utrecht,
The Netherlands - AGILE’2011), Lecture notes in Geoinformation and Cartography (LNG&C), pages 275-292. Springer-Verlag, BerlinHeidelberg, 2011.
Fig. 5. Sensitivity of the profile plot of the isovist presented in Fig. 3 to the sampling frequency. As may be seen on the plots, the process seems to converge from 256 radials.
As shown in Fig. 5, in the really specific case of isovist presented in Fig. 3, the sensitivity of the profile plot to the sampling frequency seems to converge from 256 radials. With such a simple isovist, sample into 1024 radials is uselessly accurate (and therefore dispensable). But, generally, such a resolution is well adapted.
Draft, published inLeduc, T., Chaillou, F., and Ouard, T. (2011). Towards a ”typification” of the pedestrian surrounding space: analysis of the isovist
using digital signal processing method. In Stan Geertman, Wolfgang Reinhardt, and Fred Toppen, editors, Advancing GeoinformationScience for a Changing World (associated to the 14th AGILE International Conference on Geographic Information Science, Utrecht,
The Netherlands - AGILE’2011), Lecture notes in Geoinformation and Cartography (LNG&C), pages 275-292. Springer-Verlag, BerlinHeidelberg, 2011.
3.2 Frequency domain representation of the isovist shape
The continuous Fourier transform is an operation that transforms one complex-valued function of a real variable into another. It consists in decomposition on a sinusoidal basis function of the input function. Because, the function of radial distances we use is a discrete one (the continuous border of the isovist has been sampled in the previous subsection), we need a discrete implementation of this transform (DFT stands for Discrete Fourier Transform). For efficiency reasons, we have decided to reuse an already implemented fast Fourier Transform (FFT) algorithm (see Commons-Math, 2010).
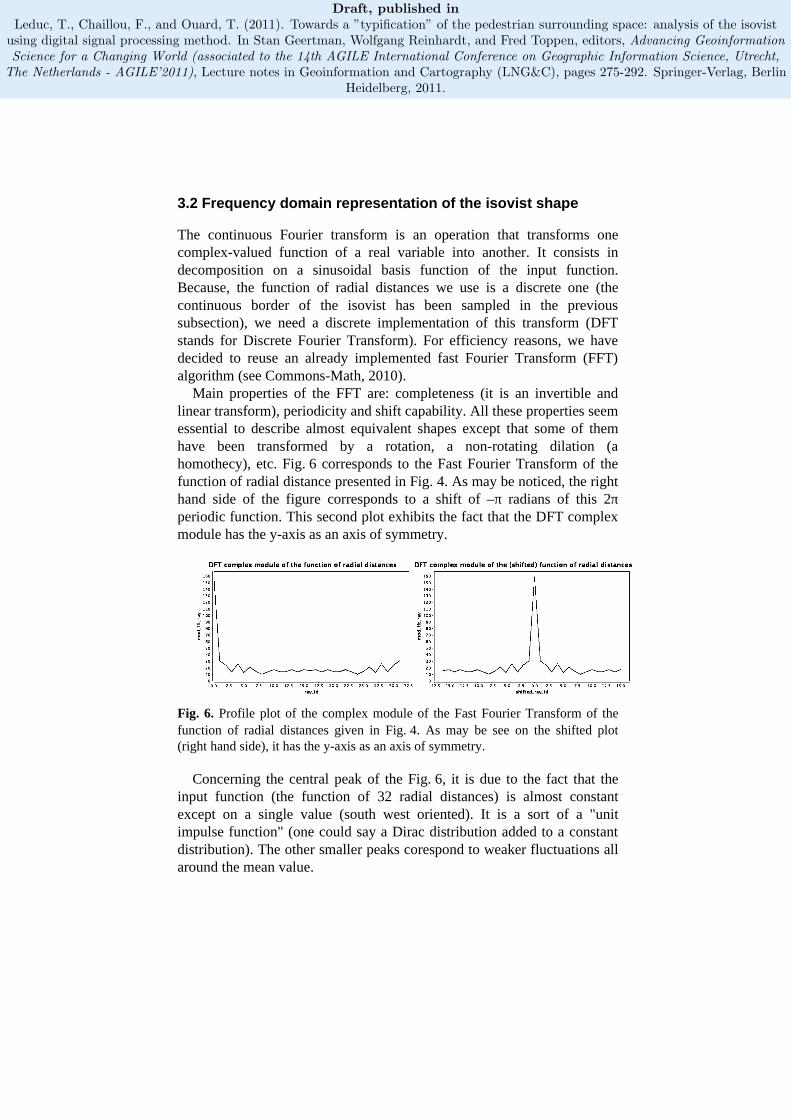
Main properties of the FFT are: completeness (it is an invertible and linear transform), periodicity and shift capability. All these properties seem essential to describe almost equivalent shapes except that some of them have been transformed by a rotation, a non-rotating dilation (a homothecy), etc. Fig. 6 corresponds to the Fast Fourier Transform of the function of radial distance presented in Fig. 4. As may be noticed, the right hand side of the figure corresponds to a shift of – radians of this 2π π periodic function. This second plot exhibits the fact that the DFT complex module has the y-axis as an axis of symmetry.
Fig. 6. Profile plot of the complex module of the Fast Fourier Transform of the function of radial distances given in Fig. 4. As may be see on the shifted plot (right hand side), it has the y-axis as an axis of symmetry.
Concerning the central peak of the Fig. 6, it is due to the fact that the input function (the function of 32 radial distances) is almost constant except on a single value (south west oriented). It is a sort of a "unit impulse function" (one could say a Dirac distribution added to a constant distribution). The other smaller peaks corespond to weaker fluctuations all around the mean value.
Draft, published inLeduc, T., Chaillou, F., and Ouard, T. (2011). Towards a ”typification” of the pedestrian surrounding space: analysis of the isovist
using digital signal processing method. In Stan Geertman, Wolfgang Reinhardt, and Fred Toppen, editors, Advancing GeoinformationScience for a Changing World (associated to the 14th AGILE International Conference on Geographic Information Science, Utrecht,
The Netherlands - AGILE’2011), Lecture notes in Geoinformation and Cartography (LNG&C), pages 275-292. Springer-Verlag, BerlinHeidelberg, 2011.
4 Use case: analysis of a real urban area in Nantes city
4.1 An already tried and tested playground
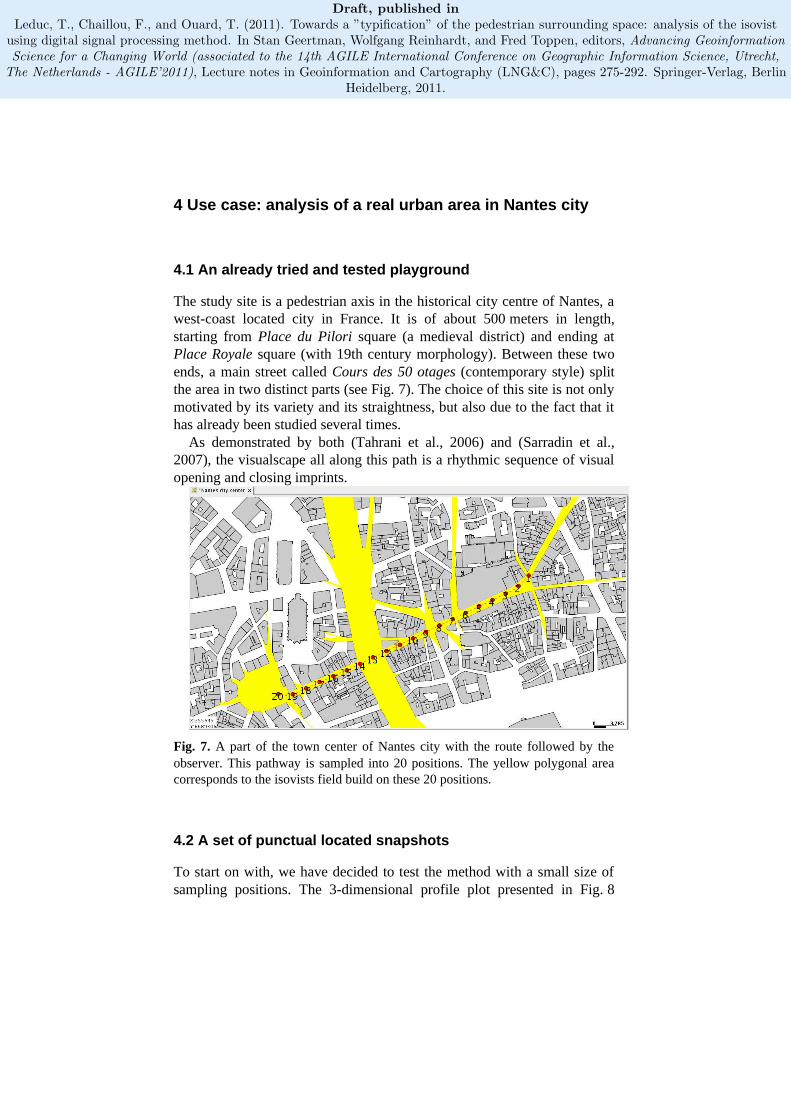
The study site is a pedestrian axis in the historical city centre of Nantes, a west-coast located city in France. It is of about 500 meters in length, starting from Place du Pilori square (a medieval district) and ending at Place Royale square (with 19th century morphology). Between these two ends, a main street called Cours des 50 otages (contemporary style) split the area in two distinct parts (see Fig. 7). The choice of this site is not only motivated by its variety and its straightness, but also due to the fact that it has already been studied several times.
As demonstrated by both (Tahrani et al., 2006) and (Sarradin et al., 2007), the visualscape all along this path is a rhythmic sequence of visual opening and closing imprints.
Fig. 7. A part of the town center of Nantes city with the route followed by the observer. This pathway is sampled into 20 positions. The yellow polygonal area corresponds to the isovists field build on these 20 positions.
4.2 A set of punctual located snapshots
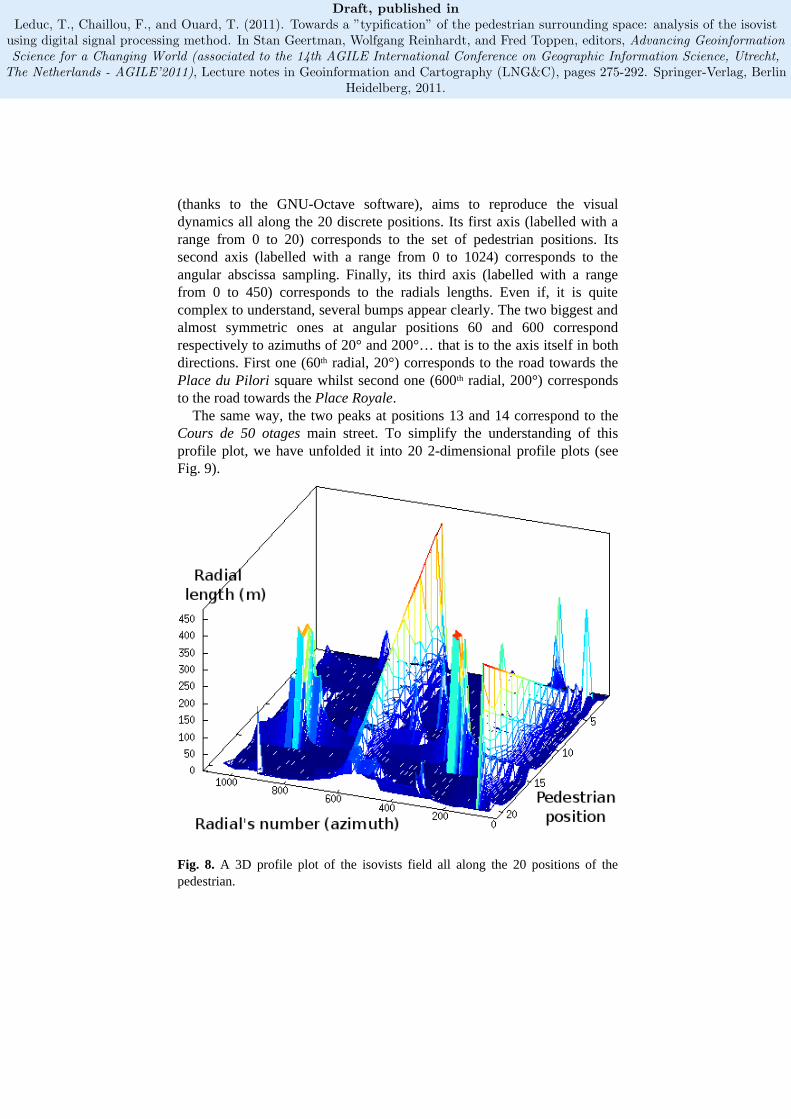
To start on with, we have decided to test the method with a small size of sampling positions. The 3-dimensional profile plot presented in Fig. 8
Draft, published inLeduc, T., Chaillou, F., and Ouard, T. (2011). Towards a ”typification” of the pedestrian surrounding space: analysis of the isovist
using digital signal processing method. In Stan Geertman, Wolfgang Reinhardt, and Fred Toppen, editors, Advancing GeoinformationScience for a Changing World (associated to the 14th AGILE International Conference on Geographic Information Science, Utrecht,
The Netherlands - AGILE’2011), Lecture notes in Geoinformation and Cartography (LNG&C), pages 275-292. Springer-Verlag, BerlinHeidelberg, 2011.
(thanks to the GNU-Octave software), aims to reproduce the visual dynamics all along the 20 discrete positions. Its first axis (labelled with a range from 0 to 20) corresponds to the set of pedestrian positions. Its second axis (labelled with a range from 0 to 1024) corresponds to the angular abscissa sampling. Finally, its third axis (labelled with a range from 0 to 450) corresponds to the radials lengths. Even if, it is quite complex to understand, several bumps appear clearly. The two biggest and almost symmetric ones at angular positions 60 and 600 correspond respectively to azimuths of 20° and 200°… that is to the axis itself in both directions. First one (60th radial, 20°) corresponds to the road towards the Place du Pilori square whilst second one (600th radial, 200°) corresponds to the road towards the Place Royale.
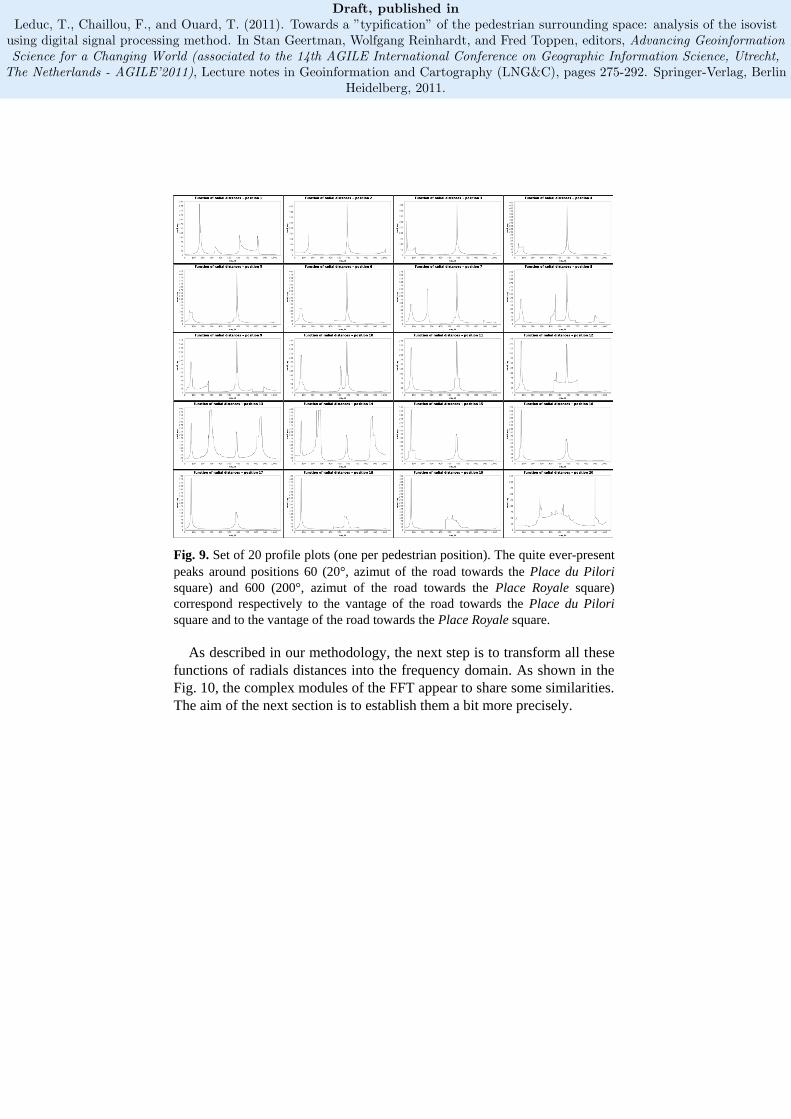
The same way, the two peaks at positions 13 and 14 correspond to the Cours de 50 otages main street. To simplify the understanding of this profile plot, we have unfolded it into 20 2-dimensional profile plots (see Fig. 9).
Fig. 8. A 3D profile plot of the isovists field all along the 20 positions of the pedestrian.
Draft, published inLeduc, T., Chaillou, F., and Ouard, T. (2011). Towards a ”typification” of the pedestrian surrounding space: analysis of the isovist
using digital signal processing method. In Stan Geertman, Wolfgang Reinhardt, and Fred Toppen, editors, Advancing GeoinformationScience for a Changing World (associated to the 14th AGILE International Conference on Geographic Information Science, Utrecht,
The Netherlands - AGILE’2011), Lecture notes in Geoinformation and Cartography (LNG&C), pages 275-292. Springer-Verlag, BerlinHeidelberg, 2011.
Fig. 9. Set of 20 profile plots (one per pedestrian position). The quite ever-present peaks around positions 60 (20°, azimut of the road towards the Place du Pilori square) and 600 (200°, azimut of the road towards the Place Royale square) correspond respectively to the vantage of the road towards the Place du Pilori square and to the vantage of the road towards the Place Royale square.
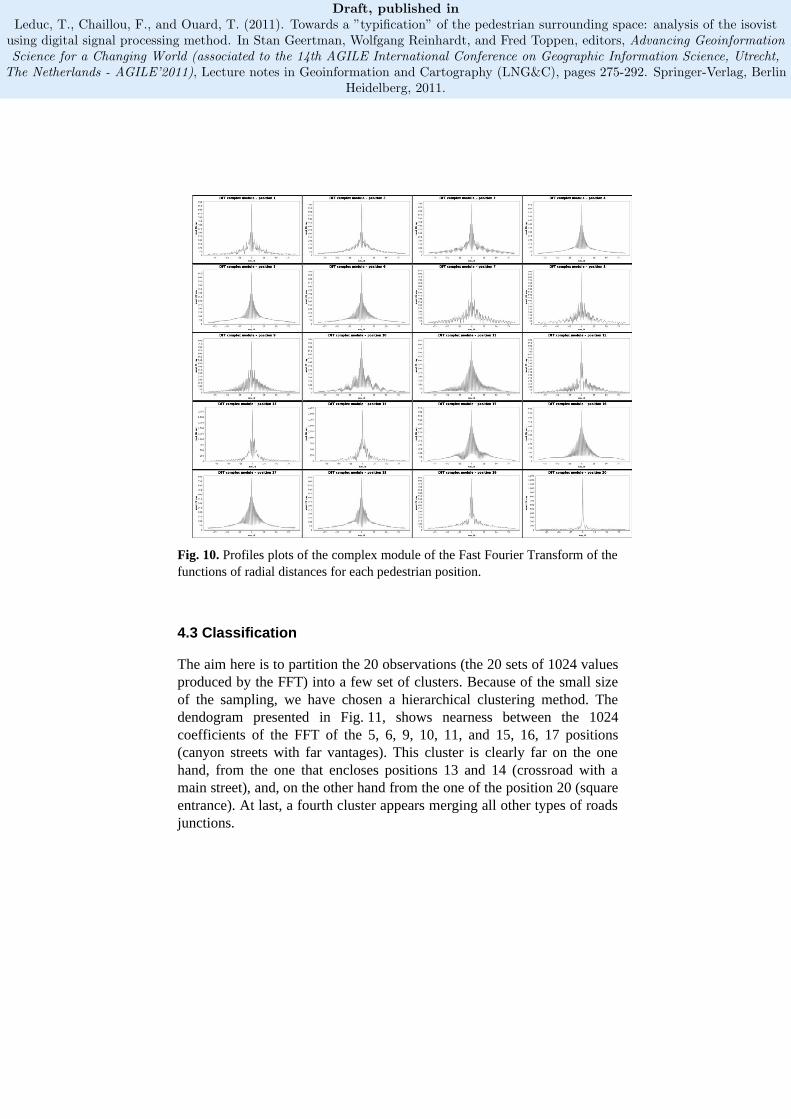
As described in our methodology, the next step is to transform all these functions of radials distances into the frequency domain. As shown in the Fig. 10, the complex modules of the FFT appear to share some similarities. The aim of the next section is to establish them a bit more precisely.
Draft, published inLeduc, T., Chaillou, F., and Ouard, T. (2011). Towards a ”typification” of the pedestrian surrounding space: analysis of the isovist
using digital signal processing method. In Stan Geertman, Wolfgang Reinhardt, and Fred Toppen, editors, Advancing GeoinformationScience for a Changing World (associated to the 14th AGILE International Conference on Geographic Information Science, Utrecht,
The Netherlands - AGILE’2011), Lecture notes in Geoinformation and Cartography (LNG&C), pages 275-292. Springer-Verlag, BerlinHeidelberg, 2011.
Fig. 10. Profiles plots of the complex module of the Fast Fourier Transform of the functions of radial distances for each pedestrian position.
4.3 Classification
The aim here is to partition the 20 observations (the 20 sets of 1024 values produced by the FFT) into a few set of clusters. Because of the small size of the sampling, we have chosen a hierarchical clustering method. The dendogram presented in Fig. 11, shows nearness between the 1024 coefficients of the FFT of the 5, 6, 9, 10, 11, and 15, 16, 17 positions (canyon streets with far vantages). This cluster is clearly far on the one hand, from the one that encloses positions 13 and 14 (crossroad with a main street), and, on the other hand from the one of the position 20 (square entrance). At last, a fourth cluster appears merging all other types of roads junctions.

Draft, published inLeduc, T., Chaillou, F., and Ouard, T. (2011). Towards a ”typification” of the pedestrian surrounding space: analysis of the isovist
using digital signal processing method. In Stan Geertman, Wolfgang Reinhardt, and Fred Toppen, editors, Advancing GeoinformationScience for a Changing World (associated to the 14th AGILE International Conference on Geographic Information Science, Utrecht,
The Netherlands - AGILE’2011), Lecture notes in Geoinformation and Cartography (LNG&C), pages 275-292. Springer-Verlag, BerlinHeidelberg, 2011.
Fig. 11. Result of the hierarchical clustering method.
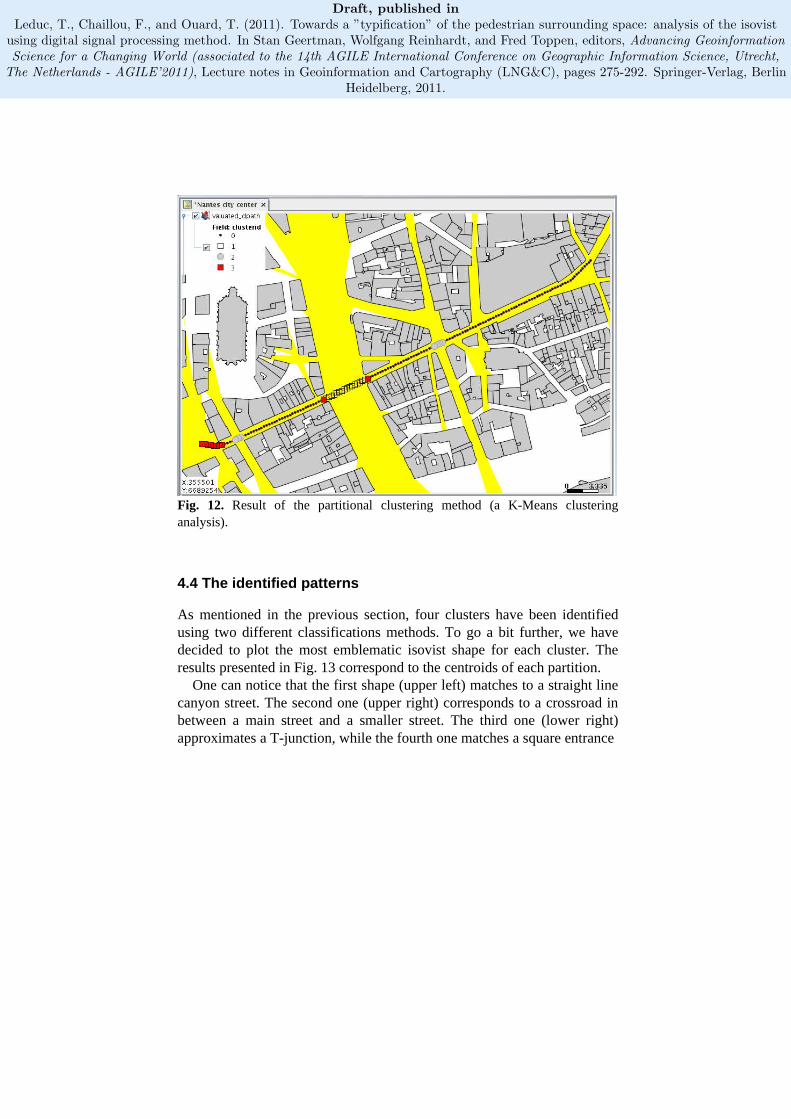
To test the scalability of this indicator, we decide to focus on a greater sample (153 positions). Because of this sampling size, we adopt another classification method based on partitional clustering. The implementation we use is the K-Means of (Math-Commons, 2010). Re-using the intermediate result produced by the hierarchical clustering, we have arbitrarily decided to choose 4 as the number of clusters. What clearly appears in Fig. 12 is that this new result is not only fully coherent with the previous one, but also that the results seem qualitatively true and spatially accurate.
Draft, published inLeduc, T., Chaillou, F., and Ouard, T. (2011). Towards a ”typification” of the pedestrian surrounding space: analysis of the isovist
using digital signal processing method. In Stan Geertman, Wolfgang Reinhardt, and Fred Toppen, editors, Advancing GeoinformationScience for a Changing World (associated to the 14th AGILE International Conference on Geographic Information Science, Utrecht,
The Netherlands - AGILE’2011), Lecture notes in Geoinformation and Cartography (LNG&C), pages 275-292. Springer-Verlag, BerlinHeidelberg, 2011.
Fig. 12. Result of the partitional clustering method (a K-Means clustering analysis).
4.4 The identified patterns
As mentioned in the previous section, four clusters have been identified using two different classifications methods. To go a bit further, we have decided to plot the most emblematic isovist shape for each cluster. The results presented in Fig. 13 correspond to the centroids of each partition.
One can notice that the first shape (upper left) matches to a straight line canyon street. The second one (upper right) corresponds to a crossroad in between a main street and a smaller street. The third one (lower right) approximates a T-junction, while the fourth one matches a square entrance
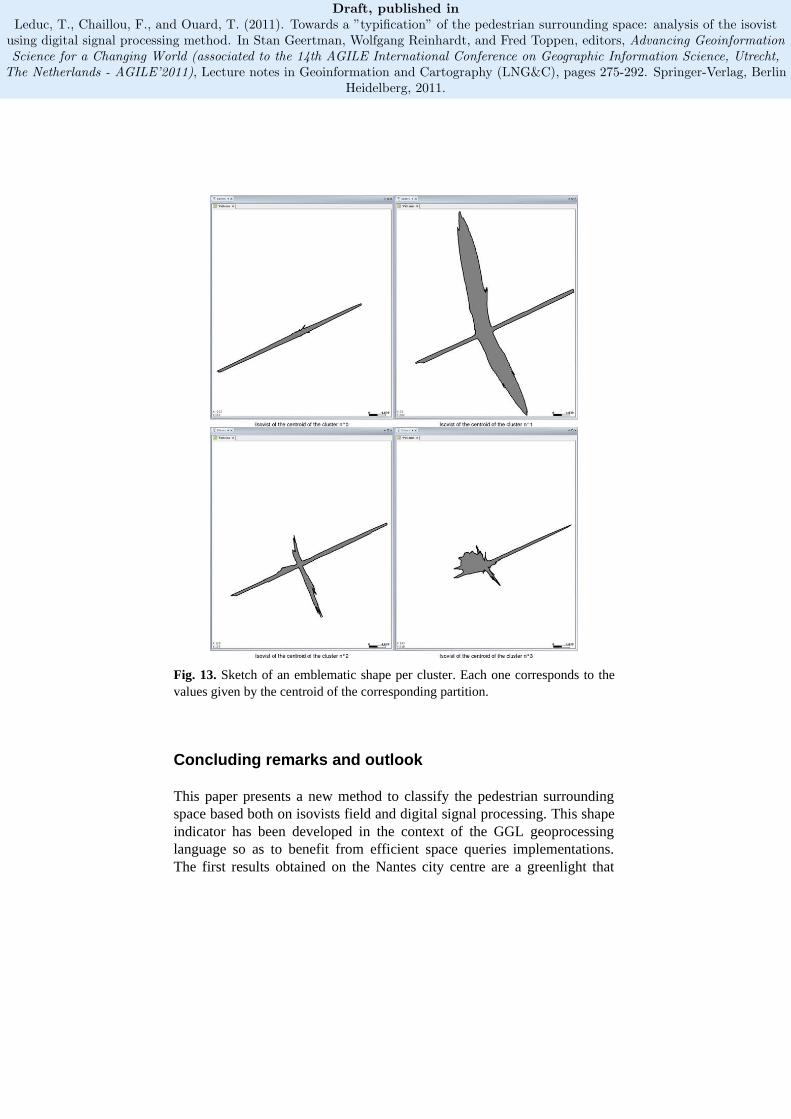
Draft, published inLeduc, T., Chaillou, F., and Ouard, T. (2011). Towards a ”typification” of the pedestrian surrounding space: analysis of the isovist
using digital signal processing method. In Stan Geertman, Wolfgang Reinhardt, and Fred Toppen, editors, Advancing GeoinformationScience for a Changing World (associated to the 14th AGILE International Conference on Geographic Information Science, Utrecht,
The Netherlands - AGILE’2011), Lecture notes in Geoinformation and Cartography (LNG&C), pages 275-292. Springer-Verlag, BerlinHeidelberg, 2011.
Fig. 13. Sketch of an emblematic shape per cluster. Each one corresponds to the values given by the centroid of the corresponding partition.
Concluding remarks and outlook
This paper presents a new method to classify the pedestrian surrounding space based both on isovists field and digital signal processing. This shape indicator has been developed in the context of the GGL geoprocessing language so as to benefit from efficient space queries implementations. The first results obtained on the Nantes city centre are a greenlight that

Draft, published inLeduc, T., Chaillou, F., and Ouard, T. (2011). Towards a ”typification” of the pedestrian surrounding space: analysis of the isovist
using digital signal processing method. In Stan Geertman, Wolfgang Reinhardt, and Fred Toppen, editors, Advancing GeoinformationScience for a Changing World (associated to the 14th AGILE International Conference on Geographic Information Science, Utrecht,
The Netherlands - AGILE’2011), Lecture notes in Geoinformation and Cartography (LNG&C), pages 275-292. Springer-Verlag, BerlinHeidelberg, 2011.
illustrate its potentialities for visuals dynamics’ evaluation all along pedestrian pathways.
Nevertheless, one must admit that the experimental site is rectilinear. With a (nore) sinuous tour, the complex module of the FFT will probably not be an enough differential tool. A solution could be to couple the complex module analysis with the complex argument or phasis of the FFT.
Concerning our future works, because we really think that this level (we mean the surroundings of a pedestrian) is the right one to modelize precisely the city, we would like to extend this approach to the whole city. Thus, a fine and quite precise model of all open spaces would be available, so as a classification of each of them. Such a classification is a first step towards a compressed (and therefore possibly embedded on mobile devices) model of the city.
References
Batty, M. (2001). Exploring isovist fields: space and shape in architectural and urban morphology. Planning and design: Environment and planning B, 28(1):123-150.
Benedikt, M. L. (1979). To take hold of space: isovists and isovist fields. Environment and Planning B: Planning and Design, 6(1):47-65.
Benedikt, M. L. (2008). Cityspace, cyberspace and the spatiology of information. Journal of Virtual Worlds Research, 1(1):22.
Commons-Math (2010). The Apache Commons Mathematics Library. http://commons.apache.org/math/.
Conroy, R. (2001). Spatial Navigation in Immersive Virtual Environments. PhD thesis, The faculty of the built environment, University College London, London, U.K.
Conroy Dalton, R. and Dalton, N. (2001). OmniVista: an application for Isovist field and path analysis. In 3rd International Space Syntax Symposium, Atlanta, Georgia, USA.
Couclelis, H. (1992). People Manipulate Objects (but Cultivate Fields): Beyond the Raster-Vector Debate in GIS. In Frank, A. U., Campari, I., and Formentini, U., editors, Theories and Methods of Spatio-Temporal Reasoning in Geographic Space, International Conference GIS - From Space to Territory: Theories and Methods of Spatio-Temporal Reasoning, Lecture Notes in Computer Science, pages 65-77, Pisa, Italy. Springer.
Davis, L. S. and Benedikt, M. L. (1979). Computational models of space: Isovists and isovist fields. Computer Graphics and Image Processing, 11:49-72.
Franz, G. and Wiener, J. M. (2008). From space syntax to space semantics: a behaviorally and perceptually oriented methodology for the efficient
Draft, published inLeduc, T., Chaillou, F., and Ouard, T. (2011). Towards a ”typification” of the pedestrian surrounding space: analysis of the isovist
using digital signal processing method. In Stan Geertman, Wolfgang Reinhardt, and Fred Toppen, editors, Advancing GeoinformationScience for a Changing World (associated to the 14th AGILE International Conference on Geographic Information Science, Utrecht,
The Netherlands - AGILE’2011), Lecture notes in Geoinformation and Cartography (LNG&C), pages 275-292. Springer-Verlag, BerlinHeidelberg, 2011.
description of the geometry and topology of environments. Environment and Planning B: Planning and Design, 35(4):574-2013592.
Gibson, J. J. (1979). The Ecological Approach to Visual Perception. Boston: Houghton Mifflin.
González Cortés, F. and Leduc, T. (2010). Poster abstract - GGL: A geo-processing definition language that enhance spatial SQL with parameterization. In 13th AGILE International Conference on Geographic Information Science – AGILE’2010, Guimaraes, Portugal.
Hillier, B. (1996). Space is the machine. Press Syndicate of the University of Cambridge.
Leduc, T., Miguet, F., Tourre, V., and Woloszyn, P. (2010). Towards a spatial semantics to analyze the visual dynamics of the pedestrian mobility in the urban fabric. In Painho, M., Santos, M. Y., and Pundt, H., editors, Geospatial Thinking (associated to the 13th AGILE International Conference on Geographic Information Science, Guimaraes, Portugal - AGILE'2010), Lecture notes in Geoinformation and Cartography (LNG&C), pages 237-257. Springer-Verlag, Berlin Heidelberg.
Lynch, K. A. (1960). The image of the city. Cambridge: MIT Press. Publication of the Joint Center for Urban Studies.
Meilinger, T., Franz, G., and Bülthoff, H. H. (2009). From isovists via mental representations to behaviour: first steps toward closing the causal chain. Environment and Planning B: Planning and Design. advance online publication.
Morello, E. and Ratti, C. (2009). A digital image of the city: 3D isovists in Lynch's urban analysis. Environment and Planning B: Planning and Design, 36(5):837-853.
Sarradin, F., Siret, D., Couprie, M., and Teller, J. (2007). Comparing sky shape skeletons for the analysis of visual dynamics along routes. Planning and design: Environment and planning B, 34(5):840-857.
Tahrani, S., Moreau, G., and Woloszyn, P. (2006). Analyzing urban daylighting ambiences by walking in a virtual city. In Premières journées de l’AFRV, Rocquencourt, France.
Tahrani, S. and Moreau, G. (2008). Integration of immersive walking to analyse urban daylighting ambiences. Journal of Urban Design, 13(1):99-123.
Teller, J. (2003). A spherical metric for the field-oriented analysis of complex urban open spaces. Planning and design: Environment and planning B, 30(3):339-356.
Yang PPJ, Putra SY, and Li W (2007). Viewsphere: a GIS-based 3D visibility analysis for urban design evaluation. Planning and design: Environment and planning B, 34(6):971-992.
Weitkamp, G. (2010). Capturing the view: a GIS based procedure to assess perceived landscape openness. PhD thesis, Wageningen University, The Nederlands.