Embed Size (px)
Citation preview

PoS(MeerKAT2016)021
Towards a Full Census of the Obscure(d) VelaSupercluster using MeerKAT
Renée C. Kraan-Korteweg∗, Ed C. Elson, Sarah L. Blyth, Claude Carignan, Brad S.Frank and Thomas H. JarrettAstronomy Department, University of Cape Town, 7701 Rondebosch, South AfricaE-mail: [email protected]
Michelle E. Cluver
Department of Physics, University of the Western Cape, Bellville, South Africa
Paolo Serra
Osservatorio Astronomico di Cagliari (INAF), Selargus, Italy
Gyula, I.G. Józsa
SKA South Africa, Radio Astronomy Research Group, Pinelands, South Africa
Recent spectroscopic observations of a few thousand partially obscured galaxies in the Vela con-stellation revealed a massive overdensity on supercluster scales straddling the Galactic Equator(` ∼ 272.◦5) at cz∼ 18000 km s−1. It remained unrecognised because it is located just beyond theboundaries and volumes of systematic whole-sky redshift and peculiar velocity surveys – and isobscured by the Milky Way. The structure lies close to the apex where residual bulkflows suggestconsiderable mass excess. The uncovered Vela Supercluster (VSCL) conforms of a confluenceof merging walls, but its core remains uncharted. At the thickest foreground dust column densi-ties (|b| ∼< 6◦) galaxies are not visible and optical spectroscopy is not effective. This precludes areliable estimate of the mass of VSCL, hence its effect on the cosmic flow field and the peculiarvelocity of the Local Group.Only systematic H I-surveys can bridge that gap. We have run simulations and will present early-science observing scenarios with MeerKAT 32 (M32) to complete the census of this dynamicallyand cosmologically relevant supercluster. M32 has been put forward because this pilot project willalso serve as precursor project for H I MeerKAT Large Survey Projects, like Fornax and Laduma.Our calculations have shown that a survey area of the fully obscured part of the supercluster,where the two walls cross and the potential core of the supercluster resides, can be achieved onreasonable time-scales (200 hrs) with M32.
MeerKAT Science: On the Pathway to the SKA,25-27 May, 2016,Stellenbosch, South Africa
∗Speaker.
c© Copyright owned by the author(s) under the terms of the Creative CommonsAttribution-NonCommercial-NoDerivatives 4.0 International License (CC BY-NC-ND 4.0). http://pos.sissa.it/

PoS(MeerKAT2016)021
The VSCL MeerKAT survey Renée C. Kraan-Korteweg
1. Introduction
The Zone of Avoidance (ZOA) remains an enigma in the study of large-scale structure, cosmicflow fields and the motion of the Local Group with respect to the Cosmic Microwave Background(e.g. [18, 23]). Significant progress has been made in the whole-sky mapping of the large-scalegalaxy distribution in the nearby Universe (cz ∼< 15000 km s−1 [13, 10]) to describe the cosmicweb. However, due to dust obscuration and high stellar density these whole-sky surveys all ’avoid’a broad band of ±5◦ to ±10◦ around the Galactic equator. This does not hold for systematic H I
surveys (e.g. [1, 35]), but so far these have been quite shallow.
Local galaxy overdensities exert gravitational perturbations on the smoothly expanding Uni-verse, resulting in the so-called peculiar velocity or cosmic flow fields. Our own Local Group (LG)partakes in such a flow, as evidenced by the dipole observed in the Cosmic Microwave Background(622 km s−1 [9]. Such flows are exceedingly well described through the analysis of peculiar veloc-ity data [12, 31, 34]. However, the paucity of ZOA redshift data is endemic to all peculiar velocitysurveys, and is a major limitation for our understanding of bulk flows.
The direction of these flows, and the volumes over which they are coherent, remain contro-versial [11, 8, 16, 2]. Later results suggest a considerable mass excess just outside the bound-aries and volumes of current systematic whole-sky redshift and peculiar velocity surveys (cz ∼<10000− 16000 km s−1), suspiciously close to the ZOA (` : 270◦− 330◦) [24, 36, 33, 5, 12, 31].More recently the 6dFGS (6dF Galaxy Survey) and 2MTS (2MASS Tully-Fisher Survey) peculiarvelocity data [33, 31, 34] found a residual bulk flow velocity of 273 km s−1 that must have its ori-gin due to a mass overdensity in the ZOA region close to Vela (` ∼ 270◦), arising from beyond16 000 km s−1.
This is exactly at the location in redshift space where a major supercluster, dubbed the VelaSupercluster (VSCL), was recently discovered [21]. Although still sparsely sampled, it is enormousin extent (∼ 115×90 h70 Mpc), and has a significant influence on the motion of the Local Group(50 km s−1). Given its location on the sky it may well play an important role in explaining theabove mentioned bulk flow results, and help reduce the misalignment angle between the CMBdipole and the motion of the LG.
The results and analysis of the VSCL to date is based on a sparsely-sampled spectroscopicsurvey over the outer edges of the ZOA (|b| ∼< 5◦) where optical observations allow good signal-to-noise spectra for the partially obscured galaxies. But no observational data exists as yet for VSCLat the lowest latitudes. Following a brief overview of the main properties of the Vela supercluster[21] in Sect. 2, we will present in Sect. 3 a MeerKAT observing strategy in early science modeto map the gas-rich spiral galaxy population of VSCL across the opaque part of the Milky Way,compare the predictions to simulations in Sect.4, and conclude with a summary in Sect. 5.
While the science goal of the VSCL MeerKAT survey project is self-contained, this project isa collaboration with the PI’s and other members of the MeerKAT H I Large Survey Projects (LSP)Laduma [4] and Fornax [30]. The hands-on experience with these early science H I-data will yieldinvaluable experience towards the final preparation of the approved LSP’s, in addition to benefitingfrom ample KAT-7 observing experience by various members of our team.
1

PoS(MeerKAT2016)021
The VSCL MeerKAT survey Renée C. Kraan-Korteweg
2. The Vela Supercluster (VSCL)
2.1 Discovery and first results
Details of the characteristics known so far about the Vela Supercluster are detailed in the dis-covery paper by Kraan-Korteweg et al. 2016 [21]. The results are based on a spectroscopic surveyof partially obscured galaxies in the Vela survey region (`= 272.◦5±20◦,b = 0◦±10◦). These in-cluded (i) the multi-object spectrometer (MOS) on the Southern African Large Telescope (SALT)[20], which are ideal for rich clusters at the suspected VSCL distance, and (ii) the 2dF+AAOmegaspectrograph on the 3.9m telescope of the Australian Astronomical Observatory (AAO), a perfectsurvey instrument with its 2-degree field and 392 fibres. It should be emphasised that the surveyfootprint is not contiguous, this is by design to sample as wide an area as possible in the enormousVela region. It is dominated by the 25 AAOmega fields observed in 2014, plus earlier observed(unpublished) 6dF and Optopus ZOA data, but has little to no data below Galactic latitudes ofb <±5◦. Combining the AAOmega and SALT redshift data with earlier unpublished data, led to atotal of 4432 new redshifts.
The VSCL is prominent over a surprisingly wide area on the sky (30×20◦) given its distance.More astonishing was its prominence. Figure 1 shows a radial velocity histogram (left panel) anda redshift wedge (right panel) along the Vela ZOA survey region `,b = 285◦−255◦;±10◦.
Figure 1: Velocity distribution of ZOA galaxies in the Vela Supercluster out to 32,000 km s−1, delimitedby (`,b) = (285◦−255◦;±10◦). The left panel shows a histogram of all galaxies, grey-shaded are galaxiesbelow the Plane. The right panel presents the redshift slice of same data. Red dots mark galaxies observedin our survey, blue dots redshifts in the literature (there is some overlap). The main two Walls of the VSCLare indicated.
The velocity histogram shows a highly significant peak centered at 17000− 19000 km s−1,with broad shoulders ranging from 15000− 23000 km s−1, typical of superclusters. Indeed, itsvelocity distribution is nearly indistinguishable from the one based on the systematic mapping ofthe Shapley supercluster (SSC) [29], one of the most massive superclusters in the nearby Universe.
2

PoS(MeerKAT2016)021
The VSCL MeerKAT survey Renée C. Kraan-Korteweg
The grey-shaded area marks galaxies below the plane, to highlight the similarity of the velocitydistribution on either side of the Plane, supporting continuity across the Plane.
The right panel displays the distribution of the same galaxies. The VSCL appears to consist ofa primary wall structure (W1) at ∼ 18 000 km s−1 that can be traced over most of the length of thewedge (some of the gaps in the wall are due to gaps in survey coverage – see also Fig. 2). There isa second wall (W2) at slightly higher distances. The main wall W1 is prominent on both sides ofthe Galactic plane; the slightly more distant wall is visible only below the Plane. Taking accountof the lack of data in wall W2 for `∼ 267◦−272◦, it seems likely that W2 merges with W1 around` ∼ 265◦. Numerous galaxy clusters (σ > 400 km s−1) are embedded within the walls.Only a feware evident as X-ray clusters. However, the analysis in [21] highlights that less than one X-raycluster would be expected in the ROSAT All Sky Survey given the constraints due to the Galacticforeground gas (which prevents detection at high gas column densities) as well as the Vela SNRfor a uniform density. Otherwise, the morphology of the structure is fully consistent with a large,possibly assembling, supercluster (see e.g. [7]).
The most interesting question now is: How does VSCL compare to the well-studied and super-massive SSC? Will it affect the motion of the Local Group? Can VSCL help explain the residualbulk flow results? A first attempt to derive a qualitative estimate of the overdensity – althoughlimited to the area where the data set is not too affected by foreground obscuration: |b| ∼> 6◦−10◦
– indeed confirms a substantial enhancement in galaxy counts (by a factor of f = 1.2 per square de-gree and magnitude bin), as well as a mass overdensity in a volume shell around the VSCL (δ ∼ 0.6)based on photometric redshifts which predicts a contribution to the LG motion of 50 km s−1. How-ever, this analysis should be regarded as preliminary, because of the current non-uniformity ofredshift sampling and the lack of data within the inner part of the ZOA.
2.2 Next steps in the exploration of VSCL
Despite the over 4200 new spectroscopic redshifts in the wider Vela ZOA survey region [21,20], the current spectroscopic coverage remains very sparse (∼ 15% of the area in which the VSCLappears prominent: `,b = 285◦− 255◦;±10◦), and was (is) feasible only for regions where theextinction is not too excessive (AB ∼< 3.m0). As a next step towards arriving at a more uniformspectroscopic coverage, a plan is in place to use the Taipan instrument [22] in science verificationmode in 2017 (led by M. Colless). Taipan is a new spectrograph with an innovative starbugs opticalfibre positioner on the 1.2m Schmidt telescope of the AAO, that can target up to ∼150 objects per6◦ field.
However, optical spectroscopy can not penetrate the very low-latitude regions where opticalextinction and/or star density are high. Here only systematic surveys in the 21cm neutral hydrogenline will prevail (see e.g. [35]). Current radio telescopes are not sensitive or fast enough. Butwith the SKA Pathfinders now coming online, considerably deeper systematic H I-surveys withincreased spatial resolution are within our reach. As detailed in the next sections, MeerKAT isan ideal instrument to unveil the most obscured part of the VSCL. The final system temperature ofMeerKAT (Tsys = 22 K), as measured on an actual MeerKAT dish (M063) are far superior comparedto the original specifications, making MeerKAT one of the current fastest radio telescopes at L-bandgiven its survey speed of Ae/Tsys = 424 m2/K [15] and resolution of about 10 arcsec for the full64-dish array. Our simulations have shown that a MeerKAT survey of VSCL can be realized within
3

PoS(MeerKAT2016)021
The VSCL MeerKAT survey Renée C. Kraan-Korteweg
reasonable timescales with the interim array of 32 dishes, hence in early science commissioning oropen time mode, and does not have to await the full 64-dish array. This makes a start in 2017 afeasible option.
3. Observational requirements for MeerKAT observations of VSCL
Our primary goal is to detect all galaxies at the VSCL distance with an H I mass of MHI ≥3× 10⁹ M�, i.e. half an order of magnitude below the characteristic H I-mass, log M∗HI = 9.8 M�[37]. With the H I-mass functions (HIMF) having their maximum H I-mass volume density aroundlog M∗HI, a statistically significant sample of gas-rich VSCL spiral galaxies can be expected. Spiralgalaxies are excellent tracers of large-scale structures like walls [17]. In addition, we can use theresulting HIMF above our H I-mass completeness limit, to determine the overdensity within theVSCL volume by scaling the H I masses to a well-calibrated H I-mass function. The so determinedoverdensity ought to be free of any dust obscuration effects that plague optical and even near-infrared surveys [14, 19], except possibly in areas of extreme continuum contamination [35]. The soderived overdensity can then be compared to the galaxy count enhancement and volume overdensityderived from extinction-corrected K◦-band counts, respectively photometric redshift shells [21],which find evidence for a significant galaxy and mass excess.
To calculate the sensitivity required to achieve this goal, we adopt a mean distance to VSCLof 260 h70 Mpc, which corresponds to the main peak in the radial velocity distribution of the VSCLoverdensity (cz ∼ 18 000 km s−1). The equivalent integrated flux density of a log MHI = 9.5 M�galaxy at that distance is FHI ∼ 0.2 Jy km s−1. Imposing the requirement that FHI be at a 5-σ levelwithin a 200 km s−1 line width, and assuming a channel width of 10 km s−1, the required noiselevel is σ ∼ 1 mJy/beam per channel. If we use the above mentioned MeerKAT survey speed, butfor the interim array of 32 dishes (M32), and enter that into the radiometer equation, an integrationtime of 30 minutes per pointing leads to a noise level of 1.03 mJy/beam – which obviously wouldreduce by a quarter for M64.
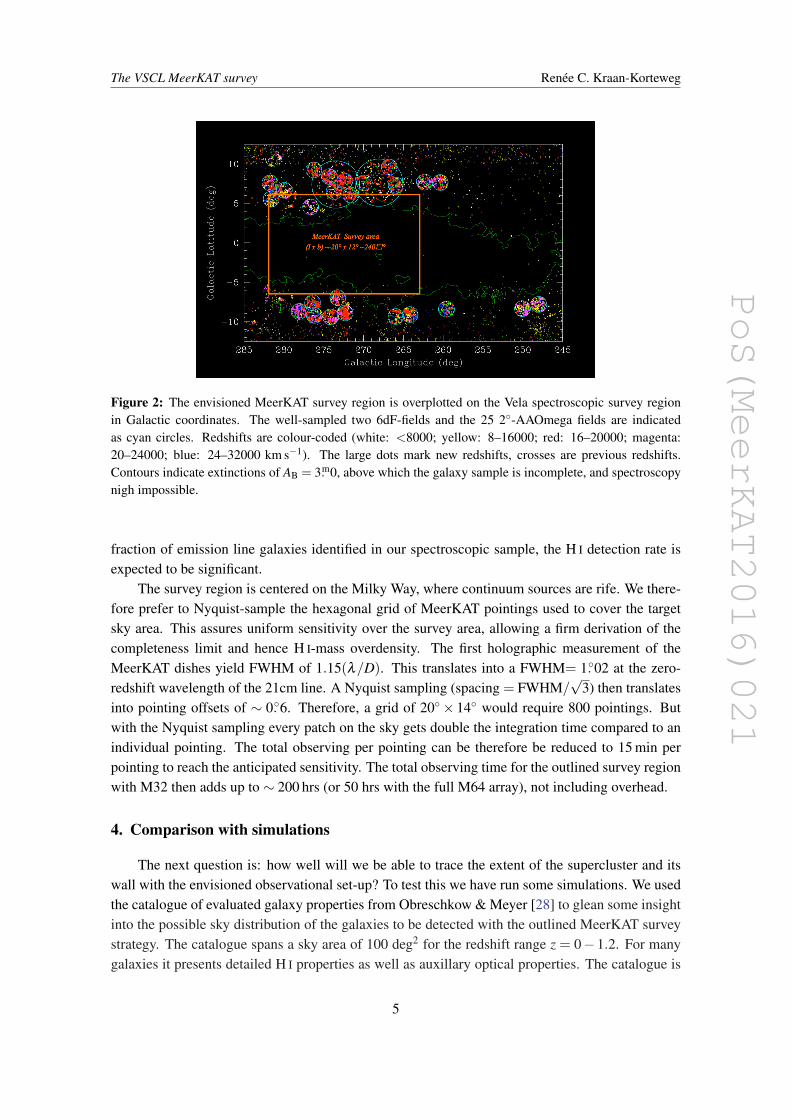
Pursuing this as a pilot project – and as a preparatory data set for the Fornax and LadumaMeerKAT surveys – we restrict ourselves here to the minimal area that will lead to a scientificallyinsightful map of the extent and morphology of the VSCL walls that are hidden behind the highestGalactic dust column densities (AB = 3.m0; see Fig. 2). The largest concentration of VSCL galaxieson either side of the Galactic Plane are encountered around ` ≈ 272◦. Figure 1 implies that bothVSCL walls W1 and W2 pass through the so defined MeerKAT survey region. It might encompassa merger or an intersection of these two walls at lowest latitudes. This is also suggested in maps ofthe large-scale structures close to the Galactic Plane based on photometric redshift maps [3, 21].If the latter is correct, it is highly probable to find a massive cluster at this intersection. Richclusters are normally found at the nodes of great-wall crossings, as evident in the cosmic web aswell simulations of structure formation [32].
To optimally capture this complex structure, we hence propose a pilot survey area of about20◦×14◦ centered on (`,b) = (272◦,0◦). The reason for surveying up to the latitudes of b =±7◦
rather rather than b ≤ ±5◦ is the resulting overlap with the existing spectroscopic data set. Thisallows us to tie the ’blind’ H I-survey data to the spectroscopically surveyed region. With the large
4
PoS(MeerKAT2016)021
The VSCL MeerKAT survey Renée C. Kraan-Korteweg
Figure 2: The envisioned MeerKAT survey region is overplotted on the Vela spectroscopic survey regionin Galactic coordinates. The well-sampled two 6dF-fields and the 25 2◦-AAOmega fields are indicatedas cyan circles. Redshifts are colour-coded (white: <8000; yellow: 8–16000; red: 16–20000; magenta:20–24000; blue: 24–32000 km s−1). The large dots mark new redshifts, crosses are previous redshifts.Contours indicate extinctions of AB = 3.m0, above which the galaxy sample is incomplete, and spectroscopynigh impossible.
fraction of emission line galaxies identified in our spectroscopic sample, the H I detection rate isexpected to be significant.
The survey region is centered on the Milky Way, where continuum sources are rife. We there-fore prefer to Nyquist-sample the hexagonal grid of MeerKAT pointings used to cover the targetsky area. This assures uniform sensitivity over the survey area, allowing a firm derivation of thecompleteness limit and hence H I-mass overdensity. The first holographic measurement of theMeerKAT dishes yield FWHM of 1.15(λ/D). This translates into a FWHM= 1.◦02 at the zero-redshift wavelength of the 21cm line. A Nyquist sampling (spacing = FWHM/
√3) then translates
into pointing offsets of ∼ 0.◦6. Therefore, a grid of 20◦× 14◦ would require 800 pointings. Butwith the Nyquist sampling every patch on the sky gets double the integration time compared to anindividual pointing. The total observing per pointing can be therefore be reduced to 15 min perpointing to reach the anticipated sensitivity. The total observing time for the outlined survey regionwith M32 then adds up to ∼ 200 hrs (or 50 hrs with the full M64 array), not including overhead.
4. Comparison with simulations
The next question is: how well will we be able to trace the extent of the supercluster and itswall with the envisioned observational set-up? To test this we have run some simulations. We usedthe catalogue of evaluated galaxy properties from Obreschkow & Meyer [28] to glean some insightinto the possible sky distribution of the galaxies to be detected with the outlined MeerKAT surveystrategy. The catalogue spans a sky area of 100 deg2 for the redshift range z = 0−1.2. For manygalaxies it presents detailed H I properties as well as auxillary optical properties. The catalogue is
5

PoS(MeerKAT2016)021
The VSCL MeerKAT survey Renée C. Kraan-Korteweg
based on the SKA Simulated Skies semi-analytic simulations, and therefore on the physical modelsdescribed in a series of papers led by Obreschkow [25, 26, 27].
From the catalogue we extract the properties of all galaxies spanning a sky area of 30 deg2
within the redshift range z = 0.048− 0.073 (cz ∼ 15000− 22500 km s−1), i.e. the full velocityrange within which the Vela supercluster raises its head (see Fig. 1). The left panel of Fig. 3shows the distribution of all 5072 galaxies (including early type galaxies) in that volume range.Interestingly, this simulation reveals a wall-like structure with a massive cluster embedded rightat the VCSL distance, with some additional filamentary structures that host smaller clusters andgroups. The central panel now shows all the galaxies we expect to detect with MeerKAT32 for anintegration of 15min per pointing for a Nyquist sampled grid. The small, green filled circles arethe galaxies that are more H I-rich than our survey completeness limit of log MHI = 9.5 M� – 118objects over the 30 deg2 of the simulation. The larger, red filled circles mark galaxies that have aflux density greater than 5-σ for any observed line-width larger than 10 km s−1. There are 465 suchobjects. Their MHI reaches down to∼ 8×10⁸ M� although the sample is incomplete down to theselevels. The panel on the right shows the red and green sub-samples together with the full sampleof 5072 galaxies. The simulations clearly show, that we will recover the major walls very wellthrough the detection of their more H I-massive spirals. We also recover the thinner filaments verywell. Not surprisingly, the detection rate is low in the highest density clusters, which is dominatedby early type galaxies, and may also be affected by gas loss through ram pressure stripping or othergas removal processes caused by the dense environment.
Figure 3: Sky distribution of galaxies from the Obreschkow & Meyer catalogue, spanning the redshift rangez = 0.048−0.073. Left panel: all 5072 galaxies in the volume. Centre panel: galaxies that have an averageflux density greater than 5σ in a channel of frequency width d f = 47 kHz (filled red circles) and galaxiesmore massive than log MHI ≥ 9.5 M� (smaller filled green circles). Right panel: all data from left and centrepanels shown together.
It is satisfactory to note, that we will not suffer from spatial confusion. The simulations revealthat the typical separation between H I-massive galaxies peaks around 10 arcmin, while there arevirtually none that lie closer to each other than 60 arcsec, hence much farther apart than the angularseparation that we will obtain with either M32 or M64. (Of course, even sources relatively close onthe sky will generally have a significantly different velocity along the line of sight at the proposedresolution of ∼ 10 km s−1.)
6

PoS(MeerKAT2016)021
The VSCL MeerKAT survey Renée C. Kraan-Korteweg
The data were extracted from simulations within an area of 30 square degrees. The proposedVSCL MeerKAT survey area will be a factor of f = 9.3 higher, hence also the predicted numberof H I detections. This therefore leads to a total of 4330 galaxies above the 5σ -treshhold, and1100 galaxies above the H I mass completeness limit of log MHI ≥ 9.5 M�. Note that this willconstitute a lower limit ’if’ this region is similarly overdense as the latitude strips above and belowthe MeerKAT survey region (a factor of f = 1.2 in galaxy counts, and a volume overdensity in ashell around VSCL of δ ∼ 0.6 [21]). In either case, the number of H I detections will be more thansufficient to determine an overdensity based on the HIMF.
While the survey strategy is optimised for uncovering the obscured part of the VSCL, the ob-servations will use the full L-band frequency range of the receiver. This will allow ample testingfor other planned H I MeerKAT surveys, like Fornax and Laduma:– Fornax: The number of detections at the lower redshifts is substantial, including a large numberof low-MHI dwarfs. For instance, looking at the 5-σ detection rate of galaxies within a volumedelimited by cz < 5000 km s−1, we should uncover around 1200 galaxies above an H I-mass com-pletion limit of MHI ≥ 108 M�, the majority of them dwarfish (below ∼< 109 M�). The pipeline(mosaic) testing and exploration of this data set will prove of interest to the Fornax team [30].– Laduma: The simulations reveal that the number of HI-massive galaxies, generally defined asgalaxies with H I-masses above log MHI ≥ 10.0 M� (e.g. [6]), will yield around 3000 galaxies upto the redshifts of z < 0.2, with a further 1000 H I-massive galaxies between the redshift range0.2 < z < 0.5 – if such massive H I-galaxies do exist in equally high numbers in the earlier Uni-verse. Hence a highly interesting test bed towards the Laduma science goals of galaxy and HIMFevolution, and a challenging test of the available software tools for extracting galaxies at these highredshifts from this pilot MeerKAT data set.
5. Summary
The recently unveiled Vela supercluster [21] belongs amongst the more massive and extendedsuperclusters in the nearby Universe. Its overdensity is evident over a large area on the sky (25◦×20◦, respectively ∼ 115×90 h70 Mpc). Calculations find that its contribution to the motion of theLG might be as large as 50 km s−1, decreasing the misalignment angle with the CMB dipole byabout ∼ 20−25%. This analysis is based on a spectroscopic skeleton sampling over the originallysuspected extent of the supercluster [21, 20], assuming continuity of structures across the innermostpart of ZOA, where the thickness of the dust column densities prevent further optical spectroscopy.
We have presented a MeerKAT survey scenario to map the VSCL across this obscured bandand get a full census of the supercluster, its morphology and mass. We have shown that a Nyquist-sampled survey region covered by 800 pointings (15 min per pointing) will yield the sensitivity tomap the supercluster through the detection of its gas-rich spiral galaxy population, and an overden-sity determination through HIMF fitting. The optimal survey region of (`,b)∼ (272◦±10◦,0◦±7◦;280 square degrees) could be covered with M32 in 200 hrs. We highlight the use of the M32 arrayfor this survey as an early science project given its high-impact cosmological implications on theone side, and its suitability as precursor for the planned MeerKAT H I-surveys, in particular Fornaxand Laduma, on the other hand.
7

PoS(MeerKAT2016)021
The VSCL MeerKAT survey Renée C. Kraan-Korteweg
Acknowledgements
All South African authors acknowledge the research support they received from the SouthAfrican NRF; E.E., B.F. thank the SA SKA Office as well. We are grateful to the other mem-bers of the original VSCL discovery team (M. Bikicki, M. Colless, A. Elagali, H. Boehringer, G.Chon), and thank Laura Richter from the SA SKA Office for useful discussions. The VSCL super-cluster redshift results are based on observations taken at the AAO, as well as data obtained withSALT. This publication makes use of data products from the Two Micron All Sky Survey, whichis a joint project of the University of Massachusetts and the Infrared Processing and AnalysisCenter/California Institute of Technology, funded by the National Aeronautics and Space Admin-istration and the National Science Foundation.
References
[1] Barnes D. G., et al., 2001, MNRAS, 322, 486
[2] Bilicki M., Chodorowski M., Jarrett T., Mamon G. A., 2011, ApJ, 741, 31
[3] Bilicki M., Jarrett T. H., Peacock J. A., Cluver M. E., Steward L., 2014, ApJS, 210, 9
[4] Blyth S., Baker A., Holwerda, B. et al., 2016, these proceedings
[5] Carrick J., Turnbull S.J., Lavaux G., Hudson M.J., 2015, MNRAS, 450, 317
[6] Catinella, B., Cortese L., 2015, MNRAS, 446, 3526
[7] Einasto M., Lietzen H., Tempel E., Gramann M., LiivamÃd’gi L. J., Einasto J., 2014, A&A, 562, A87
[8] Erdogdu P., et al., 2006, MNRAS , 368, 1515
[9] Fixsen D. J., Cheng E. S., Gales J. M., Mather J. C., Shafer R. A., Wright E. L., 1996, ApJ, 473, 576
[10] Huchra J. P., et al., 2012, ApJS, 199, 26
[11] Hudson M. J., Smith R. J., Lucey J. R., Branchini E., 2004, MNRAS, 352, 61
[12] Hoffman Y., Courtois H. M., Tully R. B., 2015, MNRAS, 449, 4494
[13] Jarrett T., 2004, PASA, 21, 396
[14] Jarrett T. H., Chester T., Cutri R., Schneider S., Skrutskie M., Huchra J. P., 2000, AJ, 119, 2498
[15] Justin, J. et al., 2016, these proceedings
[16] Kocevski D. D., Ebeling H., 2006, ApJ, 645, 1043
[17] Koribalski B. S., et al., 2004, AJ, 128, 16 osmological Structures behind the Milky Way.
[18] Kraan-Korteweg R. C., Lahav O., 2000, A&ARv, 10, 211
[19] Kraan-Korteweg R. C., Jarrett T., 2005, ASPC, 329, Fairall
[20] Kraan-Korteweg R. C., Jarrett T. H., Elagali A., Cluver M. E., Bilicki M., Colless M. M., Proceedingsof the SALT Science Conference 2015 (SSC2015), POS 40
[21] Kraan-Korteweg R. C., Cluver M. E., Bilicki M., et al. 2016, MNRAS Letter in press; arXiv:1611.04615
[22] Kuehn K., et al., 2014, SPIE, 9147, 914710
8

PoS(MeerKAT2016)021
The VSCL MeerKAT survey Renée C. Kraan-Korteweg
[23] Loeb A., Narayan R., 2008, MNRAS, 386, 2221
[24] Nusser A., Davis M., 2011, ApJ, 736, 93
[25] Obreschkow, D., Croton, D., De Lucia, G., Khochfar, S., & Rawlings, S. 2009, ApJ , 698, 1467
[26] Obreschkow D., Heywood I., Klöckner H.-R., Rawlings S., 2009b, ApJ , 702, 1312
[27] Obreschkow D., Klöckner H.-R., Heywood I., Levrier F., Rawlings S., 2009c, ApJ , 703, 1890
[28] Obreschkow, D., & Meyer, M. 2014, arXiv:1406.0966
[29] Proust D., et al., 2006, A&A, 447, 133
[30] Serra, P. et al., 2016, these proceedings
[31] Scrimgeour M. et al., 2016, MNRAS, 455, 386
[32] Springel V., et al., 2005, Natur, 435, 629
[33] Springob C. M., et al., 2014, MNRAS, 445, 2677
[34] Springob C. M., et al., 2016, MNRAS, 456, 1886
[35] Staveley-Smith L., Kraan-Korteweg R. C., Schröder A. C., Henning P. A., Koribalski B. S., StewartI. M., Heald G., 2016, AJ, 151, 52
[36] Turnbull S. J., Hudson M. J., Feldman H. A., Hicken M., Kirshner R. P., Watkins R., 2012, MNRAS,420, 447
[37] Zwaan M. A., Meyer M. J., Staveley-Smith L., Webster R. L., 2005, MNRAS, 359, L30
9