Embed Size (px)
Citation preview

JOURNAL OF SOFTWAREMAINTENANCE AND EVOLUTION: RESEARCH AND PRACTICEJ. Softw. Maint. Evol.: Res. Pract. 2008; 20:59–76Published online 5 November 2007 inWiley InterScience (www.interscience.wiley.com). DOI: 10.1002/smr.362
Research
Towards a deeperunderstanding of test coverage
Teemu Kanstren∗,†
VTT Technical Research Center of Finland, P.O. Box 1100, Kaitovayla 1, OuluFI-90571, Finland
SUMMARY
Test coverage is traditionally considered as how much of the code is covered by the test suite in whole.However, test suites typically contain different types of tests with different roles, such as unit tests,integration tests and functional tests. As traditional measures of test coverage make no distinction betweenthe different types of tests, the overall view of test coverage is limited to what is covered by the testsin general. This paper proposes a quantitative way to measure the test coverage of the different partsof the software at different testing levels. It is also shown how this information can be used in softwaremaintenance and development to further evolve the test suite and the system under test. The techniqueis applied to an open-source project to show its application in practice. Copyright © 2007 John Wiley &Sons, Ltd.
Received 3 July 2006; Revised 18 September 2007; Accepted 19 September 2007
KEY WORDS: test granularity; level of testing; test optimization; test coverage
1. INTRODUCTION
Test suites typically contain different types of tests such as unit tests, integration tests and systemtests. In practice this means that test suites consist of test cases that exercise the system under test(SUT) at varying granularities. Some exercise smaller parts of the SUT at a finer granularity, whileothers exercise larger parts at a coarser granularity. The spread and ratio of these different types oftests vary for different test suites and different parts of the SUT. Some suites may contain fewer teststhat exercise larger parts of the SUT and some suites contain more tests that exercise smaller partsof the SUT. In both software development and maintenance, different types of tests have differentbenefits and roles, such as verifying the functionality of individual components, confirming theirinteractions and aiding in debugging.
∗Correspondence to: Teemu Kanstren, VTT Technical Research Center of Finland, P.O. Box 1100, Kaitovayla 1, OuluFI-90571, Finland.†E-mail: [email protected]
Copyright q 2007 John Wiley & Sons, Ltd.

60 T. KANSTREN
Traditional measures of test coverage focus on measuring how much of the total SUT has beenexercised by the test suite. Various coverage measures include measures such as statement, pathand decision coverage [1]. These traditional types of code coverage are useful for seeing whichparts are not yet under test and for getting an overview of how much of the SUT is tested ingeneral. However, once previously uncovered code is brought under test, traditional code coveragemeasures only tell us that the code is covered by some test in the test suite. These measures do nottell anything about the types of tests exercising the piece of code. Thus, if we want to understandbetter how the SUT is covered by different types of tests, the traditional view of test coverage doesnot provide a good view for this purpose.This paper proposes a way to get a deeper understanding of testing for the different parts of the
SUT. Instead of considering howmuch of the SUT is covered by the test suite in total, it is consideredhow the different parts of the SUT are covered at the different levels of testing. A measure for thelevel of testing for the different parts of the SUT is defined and it is shown how this measure canbe used during software maintenance and evolution to get a deeper understanding of the testing forthe SUT and to evolve the existing test suite. The measure is applied to an open-source software(OSS) project to demonstrate its application in practice.This paper is structured as follows. The next section discusses the basic concepts and describes
the measure used in this paper. Section 3 shows how the measure has been implemented in practice.Section 4 applies the measure to an OSS project and analyses the results. Section 5 discusses thebenefits and problems in applying the measure. Section 6 reviews related work in literature. Finally,Section 7 discusses conclusions and future work.
2. LEVELS OF TESTING
This paper uses the term test granularity to refer to the number of units of production code includedin a test case (such as ‘three methods’). The term level of testing is used to refer to a number oftest granularity measures grouped together. For example, if we use the size 10 for a single level oftesting, all tests with granularity 1–10 will belong to level 1 and all tests with granularity 11–20will belong to level 2. If we use size ‘1’ for the size of testing level, all tests will be mapped to thesame testing level as their granularity (granularity 1 equals test level 1, granularity 2 equals level 2and so on). However, also in this case, several tests can still be mapped to the same level if theyhave the same granularity. It is possible to vary this measure according to the goal of the analysis.The different concepts to be taken into account in defining this measure will be discussed in thispaper.
2.1. Roles for the levels of testing
The role of testing in general can be defined as exercising the SUT with different inputs in orderto reveal possible errors [1–3]. Test suites are composed of different types of tests, all of whichhave their own roles in testing and debugging the system. Rothermel et al. [4] have provided asurvey of literature on advice about test granularity. This survey shows some contradictory adviceon when to apply tests at different granularities. For example, Beizer [2] suggests that it is betterto use several simple tests and Kit [5] suggests that large test cases are preferable when testing
Copyright q 2007 John Wiley & Sons, Ltd. J. Softw. Maint. Evol.: Res. Pract. 2008; 20:59–76DOI: 10.1002/smr

TOWARDS A DEEPER UNDERSTANDING OF TEST COVERAGE 61
valid inputs for which failures should be infrequent. However, even though the advice on applyingtesting at different granularities shows some contradiction, there is generally an agreement on theroles of the different levels of testing.Focused tests at a finer granularity run fast, focus on the cause of failure and make it possible to
cover difficult paths of execution [1–4,6–8]. Thus, their role is best at verifying the finer details of acomponent’s inner working and in debugging of faults. However, getting high coverage with smalltests is expensive and verifying that individual components work in isolation does not tell whetherthey work correctly together. This means trade-offs need to be made in implementing focused tests.Higher-level tests are required to verify the behaviour of the smaller parts as a whole and to
validate the higher-level functions and properties expected from the system [1–4]. With higher levelof testing it is less expensive to get a high test coverage as the tests cover larger parts. The trade-off is in verifying the finer details of the components and in debugging the cause of the failures.Covering complex details of small parts is difficult with large test cases and debugging can be timeconsuming when we only know that the fault is somewhere in the large portion of code executed.For best results we need tests at lower and higher levels, where they are most useful. To be able
to evolve the test suite and determine how the different parts of the code are exercised by test casesat different levels, we must be able to measure the levels of testing performed on the different partsof the SUT. As, during software maintenance and evolution, these parts and the test coverage ofthe regression test suite are likely to change, this analysis must be possible to be automated andrepeated as much as possible. Measuring the test coverage at the different levels of testing is wherethe traditional coverage measures fail, as they do not give any information on how a piece of codeis covered, only that it is covered in some way by the test suite.To address this problem, this paper describes a technique for measuring how the different parts of
the software are tested at different levels and builds on this to help make more informed decisionsabout where and how to focus future testing effort. However, before measuring these values, themeasure of testing level and how it is related to the previous definitions in the literature is defined.Since the interest in this paper is in automating the measurement as far as possible, the definitionsare reviewed from the viewpoint of how they can be measured automatically from test execution.
2.2. Defining the levels of testing
In the traditional testing literature, testing is divided into two basic types of testing: white box testingand black box testing [1,2,5]. These are further divided into more specific types, so that white boxtesting typically includes unit testing and parts of integration testing and black box testing typicallyincludes acceptance tests, functional tests, system tests and higher-level integration tests. White boxtests are typically considered to be lower-level tests and black box tests to be higher-level tests.For quantitative measurement of test granularity, these types of classifications are problematic.
The scope of a unit in a unit test can be defined to be, for example, a method, a class, a clusterof classes, a subroutine or a subprogram [1–3,5,9]. Similarly, integration testing can combine anynumber of these different units. By these definitions both unit tests and integration tests can includedifferent sizes of groups of methods or classes in the SUT. Thus, by looking at the code executedby a test it is not possible to tell when a test stops being a unit test and becomes an integration test,or the other way around. Similarly, black box tests can exercise a small or large amount of codedepending on how the tested functionality is spread in the code.
Copyright q 2007 John Wiley & Sons, Ltd. J. Softw. Maint. Evol.: Res. Pract. 2008; 20:59–76DOI: 10.1002/smr

62 T. KANSTREN
Rothermel et al. [4] have used a definition of granularity based on the test case input. Theirmeasure of granularity is based on the size of the test cases, with the size being measured by thenumber or amount of input applied per test case. A test case with more input is a test case of ahigher granularity than a test case with less input. This measure can be used to classify the testcases by their granularity. However, this measure does not tell us anything about the size of codeexecuted by a test case. The amount or number of input is not tied to the size of code used toprocess it, as small or large amounts of input can be processed by small or large amounts of code.This paper defines the testing level by giving each test case a numerical measure based on
how many different units of code, such as classes, methods or lines of code (LOC), are exercisedin the test case. Similarly, any measure central to a system’s functionality, such as messages orevents in a message- or event-based system, could be used. Any of these can be used to define thetest granularity and thus the level of testing for the code exercised by the test case. This gives aquantitative, automatically measurable, measure of the granularity of each test case, which can thenbe used to evaluate the levels of testing for the different parts of the SUT. For example, when usingthe detail level of methods, when a test case exercises code from 10 methods its granularity is 10.When it exercises code in 20 methods, its granularity is 20. Once these granularities are mappedto testing levels, these levels can be ordered and compared for all parts and systems as long as thesame measure of classes, methods, LOC or combination of these is used for each test.
3. MEASURING THE TESTING LEVELS
The measurement data for the testing levels described in this paper are gathered in two steps. Inthe first step, all the test cases for the SUT are executed and the coverage information for eachtest case is gathered. The coverage information provides the granularity of the test cases, whichis needed for the second step. In the second step, the level of testing for the different parts of thesystem is calculated. This process is described in more detail in this section, starting with step 1and followed by step 2.
3.1. Measuring the granularity of test cases
The components and the process used to gather the data for the first step are described in Figure 1.It describes an implementation for the Java platform as used in this paper. The used JUnit [10] andAspectJ [11] components are freely available OSS components and the measurement can also beimplemented on any platform that has similar components available. Other approaches to collect theexecution traces of the test cases also include tracing through special debugging interfaces providedby the platform [12] or using a common code coverage tool to measure the coverage for each testcase [13]. As a data store it is possible to use, for example, the file system or a database. Both weresuccessfully prototyped for this paper.The production code is first instrumented to produce trace events for all method calls. Then, the
test cases are iterated and coverage data for each test case are collected, until all test cases havebeen executed. This measurement can provide data for telling which LOC were executed, whichmethods were called and which classes were used in each test case. Here AspectJ has been usedfor tracing, which provides support for custom trace code. The used detail level of method calls
Copyright q 2007 John Wiley & Sons, Ltd. J. Softw. Maint. Evol.: Res. Pract. 2008; 20:59–76DOI: 10.1002/smr

TOWARDS A DEEPER UNDERSTANDING OF TEST COVERAGE 63
JUnit TestFramework
Test Cases
ProductionCode
Trace Code
AspectJWeaver
1. Instrument code2. Run tests3. Exercise code4. Generate trace events5. Generate test events6. Store coverage for test case7. Repeat steps 2-6 for all test cases
1.
2.
3.5.
4.
Data Store
6.
Figure 1. Measuring data for step 1.
provides a compromise between very fine detail (LOC) and coarse detail (classes). While usingaspects to trace at the LOC level is not straightforward, it is possible to implement LOC levelmeasurement by using a code coverage tool and this was successfully experimented with duringthis study. For different interests it is possible to vary the level of detail used while the rest of theprocess remains unchanged. Once these data are collected, it is possible to move on to the secondstep.
3.2. Associating the tests with tested parts
The second step is illustrated in Figure 2. This figure shows a simple example system consisting offour methods in two classes and four test cases. By having measured which parts of the code areexecuted by which test cases, we have collected the information presented in the figure. Test casegranularity is calculated by adding up the number of methods executed by each test. This informationis shown in Table I. The number of methods tested at the given granularities are calculated simplyby adding up the unique methods covered by tests at given granularities. This information is shownin Table II.While the figure shows the associations between the tests and the methods, the actual path of
execution can be anything as long as the method is executed as a part of running the test. Where themethods are invoked from makes no difference, as the measurement system will record any call tothe observed methods while the test case is executed. It can be invoked, for example, from the testcase or from any other production code. The set of observed methods can be limited, for example,by instrumenting only the parts of interest for coverage or by filtering the collected data.Once we have associated each test case to the code it executes, we can calculate the metrics on
how each method is tested. For example, to calculate the lowest level of testing for each method,we first find the smallest granularity from the test cases associated with the method. This tells us themost focused test case for that part of the code. Once this is known, the granularity value needs tobe mapped to the testing levels, which shows the lowest level of testing for that method. Similarly,it is possible to get the highest level of testing by finding the maximum associated value.
Copyright q 2007 John Wiley & Sons, Ltd. J. Softw. Maint. Evol.: Res. Pract. 2008; 20:59–76DOI: 10.1002/smr

64 T. KANSTREN
Figure 2. Associating tests with the parts of software executed.
Table I. Test granularities.
Test Granularity
Test1 1Test2 3Test3 2Test4 2
Table II. Method count at different granularities.
Granularity Number of methods
1 12 33 3
Table III. Test granularities for the methods.
Method name Min Max
Class A::Method1 1 3Class A::Method2 2 2Class A::Method3 3 3Class B::Method1 2 3
For Figure 2, using testing level size 1 (mapping the test granularity directly to the same level),the lowest and highest testing levels are shown in Table III. For example, Class A::Method1is associated with test cases Test1, Test2 and Test3. As Test1 has the smallest granularity of these,
Copyright q 2007 John Wiley & Sons, Ltd. J. Softw. Maint. Evol.: Res. Pract. 2008; 20:59–76DOI: 10.1002/smr
TOWARDS A DEEPER UNDERSTANDING OF TEST COVERAGE 65
the lowest level of testing (min) for this method is 1. As Test2 has the highest granularity (3) ofthese, the highest level of testing (max) is 3. Similarly, Class B::Method1 is associated withtest cases Test2 and Test4. Thus, the min and max values are accordingly 2 (Test4) for the lowestlevel and 3 (Test2) for the highest level.
4. EVALUATING AND EVOLVING A TEST SUITE
As an example of applying the technique, the test suite of PMD [14], an OSS Java source code anal-ysis tool, is analysed in this section. To help put the measurement data in context, the total numberof tests, classes, methods and source LOC (SLOC, LOC excluding whitespace and comments) forthe project are shown in Table IV. To collect the coverage information for the testing levels, thetest suite for the project has been executed, the granularity of all test cases has been measured andthese data have been mapped to the methods in the SUT as described in Section 3. Thus, the infor-mation needed to calculate the different levels of testing performed for all methods in the SUT isavailable.
4.1. Testing levels—an overview
To get an overview of the testing at the different levels, the first step is to look at how much of theSUT has been covered at the different levels. This provides a basic overview of the testing doneat different levels as a total and shows whether there is, for example, a lack of low- or high-leveltesting in general. Using the overview data as history information also makes it possible to trackthe evolution of the levels of testing over time. However, as discussed earlier, taking the analysisof this testing data further poses the question of what size to use for the testing level. If we simplyuse size 1 for each testing level (mapping the granularities directly to test levels), the overview willdescribe too many details and not give the high-level overview we are interested in. As an example,Table V lists the number of PMD methods tested at granularities 1–10 and 21–30.At the lower granularity of 1–10, we see a large number of tests and methods covered at each
granularity. However, as we move to higher test granularities, we start to see a higher spread ofthe tests as shown already by the tests at granularity 21–30. Here there are at most two tests at agiven granularity. This spread of tests is further amplified the more we move towards the highergranularities. The highest granularity for a single PMD test case is 834. The complete spread ofthe number of tests at different granularities is illustrated in Figure 3, which shows a histogram
Table IV. Project metrics.
Metric Total
Tests 781Classes 629Methods 4073SLOC 38 790
Copyright q 2007 John Wiley & Sons, Ltd. J. Softw. Maint. Evol.: Res. Pract. 2008; 20:59–76DOI: 10.1002/smr

66 T. KANSTREN
Table V. PMD Number of methods (NOMs) covered and numberof tests (NOTs) at levels 1–10 and 21–30.
Level Number of methods Number of tests
1 9 142 44 393 39 174 50 165 50 226 38 87 58 178 24 39 64 13
10 95 1221 23 222 44 223 23 124 25 225 25 126 0 027 27 128 0 029 58 230 30 1
Figure 3. Number of tests at different granularities.
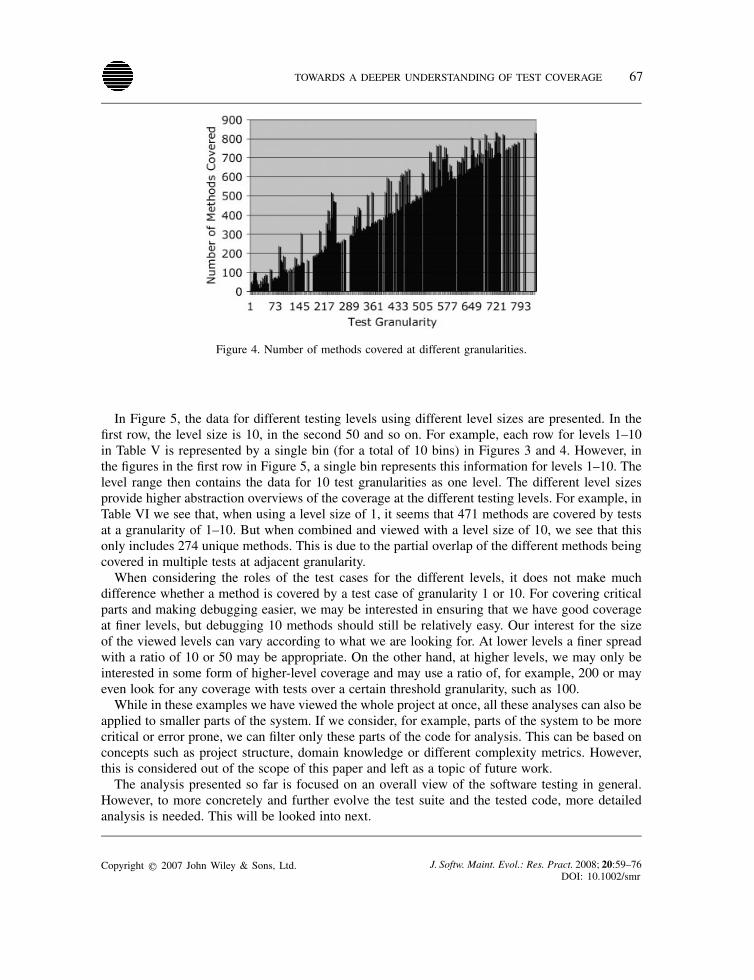
of the number of tests at different granularities. Figure 4 shows the number of methods coveredat each granularity. Figure 5 shows how the data can be summarized to describe tests at multiplegranularities to single testing levels, and to provide a better high-level overview.
Copyright q 2007 John Wiley & Sons, Ltd. J. Softw. Maint. Evol.: Res. Pract. 2008; 20:59–76DOI: 10.1002/smr
TOWARDS A DEEPER UNDERSTANDING OF TEST COVERAGE 67
Figure 4. Number of methods covered at different granularities.
In Figure 5, the data for different testing levels using different level sizes are presented. In thefirst row, the level size is 10, in the second 50 and so on. For example, each row for levels 1–10in Table V is represented by a single bin (for a total of 10 bins) in Figures 3 and 4. However, inthe figures in the first row in Figure 5, a single bin represents this information for levels 1–10. Thelevel range then contains the data for 10 test granularities as one level. The different level sizesprovide higher abstraction overviews of the coverage at the different testing levels. For example, inTable VI we see that, when using a level size of 1, it seems that 471 methods are covered by testsat a granularity of 1–10. But when combined and viewed with a level size of 10, we see that thisonly includes 274 unique methods. This is due to the partial overlap of the different methods beingcovered in multiple tests at adjacent granularity.When considering the roles of the test cases for the different levels, it does not make much
difference whether a method is covered by a test case of granularity 1 or 10. For covering criticalparts and making debugging easier, we may be interested in ensuring that we have good coverageat finer levels, but debugging 10 methods should still be relatively easy. Our interest for the sizeof the viewed levels can vary according to what we are looking for. At lower levels a finer spreadwith a ratio of 10 or 50 may be appropriate. On the other hand, at higher levels, we may only beinterested in some form of higher-level coverage and may use a ratio of, for example, 200 or mayeven look for any coverage with tests over a certain threshold granularity, such as 100.While in these examples we have viewed the whole project at once, all these analyses can also be
applied to smaller parts of the system. If we consider, for example, parts of the system to be morecritical or error prone, we can filter only these parts of the code for analysis. This can be based onconcepts such as project structure, domain knowledge or different complexity metrics. However,this is considered out of the scope of this paper and left as a topic of future work.The analysis presented so far is focused on an overall view of the software testing in general.
However, to more concretely and further evolve the test suite and the tested code, more detailedanalysis is needed. This will be looked into next.
Copyright q 2007 John Wiley & Sons, Ltd. J. Softw. Maint. Evol.: Res. Pract. 2008; 20:59–76DOI: 10.1002/smr

68 T. KANSTREN
Figure 5. Spread using different test level sizes.
Copyright q 2007 John Wiley & Sons, Ltd. J. Softw. Maint. Evol.: Res. Pract. 2008; 20:59–76DOI: 10.1002/smr

TOWARDS A DEEPER UNDERSTANDING OF TEST COVERAGE 69
Table VI. Method counts for different level sizes.
Level size Range Number of methods
1 1–10 4711 1–50 189610 1–10 27410 1–50 104050 1–50 603
4.2. More detailed analysis—evolving the tests and code
Analysing in detail the way the production code is covered provides opportunities for both opti-mizing the test suite and optimizing the production code. We can improve the test suite by imple-menting new test cases at different levels where needed, and by removing and combining overlappingtests. We can improve the production code by identifying the redundant code and, by adding newtests to identify possible problems, increasing our confidence on code quality. As we are interestedin more detailed analysis, the view in this case is also focused on more detailed analysis. Thus, inthis subsection, the test granularity is also used as the testing level, which gives the most detailedinformation available.From the overview analysis it is possible to find interesting focus areas for analysis. For example,
one interesting aspect from the overview at the finest level presented in Figure 3 is the peak at levelsaround 70. The detailed information for this data is presented in Table VII. The interesting aspectof this data is that, for each granularity in 70–73, there are exactly the same number of uniquemethods covered as the test granularity. As there are a number of tests at each of these granularities,it means that all these tests at the same granularity are executing the same methods. Thus, thetests are simply exercising the exact same functionality with different inputs. With up to 24 testsat a single granularity all exercising the same functionality, these tests provide good candidates toconsider for trimming the test suite for excess tests by removing or combining separate test cases.To find the methods that should be considered for further testing at a lower level, the methods
in the chosen part of the SUT must first be analysed to see which of them are not tested at a lowerlevel. To find which methods are only exercised as part of high-level tests and not tested at a finegranularity, for each method, the lowest level of testing is first taken for analysis. By ordering allthe methods by this level (a simple sorting), all that needs to be done is to look at the methodswith the highest values and these are the methods to be considered first. A sample of these topcandidates is shown in Table VIII.To conserve space, the table lists only one method from a class if there are multiple methods in
the same class at the same testing level. For example, there are three methods (CM in the table) inthe class ast.JavaParser that are each tested at the finest level (Min in the table) as a part ofa test case which exercises 834 methods. As these metrics describe some of the largest test cases inthe test suite, and variation in test size at this level is high, the methods in the same class and at thesame level are likely executed in the same test case. As a note on the different methods, by lookingat the source code and its comments, it is clear that all the code in the ast package is generatedby a parser generator. Thus, the ast package code is not considered here for further testing as itconsists solely of generated code, and testing it would mean testing the parser generator.
Copyright q 2007 John Wiley & Sons, Ltd. J. Softw. Maint. Evol.: Res. Pract. 2008; 20:59–76DOI: 10.1002/smr

70 T. KANSTREN
Table VII. Data for levels 69–74.
Testing level Number of tests Number of methods
69 0 070 24 7071 6 7172 22 7273 20 7374 0 0
Table VIII. Largest minimum levels for methods.
Method name Min CM
ast.JavaParser.jj 3R 120() 834 3strings.ConsecutiveLiteralAppends.getSwitchParent(Node, Node) 802 9rules.ConstructorCallsOverridableMethod.MethodInvocation.isSuper() 785 37design.ImmutableField.inLoopOrTry(SimpleNode) 773 6strings.InsufficientStringBufferDeclaration.isLiteral(String) 768 11
To consider these methods further, the roles of testing at different levels need to be consid-ered. The roles defined for lower-level testing in Section 2 were aiding in debugging andverifying the finer details of the method’s inner workings. Thus, for debugging, if there is afault in any of these methods, it will be much more difficult to find the cause of failure as thefailure will only show as a part of a large test. For example, if there is a fault in the methodConsecutiveLiteralAppends.getSwitchParent(Node,Node), the best indicator is atest that exercises 802 methods. Thus, finding the cause of failure requires looking into all thesemethods. Also, if a method tested only at this level provides complex behaviour, the finer details ofthis behaviour are unlikely to have been tested well. By looking more closely at these methods, theirintended behaviour, usage and similar properties, it is then possible to assess whether the methodsshould be considered for inclusion in new test cases.When looking for methods that need testing at a higher level, the methods in the chosen part of
the SUT can be ordered by their highest testing levels. From these, we look for the methods withthe smallest values to find the ones to consider first for implementing new higher-level tests. Asample of the top methods tested only at a low level is shown in Table IX. In Section 2, the rolesfor higher level of testing are listed as verifying the working of the smaller parts as a whole and asverifying the higher-level functionalities of the program.As classes and methods in a program should be implemented to be a part of a larger piece of
functionality, there should be test cases that also make use of each class and its methods in a largercontext. Thus when parts are only tested at a low level, this could highlight missing testing for ahigher functionality of the SUT or even possibly a class that has become redundant and is no longerneeded or used elsewhere in the system.The final decision of removing a code that is considered redundant should be left to a main-
tainer with expert knowledge of a system. However, here a feature common in today’s integrated
Copyright q 2007 John Wiley & Sons, Ltd. J. Softw. Maint. Evol.: Res. Pract. 2008; 20:59–76DOI: 10.1002/smr

TOWARDS A DEEPER UNDERSTANDING OF TEST COVERAGE 71
Table IX. Smallest maximum levels for methods.
Method name Max CM U
symboltable.TypeSet.getASTCompilationUnitPackage() 2 2 1stat.Metric.getTotal() 2 2 1ant.Formatter.setToFile(File) 2 1 1strings.AvoidDuplicateLiteralsRule.ExceptionParser(char) 2 2 6pmd.CommandLineOptions.usage() 2 1 3
Table X. Most tested methods.
Method name Number of methods Range
ast.SimpleNode(int) 569 5–834symboltable.SourceFileScope(String) 429 13–834report.PackageNode(String) 374 2–834pmd.RuleContext.setSourceCodeFilename(String) 350 3–834symboltable.ScopeAndDeclarationFinder.cont(SimpleJavaNode) 331 118–834
development environments such as Eclipse [15] and IntelliJ [16] has been applied: finding theusages of a method or a class in the source code. The U column in Table IX lists the results forfinding the usages for the listed methods. While in this paper this analysis was applied only to thefew methods listed manually, it could easily be automated with existing analysis tools. For example,the analysis showed that the method Metric.getTotal() is used only in a single test casethat does nothing but test this single method’s functionality. The method is not used in any of theproduction code, but looking at the traditional code coverage view would show it as covered, whilein fact it is not used in any production code.One more interesting aspect to look at as a side effect of this analysis is the summary of how
many tests are exercising different methods. This information can help both in understandingthe system implementation and in finding the most critical parts of the system for testing, bothimportant concepts in software maintenance and evolution. The more the tests exercise a method,the more central that method is to the system’s functionality. Table X lists a sample of the top most-tested methods in the system. For example, the method ast.SimpleNode(int) is executedin 569 different test cases. These test cases range in size from a granularity of 5 to a granularityof 834.Here only one method has been picked from the ast package, but overall, out of the 500 most
tested methods (ranging from methods being executed in 200–569 test cases), 372 belong to thegenerated ast parser package. Since ast is a structure used to describe source code and PMDis a source code analyser, it is quite clear that this is and should be a central concept in thesystem.An example of a method that is central to the functionality but is not tested at a finer level
is ScopeAndDeclarationfinder.cont(SimpleJavaNode) shown in Table X. Thismethod is executed in 331 tests, but is at the finest granularity in a test that exercises 118 methods.Thus, this metric could also be used to aid in locating new test subjects, in addition to metrics suchas code complexity as proposed in the previous section.
Copyright q 2007 John Wiley & Sons, Ltd. J. Softw. Maint. Evol.: Res. Pract. 2008; 20:59–76DOI: 10.1002/smr
72 T. KANSTREN
5. DISCUSSION
In this paper, the presented measurement technique has been applied to an OSS project for which nodetailed information was available. When using the technique for a project we are developing, weknow the SUT better and applying the technique and analysing the results is easier. However, thesuccess of applying the technique on a project without detailed knowledge of the SUT shows thetechnique to be applicable in practice. It was possible to get an overview of how much of the SUTis covered at the different levels and highlight places in the SUT to consider for further evolution ofthe production code and the test suite. As the technique does not consider untested parts of the code,these have to be first brought under test to be included in this analysis. Traditional code coveragemeasures and other existing techniques can be used for this purpose.Once the detail level of interest for the overview analysis is found, observing the evolution of
the different levels of testing over the history of the project can be used to monitor the testingprocess. If we set a goal to get more of the SUT covered at a higher or lower level, we can thenuse the overview to observe how this goal is met by looking at the evolution over time. This canbe useful for management purposes and to monitor our own progress as we work towards the goalof coverage at different levels. However, it should be kept in mind when considering this overviewthat, although the levels of testing tell more about the testing over different parts of the SUT, it stilldoes not tell whether the tests at the different levels would be comprehensive and good. It makesone aspect of test case properties visible, but does not mean that full coverage at different levelswould mean perfect testing.Measuring the granularities of testing and mapping these values to the different parts of the SUT
to get their levels of testing can be automated as is done in this paper. Different aspects of analysingthe results can also be automated as was demonstrated by using existing tools to find method usages.However, detailed and final analysis of these results still needs human work. Tool support to aidin this can be further developed by using, for example, complexity measures or measures to findaspects of method importance, for which one metric was shown in this paper.Using the technique to find places lacking in different levels of testing can have several benefits,
as shown by the analysis of the OSS project in Section 4. Finding where there is a lack of higher-level testing can bring out untested higher-level functionality. All code in a software system shouldexist to help implement the higher-level functionalities required by the system and as such take partin higher-level tests. However, not all code needs to be tested at higher levels as some code canbe required by, for example, programming language constructs for exception handling or similarreasons and be untested as part of higher-level tests. Similarly, as the measure of level of testingin this paper is based on the size of code executed, higher-level functionality can be implementedas part of small or large amounts of code. As such not all parts that are only covered by whatis measured to be a low-level test necessarily need to be made part of a higher-level test. Thishighlights a topic that needs more research and shows how the technique is best used as a tool to helpin analysing the test suite by a human analyst who can judge where new tests are actually needed.In a larger context, as the technique described in this paper provides a quantitative measure of the
levels of testing for the different parts of the SUT, it enables doing more research on the levels oftesting. Using the technique, it is now possible to see how the different parts of the SUT are coveredat different levels and use this information to analyse, for example, different implementations oftesting levels and their correlations with other properties of the tested parts of the SUT. This is
Copyright q 2007 John Wiley & Sons, Ltd. J. Softw. Maint. Evol.: Res. Pract. 2008; 20:59–76DOI: 10.1002/smr

TOWARDS A DEEPER UNDERSTANDING OF TEST COVERAGE 73
where the most detailed information provided by the technique can be most useful as it allowsdoing the most detailed analysis of these properties. This can be especially helpful in instances ofsoftware evolution.
6. RELATED WORK
Regression test selection and optimization are research topics that focus on choosing which testsfrom a test suite to run [17] and optimizing their order of execution [18]. In these cases, thegranularity of test cases is considered with such goals as how to maximize the coverage fast orhow to get additional coverage. The effects of test suite granularity on the cost-effectiveness ofregression test selection, optimization and reduction have been studied by Rothermel et al., whofocus on the granularity as defined by the test case inputs [4].When these studies on regression testing consider test granularity, they measure it either as code
executed or by the size of input in each test case. The executed code is not used for measuring thegranularity of testing, but rather for finding a minimal set of tests to provide maximum coverage.This paper measures the code executed by each test case and, in addition, applies a second step ofmeasurement, where the test granularities are mapped to the code to measure the level of testingfor the different parts of the tested code. Another difference is in the optimization goal; whereasthese studies focus on optimizing the execution of existing tests, this paper focuses on optimizingthe implementation of further test cases.Zeller and Hildebrandt [8] and Chesley et al. [19] have developed methods and tools for finding
the cause of failure from coarse-grained tests which execute large parts of the SUT. A failingtest case is executed repeatedly with varying input or code changes until the smallest part thatcauses the failure is found. Both of these techniques can lessen the need to implement lower-leveltesting; however, as also noted by Galli et al. [7], having finer granularity tests can make thesetechniques work faster. Also, we still need different levels of testing to verify the finer-level detailsand the higher-level functions. In many cases it is also much faster to debug something if we havefocused tests where we want instead of having to run specific tools and methods to filter out thecause.Nagappan has developed his own metrics suite, called Software Testing and Reliability Early
Warning (STREW)metrics suite, for predicting software maintenance and guiding the testing efforts[20]. STREW is based on a number of metrics measured from both test code and production code,such as number of assertions, complexity and coupling. The approach applied in STREW is similarto that in this paper, in applying measurement to the testing and production code to guide the testingprocess, but his metrics suite does not consider test granularity.Pighin and Marzona [21] propose to focus the highest testing effort on the most fault-prone parts
of the software. They argue that it is a waste effort to put the same effort of testing on the lessfault-prone parts of the software as on the more fault-prone parts. Their approach is common withthis paper in that it proposes a method to focus the testing effort and uses the properties of codeto guide this process. However, they discuss allocating time, not how to focus the testing on thefault-prone parts. The information in this paper provides a way to help focus the extra effort spenton the chosen parts.
Copyright q 2007 John Wiley & Sons, Ltd. J. Softw. Maint. Evol.: Res. Pract. 2008; 20:59–76DOI: 10.1002/smr

74 T. KANSTREN
Jones et al. have developed a technique and a tool for visualization of test information to assistin fault localization [22]. Their technique colour codes source lines based on their execution inpassed or failed test cases. This is based on gathering coverage information for every executed testand mapping the executed passed and failed tests for each LOC. This way, colour spectra can beapplied for each LOC to give it a colour based on how many failed tests are executed in that line.The authors then propose that specialists can use this information to help debug the faults. Thisapproach uses a similar mapping of tests to code as is done in this paper, but, while they use it forcounting the number of failed tests for each line, they do not consider the granularity of testing orthe roles of the testing. Instead, their focus is on highlighting where the possible failed statementis and using it for debugging.Baudry et al. [12] define a test criterion for improving debugging, called test-for-diagnosis (TfD)
criterion. A good TfD value is defined as maximizing the number of dynamic basic blocks (DBBs).DBB is defined to be the set of statements covered identically in test cases. Using their own testsuite optimization algorithm, Baudry et al. optimize existing test suites for TfD. Their aim is tooptimize the test suite to make debugging faults easier. To assist in this, they use the localizationtechnique proposed by Jones et al. [22], in which the test suite is optimized using the TfD measure.Their DBB measure can be considered as a form of granularity measure, but is not usable for thepurposes of this paper, as the size of DBB varies and thus any granularity measured with it wouldnot be comparable. In line with this, they do not provide means to assess the granularity of testingfor the different parts of the code, but focus on the debugging of failed test cases.Sneed [23] has used both static and dynamic analysis for linking test cases and use cases to
the code they execute. He started with static analysis, finding it inadequate for his purposes, andthen moved to dynamic analysis, similar to this paper. While he used timing-based matching tomatch test cases, this paper makes use of instrumenting both the test framework and the codeunder test to automatically link the test case execution to the code under test. Similarly, he usedstatic analysis techniques to map the trace data to the functions executed, while in this paper theinformation is provided directly by the trace framework (AspectJ). This is mostly a function ofdifferent environments and both types of tracing have advantages in different environments. Finally,while he focused on using the information for regression test selection, this paper has focusedon understanding the test suite and its composition. However, the data could also be applied toregression test selection in a similar way as Sneed has done.Advances in coverage-based tools are moving them to also include more detailed coverage
information at the individual test level and using different coverage measures such as method, blockand predicate coverage [13]. While these tools do not yet provide a deeper analysis of the coverageinformation as presented in this paper, extending them with this support should be simple as theyalready provide the basic individual test case coverage information needed to perform the analysis.
7. CONCLUSIONS AND FUTURE WORK
This paper proposed a technique for measuring and optimizing the levels of testing over the differentparts of the system under test (SUT). It was shown how this can be applied to support softwaremaintenance and evolution by showing how to measure the levels of testing for the different partsof the SUT, how to get an overview of the total testing over the SUT and its smaller parts and how
Copyright q 2007 John Wiley & Sons, Ltd. J. Softw. Maint. Evol.: Res. Pract. 2008; 20:59–76DOI: 10.1002/smr

TOWARDS A DEEPER UNDERSTANDING OF TEST COVERAGE 75
to use this information to further evolve the production code and the test suite. Different levels oftesting have different roles in testing a system; having tests at these different levels makes it morelikely to find faults earlier and makes debugging them faster. Full coverage at these different levelswould be optimal, but it is always a trade-off and choices have to be made. This technique helpsmake these choices more explicit by showing how the different parts of the SUT are tested at thedifferent testing levels. The technique was applied to an OSS project to illustrate its use in practice.In summary, the technique presented helps in finding the following:
• Untested higher-level functionality by highlighting places in the SUT lacking in higher-leveltesting. All code should serve to implement the required higher-level functionality of thesystem and thus take part in higher-level tests.
• Redundant code that is no longer needed, by finding parts that are not tested at a higher leveland are no longer needed for any higher-level functionality.
• Parts of the SUT that are lacking in different levels of testing, for example, parts in need oflow-level testing to help in debugging or for verifying complex behaviour.
In addition, the technique provides possibilities to
• get an overview of the testing done at different levels over the SUT;• find and understand the central components in SUT implementation;• track evolution of the test suite and the SUT with regard to test levels; and• do research on different levels of testing by providing an automated, quantitative measure.
Further research to improve the use of the technique would include developing techniques tohelp filter out the information of interest, including the most important parts to consider for furthertesting, and to study the optimal distributions for the levels of testing for different methods. Studyingthe properties of the source code with relation to the different levels of testing is also needed to bringout the possible trade-offs in implementing tests at different levels. For example, it is not alwayspossible to test every part at a finer granularity if they are highly coupled or getting lower couplingmay bring higher complexity. While all parts of the techniques implementation and data analysiscan be automated, integrated tool support is also still needed for enabling practical adoption.
REFERENCES
1. Binder R. Testing Object Oriented Systems. Addison-Wesley: Reading MA, 2000; 1200.2. Beizer B. Black Box Testing: Techniques for Functional Testing of Software and Systems. Wiley: New York NY, 1995;
320.3. Myers G, Badgett T, Thomass T, Sandler C. The Art of Software Testing. Wiley: New Jersey, 2004; 256.4. Rothermel G, Elbaum S, Malishevsky AG, Kallakuri P, Quit X. On test suite composition and cost-effective regression
testing. ACM TOSEM 2004; 13(3):277–331.5. Kit E. Software Testing in the Real World. Addison-Wesley: Reading MA, 1995; 272.6. Feathers M. Working Effectively with Legacy Code. Prentice-Hall: Upper Saddle River NJ, 2004; 456.7. Galli M, Lanza M, Nierstrasz O, Wuyts R. Ordering broken unit tests for focused debugging. Proceedings 20th IEEE
International Conference on Software Maintenance (ICSM’04), 2004; 114–123.8. Zeller A, Hildebrandt R. Simplifying, isolating failure-inducing input. IEEE Transactions on Software Engineering 2002;
28(2):183–200.9. Runeson P. A survey of unit testing practices. IEEE Software 2006; 23(4):22–29.
10. JUnit: Testing framework. http://www.junit.org [3 July 2006].11. AspectJ: Java programming language aspect oriented programming extension. http://www.aspectj.org [6 May 2007].
Copyright q 2007 John Wiley & Sons, Ltd. J. Softw. Maint. Evol.: Res. Pract. 2008; 20:59–76DOI: 10.1002/smr

76 T. KANSTREN
12. Baudry B, Fleurey F, Traon YL. Improving test suites for efficient fault localization. Proceedings of the 28th InternationalConference on Software Engineering (ICSE’06), 2006; 82–91.
13. Lingampally R, Gupta A, Jalote P. Multipurpose code coverage tool for java. Proceedings of the 40th Annual HawaiiInternational Conference on System Sciences (HICSS’07), 2007; 261.
14. PMD: Source code analyser. http://pmd.sourceforge.net [6 May 2007].15. Eclipse: Integrated development environment. http://www.eclipse.org [6 May 2007].16. IntelliJ: Integrated development environment. http://www.intellij.com [6 May 2007].17. Rothermel G, Harrold MJ. Analysing regression test selection techniques. IEEE Transactions on Software Engineering
1996; 22(8):529–551.18. Rothermel G, Untch RH, Harrold MJ. Prioritizing test cases for regression testing. IEEE Transactions on Software
Engineering 2001; 27(10):929–948.19. Chesley OC, Ren X, Ryder BG. Crisp: A debugging tool for java programs. Proceedings 21st IEEE International
Conference on Software Maintenance (ICSM’05), 2005; 401–410.20. Nagappan N. A software testing and reliability early warning (STREW) metric suite. PhD Dissertation. North Carolina
State University, 2005; 136.21. Pighin M, Marzona A. Optimizing test to reduce maintenance. Proceedings 21st IEEE International Conference on
Software Maintenance (ICSM’05), 2005; 465–472.22. Jones JA, Harrold MJ, Stasko J. Visualization of test information to assist fault localization. Proceedings of the 4th
International Conference on Software Engineering (ICSE’02), 2002; 467–477.23. Sneed H. Reverse engineering of test cases for selective regression testing. Proceedings of the 8th European Conference
on Software Maintenance and Reengineering (CSMR’04), 2004; 69–74.
AUTHOR’S BIOGRAPHY
Teemu Kanstren is a Research Scientist at VTT Technical Research Centre of Finland.Prior to joining VTT he worked as a Systems Analyst in the software industry for 5years. He is currently a PhD student at the University of Oulu, where he also receivedhis MSc in Computer Science in 2004. His research interests include automated softwaretesting and analysis.
Copyright q 2007 John Wiley & Sons, Ltd. J. Softw. Maint. Evol.: Res. Pract. 2008; 20:59–76DOI: 10.1002/smr