Embed Size (px)
Citation preview

NORTH AMERICAN ARCHAEOLOGIST, Vol. 24(1) 1-27, 2003
TOWARDS A CHRONOLOGY OF BROWNWARE
POTTERY IN THE WESTERN GREAT BASIN:
A CASE STUDY FROM OWENS VALLEY*
JELMER W. EERKENS
University of California, Davis
ABSTRACT
Great Basin brownware is often perceived as highly variable and lacking
distinct subdivisions. Combined with the lack of painted decoration, the result
has been to lump all brownware into a single all-encompassing temporal
category. This article examines this perception in the Owens Valley of
California where pot sherds are often found associated with late prehistoric
house floors. An analysis of these sherd assemblages reveals important
changes in how pots were made through time and suggests changes in
prehistoric human behavior.
INTRODUCTION
Ceramic typologies and chronologies have been an important part of archaeo-
logical research in areas where people made and used earthenware pots. However,
this is distinctly not the case for the late prehistoric period in the western Great
Basin. Despite the fact that large numbers of pot sherds have now been recovered
in various surveys and excavations, there are no published accounts of attempts to
segregate pottery into distinct temporal periods or to systematicalaly compare
pottery from different regions.
*Much of this research was supported by a National Science Foundation dissertation improvement
grant (#9902836) and a predoctoral grant from the Wenner-Gren Foundations for Anthropological
Research grant (#6529).
1
� 2003, Baywood Publishing Co., Inc.
In general, western Great Basin brownware is interpreted as being too variable
to create meaningful types or subcategories (see Bettinger, 1986; Pippin, 1986).
Variability within any particular period of time or within regions is seen as
being greater than the variability between them. This great variation is often
attributed to the unsystematic way in which pots were made. That is, Great
Basin brownware is assumed to represent a single but highly variable artifact
category, not because it is an agglomerated category composed of pots made in
distinct times by distinct cultural entities with different traditions, but because
it was equally variable throughout time and space. Below, I refer to this as the
“single-type” hypothesis.
Earlier work (see Eerkens, 2001; Eerkens et al., 2002a, 2002b) attempted to
test of the single-type hypothesis with regards to space with some success.
Pots are not made in the same way across space, and there are distinct differ-
ences in how they were manufactured in different regions in the western
Great Basin. These differences were related to the varying functions that
pots served. This article attempts to test the temporal part of the single-type
assumption.
OWENS VALLEY BROWNWARE
It is generally accepted that the late prehistoric inhabitants of Owens Valley,
the ancestors of the Owens Valley Paiute, did not begin making and using
brownware pottery until the Marana period (ca. 700 BP to historic times; Bettinger
and Taylor, 1974). There is evidence for earlier experimentation with pots around
1200 BP (Eerkens et al., 1999) and local pottery production is clearly in full
swing by 500 BP, however, the exact timing for the introduction of pottery is
not known. Recent study in southern Owens Valley suggests that pottery-making
does not begin until well into the Marana period, at approximately 500 BP
(Delacorte, 1999). Unfortunately, there are few sites and radiocarbon dates asso-
ciated with the period between 700 and 500 BP, thus, it is possible pots were
made earlier but we lack evidence for their production. All that can be said is
that prior to 700 BP very few pots were made and that by 500 BP Paiute were
engaged in a modest level of pot production in Owens Valley. Pots quickly and
completely drop out of the suite of material artifacts upon contact with European
settlers around AD 1850, being replaced by metal containers.
The brownware of the Owens Valley region was made using the coil-and-scrape
method, whereby long rolls of clay were neatly stacked upon one another, pressed
together, and scraped with the fingers or a small object such as a bundle of twigs or
a pebble to meld the coils together. Pots were apparently fired in uncontrolled
atmospheres, likely a small pit covered with brush, leading to variable colors on
the exterior and interior surfaces and the core. Most pots range from brown-red to
brown-black in color and less than 10 percent of the pots were decorated. It has
been suggested by some (Steward, 1933) that temper was not intentionally added
2 / EERKENS

to clays prior to firing, but that mineral and organic temper components were
naturally present within the clays Paiute collected for their pots. However, this
hypothesis needs to be tested and is currently under investigation by the author
through electron microprobe and petrographic analysis of thin sections.
In Owens Valley, large conical pots with direct rims were the most common
shape, though a small number of pots are bowl-shaped and a very small percentage
(ca. 3 percent) have recurved rims. Most whole pots range between 20 and 35 cm
in height and 20 and 40 cm in diameter at their mouths, yet a small number of
miniature pots have been collected. Other ceramic objects include pipes (Griset,
1988), suggesting that the baked-clay technology extended beyond merely the
production of vessels.
Recent studies suggest that western Great Basin pots are primarily cooking
vessels used to boil seeds and nuts, though roots, berries, and greens were
occasionally cooked as well. Meats seem to have been only rarely processed
in pots, likely as part of stews containing seeds and other plant products (Eerkens,
2001). There seems to be a fairly strong correlation between the introduction
of intensive seed procurement, increased milling activity, and pottery use.
Indeed, the increased role of seeds in the diet likely precipitated the adoption
of pottery in the region. Very few pots seem to have been traded within the
region and the craft appears to represent an individual or family-level operation.
Pots are clearly utilitarian objects and did not enter into the realm of socially-
or ritually-valued (i.e., prestige) objects as indicated by their lack of trade,
their association with domestic contexts, and their lack of decoration or other
embellishments (Eerkens, 2001).
DEVELOPING A CHRONOLOGY IN
SOUTHERN OWENS VALLEY
Several problems have hindered the development of a temporally sensitive
ceramic typology in the western Great Basin. First, there is a lack of well-dated
single-component sites containing pottery (Pippin, 1986). In addition, most
ceramic-period sites contain only modest numbers of sherds, usually less than 200,
thereby minimizing the sample size in association with any dates and creating
problems when attempting to seriate sherds from sites (i.e., only a small number of
pots are generally represented per site). Second, no sites with multiple and
stratigraphically separated ceramic-bearing layers have been excavated. This
has prevented systematic comparison of pottery over time within a single site.
A third obstacle to studying temporal change may relate to expectations that
pottery decoration is the most sensitive attribute of temporal change, as we have
learned from ceramic studies in the American Southwest and other regions.
Except for the small fraction that display fingernail impressions around the
rim or lip, western Great Basin pottery is undecorated (Eerkens, 2001). However,
even this decoration motif appears to be extremely consistent through time and
A CASE STUDY FROM OWENS VALLEY / 3
space and presents little opportunity to segregate pots into meaningful spacio-
temporal categories.
Excavations in southern Owens Valley over the last 15 years have greatly
expanded the number of well-dated and single-component pottery-bearing
assemblages. In particular, excavation of many late prehistoric houses and other
features containing pottery that have been independently dated by radiometric
methods allows us to begin examining change through time in the ceramic
technology of the Paiute inhabitants of this region. As well, sites in this region
generally contain larger numbers of sherds representing more pots than in other
regions (Eerkens, 2001), allowing for more rigorous statistical comparison of
pottery assemblages. This unique database allows us to begin comparing ceramic
assemblages through time and provides the potential for developing a chronology
of sherds.
Thirteen such late prehistoric feature-components are included in this analysis.
Six of these represent house floor assemblages excavated at CA-INY-30, on
Lubkin Creek to the northeast of Owens Lake (see Figure 1 for location and see
Basgall and McGuire, 1988, for a detailed description of the site). Pottery assem-
blages from structures 1, 5, 7, 8, 9, and 10 were included in the analysis. Two
additional house floor assemblages come from CA-INY-5207, locus 2 at Bartlett
Point near Carroll Creek on the west side of Owens Lake (Eerkens, 1997) and
CA-INY-3769, locus 13 some 10 km north of Owens Lake near the Alabama
Hills (Delacorte, 1999). For the latter, sherds associated with Feature 1, a large
external hearth or midden dump just outside, but clearly associated with the house
structure, were also included in the analysis. Feature 1 at CA-INY-1447 was also
included and represents a central hearth within a prehistoric wickiup or house
structure (Gilreath, 1995). All the aforementioned house structures represent
saucer-shaped (in cross section) and circular (in plan view) concentrations of
charcoal and compacted earth ranging between 4 and 8 meters in diameter. Thus,
these nine assemblages all come from domestic structures and contexts.
A note should be made here regarding structure 7 at CA-INY-30. Two radio-
carbon dates were retrieved from the structure, one modern in age and a second
from 480 ± 60 BP. Basgall and McGuire (1988) rejected the former as modern
contamination of the house floor and accepted the latter as more reliably dating the
structure and associated artifact assemblage. However, it is noted here that a
protohistoric Olivella bead and seven glass trade beads were found within the
structure fill, including some on the floor. The significance of these protohistoric
items is discussed below.
The final four components represent pottery assemblages associated with other
types of features. Feature 7 at CA-INY-1430, locus 4, is composed of a dark brown
ashy zone containing high quantities of burned bone which produced a modern
radiocarbon date (Gilreath, 1995). Although no historic artifacts were recovered,
the bones of tule elk, a species introduced in recent times, were identified
among the faunal remains. The second such feature, at CA-INY-5207, locus 4, is
4 / EERKENS

A CASE STUDY FROM OWENS VALLEY / 5
Figure 1. Map of southern Owens Valley showing approximate
locations of sites.

composed of a large boulder near the shores of Owens Lake with several mortars
and milling slicks (Eerkens, 1997). Excavations around the milling station
revealed several burns, one of which was radiocarbon dated to recent times and
had a single pot sherd in association, though no historic artifacts were recovered.
The final two components represent two burn features from CA-INY-1434,
which is near U.S. Highway 395 along Ash Creek and the western shore of Owens
Lake (Gilreath, 1995). Feature 1 from locus 1 is a concentration of fire-affected
rock and charcoal about 75 cm in diameter with a basin or dish shape. Although
some modern roadside debris contaminates the uppermost part of the deposit,
Gilreath (1995:144) felt that the feature was relatively intact and undisturbed.
Feature 2 from locus 2 represents a charcoal smear approximately 80 × 45 cm
across, with much fire-affected rock and 16 associated pot sherds. Figure 1 plots
the approximate location of these sites relative to one another and important
geographic features in Southern Owens Valley.
Readers familiar with pottery from the region will notice that I omitted the
earliest dated house floor containing brownware sherds from the region, namely
structure 13 from CA-INY-30 which has been radiocarbon dated at 710 ± 70 BP.
This feature was not included for two main reasons. First, during excavation
several intrusive pits from higher stratigraphic layers were noted penetrating
the floor zone (Basgall and McGuire, 1988). Pot sherds were clearly within the
fill of these pits. Although the excavators tried to delineate and separate sedi-
ments associated with these pits from those associated with the original floor,
examination of the sherds believed to be associated with the latter (i.e., not
intrusive) shows that many are from the same pot as sherds clearly associated with
the pits. In other words, the fact that sherds within the pits have the same temper,
thickness, color, and construction style as those believed to be native to the
floor must cast doubt on the integrity of the house floor assemblage. Second, a
thermoluminescence date on one of the sherds from the floor returned a date of
310 BP ± 50 (Rhode, 1994; UWTL-100) casting further doubt on the asso-
ciation of the pottery with the much earlier radiocarbon date. As well, pot
sherds from this structure do not fit the chronological patterns discussed below
and appear more like middle-Marana sherds, as the thermoluminescence date
suggests, than early Marana ones. For these reasons, it was felt that the radio-
carbon assay does not date the associated pottery and the structure was not
included in the study.
Table 1 lists the assemblages incorporated in the study, including a brief
description of the feature, the radiocarbon date, and the number of body and rim
sherds in association. Table 1 also lists references so that readers wishing more
detailed information on the assemblages and associated features can consult the
original site reports. The reader will notice that several assemblages have more
than one radiocarbon date (including some that do not overlap at the 2-sigma
level). For the purposes of this study, multiple dates on a single feature were
averaged to obtain a single determination per assemblage.
6 / EERKENS

Table 1. Background Information on Assemblages Included in the Study.
Assemblages Arranged in Chronological Order from Youngest (on Top) to Oldest (on Bottom)
Site (reference) Context Description 14C Dates (Beta Lab #) Body Rim MNV
Iny-1430, loc. 4a
Iny-5207, loc. 4b
Iny-30c
Iny-5207, loc. 2b
Iny-3769, loc. 13d
Iny-30c
Iny-1447a
Iny-30c
Iny-30c
Iny-1434, loc. 2a
Iny-1434, loc. 1a
Iny-30c
Iny-30c
Feature 7
Burn 1
Structure 9
Feature 1
Structure 1
& Feature 1
Structure 10
Feature 1
Structure 1
Structure 5
Feature 2
Feature 1
Structure 8
Structure 7
Ashy zone
Burn near BRM
House floor
House floor
House floor &
associated burn
House floor
Hearth & house floor
House floor
House floor
Charcoal smear
Hearth
House floor
House floor
10 ± 60 (66965)
70 ± 50 (113512)
180 ± 60 (20521)
140 ± 90 (135415)
270 ± 60 (113511)
180 ± 60 (55690)
430 ± 40 (112086)
270 ± 60 (112085)
330 ± 60 (12668)
390 ± 90 (12667)
390 ± 70 (66966)
310 ± 70 (12662)
470 ± 70 (12661)
410 ± 80 (20699)
450 ± 70 (67638)
470 ± 80 (66959)
470 ± 50 (20524)*
480 ± 60 (12665)
11
1
27
14
N/A
62
27
18
7
16
3
30
14
1
0
5
4
3
12
9
1
1
0
0
5
1
1
1
4
2
3
7
4
2
2
3
1
4
1
Notes: MNV = minimum number of vessels; loc. = locus; *date from Structure 8 represents the deeper and older floor zone, which Basgall and
McGuire (1988) feel is associated with the pottery studied.aGilreath, 1995;
bEerkens, 1997;
cBasgall and McGuire, 1988;
dDelacorte, 1999.
AC
AS
ES
TU
DY
FR
OM
OW
EN
SV
ALLE
Y/
7

In total for this study, 230 body sherds and 42 rim sherds were analyzed from
the 13 assemblages. Unfortunately, due to an error on my part, only three unique
rims (i.e., representing three different pots) and none of the body sherds from
Iny-3769, locus 13 were analyzed. However, data from Delacorte (1999) on the
pottery assemblage were used to fill in this omission, where possible. This gives an
average of 18 body sherds and two rim sherds per assemblage though there is
much variability. The 272 total sherds represent a minimum of 35 unique vessels.
METHODS
Only those sherds in association with the features or structures discussed above
were included in the analysis. For example, for house floor assemblages, only
those sherds lying directly on to 20 cm above the actual floor were included.
Limiting the sherds to only those in clear association with the feature or structure,
of course, greatly limits the number included in the study. In all cases, additional
pot sherds were present at the site in adjacent excavation units or overlying the
feature or structure in question, but were not included. This tends to limit the
sample size and maximizes the influence each sherd has on the analysis (i.e.,
increases the chance of error due to sampling), but ensures greater confidence in
chronological sensitivity.
For each assemblage, a minimum number of vessels (MNV) was determined,
taking into account the range of variability typically seen within whole brownware
ceramic pots. In particular, the attributes of estimated diameter, temper
characteristics, the presence of decoration, and occasionally thickness, were used
to determine if two sherds represented a single or two different pots. Given that
brownware is quite variable even within a single pot, I tended to err on the side of
caution, assuming that similar but slightly different sherds came from the same
pot. Thus, the MNV should be considered a conservative estimate of the total
number of vessels present within an assemblage.
I use the term “temper” to refer to any non-clay minerals or other components of
the sherds. Temper does not denote the intentional addition of these items to the
clay and can be either naturally occurring within the clay or artificially added. In
most cases, temper is composed of granitic minerals such as quartz, feldspar, and
iron oxides. However temper can also include organic items, such as grass blades,
piñon nut hulls, or crushed bone, or other inorganic items, such as salt, crushed
pottery sherds, or crushed rock.
Rim and body sherds were studied separately within each assemblage. For body
sherds the following measurements were taken: average thickness (in mm); the
color of the core representing either an oxidized (orange) or reduced (dark) firing
atmosphere; the style of coiling (see below); the method of surface finish on the
exterior and interior surfaces (smoothed, brushed, or roughened); the amount of
mica, mainly biotite, present (none, low, medium, high); and the amount of
organic temper present (none, low, medium, high). As well, the average size of
8 / EERKENS

mineral temper constituents (none, less than 0.25mm, between 0.25 and 0.5mm,
more than 0.5mm) and the average density of mineral temper (none, less than
25 percent by volume, between 25 percent and 50 perent by volume, greater than
50 percent by volume) were visually estimated. For all temper constituents, scores
were assigned based on the value above ranging from 0 for none to 3 for the
highest or largest amount.
For rim sherds, in addition to the attributes above, the following attributes were
measured: estimated mouth diameter (in mm); shape of the neck (incurved, direct,
or recurved); shape of lip (flat, rounded, or pointed); lateralization of the lip
(leaning towards the interior, exterior, or even); and the presence or absence of
decoration. In several cases rim sherds conjoined and had been glued together.
These conjoined segments were treated as a single sherd, rather than individually,
in the analyses below. Figure 2 presents a schematic for most of these attributes
on a hypothetical pot.
Figure 3 presents drawings of two very typical brownware rim sherds from
CA-INY-30 (catalog numbers are given; the upper sherd is from the floor of
structure 10 and the bottom is from general salvage work—note that the latter was
not included in the analysis because it is not associated with any feature). Both
have direct rims. The upper sherd has vertical brushing on the exterior and
A CASE STUDY FROM OWENS VALLEY / 9
Figure 2. Attributes measured during analysis.

horizontal brushing on the interior brushing while the lower sherd is decorated on
the lip and has more faint horizontal brushing on both the interior and exterior
surfaces. The thicker black circular and linear features represent voids left by
organic fiber temper that was burned out during firing.
Most of the attributes listed above are standard in ceramic analyses (see
Shepard, 1968) and do not need further explanation, with the exception of coiling
style. Coiling style essentially records how coils were melded or attached to one
another. It was observed during the analysis that some pots had coils that seemed
to overlap on the interior, where clay from the upper coil was pushed or extended
down onto the lower coil from the interior side of the pot, others seemed to have
coils that extended down over the exterior of the lower coil, and still others had
coils that were evenly stacked on one another. This could be seen in the cross
10 / EERKENS
Figure 3. Schematic of two brownware sherds from
southern Owens Valley.

section of some sherds where the coils were still visible. Since it was not possible
to orient body sherds to determine which direction was up (i.e., towards the rim),
the interior and exterior categories were collapsed into an uneven category. That
is, on body sherds it was only possible to determine if the coils were evenly or
unevenly stacked on top of one another.
Finally, it is important to consider the effects of using radiocarbon dates to
estimate changes that take place in a real-world calendar. Given the peaks and
valleys in the calibration curve used to translate radiocarbon dates into calendrical
ones, it is fair to ask how a radiocarbon chronology will convert to a calendrical
one and whether a radiocarbon date of, say, 180 ± 60 BP represents a different time
period than one of 240 ± 60 BP. As well, given that radiocarbon dates have
associated errors that are often quite large in the context of the period under
examination (i.e., ± 60 years over a total interval of 500 years) it is important
to consider the temporal discreteness of any periods defined within such a
chronology. I delay discussion of these issues until the “discussion” section of the
article and carry on for the moment as if radiocarbon dates represent real-world
calendrical dates.
RESULTS
The analysis below is divided into two parts. The first is based on a study of all
rim and body sherds associated with each feature. This part of the study includes
the largest number of sherds (271) but is based on a small number of attributes,
since many could not be measured on body sherds. It is also clear in this part of the
analysis that many pots are represented by multiple sherds. The second part is
based only on the analysis of rim sherds representing unique pots, as determined
by size, shape, color, decoration, and temper characteristics. Only one rim sherd
from each unique vessel was included in the analysis. Although these rim sherds
contain many more attributes to study change through time, there were only 26 that
could be included in the study.
Analysis of All Sherds
Tables 2 and 3 list the average values for different assemblages for the attributes
measured on all sherds. Note that for temper size, temper density, the amount of
mica, and the amount of organic temper, a simple average of the scores (ranging
between 0 and 3) was reported. Because they were measured on integral rather
than continuous scales, these values cannot be compared to one another in a
rigorous statistical manner. However, they do provide a single overall value
describing the average state of this attribute within an assemblage. As well, less
emphasis was given within the study to assemblages with small sample sizes,
indicated by asterisks in the first columns of Tables 2 and 3.
Many of the attributes measured for body sherds do not show any clear patterns
through time. For example, there is no apparent change in the percentage of sherds
A CASE STUDY FROM OWENS VALLEY / 11

Table 2. Average Values for Assemblages Related to Thickness,
Cores, Coiling Style, and Temper
Context Date Thickness
%Oxid.
core
%Even
coil
Temper
size
Temper
density
Mica
temper
Organic
temper
Iny-1430, Feat. 7
Iny-5207, Burn 1*
Iny-30, Struct. 9
Iny-5207, Feat. 1
Iny-3769, Struct. 1
Iny-30, Struct. 10
Iny-1447, Feat. 1
Iny-30, Struct. 1
Iny-30, Struct. 5*
Iny-1434, Feat. 2
Iny-1434, Feat. 1*
Iny-30, Struct. 8
Iny-30, Struct. 7
10
70
180
205
293
360
390
390
410
450
470
470
480
4.7
5.3
5.2
5.4
5.8
5.7
6.0
6.6
7.0
6.8
6.3
6.3
4.9
0.00
0.00
0.48
0.12
—
0.11
0.44
0.53
0.13
0.00
1.00
0.88
0.60
0.00
N/A
0.24
0.22
—
0.42
N/A
0.56
0.40
N/A
N/A
0.97
0.44
1.00
1.00
2.25
2.50
—
1.77
1.14
1.68
1.25
1.88
2.00
1.91
2.00
1.00
2.00
2.09
1.38
—
1.62
1.42
1.84
1.50
2.88
2.00
1.76
1.93
0.00
1.00
0.59
1.53
—
1.57
1.31
1.21
2.25
2.19
2.00
2.68
0.80
0.00
0.00
0.44
0.18
—
0.67
1.67
0.37
0.88
2.06
2.00
0.06
0.13
Notes: %Oxid. core = percent of sherds with oxidized core; %Even coil = percent of sherds with evenly stacked coils; * = indicates assemblage
with sample size less than 10 sherds; N/A = indicates no sherds in assemblage displayed evidence to measure this attribute; — = indicates body
sherds from this assemblage not measured. Attributes for temper constituents indicate only average score.
12
/E
ER
KE
NS
with oxidized cores. This suggests that firing practices did not change significantly
during the 400 years of pottery production, at least not in a way that affected the
availability of oxygen within the firing environment. Similarly, there are no
appreciable differences in the size and density of mineral temper. This indicates
that mineral temper recipes, whether naturally within the clay or intentionally
added, did not change noticeably through time in either size or density. The
amount of organic temper is also not clearly patterned through time, though earlier
assemblages tend to have slightly higher levels of voids where plant particles
present within the clay were burned out during firing.
Other attributes, however, show a greater degree of patterning through time.
Perhaps the clearest example of this is the thickness of sherds. With the exception
of Structure 7, at CA-INY-30, there seems to be a clear trend towards decreasing
thickness in sherds through time. Even if we include Structure 7 at 480 BP, a
regression on the 13 assemblages between thickness and date gives a Pearson’s
R value of 0.65, suggesting some degree of correlation between the two variables.
Table 2 also provides the first hint that the sherds from Structure 7 are somehow
out of place temporally given the earlier radiocarbon date of 480 ± 60. If, instead,
A CASE STUDY FROM OWENS VALLEY / 13
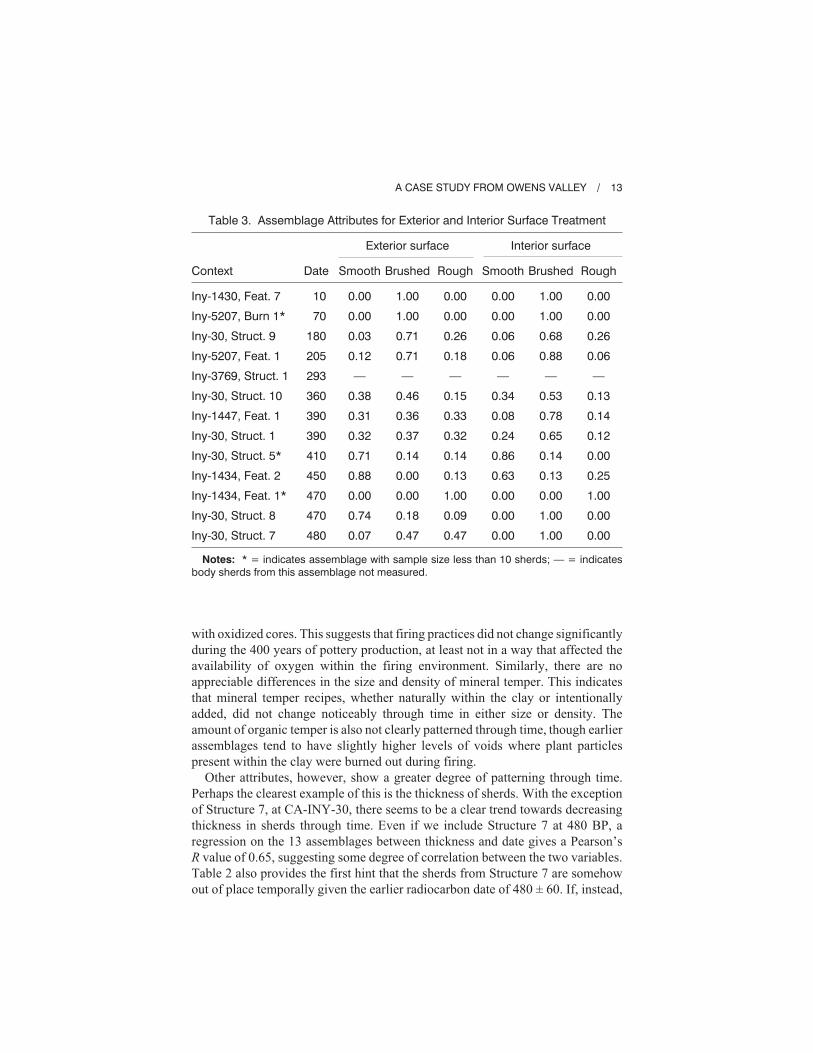
Table 3. Assemblage Attributes for Exterior and Interior Surface Treatment
Exterior surface Interior surface
Context Date Smooth Brushed Rough Smooth Brushed Rough
Iny-1430, Feat. 7
Iny-5207, Burn 1*
Iny-30, Struct. 9
Iny-5207, Feat. 1
Iny-3769, Struct. 1
Iny-30, Struct. 10
Iny-1447, Feat. 1
Iny-30, Struct. 1
Iny-30, Struct. 5*
Iny-1434, Feat. 2
Iny-1434, Feat. 1*
Iny-30, Struct. 8
Iny-30, Struct. 7
10
70
180
205
293
360
390
390
410
450
470
470
480
0.00
0.00
0.03
0.12
—
0.38
0.31
0.32
0.71
0.88
0.00
0.74
0.07
1.00
1.00
0.71
0.71
—
0.46
0.36
0.37
0.14
0.00
0.00
0.18
0.47
0.00
0.00
0.26
0.18
—
0.15
0.33
0.32
0.14
0.13
1.00
0.09
0.47
0.00
0.00
0.06
0.06
—
0.34
0.08
0.24
0.86
0.63
0.00
0.00
0.00
1.00
1.00
0.68
0.88
—
0.53
0.78
0.65
0.14
0.13
0.00
1.00
1.00
0.00
0.00
0.26
0.06
—
0.13
0.14
0.12
0.00
0.25
1.00
0.00
0.00
Notes: * = indicates assemblage with sample size less than 10 sherds; — = indicates
body sherds from this assemblage not measured.

we take the “modern” date (along with the historic beads) as a more reliable
date for the pottery, and assign a value of 0 BP to this assemblage, a much
stronger correlation between thickness and age obtains, yielding a Pearson’s R of
0.89. It appears that sherds decrease by about 1 mm in thickness around 400 BP.
The amount of mica present within sherds also seems to change through time,
with earlier assemblages containing higher amounts. Recent electron microprobe
and thin section work shows that the mica is primarily biotite, though some mica
has been altered into chlorite. Again, there seems to be a marked change around
400 BP. As well, Structure 7 from CA-INY-30 displays patterns consistent with a
later rather than earlier assemblage. This suggests, again, that the 480 ± 60
radiocarbon assay does not date the pottery from this structure.
The meaning of the reduction in mica is not entirely clear. Mica does not seem to
have any clear and direct implications for the function of a pot. Instead, it may
represent a change in the source of clays used by prehistoric potters from one
containing ample mica to one containing little. Sedimentary clays in the region,
such as at Owens Lake, are often quite high in mica, while residual clays of
decomposing granite near the valley bottom are often lacking in this mineral.
In this respect, the change in mica levels may indicate a move towards the use
of residual over more sedimentary clays for pots.
The percentage of sherds within a collection with evenly stacked coils also
seems to decrease through time. Although the decrease is less clear since several
collections did not have enough sherds with this attribute visible, thereby reducing
the sample size, there seems to be a decrease from early assemblages where
40 percent or greater of the sherds have evenly stacked coils to later assemblages
where less than 25 percent are coiled in this fashion. This suggests that an uneven
style of coiling developed and became more popular through time. Note, however,
that in this fashion structure 7 from CA-INY-30, with 50 percent of the sherds
having evenly stacked coils, looks more like an earlier assemblage than a later one
(unlike for thickness and mica content).
Table 3 gives summary information for exterior and interior surface finish
for the 13 assemblages. Clear from the table is that the percentage of sherds
with smoothed exterior surfaces decreases through time, from a range of 71 to
88 percent in assemblages older than 400 radiocarbon years BP, to less than
20 percent for the youngest assemblages. One clear outlier in this respect is
feature 1 from CA-INY-1434. However, this structure only had three associated
sherds, and this anomaly could easily be due to errors associated with sampling a
small number of sherds. As did average thickness and levels of mica, exterior
surface preparation suggests that the sherds from structure 7 at CA-INY-30 are
much younger than the age suggested by the 480 BP radiocarbon date since very
few are smooth on their exterior surface. Thus, exterior surfaces within the total
sherd assemblage suggests a change occurred in how potters were finishing their
pots. Whether this is due to stylistic or functional changes is not immediately clear,
but is considered in greater detail below.
14 / EERKENS

There is less patterning evident among those sherds that are brushed versus
those that are roughened on their exterior surfaces. Roughened surfaces appear to
be slightly more common during the middle part of the ceramic period (relative to
brushed sherds), but several early and later assemblages also have significant
numbers of rough exterior surfaces.
Similarly, patterning among interior surfaces is not clear-cut. Smoothing seems
to be slightly more common in the earlier assemblages, and roughening in the
middle part of the ceramic period. However, the pattern is weak as several
assemblages do not conform.
In sum, the analysis suggests division of the assemblages into three temporal
groups. The earliest assemblages (ceramic 1), those dating older than 400 BP,
are composed of rather thick sherds with much mica, are more often coiled
with evenly stacked coils, and are often smoothed on their exterior surfaces.
Organic temper is also somewhat higher in these assemblages. The second set of
assemblages (ceramic 2) date between 290 and 400 BP. Pots from this period are
still rather thick, though somewhat thinner than the previous period, contain less
mica, coils are still often evenly stacked, and only about 1/3 of the pots are
smoothed on their exterior surfaces. Structure 1 at CA-INY-3769, locus 13 seems
to be part of this group, but additional analysis of the body sherds will be necessary
to determine this. The final group of assemblages (ceramic 3) dates to the latest
prehistoric and protohistoric period, certainly after 210 BP, but perhaps slightly
earlier. Pots from this period are clearly the thinnest, have little mica present,
are rarely made with evenly stacked coils, and are rarely smooth on their exterior
or interior surfaces. Structure 7 from CA-INY-30 clearly belongs within this
final group of assemblages, indicating that the modern rather than the 480 BP
radiocarbon assay more accurately dates the pottery from this domestic context.
The presence of glass trade and other protohistoric shell beads supports this
position. Exactly when the shift occurs between the middle and late ceramic
periods is unclear, and could have happened anytime between 210 and 290 BP.
Note that I use the temporary terms ceramic 1, 2, and 3 to avoid confusion with
other tripartite divisions of prehistory, such as early, middle, and late.
Analysis of Rim Sherds
This section considers changes in pottery attributes that are not visible or
measurable on body sherds. In particular, analysis of rim sherds allows deter-
mination of attributes relating to pot size, the presence of decoration, and the
shape of the lip. Unfortunately the sample size of rim sherds is extremely small,
and only 26 rim sherds that represent unique pots are included in the analysis
below. Because of this small sample size, rim sherds were combined into three
temporal groups according to the outline defined in the previous section, namely,
early (dating older than 400 BP), middle (dating between 290 and 400 BP), and
late (dating after 210 BP).
A CASE STUDY FROM OWENS VALLEY / 15

First, it is worth reexamining average thickness. Analysis of whole pots shows
that thickness usually varies across a vessel, often from a minimum near the rim to
a maximum at the base (Eerkens, 2001). By only considering body sherds, as
above, we are taking samples from all across a pot, without controlling for
location. However, using only rim sherds we can achieve some degree of standard-
ization by controlling the location where we sample thickness. As indicated in
Table 4, decreasing thickness through time holds within the rim sherd assemblage
as well. Although a T-test comparing means is not significant between any of
the three temporal groups at the .05 level, this result is very consistent with the
analysis of body sherds. Also listed in Table 4 is the Coefficient of Variation
(standard deviation divided by mean; CV). The thickness CV values indicate that
early and late assemblages are quite variable, while middle assemblages are more
standardized. However, a comparison of these CV values using the D’AD statistic
(see Eerkens and Bettinger, 2001; Feltz and Miller, 1996) is not significant at the
.05 level for thickness.
Comparison of the average diameters of rim sherds from the three ceramic
periods indicates little difference through time. The youngest (ceramic 3) pots
seem to be slightly larger at their mouths (and presumably overall) than later
pots, however, a T-test shows the difference is not significant at the .05 level.
Variation within the youngest pots also seems to be greater than earlier assem-
blages. Statistical comparison of the late and middle period CV’s is again not
significant at the .05 level (though close with a p value of .08).
In fact, greater diversity seems to be one of the characteristics among ceramic 3
rim sherds. For example, greater diversity in rim form is indicated in Table 4
by the percentage of direct rims. Incurved rims were the only other form encoun-
tered (i.e., no recurved rims were within the rim sherd assemblage). While
25 percent of the ceramic 3 rims were incurved, only 8 percent of ceramic 2,
and none of ceramic 1 rims were similarly shaped. As well, there is greater
16 / EERKENS
Table 4. Attributes of Rim Sherds, Divided into Early, Middle,
and Late Marana Period
Ceramic
period
Thickness DiameterDirect
rims
Lip shapeLip
later.
Deco-
ratedNo. Avg. CV Avg CV Flat Round Point
3
2
1
8
14
4
4.9
5.8
6.6
0.29
0.23
0.31
266
248
244
0.37
0.26
0.21
75%
92%
100%
38%
15%
0%
38%
85%
75%
25%
0%
25%
0%
29%
50%
0%
14%
25%
Notes: No. = Total number of rim sherds per period; Avg. = Average; CV = Coefficient of
Variation; Lip later.= percentage of sherds with a lateralized lip (to either interior or exterior).

diversity in lip forms, where ceramic 3 lips seem to be evenly divided among
flat, rounded, and pointed forms, while ceramic 2 and ceramic 3 rims are pre-
dominantly rounded.
On the other hand, there is less diversity among ceramic 3 assemblages in
terms of lip lateralization and decoration. None of these rims are lateralized
(i.e., all are symmetrical with respect to the walls of the pot). Ceramic 1 and 2
pots are more often lateralized to the exterior (with only one ceramic 2 lip
showing exterior lateralization). Similarly, although only three of the rims
are decorated, all are found in either ceramic 2 or 1 period assemblages. Unfor-
tunately, a chi-square test comparing time period and decoration is far from
significant at the .05 level (p value = .56) due to the small sample size. Thus, it
is not possible to state with confidence that the rate of decoration decreases
through time.
A comparison of exterior and interior surface treatment by ceramic period is
presented in Table 5 for the rim sherd assemblage. Because rim sherds could be
oriented with respect to the vertical and horizontal dimensions (unlike body
sherds), it was possible to identify the specific direction and orientation of
brushing strokes. Four different brushing styles were recognized including
vertical, horizontal, diagonal, and random (or mixed) brush marks. It is clear
overall, that external styles of finishing are more diverse than interior ones. While
six different patterns were recognized for the former, only three were seen on
internal surfaces. However, no clear temporal patterns are evident for either
external or internal surfaces as brushing and finishing styles are similarly diverse
in all three ceramic periods.
In sum, the rim sherd analysis does not show any additional directional changes
through time. Pots are clearly thinner and slightly larger later in time, but these
differences are not significant given the small sample size currently available.
More clear are changes in the diversity of rim and lip styles and size. Ceramic 3
vessels seem to be more varied and diverse than those from earlier periods.
A CASE STUDY FROM OWENS VALLEY / 17
Table 5. Surface Treatment Attributes for Rim Sherds Divided
into Early, Middle, and Late Marana
Ceramic
period
External surface Internal surface
Rough Vertical Horiz. Diag. Random Smooth Rough Vertical Horiz.
3
2
1
0%
23%
25%
38%
23%
25%
38%
15%
25%
13%
23%
0%
0%
15%
0%
13%
0%
25%
0%
7%
0%
13%
0%
25%
88%
93%
75%
Note: Horiz. = horizontal brush strokes; diag. = diagonal brush strokes.
DISCUSSION
The results above suggest that the single-type hypothesis for Owens Valley
brownware is incorrect. There appear to be noticeable and measurable differences
in pottery assemblages through time in southern Owens Valley. This section
reviews the provisional ceramic chronology based on the evidence presented
above, examines the viability and discreteness of the apparent chronology using
the most recent radiocarbon calibration curve, and finally considers the behavioral
implications of the chronology.
Summarizing the Chronology
Based on the results of the analysis, there appear to be at least three separate and
distinct periods of pottery production in Southern Owens Valley. Manufacturing
techniques and styles are surely changing throughout the entire period of ceramic
production, including random drift and intentional modifications to improve
functionality or appearance. However, based on current evidence from radio-
carbon dated sites, sherd assemblages within these three temporal periods seem to
be more like one another than sherds in subsequent or ensuing periods.
The evidence suggests an early (perhaps initial) period composed of rather thick
pots, often over 6.5 mm, containing high levels of mica. These pots are often
intentionally smoothed on their exterior surfaces, often have their coils neatly
stacked on top of one another, and not infrequently include organic temper.
Overall, vessels seem to be fairly standardized in terms of size and shape. This
suggests the production of only a limited range of vessel forms and by deduction, a
more narrow range of uses for pots. Direct rims with rounded lips seem to be the
predominant shape, though the sample size of unique rim sherds is very small
(n = 4). I refer to this period with the temporary term “ceramic 1.”
The ensuing period saw a reduction in thickness of pots by about 0.5 mm, a
reduction in levels of mica, and a reduction in rates of exterior smoothing. The
method of stacking coils appears to be the same as in the previous period, with
coils stacked neatly on top of one another. As well, vessel size and shape are rather
standardized suggesting a narrow range of use for vessels within this period. This
has been termed “ceramic 2.”
The final period of manufacture again saw a reduction in the thickness of pots
by another 0.5–1.0 mm. Pots in this period have only small amounts of mica and
are only rarely smooth on their exterior surfaces. Brushing seems to have been the
preferred method of exterior surface finish. A slight increase in vessel size is
implied by larger mouth opening diameters within this period. As well, a change in
manufacturing style is suggested by the frequent presence of sherds with unevenly
stacked coils. Based on evidence among rim sherds, many of these pots were
constructed by overlapping coils on the exterior side of the pot. That is, clay
from the higher coil was pushed down on the exterior side of the pot to conjoin
with the lower coil and clay from the lower coil was brought up on the interior
18 / EERKENS

surface to meet the higher coil. At the same time, judging by CV values and rim
and lip forms, pots in this period seem to be more diverse in size and shape,
implying a greater range of uses for pots. This period is temporarily designated
“ceramic 3.”
Calibrating the Chronology
The chronology developed above is based entirely on radiocarbon dates.
However, it is important to examine how these radiocarbon dates translate into
real-world calendrical ones. Figure 4 plots the radiocarbon calibration curve
from the OX-Cal computer program version 3.5, showing how radiocarbon dates
translate into calendrical ones (based on tree-rings) for the period between cal AD
1200 and 1950 (see Ramsey, 1995). The figure also shows how the three ceramic
periods defined above calibrate. Unfortunately there are a number of bumps in the
curve, particularly after cal AD 1700, meaning that there is not a one-to-one
correlation between radiocarbon and calendrical dates. This creates problems
because it is statistically possible for a radiocarbon date to fall within the calen-
drical range for two, or even all three, ceramic periods if the associated ± error is
large enough. This section considers the statistical viability of the chronology
given the calibration issue. Where multiple radiocarbon dates exist for a feature
(except structure 7 at CA-INY-30 where the modern assay was used), they were
averaged according to the procedure given by Long and Rippeteau (1974).
Ceramic 1 assemblages date between 410 and 500 radiocarbon years BP, which
calibrates into a fairly narrow region on the curve, roughly between cal AD 1425
and 1475. Taking into account the two-sigma error range of the oldest (feature 1 at
CA-INY-1434 at 470 ± 80) and youngest (structure 5 at CA-INY-30 at 410 ± 80)
dates within this group of assemblages, the calibrated range spans cal AD 1300
to cal AD 1650.
Ceramic 2 assemblages date between 293 and 390 BP, which calibrates into a
range of roughly cal AD 1475 to 1640. Taking into account the two-sigma error
range of the oldest assemblage (structure 1 at CA-INY-30 with the two dates
averaging to 390 ± 50) and youngest assemblage (structure 1 at CA-INY-3769
with the three dates averaging to 293 ± 30), this covers a period of cal AD 1430 to
cal AD 1660. This clearly overlaps with almost the entire range of the ceramic 1
assemblages.
Ceramic 3 assemblages date between 0 BP and 205 BP. We know that earthen-
ware pots were abandoned shortly after contact with European settlers around
AD 1850. The youngest assemblage from this period is from structure 1 at
CA-INY-5207, where the two radiocarbon dates average to 205 ± 50 BP. The
two-sigma range of these dates is from cal AD 1520 to AD 1850. However, only
1.9 percent of this covers the period between cal AD 1520 and cal AD 1550, due
to a small dip in the curve between these dates. If we reject the small chance that
this part of the curve dates the assemblage, a range of cal AD 1630 to AD 1850
A CASE STUDY FROM OWENS VALLEY / 19

20
/E
ER
KE
NS
Figure 4. Radiocarbon curve for last 800 years showing calibration of early, middle, and late ceramic assemblages
from southern Owens Valley.

obtains for the latest ceramic assemblages. The latter range is almost discrete
from either ceramic 1 or 2 assemblages and overlaps only for a very small region
between cal AD 1630 and cal AD 1660.
Based on this information, it is difficult to statistically support the division
between the earliest and middle ceramic periods. Although there may be real
differences among the ceramics produced between approximately cal AD 1425-
1475 and cal AD 1475-1640 (corresponding to the calibrated ceramic 1 and 2
periods respectively), it is hard to argue for this convincingly based on the
radiocarbon evidence alone. Given the associated errors with the dates and the
bumps and dips in the calibration curve, it is possible that all these assemblages
date to the same calendrical period. Unfortunately, it will not be possible to prove
or disprove the viability of this part of the chronology through additional excava-
tion of features with ceramics that are radiocarbon dated. Such dates are likely to
fall within the range of both ceramic 1 and 2 periods. Ceramic assemblages that
are dated by alternative means, such as dendrochronology or sites with multiple
and separate pottery-bearing strata, will be necessary to prove the distinctiveness
of ceramics across the AD 1400 to 1600 boundary. For the moment the chrono-
logical discreteness of the earliest and middle period must remain an hypothesis.
There does appear to be a clear and statistically recognizable temporal differ-
ence between ceramics from the early/middle and the late Marana period. The
dates associated with ceramics from assemblages dating to these periods respec-
tively only overlap for a very small range of time. Thus, it should be possible to test
this part of the chronology through the analysis and radiocarbon dating of addi-
tional pottery-bearing features in southern Owens Valley.
Implications of the Chronology for
Prehistoric Behavior
Changes in the shape, size, and composition of pots also imply changes for
the role of pots within prehistoric lifeways in southern Owens Valley. I explore
these changes here.
First, there is a clear trend towards decreasing thickness from early/middle
Marana ceramics to late ones. If this reduction is a result of a change in the
function of pots, two explanations seem likely. Thinner pots could represent a
desire to lighten the weight of pots by decreasing mass. However, if a reduction in
heaviness were the goal we might expect to see more use of organic temper
through time as well, since organically tempered pots can be up to 40 percent
lighter in weight (Skibo et al., 1989).
A more likely explanation that is consistent with the other changes seen (and
discussed below) is a desire to increase the heating efficiency of pots. Thinner pots
transfer heat from an external source to the contents of the pot quicker, reducing
the amount of fuel required to cook foods (Braun, 1983). Of course, thinner pots
also have decreased tensile strength and resistance to impact stress. It is possible
A CASE STUDY FROM OWENS VALLEY / 21

that the decrease in mica observed through time represents an effort to increase
strength by changing the source of clay from a sedimentary one, such as Owens
Lake or Owens River that has high mica content, to one closer to a parent source or
perhaps a residual in-situ source of decomposing bedrock. Experimental work
with local clays suggests that when fired to 700ºC most residual sources of clay
are stronger than sedimentary sources, though some sedimentary sources are
also quite strong (Eerkens, 2001:129). Thus, a reduction in mica may represent
the use of alternative sources of clay, the byproduct of a desire to increase strength.
Research with thin sections is currently under way to examine the mineralogy
of southern Owens Valley pottery. Comparison of the angularity and composition
of mineral temper should help to determine the source of clays and tempers used
to construct pots in the different time periods.
A desire to increase heating efficiency would also explain why we see a
decrease in the rate of surface smoothing between early-middle and late Marana
period assemblages. Increasing the surface area that is exposed to an external heat
source will increase absorption of heat (Juhl, 1995; Lischka, 1978:227). Smooth
pots have the lowest surface area possible. However, creating grooves by brushing
or intentionally roughening the exterior of a pot is one way to increase the surface
area, and hence, the heating efficiency of a pot. An increase in the percentage
of brushed or roughened pots, then, is consistent with an increase in heating
efficiency (as is thinner pots). It is possible that a change in the style of coiling was
also a response to a need for increasing the strength of thinner pots. How coils
are attached and melded would certainly affect how resistant a pot is to impact
stress, and it is possible that stacking coils in an uneven fashion would increase
the resistance to certain types and directions of forces. However, experimental
work testing the strength of different coiling styles in fired pots will be necessary
to test this hypothesis. Currently, the reasons why coiling style seems to have
changed is unclear.
It is fairly clear that a change in the size or density of temper was not a solution
used to increase heating efficiency and/or increase the strength of pots in this
region. Despite the fact that these attributes do affect the heating properties and
tensile strength of a pot (see Bronitsky and Hamer, 1986; Skibo et al., 1989), the
size and density of mineral temper within southern Owens Valley pots does
not seem to change appreciably through time. Similarly, it does not appear that
Paiute changed their firing techniques, or if so, these changes are not visible in
the cores of sherds. For example they did not increase the amount of oxygen
present during firing to achieve higher temperatures, which would increase the
strength of the pot, since there are no apparent changes in the state of sherd cores,
whether oxidized or reduced, through time.
Exactly why there was a desire to increase heating efficiency is unclear.
However, a likely influence would have been a reduction in the availability of
nearby firewood due to increasing sedentism. The archaeological record of the
region suggests that populations in Owens Valley were continually reducing their
22 / EERKENS

mobility through time (Basgall, 1989; Bettinger, 1989, 1999). An increase in
sedentism would likely have resulted in decreased availability of sources of fuel as
they were used in the vicinity of more permanent settlements. A response to this
may have been to increase the heating efficiency of ceramic pots such that they
consumed less fuel to cook the same amount of food. Thinning and roughening
pots would have been one option, though these responses would have decreased
the strength of pots to impact stress. Changes in other attributes such as clay source
and construction technique, then, may represent an attempt to compensate for
decreased strength.
As pots became thinner through time, they also seem to be increasing in size.
This suggests that late prehistoric and protohistoric Paiute were increasing the
amount of food cooked per meal, perhaps in response to increasing family size or a
desire to increase the economy of scale of food production. Increasing the size of
pots while decreasing the thickness would have heightened the need to increase
resistance to impact stress. This factor may have precipitated some of the changes
discussed above such as a change in the source of clays and coiling style.
An increase in the diversity and variability of pots over time is also interesting.
This could mean that the range of uses for pots was increasing, requiring more
diversity in the shapes and sizes of pots. Alternatively, a greater number of potters
could be responsible for the ceramic 3 assemblages, with each potter contributing
some of her (assuming women were responsible) unique skills, learning environ-
ment, and personality to the suite of pots made. Either of these possibilities, or
both, could explain this situation. It is hoped that future work with organic
residues, use wear, and mineralogy will address this question.
CONCLUSIONS
Several points are worth mentioning in conclusion. First, given the small
sample of sherds available for study in southern Owens Valley, the results
presented here should be considered tentative. Additional well-dated assem-
blages are needed to verify and support or refute the chronology developed.
Unfortunately, because the number of sherds recovered in most sites in association
with stratigraphically discrete features is small it is unlikely the sample available
for study will increase significantly in the near future. However, it is hoped
that others will attempt to test the chronology presented here through the analysis
of pottery-bearing features that are dated.
Second, it is clearly not possible to pick up a single sherd and assign it a
chronological date based on the data presented above. Examination of the data
shows that some sherds associated with early features are thin, have little mica, are
brushed on their exterior, or have unevenly stacked coils. Similarly, some late
sherds are thick, have ample mica, are smooth, or have evenly stacked coils.
Although it is possible these sherds are intrusive from later or earlier time periods,
the variability within Owens Valley brownware, even within a single pot, implies
A CASE STUDY FROM OWENS VALLEY / 23

that some individual sherds will not conform to the chronology. This may be
particularly relevant for ceramic 3 assemblages which seem to be quite diverse in
terms of the shapes and sizes of pots present. A small subsample of sherds from
this time period may appear more like earlier periods due to random chance (i.e.,
sampling error). Instead, whole assemblages of sherds should be analyzed together
where possible and, if the chronology is valid, the average values should conform
to the guidelines presented for different ceramic periods.
Third, the usefulness of any typology relates to the ability of others to repeat it.
Some of the attributes I use, such as thickness and diameter, are relatively easy to
quantify and measure (though even here there is room for variation depending on
where thickness is taken on a particular sherd or who is measuring curvature, in the
case of diameter). However, others are less quantifiable and more subjective. For
example, the amount of mica or organic temper present within a sherd, which I
recorded on a scale from 0 to 3, is impossible to quantify in the abstract without a
reference collection. As well, it may be difficult to quantify what constitutes a
rough versus a smooth surface, after all what appears smooth to the naked eye is
often quite rough under a high-powered microscope. That is, smooth and rough are
relative notions and can be interpreted differently by different archaeologists.
Work that is currently under way with thin sections from the region should help
to resolve some of these shortcomings and refine the chronology presented here. In
particular, this work should help to quantify some of these attributes, particularly
the amount of mica present, and the size and density of mineral temper. As well,
this work will help to identify and quantify the percentage of particular mineral
types, such as quartz, feldspar, magnetite, and so on.
Moreover, it is unclear how applicable this chronology is to other areas of the
western Great Basin. Thus, it is possible that pottery in northern Owens Valley
does not follow the same developmental trajectory. Verifying the validity of the
chronology presented above in other regions will simply require empirical data
from well-dated contexts.
Fourth, and most importantly, pottery from the region does not fit the single-
type hypothesis for Owens Valley brownware. Earlier research (Eerkens, 2001;
Eerkens et al., 2002a, 2002b) questioned the validity of this hypothesis with
regards to space. Pots appear to be made and used differently in different regions.
The analysis presented above questions this hypothesis with regards to time. Pots
appear to have been made differently through time in this one region, and should
not be lumped into a single all-inclusive category. Doing so glosses over important
variability related to changes in how pots were used through time.
Finally, what of the pottery from structure 13 at CA-INY-30, the assemblage
that was supposed to contain the oldest dated sherds from southern Owens Valley?
With an average thickness of 5.7 mm on 50 sherds (including six rims and an
MNV of 4), an average mica score of 2.1, 38 percent having smoothed exteriors,
and 67 percent having evenly stacked coils, the assemblage fits squarely within the
range of other ceramic 1 and 2 ceramics and is distinctly different than ceramic 3
24 / EERKENS

assemblages. In fact, the assemblage fits very well within other ceramic 2
assemblages, a finding supported by the 310 BP ± 50 thermoluminescence date
on one of these sherds reported by Rhode (1994). This supports the position
suggested above that the 710 BP radiocarbon date does not date the pottery
assemblage.
ACKNOWLEDGMENTS
I would like to thank Lisa Deitz and Robert Bettinger for granting access to
collections housed at UC Davis and Matt Hall for granting access to collections
at UC Riverside. Finally, thanks to Jeffrey Rosenthal and Jay King for reading
and commenting on an earlier draft, and Roger Moeller for expediting the publi-
cation process.
REFERENCES
BASGALL, M. E.
1989 Obsidian Acquisition and Use in Prehistoric Central Eastern California:
A Preliminary Assessment, in Current Directions in California Obsidian
Studies, R. E. Hughes (ed.), pp. 111-126, Contributions of the University of
California Archaeological Research Facility 48, Berkeley.
BASGALL, M. E. and K. R. MCGUIRE
1988 The Archaeology of CA-Iny-30: Prehistoric Culture Change in the Southern
Owens Valley, California, report submitted to California Department of
Transportation, Sacramento.
BETTINGER, R. L.
1986 Intersite Comparison of Great Basin Brown Ware Assemblages, in Pottery of
the Great Basin and Adjacent Areas, S. Griset (ed.), pp. 97-106, University
of Utah Anthropological Papers 111, Salt Lake City, Utah.
1989 The Archaeology of Pinyon House, Two Eagles, and Crater Midden: Three
Residential Sites in Owens Valley, Inyo County, California, Anthropological
Papers of the American Museum of Natural History, No. 67.
1999 From Traveler to Processor: Regional Trajectories of Hunter-Gatherer
Sedentism in the Inyo-Mono Region, California, in Fifty Years since Viru:
Theoretical Advances and Contributions of Settlement Pattern Studies in the
Americas, B. R. Billman and G. M. Feinman (eds.), pp. 39-55, Smithsonian
Institution Press, Washington, D.C.
BETTINGER, R. L. and R. E. TAYLOR
1974 Suggested Revisions in Archaeological Sequences of the Great Basin
in Interior Southern California, Nevada Archaeological Survey Research
Papers, 5, pp. 1-26.
BRAUN, D. P.
1983 Pots as Tools, in Archaeological Hammers and Theories, A. Keene and
J. Moore (eds.), pp. 107-134, Academic Press, New York.
A CASE STUDY FROM OWENS VALLEY / 25

BRONITSKY, G. and R. HAMER
1986 Experiments in Ceramic Technology: The Effects of Various Tempering
Materials on Impact and Thermal-Shock Resistance, American Antiquity
51, pp. 89-101.
DELACORTE, M. G.
1999 The Changing Role of Riverine Environments in the Prehistory of the
Central-Western Great Basin: Data Recovery Excavations at Six Prehistoric
Sites in Owens Valley, California, report submitted by Far Western Anthropo-
logical Research Group to Caltrans District 9, Bishop, California.
EERKENS, J. W.
1997 Preliminary Report on Survey and Test Excavations on the Western and
Southern Fringes of Owens Lake, on file with Bureau of Land Management,
Bishop, California.
2001 The Origins of Pottery Among Late Prehistoric Hunter-Gatherers in
California and the Western Great Basin, Ph.D. dissertation, Department of
Anthropology, University of California, Santa Barbara.
EERKENS, J. W. and R. L. BETTINGER
2001 Techniques for Assessing Standardization in Artifact Assemblages: Can We
Scale Material Variability, American Antiquity, 66:3, pp. 493-504.
EERKENS, J. W., H. NEFF, and M. D. GLASCOCK
1999 Early Pottery from Sun’Gava and Implications for the Development of
Ceramics in Owens Valley, Journal of California and Great Basin
Anthropology, 21:2, pp. 275-285.
2002a Ceramic Production among Small-Scale and Mobile Hunters and Gatherers:
A Case Study from the Southwestern Great Basin, Journal of Anthropological
Archaeology, 21:2, pp. 200-229.
2002b Typologies and Classification of Great Basin Pottery: A New Look at
Death Valley Brownwares, in Ceramic Production and Circulation in
the Greater Southwest: Source Determination by INAA and Comple-
mentary Mineralogical Investigtations, D. M. Glowacki and H. Neff
(eds.), pp. 140-151, Cotsen Institute of Archaeology, Monograph 44, Los
Angeles.
FELTZ, C. J. and G. E. MILLER
1996 An Asymptotic Test for the Equality of Coefficients of Variation from K
Populations, Statistics in Medicine, 15, pp. 647-658.
GILREATH, A. J.
1995 Archaeological Evaluations of Thirteen Sites for the Ash Creek Project, Inyo
County, California, report submitted to the California Department of Trans-
portation, Sacramento.
GRISET, S.
1988 Ceramics, in The Archaeology of CA-Iny-30: Prehistoric Culture Change
in the Southern Owens Valley, California, M. E. Basgall and K. R. McGuire
(eds.), pp. 250-278, report submitted to California Department of Trans-
portation, Bishop, California.
JUHL, K.
1995 The Relation Between Vessel Form and Vessel Function: A Methodological
Study, Arkeologisk Museum i Stavanger, Norway.
26 / EERKENS

LISCHKA, J. J.
1978 A Functional Analysis of Middle Classic Ceramics at Kaminaljuyu, in The
Ceramics of Kaminaljuyu, R. K. Wetherington (ed.), pp. 223-278, Pennsyl-
vania State University Press, University Park.
LONG, A. and B. RIPPETEAU
1974 Testing Contemporaneity and Averaging Radiocarbon Dates, American
Antiquity, 39, pp. 205-215.
PIPPIN, L. C.
1986 Intermountain Brown Wares: An Assessment, in Pottery of the Great Basin
and Adjacent Areas, S. Griset (ed.), pp. 9-21, Anthropological Papers,
No. 111, University of Utah, Salt Lake City.
RAMSEY, B.
1995 Radiocarbon Calibration and Analysis of Stratigraphy: The OxCal Program,
Radiocarbon 37:2, pp. 425-430.
RHODE, D.
1994 Direct Dating of Brown Ware Using Thermoluminescence and Its Relation
to the Numic Spread, in Across the West, D. B. Madsen and D. Rhode (eds.),
pp. 124-130, University of Utah, Salt Lake City.
SHEPARD, A. O.
1968 Ceramics for the Archaeologist (Sixth Printing), Carnegie Institution of
Washington Publication 609, Washington, D.C.
SKIBO, J. M., M. B. SCHIFFER, and K. C. REID
1989 Organic-Tempered Pottery: An Experimental Study, American Antiquity,
54, pp. 122-143.
STEWARD, J. H.
1933 Ethnography of the Owens Valley Paiute, University of California Publica-
tions in American Archaeology and Ethnography, 33, pp. 233-350.
Direct reprint requests to:
Jelmer W. Eerkens
Department of Anthropology
One Shields Avenue
University of California, Davis
Davis, CA 95616-8522
e-mail: [email protected]
A CASE STUDY FROM OWENS VALLEY / 27